Average Daily Session Range PRO [Capitalize Labs]Average Daily Session Range PRO
The Average Daily Session Range PRO (ADSR PRO) is a professional-grade analytical tool designed to quantify and visualize the probabilistic range behavior of intraday sessions.
It calculates directional range statistics using historical session data to show how far price typically moves up or down from the session open.
This helps traders understand session volatility profiles, range asymmetry, and probabilistic extensions relative to prior performance.
Key Features
Asymmetric Range Modeling: Separately tracks average upside and downside excursions from each session open, revealing directional bias and volatility imbalance.
Probability Engine Modes: Choose between Rolling Window (fixed-length lookback) and Exponential Decay (weighted historical memory) to control how recent or historic data influences probabilities.
Session-Aware Statistics: Calculates values independently for each defined session, allowing region-specific insights (e.g., Tokyo, London, New York).
Dynamic Range Table: Displays key metrics such as average up/down ticks, expected range extensions, and percentage probabilities.
Adaptive Display: Works across timeframes and instruments, automatically aligning with user-defined session start and end times.
Visual Clarity: Includes clean range markers and labels optimized for both backtesting and live-chart analysis.
Intended Use
ADSR PRO is a statistical reference indicator.
It does not generate buy/sell signals or predictive forecasts.
Its purpose is to help users observe historical session behavior and volatility tendencies to support their own discretionary analysis.
Credits
Developed by Capitalize Labs, specialists in quantitative and discretionary market research tools.
Risk Warning
This material is educational research only and does not constitute financial advice, investment recommendation, or a solicitation to buy or sell any instrument.
Foreign exchange and CFDs are complex, leveraged products that carry a high risk of rapid losses; leverage amplifies both gains and losses, and you should not trade with funds you cannot afford to lose.
Market conditions can change without notice, and news or illiquidity may cause gaps and slippage; stop-loss orders are not guaranteed.
The analysis presented does not take into account your objectives, financial situation, or risk tolerance.
Before acting, assess suitability in light of your circumstances and consider seeking advice from a licensed professional.
Past performance and back-tested or hypothetical scenarios are not reliable indicators of future results, and no outcome or level mentioned here is assured.
You are solely responsible for all trading decisions, including position sizing and risk management.
No external links, promotions, or contact details are provided, in line with TradingView House Rules.
Cerca negli script per "daily"


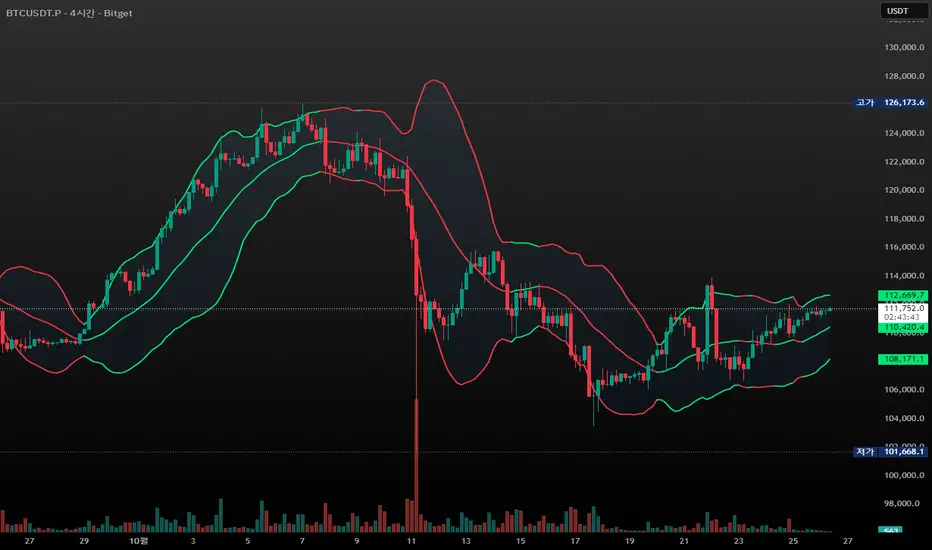
CandleFlow — Adaptive-Colored Bollinger BandsEN — What it is
Classic Bollinger Bands with adaptive color. Bands turn green when the basis slope is rising and red when it is falling. Same BB math; only visuals adapt. Two-state only.
Features
• Works on any timeframe; built with daily crypto in mind
• Inputs: Length 20, Multiplier 2.0, MA Type (SMA/EMA/WMA), Slope Length, Up/Down thresholds, Band fill
• Alerts: Trend state turns Up / turns Down
Notes
• Invite-only access. Source code not provided.
• No profit guarantee; this is not financial advice.
KR — 요약
표준 볼린저 계산은 그대로, 기준선이 상승하면 초록/하락하면 빨강으로 자동 색상 전환. 일봉 크립토에 최적화. 입력값(기간 20, 배수 2.0, MA 타입, 기울기 길이, 상/하 임계값, 밴드 채우기), 알림(상승/하락 전환) 제공. 초대전용, 코드 비공개. 수익 보장 없음.
Trademark
Bollinger Bands® is a registered trademark of John Bollinger. Not affiliated or endorsed.
Key LevelsKey Levels Indicator
Description
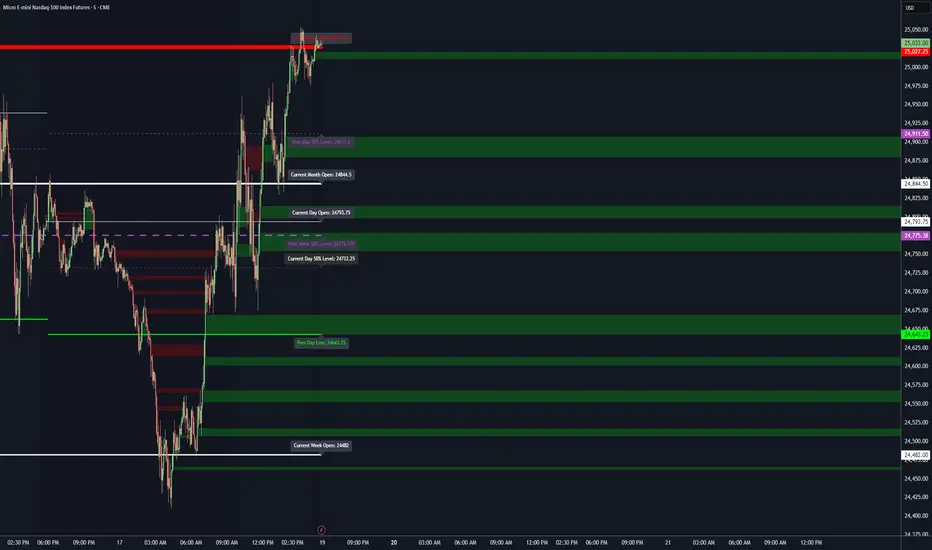
The Key Levels indicator is a powerful tool for traders, displaying major institutional price levels from daily, weekly, and monthly timeframes on your chart. It plots horizontal lines for previous period highs, lows, and midpoints (50% levels), as well as current period opens, helping you identify critical support and resistance zones used by institutional traders. Labels are provided for the most recent levels, positioned at the rightmost bar for easy reference.
Features
Daily Levels: Plots Previous Day High, Previous Day Low, Day Open, and Previous Day 50% Level.
Weekly Levels: Plots Previous Week High, Previous Week Low, Week Open, and Previous Week 50% Level.
Monthly Levels: Plots Previous Month High, Previous Month Low, Month Open, and Previous Month 50% Level.
Customizable Colors: Adjust the color of each line via the settings panel to suit your chart preferences.
Customizable Labels: Enable/disable labels, adjust label size, and change the label background color for optimal visibility.
Clean Visualization: Lines are plotted with breaks at the start of each period, ensuring a clear and uncluttered display.
Settings
Show Labels: Toggle to show or hide all labels (default: enabled).
Label Size: Choose from "tiny," "small," "normal," "large," or "huge" to adjust label text size (default: normal).
Label Background Color: Customize the background color of labels to ensure text visibility (default: black).
Line Colors: Individual color pickers for each level (e.g., Previous Day High, Day Open), allowing full customization of line colors.
Usage
The Key Levels indicator is designed for futures markets, such as S&P 500 futures (ES), Nasdaq futures (NQ), or crude oil futures (CL), where institutional price levels like daily, weekly, and monthly highs, lows, and opens are critical for identifying key support and resistance zones. Apply the indicator to a 1-hour or 15-minute timeframe to capture precise market structure for day trading or swing trading strategies in futures. While optimized for futures, the indicator can be applied to any chart for versatile trading applications. Customize line colors and label settings in the panel to match your chart preferences.
Notes
Labels are shown only for the current day, week, and month to focus on recent price action.
For best visibility, adjust the label background color if text blends into your chart background.
Ideal for traders analyzing major institutional levels for market structure and trading decisions.
Protected script
This script is published as closed-source. However, you can use it freely and without any limitations – learn more here.
njammu123
Disclaimer
The information and publications are not meant to be, and do not constitute, financial, investment, trading, or other types of advice or recommendations supplied or endorsed by T
Nq/ES daily CME risk intervalReverse engineering the risk interval for CME (Chicago Mercantile Exchange) products based on margin requirements involves understanding the relationship between margin requirements, volatility, and the risk interval (price movement assumed for margin calculation)
The CME uses a methodology called SPAN (Standard Portfolio Analysis of Risk) to calculate margins. At a high level, the initial margin is derived from:
Initial Margin = Risk Interval × Contract Size × Volatility Adjustment Factor
Where:
Risk Interval: The price movement range used in the margin calculation.
Contract Size: The unit size of the futures contract.
Volatility Adjustment Factor: A measure of how much price fluctuation is expected, often tied to historical volatility.
To calculate an approximate of the daily CME risk interval, we need:
Initial Margin Requirement: Available on the CME Group website or broker platforms.
Contract Size: The size of one futures contract (e.g., for the S&P 500 E-mini, it is $50 × index points).
Volatility Adjustment Factor: This is derived from historical volatility or CME's implied volatility estimates.
As we do not have access to CME calculations , the volatility adjustment factor can be estimated using historical volatility: We calculate the standard deviation of daily returns over a specific period (e.g., 20 or 30 or 60 days).
Key Considerations
The exact formulas and parameters used by CME for CME's implied volatility estimates are proprietary, so this calculation based on standard deviation of daily returns is an approximation.
How to use:
Input the maintenance margin obtained from the CME website.
Adjust volatility period calculation.
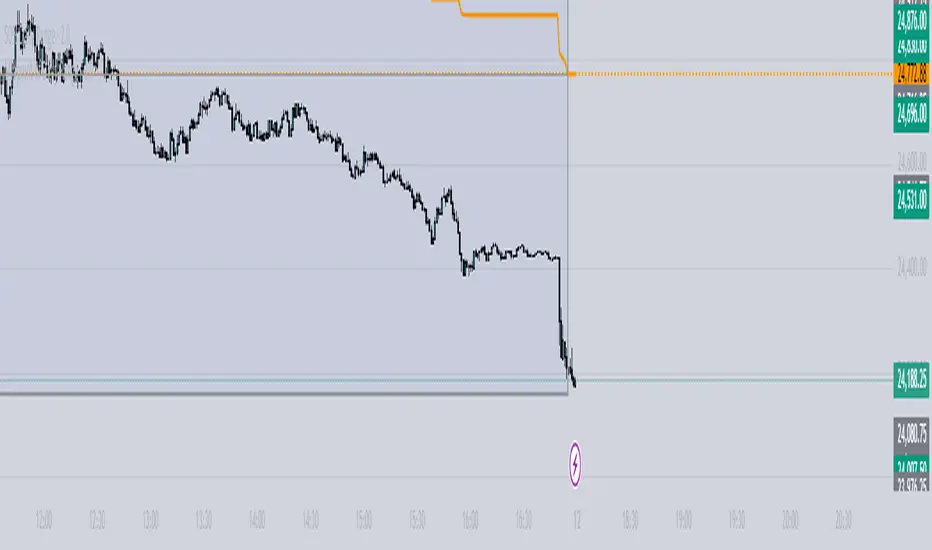
The indicator displays the range high and low for the trading day.
1.Lines can be used as targets intraday
2.Market tends to snap back in between the lines and close the day in the range

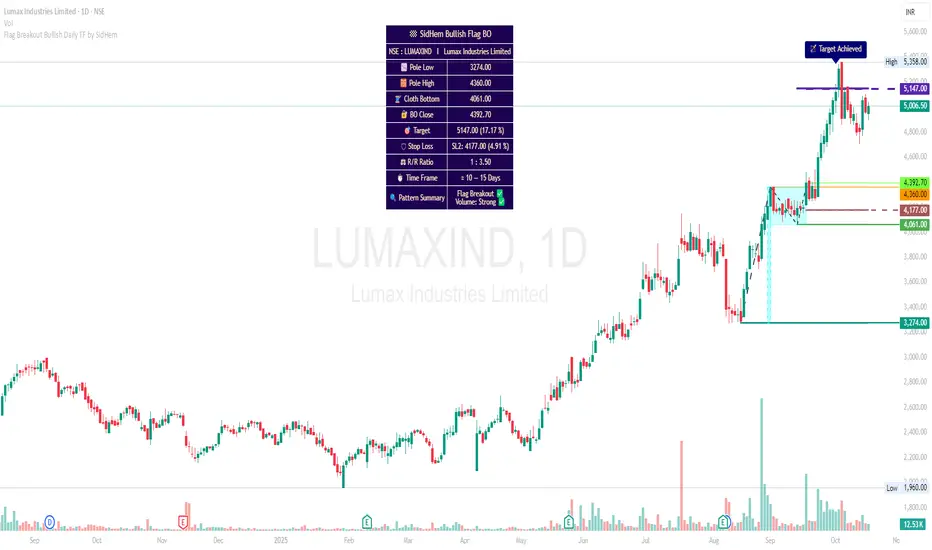
Flag Breakout Bullish Daily TF by SidHemFlag Breakout Bullish Daily TF by SidHem
Overview:
This indicator helps analyze Bullish Flag Breakouts (Rectangle) on the Daily Time Frame, providing a clear visual and tabular summary of key levels, stop-loss zones, expected pattern target and metrics. Traders can quickly assess breakout validity, risk/reward, and target achievement without manual calculations.
Please Note:
Flags are not auto-detected. Traders input four key dates: Pole start, Pole high, Cloth bottom, and Breakout candle. The indicator then calculates and plots all essential levels—including Pole, Cloth, Breakout Open/Close/Mean, Stop Loss, and Expected Pattern Target prices. This allows users who understand flag patterns but are unsure how to calculate targets or SL to efficiently work with the pattern.
Features:
Visualization: Highlights Pole, Cloth, and Breakout candles with horizontal rays, optional diagonal Pole lines, V-Arms, and filled boxes for clarity.
Dynamic Table Summary:
Displays symbol, Pole Low/High, Cloth Bottom, Breakout Open/Close/Mean, Expected Pattern Target, Stop Loss (3 methods, preferably on closing basis), Pole Height, Risk/Reward Ratio, Bars to Breakout, Estimated Time Frame, Pattern Summary, Flag Breakout status, and Volume strength.
Target & SL Labels: Plots target and SL lines on the chart with Expected Pattern Target, Target Achieved, and SL labels.
Customizable Appearance: Adjustable table rows, label sizes, colors, styles, widths, and transparency.
Purpose:
Accurately analyzes Bullish Flag Breakouts by entering only the four required dates; all plotting, calculation, and table generation are automated.
1D Overlay (triss)Overlay of the Daily candle, simple one color with a line inside the candle to show direction.

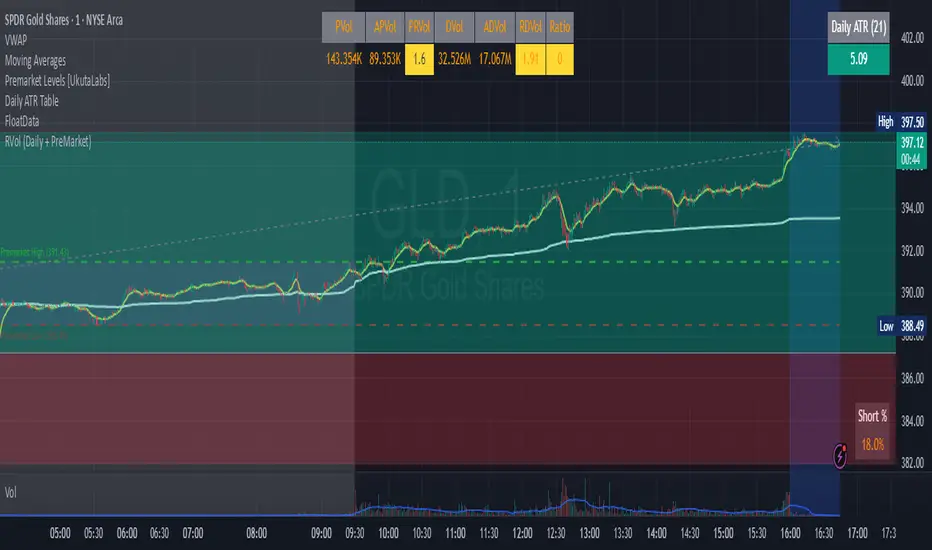
RVol (Daily and PreMarket)RVol with distinction between Pre-Market and Active Trading
Also ration of pre-market to Ave Daily Vol
漲跌偏見 (Only Daily)Indicator purpose (simple):
Draws previous day’s High/Low on the chart (daily only).
Checks yesterday’s candle outcome (up or down) relative to the prior day’s High/Low.
If yesterday’s move extended (e.g., close above prior High or below prior Low), it keeps that bias for today.
If yesterday’s move was invalidated (e.g., close reclaimed back inside), it flips the bias for today.
Plots today’s target:
Bull bias → yesterday’s High
Bear bias → yesterday’s Low
Shows only one line/label for the current day.
Not color-dependent (uses close vs. open to detect up/down).

50% Daily RangeIndicator plots the midpoint of the current Daily price range. This midpoint is very helpful since it acts as a point of interest where buyers or sellers might step in.
The midpoint line is dynamic and updates as price moves, in order to always have an accurate plot of the average price for the current day.
ADR - Average Daily Range [KasTrades]This is an Average Daily Range (ADR) indicator.
There are two settings for ADR:
Two Look back period ADR range (e.g. 7 and 14 days)
One Look back period ADR (e.g. 5 days only)
Two day ADR ranges are typically used in equities and index futures whereas one day ADR is typically used in forex.
The opening time by default is 17:00 New York (Eastern) time. The ranges are always calculated from the opening price of the first bar on the respected timeframe.

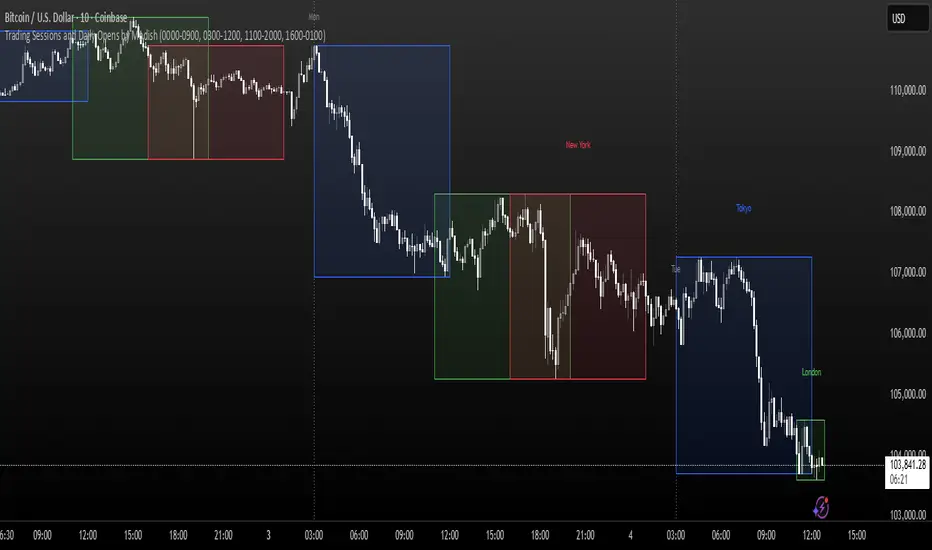
Trading Sessions and Daily Opens by ModishThis Pine Script indicator overlays key forex trading sessions (Sydney, Tokyo, London, New York) on your chart using Kenyan time (EAT/UTC+3), with customizable translucent boxes, borders, and labels positioned neatly above each session for clear visualization. It also plots dotted vertical lines at daily opens (Monday-Friday) with abbreviated day labels for quick reference. Toggle sessions on/off, adjust colors, and ensure seamless integration with candlesticks for dynamic, real-time analysis. Ideal for session-based traders seeking precise timing and structure.
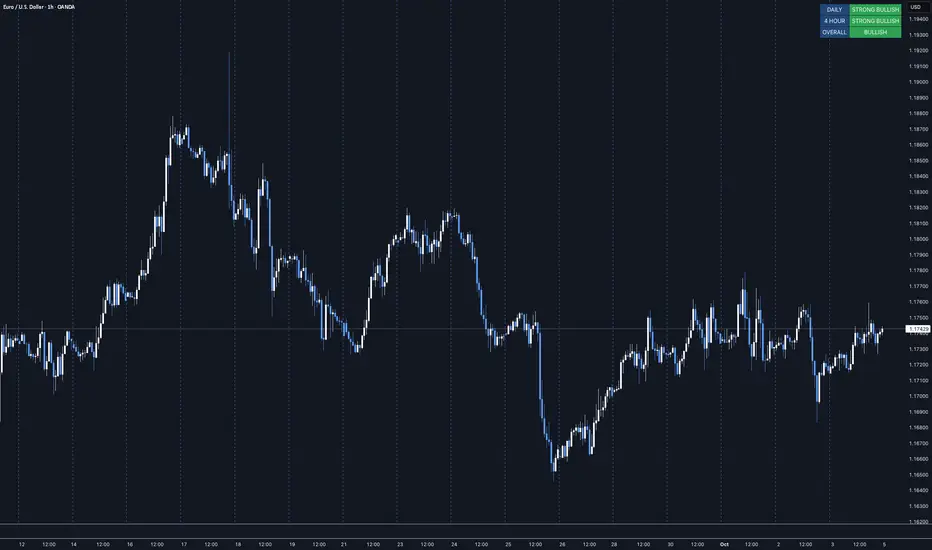
MTF Trend Dashboard LITE (Daily & 4H)Overview
The MTF Trend Dashboard LITE by G.C provides instant directional clarity between the Daily and 4-Hour timeframes using refined EMA (9 / 21) logic.
It’s built for traders who want simple, accurate trend confirmation without switching between multiple charts.
Why It Matters
One of the biggest causes of trading errors is timeframe conflict — seeing a bullish setup on one chart and a bearish signal on another.
This tool solves that problem by showing both the Daily and 4H structure side-by-side, using objective EMA-based logic.
When both agree, bias is strong. When they conflict, it’s a signal to wait.
Core Features
• Two-timeframe dashboard ( Daily + 4H )
• Non-repainting EMA (9 / 21) logic
• Color-coded states ( Bullish / Bearish / Neutral )
• Lightweight and easy to read
• Adjustable panel position: Top Right / Top Left / Bottom Right / Bottom Left
How to Use
Add the indicator to any chart.
Wait for both timeframes to align before entering trades.
Mixed signals often indicate sideways or transitional markets.
Combine with your existing trading strategy for confirmation.
Trend Condition Glossary
▲ STRONG BULLISH – EMA(9) well above EMA(21) and both sloping upward. Strong upward momentum with price above both EMAs.
BULLISH – EMA(9) above EMA(21) but weaker slope or price confirmation. Moderate uptrend or early recovery.
NEUTRAL – EMAs crossing or flat. Market lacks structure — consolidation or indecision.
▼ BEARISH – EMA(9) below EMA(21) with limited slope. Mild correction or early reversal.
▼ STRONG BEARISH – EMA(9) below EMA(21), both sloping down, price below both. Strong downtrend, clear seller control.
Who It’s For
Traders who want a clean, no-noise confirmation tool to simplify directional bias decisions in swing and intraday setups.
Disclaimer
This indicator is for analytical and educational purposes only. Always trade with discipline, patience, and sound risk management.
Behdad v2 Daily Weekly Monthly HLC & SessionsThis indicator plots the highest and lowest as well as the closing price of the market for daily, weekly and monthly periods. It is also a great help for trading by identifying the range of sessions and fractals.
VWAP Daily/Weekly/Monthly - Automatic AnchoredExplanation:
This script plots Volume-Weighted Average Price (VWAP) lines that are automatically anchored to the beginning of key timeframes — daily, weekly, and monthly. VWAP is a widely used trading indicator that shows the average price of an asset weighted by trading volume, making it useful for identifying fair value and institutional trading levels.
The “automatic anchored” feature means that you don’t have to manually select starting points. Instead, the script automatically resets the VWAP at the start of each day, week, or month, depending on the chosen setting. This ensures the VWAP always reflects the true average price for that period, providing traders with a consistent reference for support, resistance, and trend direction across multiple timeframes.
Notice:
On the chart, you may notice visible “jumps” in the VWAP lines. These are intentional. Each jump marks the reset point at the start of a new day, week, or month, depending on the selected setting. This design keeps the VWAP history from the previous period intact, allowing you to clearly see how price interacted with VWAP in past sessions.
By keeping these historical resets, you can easily compare short-term (daily) VWAP behavior against longer-term levels like weekly and monthly VWAP. This provides valuable context, helping you spot when price respects or diverges from fair value across different timeframes.
In short:
Daily VWAP resets at the start of each trading day.
Weekly VWAP resets at the beginning of each trading week.
Monthly VWAP resets at the start of each month.
This makes it easy to analyze how price interacts with VWAP levels across different time horizons without manual adjustments.

BAB VWAP V2 Daily, Weekly & Monthly (Optimized)Overview
BAB VWAP V2 displays 3 automatically anchored VWAPs (Daily, Weekly, Monthly) plus 2 customizable intraday VWAPs (anchored at user-defined HH:MM). Optional ±σ bands (volume-weighted) for D/W/M. Includes dynamic labels and an optional summary table.
Main Features
Daily/Weekly/Monthly VWAPs with automatic reset per period.
2 Intraday anchored VWAPs (default 09:00 & 15:30, configurable).
Volume-weighted standard deviation bands (σ) for D/W/M with optional fill.
Alerts on VWAP D/W/M crossovers.
Labels dynamically updated (no stacking) + optional table (2×4) with key values.
Parameters
Display: toggle D/W/M VWAPs, labels, table.
Colors & Style: line colors, thickness, style.
Bands (σ): enable per period, set multiplier, toggle fill.
Intraday (Anchored): enable VWAP 1 & 2, choose hour/minute, set colors & thickness.
How to Use
Add the indicator to a clean chart.
Enable desired VWAPs (D/W/M and/or intraday).
Optionally enable σ bands to contextualize price deviation from VWAP.
Configure intraday VWAP anchors to match your market session (e.g., RTH, EU open, etc.).
Alerts
Price crossing over/under Daily, Weekly, Monthly VWAPs.
Configure alerts from the Alerts panel.
Best Practices
Publish chart screenshots without other indicators for clarity.
Adjust intraday anchor times according to your instrument’s trading session (pre-/post-market handling may vary).
Limitations
Intraday VWAPs are calculated in 1-minute resolution via request.security to remain consistent across all timeframes.
Intraday σ bands are not included by default (can be added in a later version).
Changelog
V2: Performance refactor, non-mutable labels, fixed fill() usage, added 2 intraday VWAPs with time selectors, stabilized table.
V1: Basic D/W/M VWAPs + alerts.
Disclaimer
This script is for educational and informational purposes only. It does not constitute financial advice. You are solely responsible for your trading decisions.
Credits & License
© BAB Trading. Pine Script® — TradingView.
Open-source under the Mozilla Public License (MPL 2.0) by default (or specify your own license in the script header if different).

Fibonacci Daily PivotsElevate your trading game with this premium Fibonacci indicator that automatically calculates and displays critical daily pivot levels based on the previous trading day's high and low. This powerful tool eliminates the guesswork by instantly plotting 11 precision Fibonacci levels (-36.8% to +136.8%) every trading day, giving you institutional-grade support and resistance zones that professional traders rely on. With smart weekend handling (Monday uses Friday's data), customizable visual elements, real-time price alerts, and clean day separation markers, this indicator transforms complex Fibonacci analysis into a simple, automated trading edge. Whether you're scalping intraday moves or planning swing trades, these daily-refreshed pivot levels provide the clarity and precision you need to identify high-probability entry and exit points, making it an essential tool for any serious trader looking to consistently profit from market structure and price action around key Fibonacci zones.


Synthesis DeFi - Fractals - Daily - v7.0This is a free trial version of SynthesisDeFi.com fractals.
A simplified fractal analysis indicator that identifies key market structure points on daily timeframes. This tool automatically detects trend reversals and plots fractal highs and lows with connecting lines, helping traders visualize major support and resistance levels
Why use Synthesis DeFi fractals?
Harmonic Patterns
Wycoff
Elliot Waves
Dow Theory
Created by Oliver Fujimori | SynthesisDeFi.com
Perfect for swing traders and position traders focused on daily market structure analysis

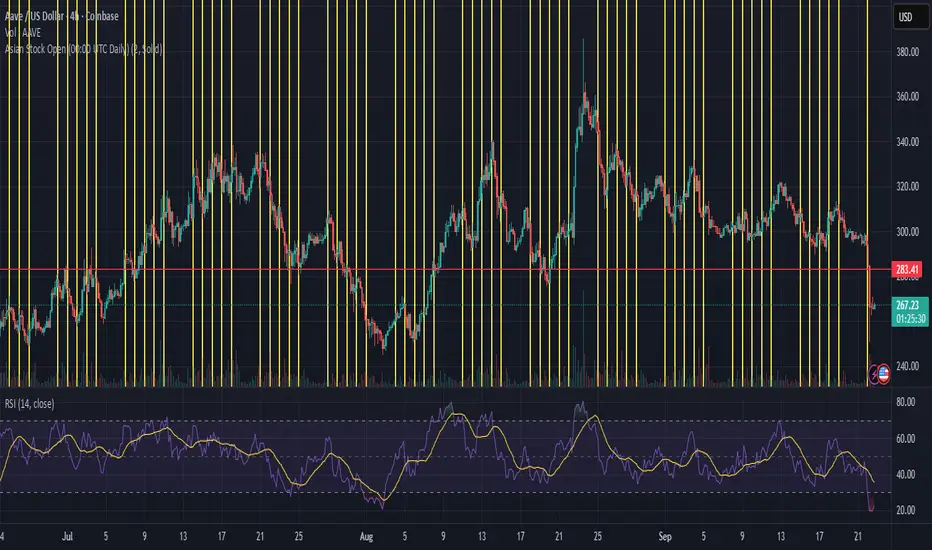
Asian Stock Open (00:00 UTC Daily)Simple TSE daily open indicator, 500 line history, to help prepare for potential weekly open volatility from Asia trading
Smart Money LITE — Daily Sweep → HQ Signals (VWAP • FVG • CHoCH) 🔗 PRO VERSION (VWAP + FVG + CHoCH — full confirmations, all timeframes):
chartedgepro.gumroad.com/l/rmnbhw
Daily liquidity sweep → confluence signals with VWAP, FVG & CHoCH. Works on all timeframes & markets (Indices, Forex, Crypto).
WHAT IT DOES
Smart Money LITE+ highlights high-quality LONG/SHORT signals only after daily liquidity is swept (previous day high/low) with confluence from VWAP, FVG and structure (BOS/CHoCH).
Works on all timeframes and across markets: indices, forex, crypto.
KEY FEATURES (Lite)
• Daily sweep logic (PDH/PDL) + previous day zones
• VWAP + deviation bands (optional) and proximity filter
• 3-bar FVG boxes (visual) with adjustable extension
• ATR/volatility filter, optional HTF trend filter
• Anti-spam cooldown, clean LONG/SHORT labels
• Alerts: HQ LONG / HQ SHORT
HOW TO USE
1. Wait for price to sweep PDH/PDL → indicator opens “signal window”.
2. Look for confluence: VWAP touch/proximity + CHoCH or BOS in direction.
3. Enter with proper risk management (stop beyond swing/zone, partials).
SETTINGS TIPS
• Enable “Require VWAP Confluence?” for strictest setups.
• Use “HTF Trend Filter?” to align with higher-timeframe EMA trend.
• Adjust “After sweep (bars)” to define signal validity window.
• FVGs are visual in Lite — advanced filtering and confirmation are in Pro.
WHO IT'S FOR
Scalpers, intraday, and swing traders looking for objective, visual signals based on liquidity sweeps and VWAP/FVG confluence.
PRO VERSION (full confirmations)
Adds advanced FVG/iFVG logic, more confluence filters, dynamic risk tools and extended alert packages — optimized for all timeframes.
👉 chartedgepro.gumroad.com/l/rmnbhw
NOTES
• For educational purposes only. No financial advice.
• “Lite” is open-source; redistribution of code follows TradingView rules.

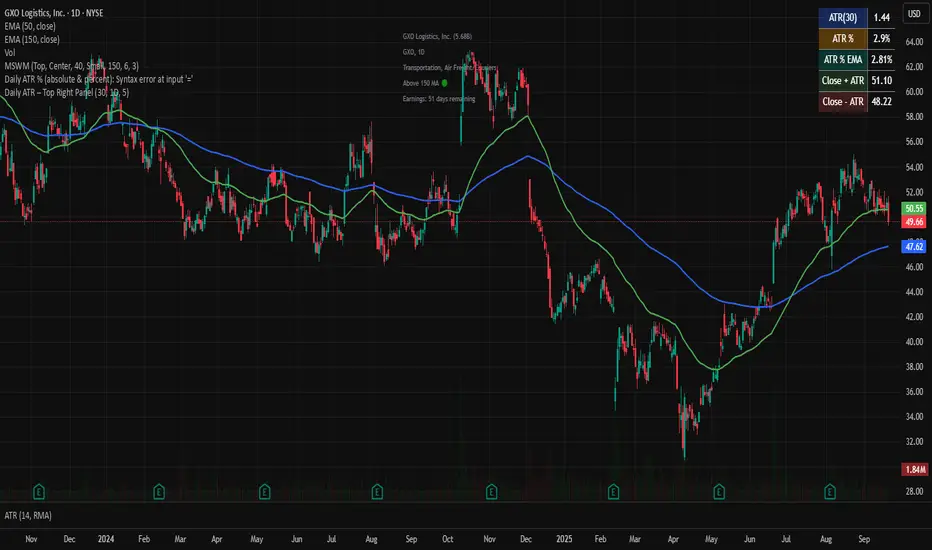
nitai Daily ATR – Top Right PanelThis script calculates the Daily ATR (Average True Range) and displays it in a compact panel on the top-right corner of the chart.
The panel includes:
• ATR in USD (based on a user-defined period, default = 30)
• ATR% – volatility expressed as a percentage of the price
• ATR% EMA – smoothed volatility trend using an Exponential Moving Average
• Close + ATR and Close – ATR – projected upper and lower daily range levels
Use this tool to quickly assess daily volatility, compare stocks by relative movement, and support risk management (e.g., stop-loss placement).
Designed for traders who want a clean and simple volatility dashboard directly on the chart.
BB + OBV + RSI Strategy (Enhanced + Daily Table) Script Brief – *BB + OBV + RSI Strategy (Enhanced + Daily Table)*
This TradingView Pine Script combines **Bollinger Bands (BB)**, **On-Balance Volume (OBV)**, **Relative Strength Index (RSI)**, and **Exponential Moving Average (EMA)** to help traders identify potential trend conditions and market strength.
**Key Features:**
* **Bollinger Bands** (20-period SMA ± 2 Std Dev by default) to track volatility and price extremes.
* **OBV & OBV Moving Average** to confirm buying or selling pressure.
* **RSI** to highlight overbought and oversold zones.
* **200 EMA** as a long-term trend filter.
* **Daily Comparison Table** (top-right corner):
* Displays today’s vs. yesterday’s values for Close, RSI, OBV vs MA, BB Position, and EMA Trend.
* Helps quickly assess whether momentum and trend conditions are strengthening or weakening.
**Usage:**
* The chart shows **BB lines and EMA** for real-time analysis on any timeframe.
* The **table provides higher-timeframe context** (daily values), making it easier to confirm signals across multiple timeframes.
* Best applied with backtesting and proper risk management.
