Cerca negli script per "daily"
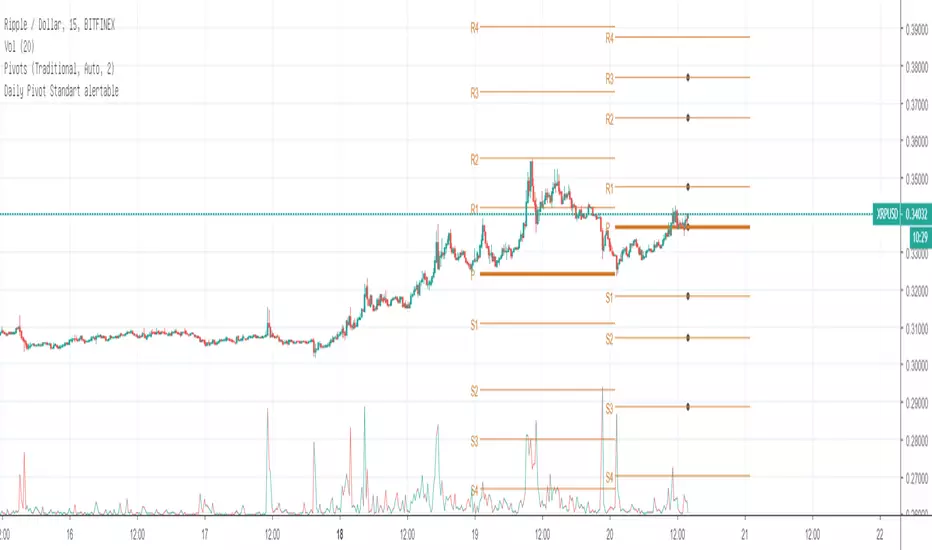
Daily Pivot Standart alertableWith this Indicator u can set allert between the Pivot points s15.directupload.net
So it is useful for scalping
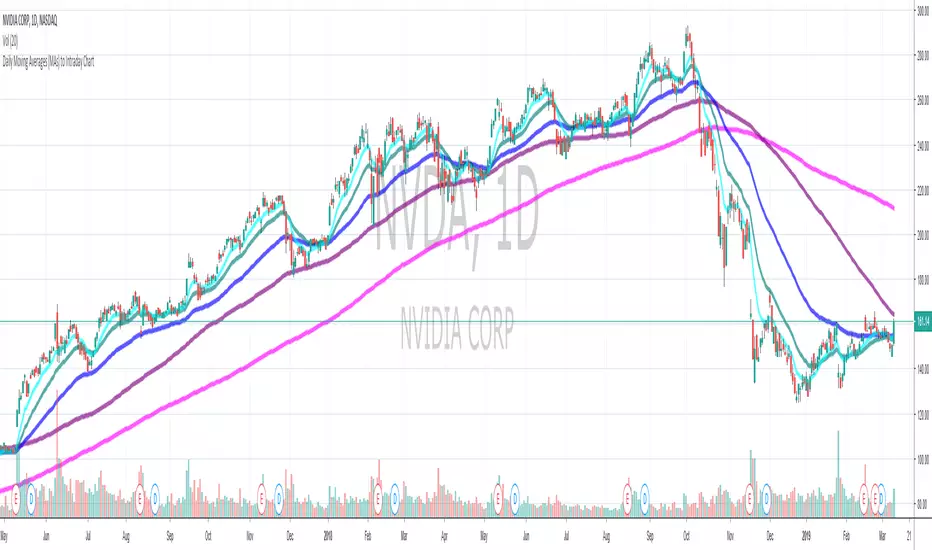
Daily Moving Average to Intraday Chart BradleyRUses Robertob's Script with Mike's colors for Warrior Pro Students.


BTC Swinger v1Daily interval swing trading algorithm based on momentum techniques using ATR Stops. Made by Kory Hoang from Stably.
Shout out to the Advanced Crypto Asset Trading crew! ;)

MY_CME eod OI vs CFTC eow OIDaily e-o-d Open Interest as published by CME.
As CFTC COT Open Interest relates to last Tuesday, here you can have an idea how things evolved day-by-day since then.
As CME total OI is not accessibl as data, here I sum OI of the next 9 outstanding contracts, which gives a fair idea of the trend in OI


MTF EMA Combo with Background ColorDaily/Weekly EMA combo for longer term trend direction, with combo background color for varying trend direction.


Daily Average True Range OverlayPlots the upper and lower average true range away from the previous days close on all time frames.

Daily Deviations (Lazy Edition)
Plots the standard deviation resistance/support lines.
Uses Previous days close and the VIX as the volatility factor.
credit to u/UberBotMan and u/Living_Granger for the idea and formulas

Daily Deviations (Self Input Version)
Plots the standard deviation resistance/support levels.
Input the previous settlement price and the implied volatility.
credit to u/UberBotMan and u/Living_Granger for the idea and formulas
(preview example is using settlement of 2420 and IV of 11)


Daily Returns & STDWhat happened last time when xx increased by xx%? - Start collecting some stats!
You can choose the ticker and the timeframe you're interested in

RSI Oversold/UndersoldThe study script will place GREEN BUY arrows BELOW oversold conditions and RED SHORT arrows ABOVE overbought conditions. You can configure the period
Most RSI(14) indicators use a 14-period, I prefer a 5-period. The period, overbought and oversold periods are settings that can easily be changed by adding this study to your chart and clicking the "gear" icon next to the study inside your chart.


Daily SMAThis pine script on intraday chart is exactly the same SMA as built-in MovingAverage on a 1Day chart (with the same lengths)


ZLT - Date and Time MarkerPine Script v5 indicator called “DateTime Marker” that overlays on the chart and marks bars whose timestamp matches a user-defined schedule. When a bar “matches,” it can draw:
a vertical line through the bar,
a label with a time/date string, and
a triangle marker below the bar (always plotted on matches).
What you can configure
Marker Type (the matching rule)
You choose one of five modes:
Every Minute
Inputs: everyNMinutes (default 15), minuteOffset (default 0)
Match condition: minute % everyNMinutes == minuteOffset
Example with defaults: marks bars at :00, :15, :30, :45 each hour.
Hourly
Inputs: everyNHours (default 4), hourlyMinute (default 0)
Match condition: hour % everyNHours == 0 AND minute == hourlyMinute
Example with defaults: marks bars at 00:00, 04:00, 08:00, 12:00, 16:00, 20:00 (at minute 00).
Daily Time
Inputs: dailyHour (default 10), dailyMinute (default 0)
Match condition: hour == dailyHour AND minute == dailyMinute
Example with defaults: marks 10:00 every day.
Weekly Day & Time
Inputs: weekDay (default Tuesday), weeklyHour (default 16), weeklyMinute (default 0)
It converts the weekday name to Pine’s dayofweek number via getDayNumber().
Match condition: dayofweek == targetDay AND hour == weeklyHour AND minute == weeklyMinute
Example with defaults: marks Tuesday 16:00.
Monthly Date & Time
Inputs: monthlyDay (default 2), monthlyHour (default 23), monthlyMinute (default 0)
Match condition: dayofmonth == monthlyDay AND hour == monthlyHour AND minute == monthlyMinute
Example with defaults: marks the 2nd day of each month at 23:00.
Visual settings
showLine: whether to draw the vertical line.
lineStyle: Solid/Dashed/Dotted (mapped to Pine line styles by getLineStyle()).
lineColor, lineWidth: styling for the line (width is rounded to an integer because Pine line width is integer).
showLabel: whether to draw a label.
labelColor: background color of the label (text is forced white).
What happens when a bar matches
When isMatch becomes true on a bar:
Vertical line: line.new() at that bar’s bar_index, from low to high, extended extend.both (so it spans the full chart vertically).
Label: label.new() at the bar’s high, with mode-specific text:
Minute/Hourly/Daily: "HH:mm"
Weekly: "Tuesday HH:mm" (or whatever day selected)
Monthly: "Day 2 - HH:mm" (or chosen day)
Triangle marker: plotshape() draws a triangle up below the bar on every match (this happens regardless of showLine / showLabel).
Important practical implications
This uses the bar’s exchange/chart time (TradingView’s time, hour, minute, etc.), so results depend on the symbol/session and chart timezone settings.
On timeframes coarser than 1 minute, “Every Minute” still checks only the bar’s timestamp minute value; it won’t mark intra-bar minutes that don’t exist as separate bars.
Because it can create many objects (lines/labels), it sets max_labels_count=500. Lines are not capped here, so very dense marking can still clutter the chart.
If you tell me your intended use (e.g., “mark NY open,” “mark every 15m candle close,” “mark macro events weekly”), I can point out whether the current matching logic fits that precisely or needs adjustments (sessions, timezones, avoiding duplicates, limiting lines, etc.).

ADR % RangesThis indicator is designed to visually represent percentage lines from the open of the day. The % amount is determined by X amount of the last days to create an average...or Average Daily Range (ADR).
1. ADR Percentage Lines: The core function of the script is to apply lines to the chart that represent specific percentage changes from the daily open. It first calculates the average over X amount of days and then displays two lines that are 1/3rd of that average. One line goes above the other line goes below. The other two lines are the full "range" of the average. These lines can act as boundaries or targets to know how an asset has moved recently. *Past performance is not indicative of current or future results.
The calculation for ADR is:
Step 1. Calculate Today's Range = DailyHigh - DailyLow
Step 2. Store this average after the day has completed
Step 3. Sum all day's ranges
Step 4. Divide by total number of days
Step 5. Draw on chart
2. Customizable Inputs: Users have the flexibility to customize the script through various inputs. This includes the option to display lines only for the current trading day (`todayonly`), and to select which lines are displayed. The user can also opt to show a table the displays the total range of previous days and the average range of those previous days.
3. No Secondary Timeframe: The ADR is computed based on whatever timeframe the chart is and does not reference secondary periods. Therefore the script cannot be used on charts greater than daily.
This script is can be used by all traders for any market. The trader might have to adjust the "X" number of days back to compute a historical average. Maybe they only want to know the average over the past week (5 days) or maybe the past month (20 days).
