WillStop Pro [tradeviZion]WillStop Pro : A Step-by-Step Guide for Beginners to Master Trend Trading
Welcome to an in-depth guide to the WillStop Pro indicator. This article will walk you through the key features, how to use them effectively, and how this tool can help you navigate the markets confidently. WillStop Pro is based on principles established by Larry Williams, a well-known figure in trading, and aims to help you manage trades more effectively without overcomplicating things.
This guide will help you understand the basics of the WillStop Pro indicator, how to interpret its signals, and how to use it step-by-step to manage risk and identify opportunities in your trading journey. We will also cover the underlying logic and calculations for advanced users interested in more details.
What is the WillStop Pro Indicator?
The WillStop Pro indicator is a user-friendly tool that helps traders establish stop levels dynamically. It helps you figure out optimal points to enter or exit trades, while managing risk effectively during changing market conditions. The indicator tracks trending markets and sets price levels as stops for ongoing trades, making it suitable both for deciding when to enter and exit trades.
The indicator is beginner-friendly because it simplifies complex calculations and presents the results visually. This allows traders to focus more on their decision-making process instead of spending time with complex analysis.
WillStop Pro adapts to different market conditions, whether you're trading stocks, forex, commodities, or cryptocurrencies. It adjusts stop levels dynamically based on current market momentum, providing a practical way to manage both risk and reward.
Another significant benefit of WillStop Pro is that it works well with other indicators. Beginners can use it on its own or combine it with other tools like moving averages or oscillators to form a comprehensive trading strategy. Whether you are trading daily or looking at longer-term trends, WillStop Pro helps you manage your trades effectively.
Key Features of WillStop Pro
Dynamic Stop Levels : WillStop Pro calculates real-time stop levels for both long (buy) and short (sell) positions. This helps you protect your profits and reduce risk. The stop levels adjust based on the current market environment, making them more adaptable compared to fixed stop levels.
Advanced Stop Settings : There are optional settings to make the stop calculations more advanced, which take into consideration previous price movements to refine where the stops should be placed. These settings provide more precise control over your trades.
Break Signals and Alerts : The indicator provides visual signals, like arrows, to show when a stop level has been broken. This makes it easier for you to identify possible reversals and understand when the market direction is changing.
Comprehensive Table Display : A small table on the chart shows the current trend, the stop level, and whether advanced mode is active. This simple display provides an overview of the market, making decision-making easier.
Based on Larry Williams' Methodology : WillStop Pro builds upon Larry Williams' ideas, which are designed to capture major market trends while managing risk effectively. It provides a systematic way to follow these strategies without requiring deep technical analysis skills.
How Are Stop Levels Calculated? (For Advanced Users)
The WillStop Pro indicator determines stop levels by evaluating highs, lows, and closing prices over a specific lookback period. It uses this information to identify key points that justify adjusting your stop level, and there are separate approaches for both long and short positions.
Below, we explain the mathematical logic behind the stop calculations, along with some code snippets to give advanced users a clearer understanding.
For Long Stops (buy positions): The indicator looks for the highest closing price within the lookback period and continues until it finds three valid bars that meet certain criteria. Stops are adjusted to skip bars that have consecutive upward closes to ensure that the stop is placed at a level that offers solid support. Specifically, the function iterates over recent bars to determine the highest closing value, and checks for specific conditions before finalizing the stop level. Here is an excerpt of the relevant code:
getTrueLow(idx) => math.min(low , close )
findStopLevels() =>
float highestClose = close
int highestCloseIndex = 0
for i = 0 to lookback
if close > highestClose
highestClose := close
highestCloseIndex := i
// Logic to adjust based on up close skipping
int longCount = 0
int longCurrentIndex = highestCloseIndex
while longCount < 3 and longCurrentIndex < 100
if not isInsideBar(longCurrentIndex)
longCount += 1
longCurrentIndex += 1
// Determine the lowest low for the stop level
float longStopLevel = high * 2
for i = searchIndex to highestCloseIndex
longStopLevel := math.min(longStopLevel, getTrueLow(i))
// Apply offset
longStopLevel := longStopLevel - (offsetTicks * tickSize)
In this code snippet, the function findStopLevels() calculates the long stop level by first identifying the highest close within the lookback period and then finding a suitable support level while skipping certain conditions, such as inside bars or consecutive upward closes. Finally, the user-defined offset ( offsetTicks ) is applied to determine the stop level.
For Short Stops (sell positions): Similarly, the indicator finds the lowest closing price within the lookback period and then identifies three bars that fit the conditions for a short stop. It avoids using bars with consecutive down closes to help find a more robust resistance level. Here's a relevant code snippet:
getTrueHigh(idx) => math.max(high , close )
findStopLevels() =>
float lowestClose = close
int lowestCloseIndex = 0
for i = 0 to lookback
if close < lowestClose
lowestClose := close
lowestCloseIndex := i
// Logic to adjust based on down close skipping
int shortCount = 0
int shortCurrentIndex = lowestCloseIndex
while shortCount < 3 and shortCurrentIndex < 100
if not isInsideBar(shortCurrentIndex)
shortCount += 1
shortCurrentIndex += 1
// Determine the highest high for the stop level
float shortStopLevel = 0
for i = searchIndex to lowestCloseIndex
shortStopLevel := math.max(shortStopLevel, getTrueHigh(i))
// Apply offset
shortStopLevel := shortStopLevel + (offsetTicks * tickSize)
Here, findStopLevels() calculates the short stop level by finding the lowest closing price within the lookback period. It then determines the highest value that acts as a resistance level, excluding bars that do not fit certain criteria.
Volume Confirmation for Alert Accuracy : To further enhance the stop level accuracy, volume is used as a confirmation filter. The average volume (volAvg) is calculated over a 20-period moving average, and alerts are only generated if the volume exceeds a defined threshold (volMultiplier). This ensures that price movements are significant enough to consider as meaningful signals.
volAvg = ta.sma(volume, 20)
isVolumeConfirmed() =>
result = requireVolumeConfirmation ? volume > (volAvg * volMultiplier) : true
result
This additional logic ensures that stop level breaks or adjustments are not triggered during periods of low trading activity, thus enhancing the reliability of the generated signals.
These calculations are at the core of WillStop Pro's ability to determine dynamic stop levels that respond effectively to market movements, helping traders manage risk by placing stops at levels that make sense given historical price and volume data.
How to Identify Opportunities with WillStop Pro
WillStop Pro provides various signals that help you decide when to enter or exit a trade:
When a Stop Level is Broken: If a stop level (support for long positions or resistance for short positions) is broken, it may indicate a reversal. WillStop Pro visually plots arrows whenever a stop level is breached, making it easy for you to see where changes might occur. This feature helps traders identify momentum shifts quickly.
Support and Resistance Levels: The indicator plots support and resistance levels, which show key zones to watch for opportunities. These levels often act as psychological barriers in the market, where price action may either reverse or stall temporarily.
Dynamic State Management: The indicator shifts between long and short states based on price action, providing real-time feedback. This helps traders stick to their trading plan without second-guessing the market.
A major advantage of WillStop Pro is that it responds well to changing market conditions. By identifying when key support or resistance levels break, it allows you to adjust your strategies and react to new opportunities accordingly. Whether the market is trending strongly or staying within a range, WillStop Pro provides valuable information to help guide your trades.
Setting Up Alerts
Alerts are an important feature in trading, especially when you can’t be in front of your charts all the time. WillStop Pro has been enhanced to include flexible alert settings to help you stay on top of your trades without constantly monitoring the charts.
Enable Alerts: There is a master switch to enable or disable all alerts. This way, you can control whether you want to be notified of events at any time.
Alert Frequency: Choose between receiving alerts Once Per Bar or Once Per Bar Close . This helps you manage the frequency of alerts and decide if you need real-time updates or want confirmation after a bar closes.
Break Alerts: These alerts notify you when a stop level has been broken. This can help you catch potential reversals or trading opportunities as soon as they happen.
Strong Break Alerts: Alerts are available for strong breaks, which occur when the price breaks stop levels with confirmation based on additional price, volume, and momentum criteria. These alerts help identify significant shifts in the market.
Level Change Alerts: These alerts tell you whenever a new stop level is calculated, keeping you updated about changes in market dynamics. You can set a Minimum Level Change % to ensure that alerts are only triggered when the stop level changes significantly.
Require Volume Confirmation: You can opt to receive alerts only if the volume is above a certain threshold. This confirmation helps reduce false signals by ensuring that significant price changes are backed by increased trading activity.
Volume Multiplier: The volume multiplier allows you to set a minimum volume requirement that must be met for an alert to trigger. This ensures that alerts are triggered only when there is sufficient trading interest.
Here is a part of the updated alert logic that has been implemented in the indicator:
// Alert on break conditions
if alertsEnabled
if alertOnBreaks
if longStopBroken and isVolumeConfirmed()
alert(createAlertMessage("Support Break - Short Signal", useAdvancedStops), alertFreq)
if shortStopBroken and isVolumeConfirmed()
alert(createAlertMessage("Resistance Break - Long Signal", useAdvancedStops), alertFreq)
// Strong break alerts
if alertOnStrongBreaks
if longStopBroken and isStrongBreak(false)
alert(createAlertMessage("Strong Support Break - Short Signal", useAdvancedStops), alertFreq)
if shortStopBroken and isStrongBreak(true)
alert(createAlertMessage("Strong Resistance Break - Long Signal", useAdvancedStops), alertFreq)
// Level change alerts
if alertOnLevelChanges and isSignificantChange() and isVolumeConfirmed()
alert(createAlertMessage("Significant Level Change", useAdvancedStops), alertFreq)
Setting alerts allows you to react to market changes without having to watch the charts constantly. Alerts are particularly helpful if you have other responsibilities and can’t be actively monitoring your trades all day.
Understanding the Table Display
The WillStop Pro indicator provides a status table that gives an overview of the current market state. Here’s what the table shows:
Indicator Status: The table indicates whether the indicator is in a LONG or SHORT state. This helps you quickly understand the market trend.
Stop Level: The active stop level is shown, whether it is acting as support (long) or resistance (short). This is important for knowing where to set your protective stops.
Mode: The table also displays whether the advanced calculation mode is being used. This keeps you informed about how stop levels are being calculated and why they are positioned where they are.
Empowering Messages: The table also includes motivational messages that rotate periodically, such as 'Trade with Clarity, Stop with Precision' and 'Let Winners Run, Cut Losses Short.' These messages are designed to keep you focused, motivated, and disciplined during your trading journey.
The table is simple and easy to follow, helping you maintain discipline in your trading plan. By having all the essential information in one place, the table reduces the need to make quick, emotional decisions and promotes more thoughtful analysis.
Tips for Using WillStop Pro Effectively
Here are some practical ways to make the most of the WillStop Pro indicator:
Start with Default Settings: If you’re new to the indicator, start with the default settings. This will give you an idea of how stop levels are determined and how they adjust to different markets.
Experiment with Advanced Settings: Once you are comfortable, try using the advanced stop settings to see how they refine the stop levels. This can be useful in certain market conditions to improve accuracy.
Use Alerts to Stay Updated: Set up alerts for when a stop level is broken or when new levels are calculated. This helps you take action without constantly watching the chart. Swing traders may find alerts especially helpful for monitoring longer-term moves.
Monitor the Status Table: Keep an eye on the status table to understand the current market condition. Whether the indicator is in a LONG or SHORT state can help you make more informed decisions.
Focus on Risk Management: WillStop Pro is designed to help you manage risk by dynamically adjusting stop levels. Make sure you are using these levels to protect your trades, especially during strong trends or volatile periods.
Acknowledging Larry Williams' Influence
WillStop Pro is inspired by the work of Larry Williams, who described the approach as one of his best trading techniques. His method aims to ride major market trends while reducing the risk of giving back gains during corrections. WillStop Pro builds upon this approach, adding features like advanced stop settings and visual alerts that make it easier to apply in modern markets.
By using WillStop Pro, you are essentially leveraging a well-established trading strategy with additional tools that help improve its effectiveness. The indicator is designed to provide a reliable way to manage trades, stay on top of market conditions, and reduce emotional decision-making.
Conclusion: Why WillStop Pro is Great for Beginners and Advanced Users
The WillStop Pro is a powerful yet easy-to-use tool that helps traders ride trends while managing risk during market corrections. It can be used both for entering and exiting trades, and its visual features make it accessible for those who are new to trading, while the underlying logic appeals to advanced users seeking greater control and understanding.
WillStop Pro is more than just a tool for setting stops. It is a comprehensive solution for managing trades, with features like dynamic stop levels, customizable alerts, and an easy-to-understand status table. This combination of simplicity and advanced features makes it suitable for beginners as well as more experienced traders.
We hope this guide helps you get started with WillStop Pro and improves your trading confidence. Remember to start with the basics, explore the advanced features, and set alerts to stay informed without getting overwhelmed. Whether you’re just beginning or want to simplify your strategy, WillStop Pro is a valuable tool to have in your trading arsenal.
Trading can be challenging, but the right tools make it more manageable. WillStop Pro helps you keep track of market movements, identify opportunities, and manage risk effectively. Give it a try and see how it can improve your trading decisions and help you navigate the markets more efficiently.
By incorporating WillStop Pro into your strategy, you are following a systematic approach that has been refined over time. It’s designed to help you make sense of the markets, plan your trades, and manage your risks with greater clarity and confidence.
Note: Always practice proper risk management and thoroughly test the indicator to ensure it aligns with your trading strategy. Past performance is not indicative of future results.
Trade smarter with TradeVizion—unlock your trading potential today!
Cerca negli script per "deep股票代码"

Candle AnalysisImportant Setup Note
Optimize Your Viewing Experience
To ensure the Candle Analysis Indicator displays correctly and to prevent any default chart colors from interfering with the indicator's visuals, please adjust your chart settings:
Right-Click on the Chart and select "Settings".
Navigate to the "Symbol" tab.
Set transparent default candle colors:
- Body
-Borders
- Wick
By customizing these settings, you'll experience the full visual benefits of the indicator without any overlapping colors or distractions.
Elevate your trading strategy with the Candle Analysis Indicator—a powerful tool designed to give you a focused view of the market exactly when you need it. Whether you're honing in on specific historical periods or testing new strategies, this indicator provides the clarity and control you've been looking for.
Key Features:
🔹 Custom Date Range Selection
Tailored Analysis: Choose your own start and end dates to focus on the market periods that matter most to you.
Historical Insights: Dive deep into past market movements to uncover hidden trends and patterns.
🔹 Dynamic Backtesting Simulation
Interactive Playback: Enable backtesting to simulate how the market unfolded over time.
Strategy Testing: Watch candles appear at your chosen interval, allowing you to test and refine your trading strategies in real-time scenarios.
🔹 Enhanced Visual Clarity
Focused Visualization: Only candles within your specified date range are highlighted, eliminating distractions from irrelevant data.
Distinct Candle Styling: Bullish and bearish candles are displayed with unique colors and transparency, making it easy to spot market sentiment at a glance.
🔹 User-Friendly Interface
Easy Setup: Simple input options mean you can configure the indicator quickly without any technical hassle.
Versatile Application: Compatible with various timeframes—whether you're trading intraday, daily, or weekly.
RSI from Rolling VWAP [CHE]Introducing the RSI from Rolling VWAP Indicator
Elevate your trading strategy with the RSI from Rolling VWAP —a cutting-edge indicator designed to provide unparalleled insights and enhance your decision-making on TradingView. This advanced tool seamlessly integrates the Relative Strength Index (RSI) with a Rolling Volume-Weighted Average Price (VWAP) to deliver precise and actionable trading signals.
Why Choose RSI from Rolling VWAP ?
- Clear Trend Detection: Our enhanced algorithms ensure accurate identification of bullish and bearish trends, allowing you to capitalize on market movements with confidence.
- Customizable Time Settings: Tailor the time window in days, hours, and minutes to align perfectly with your unique trading strategy and market conditions.
- Flexible Moving Averages: Select from a variety of moving average types—including SMA, EMA, WMA, and more—to smooth the RSI, providing clearer trend analysis and reducing market noise.
- Threshold Alerts: Define upper and lower RSI thresholds to effortlessly spot overbought or oversold conditions, enabling timely and informed trading decisions.
- Visual Enhancements: Enjoy a visually intuitive interface with color-coded RSI lines, moving averages, and background fills that make interpreting market data straightforward and efficient.
- Automatic Signal Labels: Receive immediate bullish and bearish labels directly on your chart, signaling potential trading opportunities without the need for constant monitoring.
Key Features
- Inspired by Proven Tools: Building upon the robust foundation of TradingView's Rolling VWAP, our indicator offers enhanced functionality and greater precision.
- Volume-Weighted Insights: By incorporating volume into the VWAP calculation, gain a deeper understanding of price movements and market strength.
- User-Friendly Configuration: Easily adjust settings to match your trading preferences, whether you're a novice trader or an experienced professional.
- Hypothesis-Driven Analysis: Utilize hypothetical results to backtest strategies, understanding that past performance does not guarantee future outcomes.
How It Works
1. Data Integration: Utilizes the `hlc3` (average of high, low, and close) as the default data source, with customization options available to suit your trading needs.
2. Dynamic Time Window: Automatically calculates the optimal time window based on an auto timeframe or allows for fixed time periods, ensuring flexibility and adaptability.
3. Rolling VWAP Calculation: Accurately computes the Rolling VWAP by balancing price and volume over the specified time window, providing a reliable benchmark for price action.
4. RSI Analysis: Measures momentum through RSI based on Rolling VWAP changes, smoothed with your chosen moving average for enhanced trend clarity.
5. Actionable Signals: Detects and labels bullish and bearish conditions when RSI crosses predefined thresholds, offering clear indicators for potential market entries and exits.
Seamless Integration with Your TradingView Experience
Adding the RSI from Rolling VWAP to your TradingView charts is straightforward:
1. Add to Chart: Simply copy the Pine Script code into TradingView's Pine Editor and apply it to your desired chart.
2. Customize Settings: Adjust the Source Settings, Time Settings, RSI Settings, MA Settings, and Color Settings to align with your trading strategy.
3. Monitor Signals: Watch for RSI crossings above or below your set thresholds, accompanied by clear labels indicating bullish or bearish trends.
4. Optimize Your Trades: Leverage the visual and analytical strengths of the indicator to make informed buy or sell decisions, maximizing your trading potential.
Disclaimer:
The content provided, including all code and materials, is strictly for educational and informational purposes only. It is not intended as, and should not be interpreted as, financial advice, a recommendation to buy or sell any financial instrument, or an offer of any financial product or service. All strategies, tools, and examples discussed are provided for illustrative purposes to demonstrate coding techniques and the functionality of Pine Script within a trading context.
Any results from strategies or tools provided are hypothetical, and past performance is not indicative of future results. Trading and investing involve high risk, including the potential loss of principal, and may not be suitable for all individuals. Before making any trading decisions, please consult with a qualified financial professional to understand the risks involved.
By using this script, you acknowledge and agree that any trading decisions are made solely at your discretion and risk.
Get Started Today
Transform your trading approach with the RSI from Rolling VWAP indicator. Experience the synergy of momentum and volume-based analysis, and unlock the potential for more accurate and profitable trades.
Download now and take the first step towards a more informed and strategic trading journey!
For further inquiries or support, feel free to contact
Best regards
Chervolino
Inspired by the acclaimed Rolling VWAP by TradingView

Big Volume Highlighter ADVANCEDBIG VOLUME HIGHLIGHTER INDICATOR ADVANCED
The BIG VOLUME INDICATOR ADVANCED is an essential tool for traders who want to gain a deeper understanding of market dynamics through volume analysis. This advanced indicator highlights significant volume spikes, enabling traders to make more informed decisions based on market activity and price movements.
Key Features:
Customizable Lookback Period: Define the number of candles over which the highest volume is calculated, allowing you to adjust the analysis to fit your specific trading strategy and timeframe.
Approximate Volume Matching: Activate the approximate volume matching feature to identify candles that fall within a specified range of a target volume. This feature is particularly valuable for capturing notable volume spikes that may not match your exact input but are within an acceptable tolerance.
Flexible Volume Units: Input volumes in various units (Hundreds, Thousands, Millions, or Billions) to cater to your trading preferences. This flexibility ensures that you can analyze volume data in a way that aligns with your trading style.
Dynamic Tolerance Calculation: Set a percentage-based tolerance for volume matching, allowing for greater flexibility. For instance, if you input a volume of 600 million with a tolerance of 1.5%, the indicator will highlight candles with volumes ranging from 591 million to 609 million.
Visual Alerts: Highlighted candles are marked with clear, color-coded labels positioned above the bars. Green labels represent bullish candles, while red labels denote bearish candles, providing immediate visual feedback on market sentiment.
Mobile and Desktop Compatibility: Designed for seamless integration with TradingView, this indicator is accessible on both desktop and mobile devices, ensuring that you can monitor the market wherever you are.
How to Use:
Set the Lookback Period: Adjust the lookback period to analyze a specific number of candles for volume spikes.
Enable Approximate Volume Matching: If desired, toggle the approximate volume matching feature and enter your target volume, selecting the appropriate unit.
Adjust Tolerance: Define the tolerance percentage to specify how close the volume must be to your input for it to be considered significant.
Analyze the Chart: Observe the highlighted candles on your chart, which indicate significant volume activity based on your criteria.
Make Informed Decisions: Leverage the insights provided by the indicator to guide your trading decisions, identifying potential entry or exit points based on volume analysis.
****

RSI Weighted Trend System I [InvestorUnknown]The RSI Weighted Trend System I is an experimental indicator designed to combine both slow-moving trend indicators for stable trend identification and fast-moving indicators to capture potential major turning points in the market. The novelty of this system lies in the dynamic weighting mechanism, where fast indicators receive weight based on the current Relative Strength Index (RSI) value, thus providing a flexible tool for traders seeking to adapt their strategies to varying market conditions.
Dynamic RSI-Based Weighting System
The core of the indicator is the dynamic weighting of fast indicators based on the value of the RSI. In essence, the higher the absolute value of the RSI (whether positive or negative), the higher the weight assigned to the fast indicators. This enables the system to capture rapid price movements around potential turning points.
Users can choose between a threshold-based or continuous weight system:
Threshold-Based Weighting: Fast indicators are activated only when the absolute RSI value exceeds a user-defined threshold. Below this threshold, fast indicators receive no weight.
Continuous Weighting: By setting the weight threshold to zero, the fast indicators always receive some weight, although this can result in more false signals in ranging markets.
// Calculate weight for Fast Indicators based on RSI (Slow Indicator weight is kept to 1 for simplicity)
f_RSI_Weight_System(series float rsi, simple float weight_thre) =>
float fast_weight = na
float slow_weight = na
if weight_thre > 0
if math.abs(rsi) <= weight_thre
fast_weight := 0
slow_weight := 1
else
fast_weight := 0 + math.sqrt(math.abs(rsi))
slow_weight := 1
else
fast_weight := 0 + math.sqrt(math.abs(rsi))
slow_weight := 1
Slow and Fast Indicators
Slow Indicators are designed to identify stable trends, remaining constant in weight. These include:
DMI (Directional Movement Index) For Loop
CCI (Commodity Channel Index) For Loop
Aroon For Loop
Fast Indicators are more responsive and designed to spot rapid trend shifts:
ZLEMA (Zero-Lag Exponential Moving Average) For Loop
IIRF (Infinite Impulse Response Filter) For Loop
Each of these indicators is calculated using a for-loop method to generate a moving average, which captures the trend of a given length range.
RSI Normalization
To facilitate the weighting system, the RSI is normalized from its usual 0-100 range to a -1 to 1 range. This allows for easy scaling when calculating weights and helps the system adjust to rapidly changing market conditions.
// Normalize RSI (1 to -1)
f_RSI(series float rsi_src, simple int rsi_len, simple string rsi_wb, simple string ma_type, simple int ma_len) =>
output = switch rsi_wb
"RAW RSI" => ta.rsi(rsi_src, rsi_len)
"RSI MA" => ma_type == "EMA" ? (ta.ema(ta.rsi(rsi_src, rsi_len), ma_len)) : (ta.sma(ta.rsi(rsi_src, rsi_len), ma_len))
Signal Calculation
The final trading signal is a weighted average of both the slow and fast indicators, depending on the calculated weights from the RSI. This ensures a balanced approach, where slow indicators maintain overall trend guidance, while fast indicators provide timely entries and exits.
// Calculate Signal (as weighted average)
sig = math.round(((DMI*slow_w) + (CCI*slow_w) + (Aroon*slow_w) + (ZLEMA*fast_w) + (IIRF*fast_w)) / (3*slow_w + 2*fast_w), 2)
Backtest Mode and Performance Metrics
This version of the RSI Weighted Trend System includes a comprehensive backtesting mode, allowing users to evaluate the performance of their selected settings against a Buy & Hold strategy. The backtesting includes:
Equity calculation based on the signals generated by the indicator.
Performance metrics table comparing Buy & Hold strategy metrics with the system’s signals, including: Mean, positive, and negative return percentages, Standard deviations (of all, positive and negative returns), Sharpe Ratio, Sortino Ratio, and Omega Ratio
f_PerformanceMetrics(series float base, int Lookback, simple float startDate, bool Annualize = true) =>
// Initialize variables for positive and negative returns
pos_sum = 0.0
neg_sum = 0.0
pos_count = 0
neg_count = 0
returns_sum = 0.0
returns_squared_sum = 0.0
pos_returns_squared_sum = 0.0
neg_returns_squared_sum = 0.0
// Loop through the past 'Lookback' bars to calculate sums and counts
if (time >= startDate)
for i = 0 to Lookback - 1
r = (base - base ) / base
returns_sum += r
returns_squared_sum += r * r
if r > 0
pos_sum += r
pos_count += 1
pos_returns_squared_sum += r * r
if r < 0
neg_sum += r
neg_count += 1
neg_returns_squared_sum += r * r
float export_array = array.new_float(12)
// Calculate means
mean_all = math.round((returns_sum / Lookback) * 100, 2)
mean_pos = math.round((pos_count != 0 ? pos_sum / pos_count : na) * 100, 2)
mean_neg = math.round((neg_count != 0 ? neg_sum / neg_count : na) * 100, 2)
// Calculate standard deviations
stddev_all = math.round((math.sqrt((returns_squared_sum - (returns_sum * returns_sum) / Lookback) / Lookback)) * 100, 2)
stddev_pos = math.round((pos_count != 0 ? math.sqrt((pos_returns_squared_sum - (pos_sum * pos_sum) / pos_count) / pos_count) : na) * 100, 2)
stddev_neg = math.round((neg_count != 0 ? math.sqrt((neg_returns_squared_sum - (neg_sum * neg_sum) / neg_count) / neg_count) : na) * 100, 2)
// Calculate probabilities
prob_pos = math.round((pos_count / Lookback) * 100, 2)
prob_neg = math.round((neg_count / Lookback) * 100, 2)
prob_neu = math.round(((Lookback - pos_count - neg_count) / Lookback) * 100, 2)
// Calculate ratios
sharpe_ratio = math.round(mean_all / stddev_all * (Annualize ? math.sqrt(Lookback) : 1), 2)
sortino_ratio = math.round(mean_all / stddev_neg * (Annualize ? math.sqrt(Lookback) : 1), 2)
omega_ratio = math.round(pos_sum / math.abs(neg_sum), 2)
// Set values in the array
array.set(export_array, 0, mean_all), array.set(export_array, 1, mean_pos), array.set(export_array, 2, mean_neg),
array.set(export_array, 3, stddev_all), array.set(export_array, 4, stddev_pos), array.set(export_array, 5, stddev_neg),
array.set(export_array, 6, prob_pos), array.set(export_array, 7, prob_neu), array.set(export_array, 8, prob_neg),
array.set(export_array, 9, sharpe_ratio), array.set(export_array, 10, sortino_ratio), array.set(export_array, 11, omega_ratio)
// Export the array
export_array
The metrics help traders assess the effectiveness of their strategy over time and can be used to optimize their settings.
Calibration Mode
A calibration mode is included to assist users in tuning the indicator to their specific needs. In this mode, traders can focus on a specific indicator (e.g., DMI, CCI, Aroon, ZLEMA, IIRF, or RSI) and fine-tune it without interference from other signals.
The calibration plot visualizes the chosen indicator's performance against a zero line, making it easy to see how changes in the indicator’s settings affect its trend detection.
Customization and Default Settings
Important Note: The default settings provided are not optimized for any particular market or asset. They serve as a starting point for experimentation. Traders are encouraged to calibrate the system to suit their own trading strategies and preferences.
The indicator allows deep customization, from selecting which indicators to use, adjusting the lengths of each indicator, smoothing parameters, and the RSI weight system.
Alerts
Traders can set alerts for both long and short signals when the indicator flips, allowing for automated monitoring of potential trading opportunities.

ICT Panther (By Obicrypto) V1 ICT Panther Indicator: Full and Detailed Description
The ICT Panther Indicator, created by Obicrypto, is an advanced technical analysis tool designed specifically for traders looking to identify key price action events based on institutional trading techniques, particularly in the context of the Inner Circle Trader (ICT) methodology. This indicator helps traders spot market structure breaks, order blocks, and potential trade opportunities driven by institutional behaviors in the market. Here's a detailed breakdown of its features and how it works:
What Does the ICT Panther Indicator Do?
1. Market Structure Breaks (MSB) Identification:
The ICT Panther identifies critical points where the market changes direction, commonly referred to as a break of structure (BoS). When the price breaks above or below certain key levels (based on highs and lows or opens and closes), it signals a potential shift in market sentiment. These break-of-structure points are essential for traders to determine whether the market is likely to continue its trend or reverse.
2. Order Blocks Visualization:
The indicator plots demand (bullish) and supply (bearish) boxes, which represent areas where institutional traders might place significant buy or sell orders. These zones, known as order blocks, are areas where the price tends to pause or reverse, giving traders key insights into potential entry and exit points. The indicator shows these areas graphically as colored boxes on the chart, which can be used to plan trades based on market structure and price action.
3. Pivot Point Detection:
The ICT Panther identifies important pivot points by tracking higher highs and lower lows. These pivot points are critical in determining the strength of a trend and can help traders confirm the direction of the market. The indicator uses a unique algorithm to detect two levels of pivot points:
- First-Order Pivots: Major pivot points where the price makes notable highs and lows.
- Second-Order Pivots: Smaller pivot points, useful for detecting microtrends within the larger market structure.
4. Bullish and Bearish Break of Structure Lines:
When a significant market structure break (BoS) occurs, the indicator will automatically draw red lines (for bearish break of structure) and green lines (for bullish break of structure) at key price levels. These lines help traders quickly see where institutional moves have occurred in the past and where potential future price moves could originate from.
5. Tested and Filled Boxes:
The ICT Panther also has a built-in mechanism to dim previously tested order blocks. When the price tests an order block (returns to a previous demand or supply zone), the box's color dims to indicate that the area has already been tested, reducing its significance. If the price fully fills an order block, the box stops plotting, providing a clear and clutter-free chart.
Key Features
1. Market Structure Break (MSB) Trigger:
- The indicator allows users to select between highs/lows or opens/closes as the trigger for market structure breaks. This flexibility lets traders adjust the indicator to suit their personal trading style or the behavior of specific assets.
2. Order Block Detection and Visualization:
- The tool automatically plots bullish and bearish demand and supply boxes, representing institutional order blocks on the chart. These boxes provide visual cues for areas of potential price action, where institutional traders might be active.
3. Second-Order Pivot Highlighting:
- The ICT Panther offers an option to plot second-order pivots, highlighting smaller pivot points within the larger market structure. These pivots can be helpful for short-term traders who need to react to smaller price movements while still keeping the larger trend in mind.
4. Box Test and Fill Delays:
- Users can configure delays for box tests and box fills, meaning the indicator will only mark a box as tested or filled after a certain number of bars. This prevents false signals and helps confirm that a zone is truly significant in the market.
5. Customization and Visual Clarity:
- The indicator is highly customizable, allowing users to turn on or off various features like:
- Displaying second-order pivots.
- Highlighting candles that broke structure.
- Plotting market structure broke lines.
- Showing or hiding tested and filled demand boxes.
- Setting custom delays for box testing and filling to suit different market conditions.
6. Tested and Filled Order Block Visualization:
- The indicator visually adjusts the tested and filled order blocks, dimming tested zones and removing filled zones to avoid clutter on the chart. This ensures that traders can focus on active trading opportunities without distractions from historical data.
How Does It Work?
1. Detecting Market Structure Breaks (BoS):
- The indicator continuously tracks the market for key price action signals. When the price breaks through previous highs or lows (or opens and closes, depending on your selection), the indicator marks this as a break of structure. This is a critical signal used by institutional traders and retail traders alike to determine potential future price movements.
2. Order Block Identification:
- Whenever a bullish break of structure occurs, the indicator plots a green demand box to show the area where institutional buyers might have placed significant orders. Similarly, for a bearish break of structure, it plots a red supply box representing areas where institutional sellers are active.
3. Pivot Analysis and Tracking:
- As the market moves, the indicator continuously updates first-order and second-order pivot points based on highs and lows. These points help traders identify whether the market is trending or consolidating. Traders can use these pivot points in combination with the order blocks to make informed trading decisions.
4. Box Testing and Filling:
- When the price retests an existing order block, the box dims to show it has been tested. If the price fully fills the box, it is no longer shown, which helps traders focus on the most relevant, untested order blocks.
Benefits for Traders
- Improved Decision-Making: With clear visuals and advanced logic based on institutional trading strategies, this indicator provides a deeper understanding of market structure and price action.
- Reduced Clutter: The indicator intelligently manages the display of order blocks and pivot points, ensuring that traders focus only on the most relevant information.
- Adaptability: Whether you are a swing trader or a day trader, the ICT Panther can be adjusted to fit your trading style, offering robust and flexible tools for tracking market structure and order blocks.
- Institutional Edge: By identifying institutional-level order blocks and market structure breaks, traders using this indicator can trade in line with the strategies of large market participants.
Who Should Use the ICT Panther Indicator?
This indicator is ideal for:
- Crypto, Forex, and Stock Traders who want to incorporate institutional trading concepts into their strategies.
- Technical Analysts looking for precise tools to measure the market structure and price action.
- ICT Traders who follow the Inner Circle Trader methodology and want an advanced tool to automate and enhance their analysis.
- Price Action Traders seeking a reliable indicator to track pivot points, order blocks, and market structure breaks.
The ICT Panther Indicator is a powerful, versatile tool that brings institutional trading techniques to the fingertips of retail traders. Whether you are looking to identify key market structure breaks, order blocks, or crucial pivot points, this indicator offers detailed visualizations and customizable options to help you make more informed trading decisions. With its ability to track the activities of institutional traders, the ICT Panther Indicator equips traders with the insights needed to stay ahead of the market and trade with confidence.
With the ICT Panther Indicator, traders can follow the movements of institutional money, making it easier to predict market direction and capitalize on high-probability trading opportunities.
Enjoy it and share it with your friends!

Quarterly Highlight ModelDiscover a new edge in your market analysis with our latest TradingView script. Designed to highlight quarterly performance, this tool not only offers insights into individual companies but also serves as a powerful lens to examine broader market trends.
Key Features:
- Quarterly Highlights: Easily identify and analyze each company's performance across four quarters, with each quarter represented by a unique color for clear visual distinction.
- Trend Analysis: Use quarterly data to spot trends and make informed decisions.
Enhance your trading strategy with deeper insights and a comprehensive view of market conditions. Check it out and let’s revolutionize the way we understand the markets!

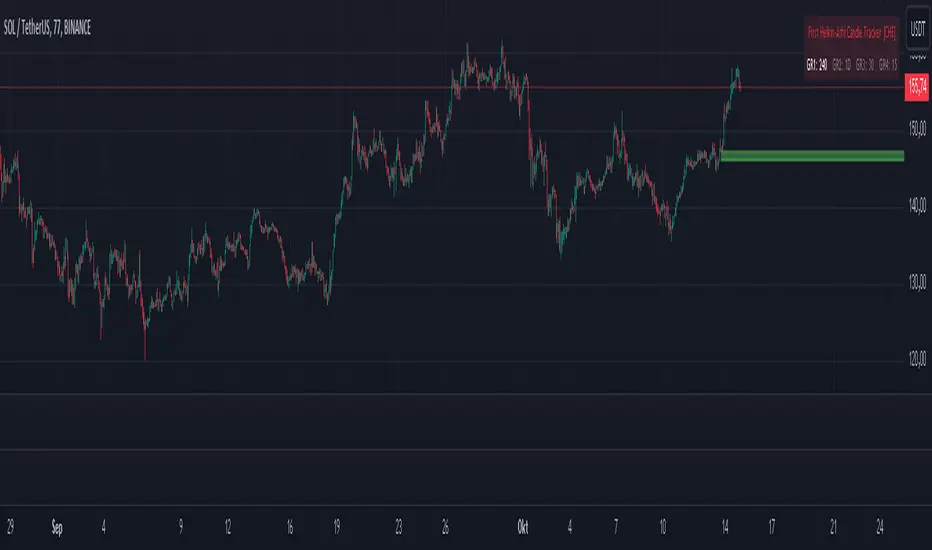
First Heikin-Ashi Candle Tracker [CHE] First Heikin-Ashi Candle Tracker
"A Heikin-Ashi Candle Rarely Comes Alone"
1. Introduction
Fundamental Observation
- "A Heikin-Ashi Candle Rarely Comes Alone"
- This principle highlights the tendency of Heikin-Ashi candles to appear in sequences, indicating sustained trends rather than isolated movements.
- Recognizing these patterns can significantly enhance trading strategies by identifying stronger and more reliable entry points.
2. Understanding Heikin-Ashi Candles
What Are Heikin-Ashi Candles?
- Heikin-Ashi is a type of candlestick chart used to identify market trends more clearly.
- Calculation Method:
- Ha_Close: (Open + High + Low + Close) / 4
- Ha_Open: (Previous Ha_Open + Previous Ha_Close) / 2
- Ha_High: Maximum of High, Ha_Open, Ha_Close
- Ha_Low: Minimum of Low, Ha_Open, Ha_Close
- Visual Differences:
- Smoother appearance compared to traditional candlesticks.
- Helps in filtering out market noise and highlighting the prevailing trend.
Benefits of Heikin-Ashi Candles
- Trend Clarity: Easier identification of uptrends and downtrends.
- Reduced Noise: Minimizes the impact of insignificant price movements.
- Visual Appeal: Cleaner charts enhance decision-making processes.
3. Introducing the First Heikin-Ashi Candle Tracker [CHE ]
Purpose of the Indicator
- Track First Heikin-Ashi Candles: Identifies the initial appearance of Heikin-Ashi candles across multiple timeframes.
- Enhance Trading Decisions: Provides visual cues for potential long and short entries based on trend confirmations.
Key Features
- Multi-Timeframe Support: Monitor Heikin-Ashi candles across different timeframes (e.g., 240, 60, 30, 15 minutes).
- Customizable Visuals: Adjustable colors and line widths for better chart integration.
- User-Friendly Interface: Easy-to-configure settings tailored to individual trading preferences.
- Max Line Management: Controls the number of displayed lines to maintain chart clarity.
4. How to Use the First Heikin-Ashi Candle Tracker
Step-by-Step Guide
1. Enable Desired Groups:
- Activate up to four groups, each representing a different timeframe.
- Customize each group's settings according to your trading strategy.
2. Configure Timeframes:
- Select timeframes that align with your trading style (e.g., short-term vs. long-term).
3. Set Candle Types to Track:
- Choose to monitor Both, Green (Bullish), or Red (Bearish) Heikin-Ashi candles.
- Focus on specific candle types to streamline entry signals.
4. Customize Visual Indicators:
- Adjust Green Line Color and Red Line Color for clear distinction.
- Modify Line Width to ensure visibility without cluttering the chart.
5. Manage Line Limits:
- Set the Max Number of Lines to prevent overcrowding.
- The indicator will automatically remove the oldest lines when the limit is exceeded.
6. Interpret Signals:
- Green Lines: Indicate potential Long entry points.
- Red Lines: Indicate potential Short entry points.
- Observe the sequence and frequency of candles to assess trend strength.
Practical Example
- Uptrend Identification:
- Consecutive green Heikin-Ashi candles with corresponding green lines signal a strong upward trend.
- Consider entering a Long position when the first green candle appears.
- Downtrend Identification:
- Consecutive red Heikin-Ashi candles with corresponding red lines signal a strong downward trend.
- Consider entering a Short position when the first red candle appears.
5. Benefits and Utility
Enhanced Trend Detection
- Early Signals: Identify the beginning of new trends promptly.
- Confirmation: Multiple timeframes provide robust confirmation of trend direction.
Improved Entry Points
- Precision: Pinpoint optimal moments to enter trades, reducing the risk of false signals.
- Flexibility: Suitable for both Long and Short strategies across various markets.
User-Friendly Operation
- Intuitive Settings: Easily configurable to match individual trading preferences.
- Visual Clarity: Clear lines and color-coding facilitate quick decision-making.
Time Efficiency
- Automated Tracking: Saves time by automatically identifying and marking relevant candles.
- Multi-Timeframe Analysis: Consolidates information from different timeframes into a single view.
6. Why Use the First Heikin-Ashi Candle Tracker ?
Strategic Advantages
- Market Insight: Gain deeper understanding of market dynamics through Heikin-Ashi analysis.
- Risk Management: Improved entry points contribute to better risk-reward ratios.
- Versatility: Applicable to various trading instruments, including stocks, forex, and cryptocurrencies.
Why Heikin-Ashi for Entries?
- Trend Reliability: Heikin-Ashi candles smooth out price data, providing more reliable trend indicators.
- Reduced Whipsaws: Fewer false signals compared to traditional candlestick charts.
- Clarity in Decision-Making: Simplifies the process of identifying and acting on market trends.
Conclusion
- The First Heikin-Ashi Candle Tracker is an essential tool for traders seeking to enhance their trend analysis and improve entry strategies.
- By leveraging the power of Heikin-Ashi candles, this indicator offers a clear, user-friendly approach to identifying profitable trading opportunities.
7. Getting Started
Installation
1. Add the Indicator:
- Open TradingView and navigate to the Pine Script editor.
- Paste the translated Pine Script code for the First Heikin-Ashi Candle Tracker .
- Save and add the indicator to your chart.
2. Configure Settings:
- Enable desired groups and set appropriate timeframes.
- Customize colors and line widths as per your preference.
- Adjust the maximum number of lines to maintain chart clarity.
3. Start Trading:
- Monitor the chart for green and red lines indicating potential Long and Short entries.
- Combine with other analysis tools for enhanced trading decisions.
Support and Resources
- Documentation: Refer to the included comments within the Pine Script for detailed explanations.
- Community Forums: Join TradingView communities for tips and shared experiences.
- Customer Support: Reach out for assistance with installation or configuration issues.
8. Disclaimer
The content provided, including all code and materials, is strictly for educational and informational purposes only. It is not intended as, and should not be interpreted as, financial advice, a recommendation to buy or sell any financial instrument, or an offer of any financial product or service. All strategies, tools, and examples discussed are provided for illustrative purposes to demonstrate coding techniques and the functionality of Pine Script within a trading context.
Any results from strategies or tools provided are hypothetical, and past performance is not indicative of future results. Trading and investing involve high risk, including the potential loss of principal, and may not be suitable for all individuals. Before making any trading decisions, please consult with a qualified financial professional to understand the risks involved.
By using this script, you acknowledge and agree that any trading decisions are made solely at your discretion and risk.
Happy Trading!
Best regards
Chervolino (Volker)
MSTR-BTC PremiumThis custom indicator, “MSTR-BTC Premium with High, Average, and Low Levels,” helps you analyze the premium of MicroStrategy Incorporated’s (MSTR) stock price in relation to its Bitcoin holdings. By comparing the market capitalization of MSTR to the value of its Bitcoin holdings (using BTCUSD from Coinbase), this indicator calculates a premium that reflects how much the stock price deviates from its Bitcoin-related value.
Key Features:
• Premium Line: The primary feature is the “Premium,” which shows the ratio of MSTR’s market cap relative to its Bitcoin holdings and the BTCUSD price.
• High, Average, and Low Levels: The indicator calculates the highest, lowest, and average premium values over a user-defined period (default is 14 bars). These levels help identify overbought and oversold conditions relative to the stock’s Bitcoin valuation.
• Visual Shading: The area between the premium line and the average is shaded, making it easier to see when the premium is above or below its typical level. Optional shading is also available between the high and low levels to visualize the price range.
How to Use:
• Overbought/Undervalued Conditions: When the premium line rises significantly above the average, it may indicate that MSTR stock is overbought compared to its Bitcoin holdings. Conversely, when the premium falls below the average or approaches the low line, it might signal an undervalued opportunity.
• Trend and Mean Reversion: The high and low lines provide insight into extreme levels. Monitoring these alongside the average can assist in identifying potential mean reversion trades.
Customization:
• Calculation Period: The period for calculating the high, low, and average values can be adjusted to suit your trading strategy (default is 14).
• Shading Options: By default, the area between the premium and its average is shaded. You can enable or disable the shading between the high and low as needed.
This indicator is particularly useful for traders and investors following MicroStrategy (MSTR) and its Bitcoin strategy, providing a deeper understanding of the stock’s relationship to its underlying Bitcoin assets. It can assist in identifying key levels for decision-making based on deviations from historical norms.
How to Add the Indicator:
1. Adjust the calculation period (default is 14) to customize the analysis according to your preferred timeframe.
2. Watch for significant deviations of the premium line from its average to identify potential overbought/oversold conditions.
3. Use the high and low levels to help gauge extreme premium values and possible mean reversion opportunities.
Enjoy the analysis and make more informed decisions with the MSTR-BTC Premium Indicator!
This description should be clear and informative for anyone considering using your indicator. It highlights the functionality, purpose, and customization options in a straightforward way. Let me know if you’d like to tweak or adjust any part of it!

MomentumSignal Kit RSI-MACD-ADX-CCI-CMF-TSI-EStoch// ----------------------------------------
// Description:
// ----------------------------------------
// MomentumKit RSI/MACD-ADX-CCI-CMF-TSI-EStoch Suite is a comprehensive momentum indicator suite designed to provide robust buy and sell signals through the consensus of multiple normalized momentum indicators. This suite integrates the following indicators:
// - **Relative Strength Index (RSI)**
// - **Stochastic RSI**
// - **Moving Average Convergence Divergence (MACD)** with enhanced logic
// - **True Strength Index (TSI)**
// - **Commodity Channel Index (CCI)**
// - **Chaikin Money Flow (CMF)**
// - **Average Directional Index (ADX)**
// - **Ehlers' Stochastic**
//
// **Key Features:**
// 1. **Normalization:** Each indicator is normalized to a consistent scale, facilitating easier comparison and interpretation across different momentum metrics. This uniform scaling allows traders to seamlessly analyze multiple indicators simultaneously without the confusion of differing value ranges.
//
// 2. **Consensus-Based Signals:** By combining multiple indicators, MomentumKit generates buy and sell signals based on the agreement among various momentum measurements. This multi-indicator consensus approach enhances signal reliability and reduces the likelihood of false positives.
//
// 3. **Overlap Analysis:** The normalization process aids in identifying overlapping signals, where multiple indicators point towards a potential change in price or momentum. Such overlaps are strong indicators of significant market movements, providing traders with timely and actionable insights.
//
// 4. **Enhanced Logic for MACD:** The MACD component within MomentumKit utilizes enhanced logic to improve its responsiveness and accuracy in detecting trend changes.
//
// 5. **Debugging Features:** MomentumKit includes advanced debugging tools that display individual buy and sell signals generated by each indicator. These features are intended for users with technical and programming skills, allowing them to:
// - **Visualize Signal Generation:** See real-time buy and sell signals for each integrated indicator directly on the chart.
// - **Adjust Signal Thresholds:** Modify the criteria for what constitutes a buy or sell signal for each indicator, enabling tailored analysis based on specific trading strategies.
// - **Filter and Manipulate Signals:** Enable or disable specific indicators' contributions to the overall buy and sell signals, providing flexibility in signal generation.
// - **Monitor Indicator Behavior:** Utilize debug plots and labels to understand how each indicator reacts to market movements, aiding in strategy optimization.
//
// **Work in Progress:**
// MomentumKit is continuously evolving, with ongoing enhancements to its algorithms and user interface. Current debugging features are designed to offer deep insights for technically adept users, allowing for extensive customization and fine-tuning. Future updates aim to introduce more user-friendly interfaces and automated optimization tools to cater to a broader audience.
//
// **Usage Instructions:**
// - **Visibility Controls:** Users can toggle the visibility of individual indicators to focus on specific momentum metrics as needed.
// - **Parameter Adjustments:** Each indicator comes with customizable parameters, allowing traders to fine-tune the suite according to their trading strategies and market conditions.
// - **Debugging Features:** Enable the debugging mode to visualize individual indicator signals and adjust their contribution to the overall buy/sell signals. This requires a basic understanding of the underlying indicators and their operational thresholds.
//
// **Benefits:**
// - **Simplified Analysis:** Normalization simplifies the process of analyzing multiple indicators, making it easier to identify consistent signals across different momentum measurements.
// - **Improved Decision-Making:** Consensus-based signals backed by multiple normalized indicators provide a higher level of confidence in trading decisions.
// - **Versatility:** Suitable for various trading styles and market conditions, MomentumKit offers a versatile toolset for both novice and experienced traders.
//
// **Technical Requirements:**
// - **Programming Knowledge:** To fully leverage the debugging and signal manipulation features, users should possess a foundational understanding of Pine Script and the mechanics of momentum indicators.
// - **Customization Skills:** Ability to adjust indicator parameters and debug filters to align with specific trading strategies.
//
// **Disclaimer:**
// This indicator suite is intended for educational and analytical purposes only and does not constitute financial advice. Trading involves significant risk, and past performance is not indicative of future results. Always conduct your own analysis or consult a qualified financial advisor before making trading decisions.

Trade Entry Detector, Wick to Body Ratio Trade Entry Detector: Wick-to-Body Ratio Strategy with Bollinger Bands
Overview
The Trade Entry Detector is a custom strategy for TradingView that leverages the Bollinger Bands and a unique wick-to-body ratio approach to capture precise entry opportunities. This indicator is designed for traders who want to pinpoint high-probability reversal points when price interacts with Bollinger Bands, all while offering flexible entry fill options.
The strategy performs primary analysis on the daily time frame, regardless of your current chart setting, allowing you to view daily Bollinger Band levels and entry signals even on lower time frames. This approach is suitable for swing traders and short-term traders looking to align intraday moves with higher time frame signals.
How the Strategy Works
1. Bollinger Band Analysis on the Daily Time Frame
Bollinger Bands are calculated using a 20-period simple moving average (SMA) and a standard deviation multiplier (default is 2). These bands dynamically expand and contract based on market volatility, making them ideal for identifying overbought and oversold conditions:
* Upper Band: Indicates potential overbought levels.
* Lower Band: Indicates potential oversold levels.
2. Wick-to-Body Ratio Condition
This strategy places significant emphasis on candle wicks relative to the candle body. Here’s why:
* A large upper wick relative to the body signals potential selling pressure after testing the upper Bollinger Band.
* A large lower wick relative to the body indicates buying support after testing the lower Bollinger Band.
* Ratio Threshold: You can set a minimum wick-to-body ratio (default is 1.0), meaning that the wick must be at least equal in size to the body. This ensures only candles with significant reversals are considered for entry.
3. Flexible Entry Timing
To adapt to various trading styles, the indicator allows you to choose the entry fill timing:
* Daily Close: Enter at the close of the daily candle.
* Daily Open: Enter at the open of the following daily candle.
* HOD (High of Day): Set entry at the daily high, for those who want confirmation of upward momentum.
* LOD (Low of Day): Set entry at the daily low, ideal for confirming downward movement.
4. Position Sizing and Risk Management
The strategy calculates position size based on a fixed risk percentage of your account balance (default is 1%). This approach dynamically adjusts position sizes based on stop-loss distance:
* Stop Loss: Placed at the nearest swing high (for shorts) or swing low (for longs).
* Take Profit: Exits are triggered when the price reaches the opposite Bollinger Band.
5. Order Expiration
Each pending order (long or short) expires after two days if unfilled, allowing for new setups on subsequent candles if conditions are met again.
Using the Trade Entry Detector
Step-by-Step Guide
1. Set the Primary Time Frame
The core calculations run on the daily time frame, but the strategy can be applied to intraday charts (e.g., 65-minute or 15-minute) for deeper insights.
2. Adjust Bollinger Band Settings
* Length: Default is 20, which determines the period for calculating the moving average.
* Standard Deviation Multiplier: Default is 2.0, which sets the width of the bands. Adjusting this can help you capture broader or tighter volatility ranges.
3. Define the Wick-to-Body Ratio
Set the minimum ratio between wick and body (default 1.0). Higher values filter out candles with less wick-to-body contrast, focusing on stronger rejection moves.
4. Choose Entry Fill Timing
Select your preferred fill condition:
* Daily Close: Confirms the trade at the end of the daily session.
* Daily Open: Executes the entry at the open of the next day.
* HOD/LOD: Uses the daily high or low as an additional confirmation for upward or downward moves.
5. Position Sizing and Risk Management
* Set your account balance and risk percentage. The strategy automatically calculates position sizes based on the stop distance to manage risk efficiently.
* Stop Loss and Take Profit points are automatically set based on swing highs/lows and opposing Bollinger Bands, respectively.
Practical Example
Let’s say SPY (S&P 500 ETF) tests the lower Bollinger Band on the daily time frame, with a lower wick that is twice the size of the body (meeting the 1.0 ratio threshold). Here’s how the strategy might proceed:
1. Signal: The lower wick on SPY suggests buying interest at the lower Bollinger Band.
2. Entry Fill Timing: If you’ve selected "Daily Open," the entry order will be placed at the next day's open price.
3. Stop Loss: Positioned at the nearest daily swing low to minimize risk.
4. Take Profit: If SPY price moves up and reaches the upper Bollinger Band, the position is automatically closed.
Indicator Features and Benefits
* Multi-Time Frame Compatibility: Perform daily analysis while tracking signals on any intraday chart.
* Automatic Position Sizing: Tailor risk per trade based on account balance and desired risk percentage.
* Flexible Entry Options: Choose from close, open, HOD, or LOD for optimal timing.
* Effective Trend Reversal Identification: Uses wick-to-body ratio and Bollinger Band interaction to pinpoint potential reversals.
* Dynamic Visualization: Bollinger Bands are displayed on your chosen time frame, allowing seamless intraday tracking.
Summary
The Trade Entry Detector provides a unique, data-driven way to spot reversal points with customizable entry options. By combining Bollinger Bands with wick-to-body ratio conditions, it identifies potential trade setups where price has tested extremes and shown reversal signals. With its flexible entry timing, risk management features, and multi-time frame compatibility, this indicator is ideal for traders looking to blend daily market context with shorter-term execution.
Tips for Usage:
* For swing trading, consider the Daily Open or Close entry options.
* For momentum entries, HOD or LOD may offer better alignment with the direction of the wick.
* Backtest on different assets to find optimal Bollinger Band and wick-to-body settings for your market.
Use this indicator to enhance your understanding of price behavior at key levels and improve the precision of your entry points. Happy trading!

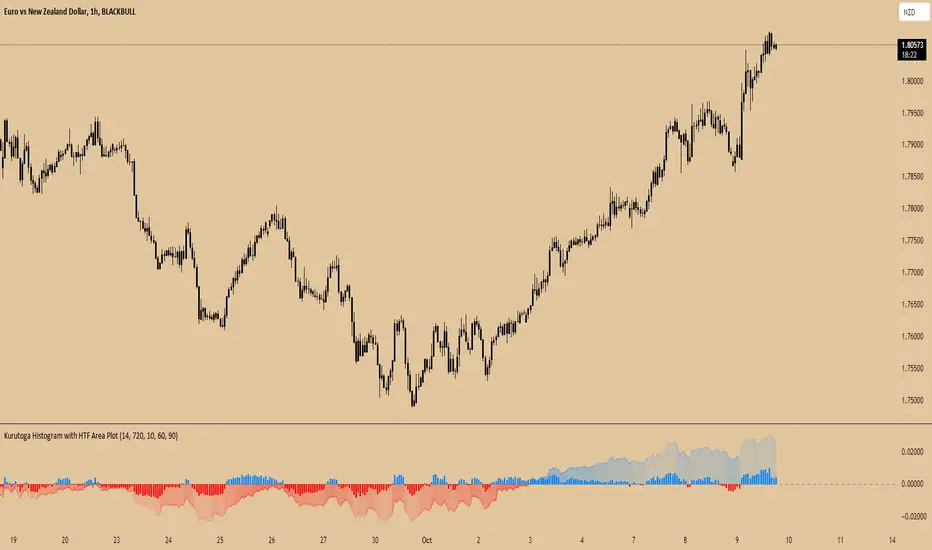
Kurutoga Histogram with HTF and LTF
Kurutoga Histogram:
The Kurutoga Histogram is a technical analysis indicator designed to measure price divergence from the 50% level of a recent price range. By calculating how far the current price is from the midpoint of a selected base length of candles, the histogram provides insight into the momentum, strength, and potential reversals in the market. Additionally, it can be applied across multiple timeframes to provide a comprehensive view of both short- and long-term market dynamics.
Key Components:
Base Length:
The base length is the number of candles (bars) over which the high and low prices are observed. The default base length is typically 14 periods, but it can be adjusted according to the trader's preference.
This base length defines the range from which the 50% level, or midpoint, is calculated.
50% Level (Midpoint):
The midpoint is the average of the highest high and the lowest low over the selected base length. This 50% level acts as an equilibrium point around which the price fluctuates.
Formula:
Midpoint = (Highest High + Lowest Low) / 2
The price’s distance from this midpoint is an indicator of how strong the current trend or divergence is.
Price Divergence:
The main calculation of the histogram is the difference between the current closing price and the midpoint of the price range.
Formula:
Divergence = Close Price − Midpoint
A positive divergence (price above the midpoint) indicates bullish strength, while a negative divergence (price below the midpoint) indicates bearish strength.
Multi-Timeframe Analysis:
The Kurutoga Histogram can be applied to both the current timeframe and a higher timeframe (HTF), allowing traders to gauge price movement in both short-term and long-term contexts.
By comparing the histograms of multiple timeframes, traders can determine if there is alignment (confluence) between trends, which can strengthen trade signals or provide additional confirmation.
Color-Coded Histogram:
Blue Bars (Positive Divergence): Represent that the price is above the 50% level, indicating bullish momentum. Taller blue bars suggest stronger upward momentum, while shrinking bars suggest weakening strength.
Red Bars (Negative Divergence): Represent that the price is below the 50% level, indicating bearish momentum. Taller red bars suggest stronger downward momentum, while shrinking bars suggest a potential reversal or consolidation.
The histogram’s color intensity and transparency can be adjusted to enhance the visual effect, distinguishing between current timeframe (LTF) and higher timeframe (HTF) divergence.
Interpretation:
Bullish Signals: When the histogram bars are blue and growing, the price is gaining momentum above the midpoint of its recent range. This could signal an ongoing uptrend.
Bearish Signals: When the histogram bars are red and growing, the price is gaining momentum below the midpoint, signaling an ongoing downtrend.
Momentum Shifts: When the histogram bars shrink in size (whether blue or red), it could indicate that the current trend is losing strength and may reverse or enter consolidation.
Neutral or Sideways Movement: When the histogram bars hover around zero, it means the price is trading near the midpoint of its recent range, often signaling a lack of strong momentum in either direction.
Multi-Timeframe Confluence:
When the current timeframe (LTF) histogram aligns with the higher timeframe (HTF) histogram (e.g., both are showing strong bullish or bearish divergence), it may provide stronger confirmation of the trend's strength.
Divergence between timeframes (e.g., bullish on LTF but bearish on HTF) may suggest that price movements on lower timeframes are not yet reflected in the broader trend, signaling caution.
Applications:
Trend Identification: The Kurutoga Histogram is highly useful for detecting when the price is trending away from its equilibrium point, providing insight into the strength of ongoing trends.
Momentum Analysis: By measuring the divergence from the 50% level, the histogram helps traders identify when momentum is increasing or decreasing.
Reversal Detection: Shrinking histogram bars can signal weakening momentum, which often precedes trend reversals.
Consolidation and Breakouts: When the histogram remains near zero for an extended period, it suggests consolidation, which often precedes a breakout in either direction.
Advantages:
Clear Visuals: The use of a color-coded histogram makes it easy to visually assess whether the market is gaining bullish or bearish momentum.
Multi-Timeframe Utility: The ability to compare current timeframe signals with higher timeframe signals adds an extra layer of confirmation, reducing false signals.
Dynamic Adjustment: By adjusting the base length, traders can fine-tune the sensitivity of the indicator to match different markets or trading styles.
Limitations:
Lagging Indicator: Like most divergence indicators, the Kurutoga Histogram may lag slightly behind actual price movements, especially during fast, volatile markets.
Requires Confirmation: This indicator works best when used in conjunction with other technical tools like moving averages, support/resistance levels, or volume indicators, to avoid relying on divergence alone.
Conclusion:
The Kurutoga Histogram is a versatile and visually intuitive tool for measuring price divergence from a key equilibrium point, helping traders to assess the strength of trends and identify potential reversal points. Its use across multiple timeframes provides deeper insights, making it a valuable addition to any trading strategy that emphasizes momentum and trend following.
VATICAN BANK CARTELVATICAN BANK CARTEL - Precision Signal Detection for Buyers.
The VATICAN BANK CARTEL indicator is a highly sophisticated tool designed specifically for buyers, helping them identify key market trends and generate actionable buy signals. Utilizing advanced algorithms, this indicator employs a multi-variable detection mechanism that dynamically adapts to price movements, offering real-time insights to assist in executing profitable buy trades. This indicator is optimized solely for identifying buying opportunities, ensuring that traders are equipped to make well-timed entries and exits, without signals for shorting or selling.
The recommended settings for VATICAN BANK CARTEL indicator is as follows:-
Depth Engine = 20,30,40,50,100.
Deviation Engine = 3,5,7,15,20.
Backstep Engine = 15,17,20,25.
NOTE:- But you can also use this indicator as per your setting, whichever setting gives you best results use that setting.
Key Features:
1.Adaptive Depth, Deviation, and Backstep Inputs:
The core of this indicator is its customizable Depth Engine, Deviation Engine, and Backstep Engine parameters. These inputs allow traders to adjust the sensitivity of the trend detection algorithm based on specific market conditions:
Depth: Defines how deep the indicator scans historical price data for potential trend reversals.
Deviation: Determines the minimum required price fluctuation to confirm a market movement.
Backstep: Sets the retracement level to filter false signals and maintain the accuracy of trend detection.
2. Visual Signal Representation:
The VATICAN BANK CARTEL plots highly visible labels on the chart to mark trend reversals. These labels are customizable in terms of size and transparency, ensuring clarity in various chart environments. Traders can quickly spot buying opportunities with green labels and potential square-off points with red labels, focusing exclusively on buy-side signals.
3.Real-Time Alerts:
The indicator is equipped with real-time alert conditions to notify traders of significant buy or square-off buy signals. These alerts, which are triggered based on the indicator’s internal signal logic, ensure that traders never miss a critical market movement on the buy side.
4.Custom Label Size and Transparency:
To enhance visual flexibility, the indicator allows the user to adjust label size (from small to large) and transparency levels. This feature provides a clean, adaptable view suited for different charting styles and timeframes.
How It Works:
The VATICAN BANK CARTEL analyzes the price action using a sophisticated algorithm that considers historical low and high points, dynamically detecting directional changes. When a change in market direction is detected, the indicator plots a label at the key reversal points, helping traders confirm potential entry points:
- Buy Signal (Green): Indicates potential buying opportunities based on a trend reversal.
- Square-Off Buy Signal (Red): Marks the exit point for open buy positions, allowing traders to take profits or protect capital from potential market reversals.
Note: This indicator is exclusively designed to provide signals for buyers. It does not generate sell or short signals, making it ideal for traders focused solely on identifying optimal buying opportunities in the market.
Customizable Parameters:
- Depth Engine: Fine-tunes the historical data analysis for signal generation.
- Deviation Engine: Adjusts the minimum price change required for detecting trends.
- Backstep Engine: Controls the indicator's sensitivity to retracements, minimizing false signals.
- Labels Transparency: Adjusts the opacity of the labels, ensuring they integrate seamlessly into any chart layout.
- Buy and Sell Colors: Customizable color options for buy and square-off buy labels to match your preferred color scheme.
- Label Size: Select between five different label sizes for optimal chart visibility.
Ideal For:
This indicator is ideal for both beginner and experienced traders looking to enhance their buying strategy with a highly reliable, visual, and alert-driven tool. The VATICAN BANK CARTEL adapts to various timeframes, making it suitable for day traders, swing traders, and long-term investors alike—focused exclusively on buying opportunities.
Benefits and Applications:
1.Intraday Trading: The VATICAN BANK CARTEL indicator is particularly well-suited for intraday trading, as it provides accurate and timely "buy" and "square-off buy" signals based on the current market dynamics.
2.Trend-following Strategies: Traders who employ trend-following strategies can leverage the indicator's ability to identify the overall market direction, allowing them to align their trades with the dominant trend.
3.Swing Trading: The dynamic price tracking and signal generation capabilities of the indicator can be beneficial for swing traders, who aim to capture medium-term price movements.
Security Measures:
1. The code includes a security notice at the beginning, indicating that it is subject to the Mozilla Public License 2.0, which is a reputable open-source license.
2. The code does not appear to contain any obvious security vulnerabilities or malicious content that could compromise user data or accounts.
NOTE:- This indicator is provided under the Mozilla Public License 2.0 and is subject to its terms and conditions.
Disclaimer: The usage of VATICAN BANK CARTEL indicator might or might not contribute to your trading capital(money) profits and losses and the author is not responsible for the same.
IMPORTANT NOTICE:
While the indicator aims to provide reliable "buy" and "square-off buy" signals, it is crucial to understand that the market can be influenced by unpredictable events, such as natural disasters, political unrest, changes in monetary policies, or economic crises. These unforeseen situations may occasionally lead to false signals generated by the VATICAN BANK CARTEL indicator.
Users should exercise caution and diligence when relying on the indicator's signals, as the market's behavior can be unpredictable, and external factors may impact the accuracy of the signals. It is recommended to thoroughly backtest the indicator's performance in various market conditions and to use it as one of the many tools in a comprehensive trading strategy, rather than solely relying on its output.
Ultimately, the success of the VATICAN BANK CARTEL indicator will depend on the user's ability to adapt it to their specific trading style, market conditions, and risk management approach. Continuous monitoring, analysis, and adjustment of the indicator's settings may be necessary to maintain its effectiveness in the ever-evolving financial markets.
DEVELOPER:- yashgode9
PineScript:- version:- 5
This indicator aims to enhance trading decision-making by combining DEPTH, DEVIATION, BACKSTEP with custom signal generation, offering a comprehensive tool for traders seeking clear "buy" and "square-off buy" signals on the TradingView platform.
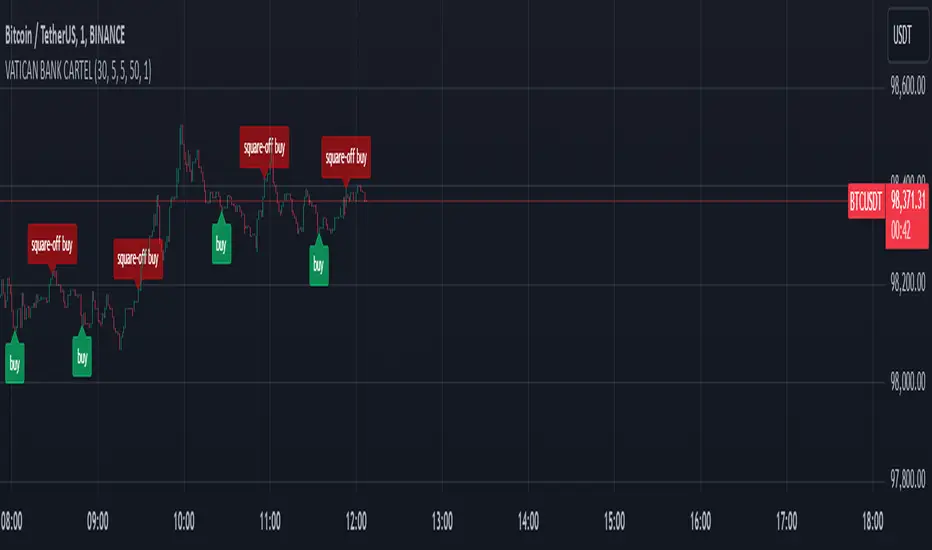
Iceberg Trade Revealer [CHE]Unveiling Iceberg Trades: A Deep Dive into Low Volatility Market Phases
Introduction
In the dynamic world of trading, hidden forces often influence market movements in ways that aren't immediately apparent. One such force is the phenomenon of iceberg trades—large orders that are concealed to prevent significant market impact. This presentation explores the concept of iceberg trades, explains why they are typically hidden during periods of low volatility, and introduces an indicator designed to reveal these elusive trades.
Agenda
1. Understanding Iceberg Trades
- Definition and Purpose
- Impact on Market Dynamics
2. The Low Volatility Concealment
- Why Low Volatility Phases?
- Strategies Behind Hiding Large Orders
3. Introducing the Iceberg Trade Revealer Indicator
- How the Indicator Works
- Key Components and Calculations
4. Demonstration and Use Cases
- Interpreting the Indicator Signals
- Practical Trading Applications
5. Conclusion
- Summarizing the Insights
- Q&A Session
1. Understanding Iceberg Trades
Definition and Purpose
- Iceberg Trades are large single orders divided into smaller lots to disguise the total order quantity.
- Traders use iceberg orders to minimize market impact and avoid unfavorable price movements.
Impact on Market Dynamics
- Concealed Volume: Iceberg orders hide true supply and demand levels.
- Price Stability: They prevent sudden spikes or drops by releasing orders gradually.
- Market Sentiment: Their presence can influence perceptions of market strength or weakness.
2. The Low Volatility Concealment
Why Low Volatility Phases?
- Less Market Attention: Low volatility periods attract fewer traders, making it easier to conceal large orders.
- Reduced Slippage: Prices are more stable, reducing the risk of executing orders at unfavorable prices.
- Strategic Advantage: Large players can accumulate or distribute positions without tipping off the market.
Strategies Behind Hiding Large Orders
- Order Splitting: Breaking down large orders into smaller pieces.
- Time Slicing: Executing orders over an extended period.
- Algorithmic Trading: Using sophisticated algorithms to optimize order execution.
3. Introducing the Iceberg Trade Revealer Indicator
How the Indicator Works
- Core Thesis: Iceberg trades can be detected by analyzing periods of unusually low volatility.
- Volatility Analysis: Uses the Average True Range (ATR) and Bollinger Bands to identify low volatility phases.
- Signal Generation: Marks periods where iceberg trades are likely occurring.
Key Components and Calculations
1. Average True Range (ATR)
- Measures market volatility over a specified period.
- Lower ATR values indicate less price movement.
2. Bollinger Bands
- Creates a volatility envelope around the ATR.
- Bands tighten during low volatility and widen during high volatility.
3. Timeframe Adjustments
- Utilizes multiple timeframes to enhance signal accuracy.
- Options for auto, multiplier, or manual timeframe selection.
4. Signal Conditions
- Iceberg Trade Detection: ATR falls below the lower Bollinger Band.
- Revealed Volatility: ATR rises above the upper Bollinger Band, indicating potential market moves after iceberg trades.
4. Demonstration and Use Cases
Interpreting the Indicator Signals
- Iceberg Trade Zones: Highlighted areas where large hidden orders are likely.
- Revealed Volatility Zones: Areas indicating the market's response to the execution of iceberg trades.
Practical Trading Applications
- Entry and Exit Points: Use signals to time trades alongside institutional activity.
- Risk Management: Adjust strategies during detected low volatility phases.
- Market Analysis: Gain insights into underlying market mechanics.
5. Conclusion
Summarizing the Insights
- Iceberg Trades play a significant role in market movements, especially when concealed during low volatility phases.
- The Iceberg Trade Revealer Indicator provides a tool to uncover these hidden activities, offering traders a strategic edge.
- Understanding and utilizing this indicator can enhance trading decisions by aligning them with the actions of major market players.
Best regards Chervolino ( Volker )
Q&A Session
- Questions and Discussions: Open the floor for any queries or further explanations.
Thank You!
By delving into the hidden aspects of market activity, traders can better navigate the complexities of financial markets. The Iceberg Trade Revealer Indicator serves as a bridge between observable market data and the concealed strategies of large institutions.
References
- Average True Range (ATR): A technical analysis indicator that measures market volatility.
- Bollinger Bands: A volatility indicator that creates a band of three lines which are plotted in relation to a security's price.
- Iceberg Orders: Large orders divided into smaller lots to hide the actual order quantity.
Note: Always consider multiple factors when making trading decisions. Indicators provide tools, but they do not guarantee results.
Educational Content Disclaimer:
Disclaimer:
The content provided, including all code and materials, is strictly for educational and informational purposes only. It is not intended as, and should not be interpreted as, financial advice, a recommendation to buy or sell any financial instrument, or an offer of any financial product or service. All strategies, tools, and examples discussed are provided for illustrative purposes to demonstrate coding techniques and the functionality of Pine Script within a trading context.
Any results from strategies or tools provided are hypothetical, and past performance is not indicative of future results. Trading and investing involve high risk, including the potential loss of principal, and may not be suitable for all individuals. Before making any trading decisions, please consult with a qualified financial professional to understand the risks involved.
By using this script, you acknowledge and agree that any trading decisions are made solely at your discretion and risk.
Fibonacci Swing Trading BotStrategy Overview for "Fibonacci Swing Trading Bot"
Strategy Name: Fibonacci Swing Trading Bot
Version: Pine Script v5
Purpose: This strategy is designed for swing traders who want to leverage Fibonacci retracement levels and candlestick patterns to enter and exit trades on higher time frames.
Key Components:
1. Multiple Timeframe Analysis:
The strategy uses a customizable timeframe for analysis. You can choose between 4hour, daily, weekly, or monthly time frames to fit your preferred trading horizon. The high and low-price data is retrieved from the selected timeframe to identify swing points.
2. Fibonacci Retracement Levels:
The script calculates two key Fibonacci retracement levels:
0.618: A common level where price often retraces before resuming its trend.
0.786: A deeper retracement level, often used to identify stronger support/resistance areas.
These levels are dynamically plotted on the chart based on the highest high and lowest low over the last 50 bars of the selected timeframe.
3. Candlestick Based Entry Signals:
The strategy uses candlestick patterns as the only indicator for trade entries:
Bullish Candle: A green candle (close > open) that forms between the 0.618 retracement level and the swing high.
Bearish Candle: A red candle (close < open) that forms between the 0.786 retracement level and the swing low.
When these candlestick patterns align with the Fibonacci levels, the script triggers buy or sell signals.
4. Risk Management:
Stop Loss: The stop loss is set at 1% below the entry price for long trades and 1% above the entry price for short trades. This tight risk management ensures controlled losses.
Take Profit: The strategy uses a 2:1 risk-to-reward ratio. The take profit is automatically calculated based on this ratio relative to the stop loss.
5. Buy/Sell Logic:
Buy Signal: Triggered when a bullish candle forms above the 0.618 retracement level and below the swing high. The bot then places a long position.
Sell Signal: Triggered when a bearish candle forms below the 0.786 retracement level and above the swing low. The bot then places a short position.
The stop loss and take profit levels are automatically managed once the trade is placed.
Strengths of This Strategy:
Swing Trading Focus: The strategy is ideal for swing traders, targeting longer-term price moves that can take days or weeks to play out.
Simple Yet Effective Indicators: By only relying on Fibonacci retracement levels and basic candlestick patterns, the strategy avoids complexity while capitalizing on well-known support and resistance zones.
Automated Risk Management: The built-in stop loss and take profit mechanism ensures trades are protected, adhering to a strict 2:1 risk/reward ratio.
Multiple Timeframe Analysis: The script adapts to various market conditions by allowing users to switch between different timeframes (4hour, daily, weekly, monthly), giving traders flexibility.
Strategy Use Cases:
Retracement Traders: Traders who focus on entering the market at key retracement levels (0.618 and 0.786) will find this strategy especially useful.
Trend Reversal Traders: The strategy’s reliance on candlestick formations at Fibonacci levels helps traders spot potential reversals in price trends.
Risk Conscious Traders: With its 1% risk per trade and 2:1 risk/reward ratio, the strategy is ideal for traders who prioritize risk management in their trades.

Qualitative and Quantitative Candlestick Score [CHE] Qualitative and Quantitative Candlestick Score
Overview
The Qualitative and Quantitative Candlestick Score is a powerful indicator for TradingView that combines both qualitative and quantitative analyses of candlestick patterns. This indicator provides traders with a comprehensive assessment of market conditions to make informed trading decisions.
Key Features
- Quantitative Analysis: Calculates a quantitative score based on the price movement of each candle.
- Qualitative Analysis: Evaluates candles based on body size, wick size, trend, and trading volume.
- Cumulative Scores: Displays cumulative green (bullish) and red (bearish) scores over a defined period.
- Trend Analysis: Identifies trend direction, strength, and provides trading recommendations (Long/Short).
- Customizable Settings: Adjust parameters for time periods, thresholds, and volume analysis.
Settings and Customizations
1. Time Period Settings:
- Period: Number of periods to calculate moving averages and cumulative scores (Default: 14).
2. Qualitative Evaluation:
- Body Size Threshold (%): Minimum size of the candle body to be considered significant (Default: 0.5%).
- Wick Size Threshold (%): Maximum size of the wicks to be considered minimal (Default: 0.3%).
3. Volume Settings:
- Include Volume in Evaluation: Whether to include trading volume in the qualitative score (Default: Enabled).
- Volume MA Period: Number of periods to calculate the moving average of volume (Default: 14).
4. Trend Settings:
- Moving Average Length: Number of periods for the Simple Moving Average used to determine the trend (Default: 50).
Calculations and Visualizations
- Quantitative Score: Difference between the closing and opening price, normalized to the opening price.
- Qualitative Score: Evaluation based on body size, wick size, trend, and volume.
- Cumulative Scores: Average of green and red scores over the defined period.
- Score Difference: Difference between cumulative green and red scores to determine trend direction.
- Trend Analysis Table: Displays trend direction, trend strength, and trading recommendation in an easy-to-read table.
Plotting and Display
- Cumulative Scores: Displays cumulative green and red scores in green and red colors.
- Score Difference: Blue line chart to visualize the difference between green and red scores.
- Zero Line: Horizontal gray line as a reference point.
- Trend Analysis Table: Table in the top right of the chart showing current trend direction, strength, and trading recommendation.
Use Cases
- Trend Identification: Use the score difference and trend analysis table to quickly assess the current market sentiment.
- Trading Recommendations: Based on the table, decide whether a long or short entry is appropriate.
- Volume Analysis: Including volume helps to better understand the strength of a trend.
Benefits
- Comprehensive Analysis: Combines quantitative and qualitative methods for a deeper market analysis.
- User-Friendly: Easy parameter adjustments allow for personalized use.
- Visually Appealing: Clear charts and tables facilitate data interpretation.
- Flexible: Adaptable to various trading strategies and timeframes.
Installation and Usage
1. Installation:
- Copy the provided Pine Script code.
- Go to TradingView and open the Pine Script Editor.
- Paste the code and save the script.
- Add the indicator to your chart.
2. Customization:
- Adjust the parameters according to your trading preferences.
- Monitor the cumulative scores and the trend analysis table for trading decisions.
Conclusion
The Qualitative and Quantitative Candlestick Score offers a comprehensive analysis of market conditions by combining quantitative and qualitative evaluation methods. With its user-friendly settings and clear visualizations, this indicator is a valuable tool for traders seeking informed and precise trading decisions.
Best regards and happy trading
Chervolino
Developed by: Chervolino
Version: 1.0
License: Free to use and customize on TradingView.
For any questions or feedback, feel free to contact me through the TradingView community.
Note: This indicator is a tool to assist with trading decisions and does not replace professional financial advice. Use it responsibly and thoroughly test it before incorporating it into your trading strategies.
MTF Squeeze Analyzer - [tradeviZion]MTF Squeeze Analyzer
Multi-Timeframe Squeeze Pro Analyzer Tool
Overview:
The MTF Squeeze Analyzer is a comprehensive tool designed to help traders monitor the TTM Squeeze indicator across multiple timeframes in a streamlined and efficient manner. Built with Pine Script™ version 5, this indicator enhances your market analysis by providing detailed insights into squeeze conditions and momentum shifts, enabling you to make more informed trading decisions.
Key Features:
1. Multi-Timeframe Monitoring:
Comprehensive Coverage: Track squeeze conditions across multiple timeframes, including 1-minute, 5-minute, 15-minute, 30-minute, 1-hour, 2-hour, 4-hour, and daily charts.
Squeeze Counts: Keep count of the number of consecutive bars the price has been within each squeeze level (low, mid, high), helping you assess the strength and duration of consolidation periods.
2. Dynamic Table Display:
Customizable Appearance: Adjust table position, text size, and colors to suit your preferences.
Color-Coded Indicators: Easily identify squeeze levels and momentum shifts with intuitive color schemes.
Message Integration: Features rotating messages to keep you engaged and informed.
3. Alerts for Key Market Events:
Squeeze Start and Fire Alerts: Receive notifications when a squeeze starts or fires on your selected timeframes.
Custom Squeeze Count Alerts: Set thresholds for squeeze counts and get alerted when these levels are reached, allowing you to anticipate potential breakouts.
Fully Customizable: Choose which alerts you want to receive and tailor them to your trading strategy.
4. Momentum Analysis:
Momentum Oscillator: Visualize momentum using a histogram that changes color based on momentum shifts.
Detailed Insights: Determine whether momentum is increasing or decreasing to make more strategic trading decisions.
How It Works:
The indicator is based on the TTM Squeeze concept, which identifies periods of low volatility where the market is "squeezing" before a potential breakout. It analyzes the relationship between Bollinger Bands and Keltner Channels to determine squeeze conditions and uses linear regression to calculate momentum.
1. Squeeze Levels:
No Squeeze (Green): Market is not in a squeeze.
Low Compression Squeeze (Gray): Mild consolidation, potential for a breakout.
Mid Compression Squeeze (Red): Moderate consolidation, higher breakout potential.
High Compression Squeeze (Orange): Strong consolidation, significant breakout potential.
2. Squeeze Counts:
Tracks the number of consecutive bars in each squeeze condition.
Helps identify how long the market has been consolidating, providing clues about potential breakout timing.
3. Momentum Histogram:
Upward Momentum: Shown in aqua or blue, indicating increasing or decreasing upward momentum.
Downward Momentum: Displayed in red or yellow, representing increasing or decreasing downward momentum.
Using Alerts:
Stay ahead of market movements with customizable alerts:
1. Enable Alerts in Settings:
Squeeze Start Alert: Get notified when a new squeeze begins.
Squeeze Fire Alert: Be alerted when a squeeze ends, signaling a potential breakout.
Squeeze Count Alert: Set a specific number of bars for a squeeze condition, and receive an alert when this count is reached.
2. Set Up Alerts on Your Chart:
Click on the indicator name and select " Add Alert on MTF Squeeze Analyzer ".
Choose your desired alert conditions and customize the notification settings.
Click " Create " to activate the alerts.
How to Set It Up:
1. Add the Indicator to Your Chart:
Search for " MTF Squeeze Analyzer " in the TradingView Indicators library.
Add it to your chart.
2. Customize Your Settings:
Table Display:
Choose whether to show the table and select its position on the chart.
Adjust text size and colors to enhance readability.
Timeframe Selection:
Select the timeframes you want to monitor.
Enable or disable specific timeframes based on your trading strategy.
Colors & Styles:
Customize colors for different squeeze levels and momentum shifts.
Adjust header and text colors to match your chart theme.
Alert Settings:
Enable alerts for squeeze start, squeeze fire, and squeeze counts.
Set your preferred squeeze type and count threshold for alerts.
3. Interpret the Data:
Table Information:
The table displays the squeeze status and counts for each selected timeframe.
Colors indicate the type of squeeze, making it easy to assess market conditions at a glance.
Momentum Histogram:
Use the histogram to gauge the strength and direction of market momentum.
Observe color changes to identify shifts in momentum.
Why Use MTF Squeeze Analyzer ?
Enhanced Market Insight:
Gain a deeper understanding of market dynamics by monitoring multiple timeframes simultaneously.
Identify potential breakout opportunities by analyzing squeeze durations and momentum shifts.
Customizable and User-Friendly:
Tailor the indicator to fit your trading style and preferences.
Easily adjust settings without needing to delve into the code.
Time-Efficient:
Save time by viewing all relevant squeeze information in one place.
Reduce the need to switch between different charts and timeframes.
Stay Informed with Alerts:
Never miss a critical market movement with fully customizable alerts.
Focus on other tasks while the indicator monitors the market for you.
Acknowledgment:
This tool builds upon the foundational work of John Carter , who developed the TTM Squeeze concept. It also incorporates enhancements from LazyBear and Makit0 , providing a more versatile and powerful indicator. MTF Squeeze Analyzer extends these concepts by adding multi-timeframe analysis, squeeze counting, and advanced alerting features, offering traders a comprehensive solution for market analysis.
Note: Always practice proper risk management and test the indicator thoroughly to ensure it aligns with your trading strategy. Past performance is not indicative of future results.
Trade smarter with TradeVizion—unlock your trading potential today!

Strength/Weakness IndicatorThe Strength/Weakness Indicator is a customisable tool designed to help traders identify key areas of market strength and weakness based on the 50% Fibonacci retracement level .
█ Underlying Concept:
The concept behind this indicator draws heavily on the principles of Fibonacci retracement and WD Gann’s market theories , particularly the importance of the 50% level in signalling critical psychological areas of support and resistance. Historically, the 50% retracement level has been regarded as a key marker where markets either find new buyers/sellers or continue a trend. Gann himself placed significant emphasis on the halfway point of a previous market move as a critical level for market strength and reversal.
Strength : When an asset is trading above the 50% retracement level, it suggests that buyers are in control and that the market is showing strength. This is particularly useful for traders aiming to ride the continuation of an uptrend.
Weakness : Conversely, when the price falls below the 50% retracement level, it indicates that sellers are dominating, and the market is showing signs of weakness. This can be an early indication of a potential reversal or further decline.
█ Key Features:
1 — Multi-Timeframe Fibonacci Analysis :
This indicator supports up to two distinct retracement levels, allowing traders to analyse multiple timeframes simultaneously. Customise the look-back periods for each level to track the highest high and lowest low over your chosen period.
The tool is adaptable to short-term, swing trading, and long-term investing, making it useful across different trading styles.
2 — Dynamic Strength/Weakness Labelling :
The script dynamically calculates and displays whether the asset is “STRONG” or “WEAK” based on its position relative to the 50% retracement levels. If the price is above both levels, it is considered "VERY STRONG." Conversely, trading below both levels signals "VERY WEAK" conditions. This real-time feedback helps traders gauge market sentiment with ease.
3 — Customizable Visual Representation :
Both retracement levels are fully customisable, including line colours, styles, and thicknesses. The script offers custom background fills—highlighting areas of strength (green) and weakness (red)—to provide a clear visual aid for identifying key price zones.
Traders can modify the appearance of text labels (size, colour, position) and choose whether to extend lines left, right, both directions, or not at all.
4 — Cross-Timeframe Validation :
Traders can cross-reference price action between two timeframes to confirm trends. If both levels signal strength or weakness, it validates market momentum, increasing confidence in trade decisions.
5 — Strategic Decision-Making Aid :
The indicator aids in identifying support and resistance zones based on the 50% retracement level. Use it to time entries and exits effectively: price above the 50% level suggests potential trend continuation, while falling below may indicate reversal.
█ How It Works:
1 — Defining Custom Timeframes :
The trader selects custom time periods (days, weeks, months, or years) to calculate the highest high and lowest low, allowing precise control over the analysis.
2 — Calculating Strength/Weakness :
Once the 50% retracement level is calculated, the price’s position relative to it determines the market’s condition. Above 50% signals strength, below signals weakness.
3 — Comparing Multiple Timeframes :
Enable a second retracement level to compare different time periods. This feature is useful for spotting divergences between short-term and long-term trends or validating strength across timeframes.
█ How to Use:
1 — Assess Market Conditions :
If price trades above both 50% retracement levels, it indicates strong bullish momentum. Conversely, trading below both levels signals bearish conditions.
2 — Plan Entries/Exits :
Use the 50% level as a reference for support and resistance. Plan to enter when the price bounces off the 50% level, or exit if it breaks down below this critical level.
3 — Cross-Timeframe Analysis :
Validate the market trend by comparing retracement levels across different timeframes. This helps in confirming whether the trend is strong enough to justify holding a position.
█ Why This Indicator is Unique:
Comprehensive Multi-Timeframe Analysis : While most Fibonacci indicators focus on a single period, this tool provides a deeper understanding by allowing traders to compare price action across multiple timeframes.
Customizable and Dynamic : The real-time strength/weakness labeling, customizable background fills, and the ability to analyze two retracement levels simultaneously make this tool adaptable to any trading strategy.
Valuable for All Traders : Whether you are day trading, swing trading, or investing long-term, the Strength/Weakness Indicator offers clarity on key market levels and sentiment, improving decision-making for entries and exits.
Disclaimer : This script is for educational purposes and is not financial advice. Trading involves significant risk, so please consult a professional advisor before making investment decisions. For the best results, use this indicator alongside other technical analysis methods like trend lines or moving averages to help you confirm signals and make more informed decisions.
Pivot Points LIVE [CHE]Title:
Pivot Points LIVE Indicator
Subtitle:
Advanced Pivot Point Analysis for Real-Time Trading
Presented by:
Chervolino
Date:
September 24, 2024
Introduction
What are Pivot Points?
Definition:
Pivot Points are technical analysis indicators used to determine potential support and resistance levels in financial markets.
Purpose:
They help traders identify possible price reversal points and make informed trading decisions.
Overview of Pivot Points LIVE :
A comprehensive indicator designed for real-time pivot point analysis.
Offers advanced features for enhanced trading strategies.
Key Features
Pivot Points LIVE Includes:
Dynamic Pivot Highs and Lows:
Automatically detects and plots pivot high (HH, LH) and pivot low (HL, LL) points.
Customizable Visualization:
Multiple options to display markers, price labels, and support/resistance levels.
Fractal Breakouts:
Identifies and marks breakout and breakdown events with symbols.
Line Connection Modes:
Choose between "All Separate" or "Sequential" modes for connecting pivot points.
Pivot Extension Lines:
Extends lines from the latest pivot point to the current bar for trend analysis.
Alerts:
Configurable alerts for breakout and breakdown events.
Inputs and Configuration
Grouping Inputs for Easy Customization:
Source / Length Left / Length Right:
Pivot High Source: High price by default.
Pivot Low Source: Low price by default.
Left and Right Lengths: Define the number of bars to the left and right for pivot detection.
Colors: Customizable colors for pivot high and low markers.
Options:
Display Settings:
Show HH, LL, LH, HL markers and price labels.
Display support/resistance level extensions.
Option to show levels as a fractal chaos channel.
Enable fractal breakout/down symbols.
Line Connection Mode:
Choose between "All Separate" or "Sequential" for connecting lines.
Line Management:
Set maximum number of lines to display.
Customize line colors, widths, and styles.
Pivot Extension Line:
Visibility: Toggle the display of the last pivot extension line.
Customization: Colors, styles, and width for extension lines.
How It Works - Calculating Pivot Points
Pivot High and Pivot Low Detection:
Pivot High (PH):
Identified when a high price is higher than a specified number of bars to its left and right.
Pivot Low (PL):
Identified when a low price is lower than a specified number of bars to its left and right.
Higher Highs, Lower Highs, Higher Lows, Lower Lows:
Higher High (HH): Current PH is higher than the previous PH.
Lower High (LH): Current PH is lower than the previous PH.
Higher Low (HL): Current PL is higher than the previous PL.
Lower Low (LL): Current PL is lower than the previous PL.
Visual Elements
Markers and Labels:
Shapes:
HH and LH: Downward triangles above the bar.
HL and LL: Upward triangles below the bar.
Labels:
Optionally display the price levels of HH, LH, HL, and LL on the chart.
Support and Resistance Levels:
Extensions:
Lines extending from pivot points to indicate potential support and resistance zones.
Chaos Channels:
Display levels as a fractal chaos channel for enhanced trend analysis.
Fractal Breakout Symbols:
Buy Signals: Upward triangles below the bar.
Sell Signals: Downward triangles above the bar.
Slide 7: Line Connection Modes
All Separate Mode:
Description:
Connects pivot highs with pivot highs and pivot lows with pivot lows separately.
Use Case:
Ideal for traders who want to analyze highs and lows independently.
Sequential Mode:
Description:
Connects all pivot points in the order they occur, regardless of being high or low.
Use Case:
Suitable for identifying overall trend direction and momentum.
Pivot Extension Lines
Purpose:
Trend Continuation:
Visualize the continuation of the latest pivot point's price level.
Customization:
Colors:
Differentiate between bullish and bearish extensions.
Styles:
Solid, dashed, or dotted lines based on user preference.
Width:
Adjustable line thickness for better visibility.
Dynamic Updates:
The extension line updates in real-time as new bars form, providing ongoing trend insights.
Alerts and Notifications
Configurable Alerts:
Fractal Break Arrow:
Triggered when a breakout or breakdown occurs.
Long and Short Signals:
Specific alerts for bullish breakouts (Long) and bearish breakdowns (Short).
Benefits:
Timely Notifications:
Stay informed of critical market movements without constant monitoring.
Automated Trading Strategies:
Integrate with trading bots or automated systems for executing trades based on alerts.
Customization and Optimization
User-Friendly Inputs:
Adjustable Parameters:
Tailor pivot detection sensitivity with left and right lengths.
Color and Style Settings:
Match the indicator aesthetics to personal or platform preferences.
Line Management:
Maximum Lines Displayed:
Prevent chart clutter by limiting the number of lines.
Dynamic Line Handling:
Automatically manage and delete old lines to maintain chart clarity.
Flexibility:
Adapt to Different Markets:
Suitable for various financial instruments including stocks, forex, and cryptocurrencies.
Scalability:
Efficiently handles up to 500 labels and 100 lines for comprehensive analysis.
Practical Use Cases
Identifying Key Support and Resistance:
Entry and Exit Points:
Use pivot levels to determine optimal trade entry and exit points.
Trend Confirmation:
Validate market trends through the connection of pivot points.
Breakout and Breakdown Strategies:
Trading Breakouts:
Enter long positions when price breaks above pivot highs.
Trading Breakdowns:
Enter short positions when price breaks below pivot lows.
Risk Management:
Setting Stop-Loss and Take-Profit Levels:
Utilize pivot levels to place strategic stop-loss and take-profit orders.
Slide 12: Benefits for Traders
Real-Time Analysis:
Provides up-to-date pivot points for timely decision-making.
Enhanced Visualization:
Clear markers and lines improve chart readability and analysis efficiency.
Customizable and Flexible:
Adapt the indicator to fit various trading styles and strategies.
Automated Alerts:
Stay ahead with instant notifications on key market events.
Comprehensive Toolset:
Combines pivot points with fractal analysis for deeper market insights.
Conclusion
Pivot Points LIVE is a robust and versatile indicator designed to enhance your trading strategy through real-time pivot point analysis. With its advanced features, customizable settings, and automated alerts, it equips traders with the tools needed to identify key market levels, execute timely trades, and manage risks effectively.
Ready to Elevate Your Trading?
Explore Pivot Points LIVE and integrate it into your trading toolkit today!
Q&A
Questions?
Feel free to ask any questions or request further demonstrations of the Pivot Points LIVE indicator.

Simultaneous INSIDE Bar Break IndicatorSimultaneous Inside Bar Break Indicator (SIBBI) for The Strat Community
Overview:
The Simultaneous Inside Bar Break Indicator (SIBBI) is designed to help traders using The Strat methodology identify one of the most powerful breakout patterns: the Simultaneous Inside Bar Break across multiple symbols. This indicator detects when all four user-selected symbols form inside bars on the previous candle and then break those inside bars in the same direction (either bullish or bearish) on the current candle.
Inside bars represent consolidation periods where price action does not break the high or low of the previous candle. When a simultaneous break occurs across multiple symbols, this often signals a strong move in the market, making this a key actionable signal in The Strat trading strategy.
Key Features:
Multi-Symbol Analysis: You can track up to four different symbols simultaneously. By default, the indicator comes with SPY, QQQ, IWM, and DIA, but you can modify these to track any other assets or symbols.
Inside Bar Detection: The indicator checks whether all four symbols have inside bars on the previous candle. It only triggers when all symbols meet this condition, making it a highly specific and reliable signal.
Simultaneous Break Detection: Once all symbols have inside bars, the indicator waits for a breakout in the same direction across all four symbols. A simultaneous bullish break (prices breaking above the previous candle’s high) triggers a green label, while a simultaneous bearish break (prices breaking below the previous candle’s low) triggers a red label.
Dynamic Label Timeframe: The indicator dynamically adjusts the timeframe in the label based on the user’s selected timeframe. This allows traders to know precisely which timeframe the break is occurring on. If the user selects "Chart Timeframe," the indicator will evolve with the current chart's timeframe, making it more versatile.
Timeframe Flexibility: The indicator can be set to analyze any timeframe—15-minute, 30-minute, 60-minute, daily, weekly, and so on. It only works for the specific timeframe you set it to in the settings. If set to "Chart Timeframe," the label will adapt dynamically based on the timeframe you are currently viewing.
Customizable Labels: The user can choose the size of the labels (tiny, small, or normal), ensuring that the visual output is tailored to individual preferences and chart layouts.
Best Use Case:
The Simultaneous Inside Bar Break Indicator is particularly powerful when applied to multiple timeframes. Here’s how to use it for maximum impact:
Multi-Timeframe Setup: Set the indicator on various timeframes (e.g., 15-minute, 30-minute, 60-minute, and daily) across multiple charts. This allows you to monitor different timeframes and identify when lower timeframe breaks trigger potential moves on higher timeframes.
Anticipating Strong Moves: When a simultaneous inside bar break occurs on one timeframe (e.g., 30-minute), keep an eye on the higher timeframes (e.g., 60-minute or daily) to see if those timeframes also break. This stacking of inside bar breaks can signal powerful market moves.
Higher Conviction Signals: The indicator is designed to provide high-conviction signals. Since it requires all four symbols to break in the same direction simultaneously, it reduces false signals and focuses on higher probability setups, which is crucial for traders using The Strat to time their trades effectively.
How the Indicator Works:
Inside Bar Formation: The indicator first checks that all four selected symbols had inside bars in the previous bar (i.e., the current high and low are contained within the previous bar’s high and low).
Simultaneous Break Detection: After detecting inside bars, the indicator checks if all four symbols break out in the same direction—bullish (breaking above the previous bar’s high) or bearish (breaking below the previous bar’s low).
Label Display: When a simultaneous inside bar break occurs, a label is plotted on the chart—either green for a bullish break (below the candle) or red for a bearish break (above the candle). The label will display the timeframe you set in the settings (e.g., "IBSB 60" for a 60-minute break).
Chart Timeframe Option: If you prefer, you can set the indicator to evolve with the chart’s current timeframe. In this mode, the label will not show a specific timeframe but will still display the simultaneous inside bar break when it occurs.
Recommendations for Usage:
Focus on Multiple Timeframes: The Strat methodology is all about understanding the relationship between different timeframes. Use this indicator on multiple timeframes to get a better picture of potential moves.
Pair with Other Strat Techniques: This indicator is most powerful when combined with other Strat tools, such as broadening formations, timeframe continuity, and actionable signals (e.g., 2-2 reversals). The simultaneous inside bar break can help confirm or invalidate other signals.
Customize Symbols and Timeframes: Although the default symbols are SPY, QQQ, IWM, and DIA, feel free to replace them with symbols more relevant to your trading. This indicator works well across equities, indices, futures, and forex pairs.
How to Set It Up:
Select Symbols: Choose four symbols that you want to track. These can be index ETFs (like SPY and QQQ), individual stocks, or any other tradable instruments.
Set Timeframe: In the indicator’s settings, choose a specific timeframe (e.g., 15-minute, 30-minute, daily). The label will reflect the selected timeframe, making it clear which time-based break you are seeing.
Optional - Chart Timeframe Mode: If you want the indicator to adapt to the chart’s current timeframe, select the "Chart Timeframe" option in the settings. The indicator will plot the breaks without showing a specific timeframe in the label.
Customize Label Size: Depending on your chart layout and personal preference, you can adjust the size of the labels (tiny, small, or normal) in the settings.
Conclusion:
The Simultaneous Inside Bar Break Indicator is a powerful tool for traders using The Strat methodology, offering a highly specific and reliable signal that can indicate potential large market moves. By monitoring multiple symbols and timeframes, you can gain deeper insight into the market's behavior and act with greater confidence. This indicator is ideal for traders looking to catch high-conviction moves and align their trades with broader market continuity.
Note: The indicator works best when paired with multi-timeframe analysis, allowing you to see how breaks on lower timeframes might influence larger trends. For traders who prefer simplicity, setting it to the "Chart Timeframe" mode offers flexibility while maintaining the core benefits of this indicator.

US Sentiment Index [CryptoSea]The US Sentiment Index is an advanced analytical tool designed for traders seeking to uncover patterns, correlations, and potential leading signals across key market tickers. This indicator surpasses traditional sentiment measures, providing a data-driven approach that offers deeper insights compared to conventional indices like the Fear and Greed Index.
Key Features
Multi-Ticker Analysis: Integrates data from a diverse set of market indicators, including gold, S&P 500, U.S. Dollar Index, Volatility Index, and more, to create a comprehensive view of market sentiment.
Customisable Sensitivity Settings: Allows users to adjust the moving average period to fine-tune the sensitivity of sentiment calculations, adapting the tool to various market conditions and trading strategies.
Detailed Sentiment Scaling: Utilises a 0-100 scale to quantify sentiment strength, with colour gradients that visually represent bearish, neutral, and bullish conditions, aiding in quick decision-making.
Below is an example where the sentiment index can give leading signals. We see a first sign of wekaness in the index as it drops below its moving average. Shortly after we see it dip below our median 50 level, another sign of weakeness. We see the SPX price action to take a hit following the sentiment index decrease.
Tickers Used and Their Impact on Sentiment
The impact of each ticker on sentiment can be bullish or bearish, depending on their behaviour:
Gold (USGD): Typically seen as a safe-haven asset, rising gold prices often indicate increased market fear or bearish sentiment. Conversely, falling gold prices can signal reduced fear and a shift towards bullish sentiment in riskier assets.
S&P 500 (SPX): A rising S&P 500 is usually a sign of bullish sentiment, reflecting confidence in economic growth and market stability. A decline, however, suggests bearish sentiment and a potential move towards risk aversion.
U.S. Dollar Index (DXY): A strengthening U.S. Dollar can be a sign of fear as investors seek safety in the dollar, which is bearish for risk assets. A weakening dollar, on the other hand, can signal bullish sentiment as capital flows into riskier assets.
Volatility Index (VIX): Known as the "fear gauge," a rising VIX indicates increased market fear and bearish sentiment. A falling VIX suggests a calm, bullish market environment.
Junk Bonds (JNK): Rising junk bond prices often reflect bullish sentiment as investors take on more risk for higher returns. Conversely, falling junk bond prices signal increased fear and bearish sentiment.
Long-Term Treasury Bonds (TLT): Higher prices for long-term treasuries usually indicate a flight to safety, reflecting bearish sentiment. Lower prices suggest a shift towards riskier assets, indicating bullish sentiment.
Financial Sector ETF (XLF): Strength in the financial sector is typically bullish, indicating confidence in economic conditions. Weakness in this sector can reflect bearish sentiment and concerns about financial stability.
Unemployment Rate (USUR): A rising unemployment rate is a bearish signal, indicating economic weakness. A declining unemployment rate is bullish, reflecting economic strength and job growth.
U.S. Interest Rates (USINTR, USIRYY): Higher interest rates can be bearish, as they increase borrowing costs and reduce spending. Lower rates are generally bullish, promoting economic growth and risk-taking.
How it Works
Sentiment Calculation: The US Sentiment Index combines data from multiple tickers, calculating sentiment by scaling the distance from their respective moving averages. Each asset's behaviour is interpreted within the context of market fear or greed, providing a refined sentiment reading that adjusts dynamically.
Market Strength Analysis: When the index is above 50 and also above its moving average, it indicates particularly strong or bullish market conditions, driven by greed. Conversely, when the index is below 50 and under its moving average, it signals bearish or weak market conditions, associated with fear.
Correlation and Pattern Detection: The indicator analyses correlations among the included assets to detect patterns that might signal potential market movements, giving traders a leading edge over simpler sentiment measures.
Adaptive Background Colouring: Utilises a colour gradient that dynamically adjusts based on sentiment values, highlighting extreme fear, neutral, and extreme greed levels directly on the chart.
Flexible Display Options: Offers settings to toggle the moving average plot and adjust its period, giving users the ability to tailor the indicator's sensitivity and display to their specific needs.
In this example below, we can see the Sentiment rise above the Moving Average (MA). Price action goes on to follow this, although there is an instance where it dips below the MA, it quickly rises back above again as a sign of strength.
Another way you can use this index is by simply using the MA, if its trending up, we know the macro sentiment is bullish.
Application
Data-Driven Insights: Offers traders a detailed, data-driven approach to sentiment analysis, incorporating a broad spectrum of market indicators to deliver actionable insights.
Pattern Recognition: Helps identify patterns and correlations that may lead to market reversals or continuations, providing a nuanced view that goes beyond simple sentiment gauges.
Enhanced Decision-Making: Equips traders with a robust tool to validate trading strategies and make informed decisions based on comprehensive sentiment analysis.
The US Sentiment Index by is an essential addition to the toolkit of any trader looking to navigate market complexities with precision and confidence. Its advanced features and data-driven approach offer unparalleled insights into market sentiment, setting it apart from conventional sentiment indicators.

Trend CCITrend CCI (TCCI) Indicator
Description:
The Trend CCI (TCCI) indicator is a unique combination of the Commodity Channel Index (CCI) and the Average True Range (ATR), designed to identify trends and market reversals with a refined sensitivity to price volatility. The indicator plots the CCI, adjusted by an ATR filter, and color-codes the trendline to signal uptrends and downtrends.
How It Works:
This indicator uses the CCI to measure price momentum and an ATR-based filter to smooth out market noise, making it easier to detect significant shifts in the market trend. Key parameters such as the ATR Period, ATR Multiplier, and CCI Period have been carefully chosen to optimize the indicator's performance:
1. ATR Period (default: 18)
The ATR Period determines the number of periods used to calculate the **Average True Range**, which reflects market volatility. In this case, an **ATR Period of 18** has been selected for several reasons:
Balance between responsiveness and noise reduction : A period of 18 strikes a balance between being responsive to recent price movements and filtering out minor fluctuations. Shorter ATR periods might be too reactive, creating false signals, while longer periods might miss shorter-term trends.
Adaptable to various market conditions : An 18-period ATR is suitable for both intraday and swing trading strategies, making it versatile across different time frames.
Standard industry practice : Many traders use ATR settings between 14 and 20 periods as a convention for detecting reliable volatility levels.
2. ATR Multiplier (default: 1.5)
The ATR Multiplier is applied to the ATR value to define how sensitive the indicator is to volatility. In this case, a multiplier of 1.5 has been chosen:
Avoiding whipsaws in low volatility markets: By setting the multiplier to 1.5, the indicator filters out smaller, less significant price movements, reducing the likelihood of whipsaw signals (i.e., false trend reversals during periods of low volatility).
Optimizing signal accuracy: A moderate multiplier like 1.5 ensures that the indicator only generates signals when the price moves a significant distance from the average range. Higher multipliers (e.g., 2.0) may ignore valid opportunities, while lower multipliers (e.g., 1.0) might create too many signals.
Enhancing trend clarity : The multiplier’s role in widening the range allows the indicator to respond more clearly during periods of strong trends, reducing signal noise and false positives.
3. CCI Period (default: 63)
The CCI Period defines the number of periods used to calculate the Commodity Channel Index. A 63-period CCI is selected based on the following considerations:
Smoothing the momentum calculation: A longer period, such as 63, is used to smooth out the CCI and reduce the effects of short-term price fluctuations. This period captures longer-term momentum, making it ideal for identifying more significant market trends.
-Filtering out short-term noise: While shorter CCI periods (e.g., 14 or 20) may be more reactive, they tend to produce more signals, some of which may be false. A 63-period CCI focuses on stronger and more sustained price movements, providing fewer but higher-quality signals.
Adapted to intermediate trading: A 63-period CCI aligns well with traders looking for medium-term trend-following strategies, striking a balance between long-term trend identification and responsiveness to significant price shifts.
How to Use:
Green Area: When the trendline turns green, it signals that the CCI is positive, reflecting upward momentum. This can be interpreted as a buy signal, indicating the potential for long positions or continuing bullish trades.
Red Area: When the trendline turns red, it signals that the CCI is negative, reflecting downward momentum. This can be interpreted as a sell signal, indicating potential short positions or bearish trades.
ATR Filter: The ATR helps reduce false signals by ignoring minor price movements. Traders can adjust the ATR Multiplier to make the indicator more or less sensitive based on market conditions. A lower multiplier (e.g., 1.2) may increase signal frequency, while a higher multiplier (e.g., 2.0) reduces it.
Originality:
The Trend CCI (TCCI) stands out due to its combination of the CCI and ATR. While many indicators simply plot raw CCI values, this script enhances the CCI’s effectiveness by incorporating an ATR-based volatility filter. This ensures that only significant trends trigger signals, making it a more reliable tool in volatile markets. The choice of the ATR period, multiplier, and CCI period ensures a refined balance between trend detection and noise reduction, distinguishing it as a powerful trend-following indicator.
Additionally, the visual aspect—using color-coded trendlines that dynamically shift between green and red—simplifies the interpretation of market trends, offering traders a clear and immediate understanding of trend direction and momentum strength.
Final Recommendations:
Use in Trending Markets The TCCI is most effective in trending markets, where its signals align with broader market momentum. In sideways or low-volatility markets, consider adjusting the ATR multiplier or using other complementary indicators to confirm the signals.
Risk Management: Always integrate robust risk management practices, such as using stop-loss orders and position sizing, to protect against sudden market reversals or periods of heightened volatility.
Adjust for Volatility: Consider the volatility of the asset being traded. In highly volatile assets, a higher ATR multiplier (e.g., 2.0) may be necessary to filter out noise, while in more stable assets, a lower multiplier (e.g., 1.2) might generate earlier signals.
By using the Trend CCI (TCCI) indicator with a deeper understanding of its key parameters, traders can better identify trends, reduce noise, and improve their overall decision-making in the markets.
Good Profits!

Uptrick: Market MoodsThe "Uptrick: Market Moods" indicator is an advanced technical analysis tool designed for the TradingView platform. It combines three powerful indicators—Relative Strength Index (RSI), Average True Range (ATR), and Bollinger Bands—into one cohesive framework, aimed at helping traders better understand and interpret market sentiment. By capturing shifts in the emotional climate of the market, it provides a holistic view of market conditions, which can range from calm to stressed or even highly excited. This multi-dimensional analysis tool stands apart from traditional single-indicator approaches by offering a more complete picture of market dynamics, making it a valuable resource for traders looking to anticipate and react to changes in market behavior.
The RSI in the "Uptrick: Market Moods" indicator is used to measure momentum. RSI is an essential component of many technical analysis strategies, and in this tool, it is used to identify potential market extremes. When RSI values are high, they indicate an overbought condition, meaning the market may be approaching a peak. Conversely, low RSI values suggest an oversold condition, signaling that the market could be nearing a bottom. These extremes provide crucial clues about shifts in market sentiment, helping traders gauge whether the current emotional state of the market is likely to result in a reversal. This understanding is pivotal in predicting whether the market is transitioning from calm to stressed or from excited to overbought.
The Average True Range adds another layer to this analysis by offering insights into market volatility. Volatility is a key factor in understanding the mood of the market, as periods of high volatility often reflect high levels of excitement or stress, while low volatility typically indicates a calm, steady market. ATR is calculated based on the range of price movements over a given period, and the higher the value, the more volatile the market is. The "Uptrick: Market Moods" indicator uses ATR to dynamically gauge volatility levels, helping traders understand whether the market is currently moving in a way that aligns with its emotional mood. For example, an increase in ATR accompanied by an RSI value that indicates overbought conditions could suggest that the market is in a highly excited state, with the potential for either strong momentum continuation or a sharp reversal.
Bollinger Bands complement these tools by providing visual cues about price volatility and the range within which the market is likely to move. Bollinger Bands plot two standard deviations away from a simple moving average of the price. This banding technique helps traders visualize how far the price is likely to deviate from its average over a certain period. The "Uptrick: Market Moods" indicator uses Bollinger Bands to establish price boundaries and identify breakout conditions. When prices break above the upper band or below the lower band, it often signals that the market is either highly stressed or excited. This breakout condition serves as a visual representation of the market mood, alerting traders to moments when prices are moving beyond typical ranges and when significant emotional shifts are occurring in the market.
Technically, the "Uptrick: Market Moods" indicator has been developed using TradingView’s Pine Script language, a highly efficient language for building custom indicators. It employs functions like ta.rsi, ta.atr, and ta.sma to perform the necessary calculations. The use of these built-in functions ensures that the calculations are both accurate and efficient, allowing the indicator to operate in real-time without lagging, even in volatile market conditions. The ta.rsi function is used to compute the Relative Strength Index, while ta.atr calculates the Average True Range, and ta.sma is used to smooth out price data for the Bollinger Bands. These functions are applied dynamically within the script, allowing the "Uptrick: Market Moods" indicator to respond to changes in market conditions in real time.
The user interface of the "Uptrick: Market Moods" indicator is designed to provide a visually intuitive experience. The market mood is color-coded on the chart, making it easy for traders to identify whether the market is calm, stressed, or excited at a glance. This feature is especially useful for traders who need to make quick decisions in fast-moving markets. Additionally, the indicator includes an interactive table that updates in real-time, showing the most recent mood state and its frequency. This provides valuable statistical insights into market behavior over specific time frames, helping traders track the dominant emotional state of the market. Whether the market is in a prolonged calm state or rapidly transitioning through moods, this real-time feedback offers actionable data that can help traders adjust their strategies accordingly.
The RSI component of the "Uptrick: Market Moods" indicator helps detect the speed and direction of price movements, offering insight into whether the market is approaching extreme conditions. By providing signals based on overbought and oversold levels, the RSI helps traders decide whether to enter or exit positions. The ATR element acts as a volatility gauge, dynamically adjusting traders’ expectations in response to changes in market volatility. Meanwhile, the Bollinger Bands help identify trends and potential breakout conditions, serving as an additional confirmation tool that highlights when the price has moved beyond normal boundaries, indicating heightened market excitement or stress.
Despite the robust capabilities of the "Uptrick: Market Moods" indicator, it does have limitations. In markets affected by sudden shifts, such as those driven by major news events or external economic factors, the indicator’s performance may not always be reliable. These external factors can cause rapid mood swings that are difficult for any technical analysis tool to fully anticipate. Additionally, the indicator’s complexity may pose a learning curve for novice traders, particularly those who are unfamiliar with the concepts of RSI, ATR, and Bollinger Bands. However, with practice, traders can become proficient in using the tool to its full potential, leveraging the insights it provides to better navigate market shifts.
For traders seeking a deeper understanding of market sentiment, the "Uptrick: Market Moods" indicator is an invaluable resource. It is recommended for those dealing with medium to high volatility instruments, where understanding emotional shifts can offer a strategic advantage. While it can be used on its own, integrating it with other forms of analysis, such as fundamental analysis and additional technical indicators, can enhance its effectiveness. By confirming signals with other tools, traders can reduce the likelihood of false signals and improve their overall trading strategy.
To further enhance the accuracy of the "Uptrick: Market Moods" indicator, it can be integrated with volume-based tools like Volume Profile or On-Balance Volume (OBV). This combination allows traders to confirm the moods identified by the indicator with volume data, providing additional confirmation of market sentiment. For example, when the market is in an excited mood, an increase in trading volume could reinforce the reliability of that signal. Conversely, if the market is stressed but volume remains low, traders may want to proceed with caution. Using multiple indicators together creates a more comprehensive trading approach, helping traders better manage risk and make informed decisions based on multiple data points.
In conclusion, the "Uptrick: Market Moods" indicator is a powerful and unique addition to the suite of technical analysis tools available on TradingView. It provides traders with a multi-dimensional view of market sentiment by combining the analytical strengths of RSI, ATR, and Bollinger Bands into a single tool. Its ability to capture and interpret the emotional mood of the market makes it an essential tool for traders seeking to gain an edge in understanding market behavior. While the indicator has certain limitations, particularly in rapidly shifting markets, its ability to provide real-time insights into market sentiment is a valuable asset for traders of all experience levels. Used in conjunction with other tools and sound trading practices, the "Uptrick: Market Moods" indicator offers a comprehensive solution for navigating the complexities of financial markets.
