SOFR Spread (proxy: FEDFUNDS - US03MY)📊 SOFR Spread (Proxy: FEDFUNDS - US03MY) – Monitoring USD Money Market Liquidity
In 2008, the spread exhibits a sharp vertical spike, signaling a severe liquidity dislocation: investors rushed into short-term U.S. Treasuries, pushing their yields down dramatically, while the FEDFUNDS rate remained relatively high.
This behavior indicates extreme systemic stress in the interbank lending market, preceding massive Federal Reserve interventions such as rate cuts, emergency liquidity operations, and the launch of quantitative easing (QE).
Description:
This indicator plots the spread between the Effective Federal Funds Rate (FEDFUNDS) and the 3-Month US Treasury Bill yield (US03MY), used here as a proxy for the SOFR spread.
It serves as a simple yet powerful tool to detect liquidity dislocations and stress signals in the US short-term funding markets.
Interpretation:
🔴 Spread > 0.20% → Possible liquidity stress: elevated repo rates, cash shortage, interbank distrust.
🟡 Spread ≈ 0% → Normal market conditions, balanced liquidity.
🟢 Spread < 0% → Excess liquidity: strong demand for T-Bills, “flight to safety”, or distortion due to expansionary monetary policy.
Ideal for:
Monitoring Fed policy impact
Anticipating market-wide liquidity squeezes
Correlation with DXY, SPX, VIX, MOVE Index, and risk sentiment
🧠 Note: As SOFR is not directly available on TradingView, FEDFUNDS is used as a reliable proxy, closely tracking the same trends in most macro conditions.
Cerca negli script per "demand"

LANZ Strategy 2.0 [Backtest]🔷 LANZ Strategy 2.0 — Structural Breakout Logic with Dynamic Swing Protection
LANZ Strategy 2.0 is a precision-focused backtesting system built for intraday traders who rely on structural confirmations before the London session to guide directional bias. This tool uses smart swing detection, risk-defined position sizing, and strict time-based execution to simulate real trading conditions with clarity and control.
🧠 Core Components:
Structural Confirmation (Trend & BoS): Detects trend direction and break of structure (BoS) using a three-swing logic, aligning trade entries with valid structural movement.
Time-Based Execution: Trades are triggered exclusively at 02:00 a.m. New York time, ensuring disciplined and repeatable intraday testing.
Swing-Based SL Models: Traders can select between three stop-loss protection types:
First Swing: Most recent structural level
Second Swing: Prior level
Full Coverage: All recent swing levels + configurable pip buffer
Dynamic TP Calculation: Take-Profit is projected as a risk-based multiple (RR), fully adjustable via input.
Capital-Based Risk Management: Risk is defined as a percentage of a fixed account size (e.g., $100 per trade from $10,000), and lot size is automatically calculated based on SL distance.
Fallback Entry Logic: If structural breakout is present but trend is not confirmed, a secondary entry is triggered.
End-of-Session Management: Any open trades are automatically closed at 11:45 a.m. NY time, with optional manual labeling or review.
📊 Visual Features (Optional in Indicator Version):
(Note: Visuals apply to the indicator version of LANZ 2.0, not this backtest script)
Swing level labels (1st, 2nd) and dynamic SL/TP lines.
Real-time session coloring for clarity: Pre-London, Entry Window, and NY Close.
Outcome labels: +RR, -RR, or net % at close.
Auto-cleanup of previous drawings for a clean chart per session.
⚙️ How It Works:
Detects last trend and BoS using swing logic before 02:00 a.m. NY.
At 02:00 a.m., evaluates directional bias and executes BUY or SELL if confirmed.
Applies selected SL logic (1st, 2nd, or full swing protection).
Sets TP based on the RR multiplier.
Closes the trade either on SL, TP, or at 11:45 a.m. NY manually.
🔔 Alerts:
Time-of-day alert at 02:00 a.m. NY to monitor execution.
Can be extended to cover SL/TP triggers or new BoS events.
📝 Notes:
Designed for backtesting precision and discretionary decision-making.
Ideal for Forex pairs, indices, or assets active during the London session.
Fully customizable: session timing, swing logic, SL buffer, and RR.
👤 Credits:
Strategy built by @rau_u_lanz using Pine Script v6, combining structural logic, capital-based risk control, and London-session timing in a backtest-ready framework for traders who demand accuracy and structure.

Interest Zones | @CRYPTOKAZANCEVEnglish Description.
🧠 What This Script Does
This script automatically detects price interest zones — areas where the price repeatedly reacts by forming local swing highs or lows , suggesting heightened supply/demand or market attention. It uses a custom volatility-adjusted range (pseudo-ATR) to dynamically group significant swing points and highlights these zones visually on the chart.
The script is not a mashup or copy of built-in indicators. It’s an original implementation that performs a meaningful calculation based on market structure and volatility to help traders identify important price areas.
⚙️ How It Works
1. Swing Point Detection:
The script identifies swing highs and lows using a configurable lookback window.
2. Zone Candidate Evaluation:
Each swing is checked against a custom zone width (based on ATR and your multiplier). If multiple swings fall within this range, it’s marked as a potential zone.
3. Filtering:
The script keeps only those zones that:
• Contain at least a user-defined number of swing points.
• Do not overlap with stronger (higher swing count) zones.
4. Visualization:
• The strongest zones are drawn as semi-transparent boxes.
• Zones are limited by time (last X candles).
• Optional: Swing highs/lows can be shown on chart.
📊 How to Use
• Use it on any timeframe or asset to identify price regions of interest.
• Combine with volume, trend, or candlestick analysis for entries/exits.
• The number of touches (swing points in a zone) gives insight into zone significance.
This tool is particularly useful for identifying support/resistance areas based on actual price structure rather than arbitrary levels.
🔧 Settings
• Swing Lookback Period: Controls how many candles on each side of a pivot the script checks to detect a local high/low.
• Zone Width Multiplier: Adjusts the volatility-based range. Larger values create wider zones.
• Min Swing Count: Zones with fewer swing points than this won't be shown.
• Max Zones Displayed: Limits the number of zones shown on screen.
• Max Candles for Analysis: Old swing points beyond this range are ignored.
📌 Notes
• No third-party code or mashups used.
• This is a standalone implementation of a concept similar to market structure mapping, tailored to be dynamic and responsive to volatility.
• Ideal for traders who prefer clean, price-action-based analysis.
🇷🇺 Русское описание
🧠 Что делает этот индикатор:
Индикатор автоматически определяет зоны интереса цены — области, где цена многократно формирует локальные максимумы или минимумы (свинги) . Эти зоны могут сигнализировать о повышенном внимании рынка, предложении или спросе. Скрипт использует псевдо-ATR (волатильность на основе среднего диапазона), чтобы динамически определять такие области и выделяет их на графике.
Это не копия стандартных индикаторов и не микс чужих скриптов — это оригинальная разработка , полезная для всех, кто ищет автоматическую разметку важных ценовых уровней.
⚙️ Как работает индикатор
1. Поиск свинг-точек:
Определяются локальные экстремумы с учетом указанного периода.
2. Формирование кандидатов в зоны:
Каждая свинг-точка проверяется, есть ли в её диапазоне другие свинги. Если таких достаточно — зона считается потенциальной.
3. Фильтрация зон:
• Учитываются только зоны с минимумом заданных свингов.
• Перекрывающиеся зоны удаляются в пользу более значимых.
4. Визуализация:
• Отображаются зоны с наибольшим числом касаний.
• Зоны ограничиваются последними X свечами.
• При желании можно отобразить сами свинг-точки.
📊 Как использовать
• Работает на любом таймфрейме и инструменте.
• Используйте совместно с объёмами, трендом или свечным анализом.
• Количество касаний помогает оценить важность зоны.
Полезен тем, кто предпочитает анализ на основе структуры цены, а не произвольных уровней.
🔧 Настройки
• Период свингов: Сколько свечей учитывается по бокам для поиска экстремумов.
• Множитель зоны: Увеличивает диапазон зоны на основе волатильности.
• Мин. количество свингов: Минимум точек в зоне для её отображения.
• Макс. зон на графике: Ограничение по количеству отображаемых зон.
• Макс. свечей анализа: Старые точки за пределами не учитываются.
📌 Примечания
• Не содержит чужих индикаторов или шаблонов.
• Самостоятельная реализация механизма анализа структуры рынка.

Dskyz (DAFE) GENESIS Dskyz (DAFE) GENESIS: Adaptive Quant, Real Regime Power
Let’s be honest: Most published strategies on TradingView look nearly identical—copy-paste “open-source quant,” generic “adaptive” buzzwords, the same shallow explanations. I’ve even fallen into this trap with my own previously posted strategies. Not this time.
What Makes This Unique
GENESIS is not a black-box mashup or a pre-built template. It’s the culmination of DAFE’s own adaptive, multi-factor, regime-aware quant engine—built to outperform, survive, and visualize live edge in anything from NQ/MNQ to stocks and crypto.
True multi-factor core: Volume/price imbalances, trend shifts, volatility compression/expansion, and RSI all interlock for signal creation.
Adaptive regime logic: Trades only in healthy, actionable conditions—no “one-size-fits-all” signals.
Momentum normalization: Uses rolling, percentile-based fast/slow EMA differentials, ALWAYS normalized, ALWAYS relevant—no “is it working?” ambiguity.
Position sizing that adapts: Not fixed-lot, not naive—not a loophole for revenge trading.
No hidden DCA or pyramiding—what you see is what you trade.
Dashboard and visual system: Directly connected to internal logic. If it’s shown, it’s used—and nothing cosmetic is presented on your chart that isn’t quantifiable.
📊 Inputs and What They Mean (Read Carefully)
Maximum Raw Score: How many distinct factors can contribute to regime/trade confidence (default 4). If you extend the quant logic, increase this.
RSI Length / Min RSI for Shorts / Max RSI for Longs: Fine-tunes how “overbought/oversold” matters; increase the length for smoother swings, tighten floors/ceilings for more extreme signals.
⚡ Regime & Momentum Gates
Min Normed Momentum/Score (Conf): Raise to demand only the strongest trends—your filter to avoid algorithmic chop.
🕒 Volatility & Session
ATR Lookback, ATR Low/High Percentile: These control your system’s awareness of when the market is dead or ultra-volatile. All sizing and filter logic adapts in real time.
Trading Session (hours): Easy filter for when entries are allowed; default is regular trading hours—no surprise overnight fills.
📊 Sizing & Risk
Max Dollar Risk / Base-Max Contracts: All sizing is adaptive, based on live regime and volatility state—never static or “just 1 contract.” Control your max exposures and real $ risk. ATR will effect losses in high volatility times.
🔄 Exits & Scaling
Stop/Trail/Scale multipliers: You choose how dynamic/flexible risk controls and profit-taking need to be. ATR-based, so everything auto-adjusts to the current market mode.
Visuals That Actually Matter
Dashboard (Top Right): Shows only live, relevant stats: scoring, status, position size, win %, win streak, total wins—all from actual trade engine state (not “simulated”).
Watermark (Bottom Right): Momentum bar visual is always-on, regime-aware, reflecting live regime confidence and momentum normalization. If the bar is empty, you’re truly in no-momentum. If it glows lime, you’re riding the strongest possible edge.
*No cosmetics, no hidden code distractions.
Backtest Settings
Initial capital: $10,000
Commission: Conservative, realistic roundtrip cost:
15–20 per contract (including slippage per side) I set this to $25
Slippage: 3 ticks per trade
Symbol: CME_MINI:NQ1!
Timeframe: 1 min (but works on all timeframes)
Order size: Adaptive, 1–3 contracts
No pyramiding, no hidden DCA
Why these settings?
These settings are intentionally strict and realistic, reflecting the true costs and risks of live trading. The 10,000 account size is accessible for most retail traders. 25/contract including 3 ticks of slippage are on the high side for NQ, ensuring the strategy is not curve-fit to perfect fills. If it works here, it will work in real conditions.
Why It Wins
While others put out “AI-powered” strategies with little logic or soul, GENESIS is ruthlessly practical. It is built around what keeps traders alive:
- Context-aware signals, not just patterns
- Tight, transparent risk
- Inputs that adapt, not confuse
- Visuals that clarify, not distract
- Code that runs clean, efficient, and with minimal overfitting risk (try it on QQQ, AMD, SOL, etc. out of the box)
Disclaimer (for TradingView compliance):
Trading is risky. Futures, stocks, and crypto can result in significant losses. Do not trade with funds you cannot afford to lose. This is for educational and informational purposes only. Use in simulation/backtest mode before live trading. No past performance is indicative of future results. Always understand your risk and ownership of your trades.
This will not be my last—my goal is to keep raising the bar until DAFE is a brand or I’m forced to take this private.
Use with discipline, use with clarity, and always trade smarter.
— Dskyz , powered by DAFE Trading Systems.

REVELATIONS (VoVix - PoC) REVELATIONS (VoVix - POC): True Regime Detection Before the Move
Let’s not sugarcoat it: Most strategies on TradingView are recycled—RSI, MACD, OBV, CCI, Stochastics. They all lag. No matter how many overlays you stack, every one of these “standard” indicators fires after the move is underway. The retail crowd almost always gets in late. That’s never been enough for my team, for DAFE, or for anyone who’s traded enough to know the real edge vanishes by the time the masses react.
How is this different?
REVELATIONS (VoVix - POC) was engineered from raw principle, structured to detect pre-move regime change—before standard technicals even light up. We built, tested, and refined VoVix to answer one hard question:
What if you could see the spike before the trend?
Here’s what sets this system apart, line-by-line:
o True volatility-of-volatility mathematics: It’s not just "ATR of ATR" or noise smoothing. VoVix uses normalized, multi-timeframe v-vol spikes, instantly detecting orderbook stress and "outlier" market events—before the chart shows them as trends.
o Purist regime clustering: Every trade is enabled only during coordinated, multi-filter regime stress. No more signals in meaningless chop.
o Nonlinear entry logic: No trade is ever sent just for a “good enough” condition. Every entry fires only if every requirement is aligned—local extremes, super-spike threshold, regime index, higher timeframe, all must trigger in sync.
o Adaptive position size: Your contracts scale up with event strength. Tiny size during nominal moves, max leverage during true regime breaks—never guesswork, never static exposure.
o All exits governed by regime decay logic: Trades are closed not just on price targets but at the precise moment the market regime exhausts—the hardest part of systemic trading, now solved.
How this destroys the lag:
Standard indicators (RSI, MACD, OBV, CCI, and even most “momentum” overlays) simply tell you what already happened. VoVix triggers as price structure transitions—anyone running these generic scripts will trade behind the move while VoVix gets in as stress emerges. Real alpha comes from anticipation, not confirmation.
The visuals only show what matters:
Top right, you get a live, live quant dashboard—regime index, current position size, real-time performance (Sharpe, Sortino, win rate, and wins). Bottom right: a VoVix "engine bar" that adapts live with regime stress. Everything you see is a direct function of logic driving this edge—no cosmetics, no fake momentum.
Inputs/Signals—explained carefully for clarity:
o ATR Fast Length & ATR Slow Length:
These are the heart of VoVix’s regime sensing. Fast ATR reacts to sharp volatility; Slow ATR is stability baseline. Lower Fast = reacts to every twitch; higher Slow = requires more persistent, “real” regime shifts.
Tip: If you want more signals or faster markets, lower ATR Fast. To eliminate noise, raise ATR Slow.
o ATR StdDev Window: Smoothing for volatility-of-volatility normalization. Lower = more jumpy, higher = only the cleanest spikes trigger.
Tip: Shorten for “jumpy” assets, raise for indices/futures.
o Base Spike Threshold: Think of this as your “minimum event strength.” If the current move isn’t volatile enough (normalized), no signal.
Tip: Higher = only biggest moves matter. Lower for more signals but more potential noise.
o Super Spike Multiplier: The “are you sure?” test—entry only when the current spike is this multiple above local average.
Tip: Raise for ultra-selective/swing-trading; lower for more active style.
Regime & MultiTF:
o Regime Window (Bars):
How many bars to scan for regime cluster “events.” Short for turbo markets, long for big swings/trends only.
o Regime Event Count: Only trade when this many spikes occur within the Regime Window—filters for real stress, not isolated ticks.
Tip: Raise to only ever trade during true breakouts/crashes.
o Local Window for Extremes:
How many bars to check that a spike is a local max.
Tip: Raise to demand only true, “clearest” local regime events; lower for early triggers.
o HTF Confirm:
Higher timeframe regime confirmation (like 45m on an intraday chart). Ensures any event you act on is visible in the broader context.
Tip: Use higher timeframes for only major moves; lower for scalping or fast regimes.
Adaptive Sizing:
o Max Contracts (Adaptive): The largest size your system will ever scale to, even on extreme event.
Tip: Lower for small accounts/conservative risk; raise on big accounts or when you're willing to go big only on outlier events.
o Min Contracts (Adaptive): The “toe-in-the-water.” Smallest possible trade.
Tip: Set as low as your broker/exchange allows for safety, or higher if you want to always have meaningful skin in the game.
Trade Management:
o Stop %: Tightness of your stop-loss relative to entry. Lower for tighter/safer, higher for more breathing room at cost of greater drawdown.
o Take Profit %: How much you'll hold out for on a win. Lower = more scalps. Higher = only run with the best.
o Decay Exit Sensitivity Buffer: Regime index must dip this far below the trading threshold before you exit for “regime decay.”
Tip: 0 = exit as soon as stress fails, higher = exits only on stronger confirmation regime is over.
o Bars Decay Must Persist to Exit: How long must decay be present before system closes—set higher to avoid quick fades and whipsaws.
Backtest Settings
Initial capital: $10,000
Commission: Conservative, realistic roundtrip cost:
15–20 per contract (including slippage per side) I set this to $25
Slippage: 3 ticks per trade
Symbol: CME_MINI:NQ1!
Timeframe: 1 min (but works on all timeframes)
Order size: Adaptive, 1–3 contracts
No pyramiding, no hidden DCA
Why these settings?
These settings are intentionally strict and realistic, reflecting the true costs and risks of live trading. The 10,000 account size is accessible for most retail traders. 25/contract including 3 ticks of slippage are on the high side for NQ, ensuring the strategy is not curve-fit to perfect fills. If it works here, it will work in real conditions.
Tip: Set to 1 for instant regime exit; raise for extra confirmation (less whipsaw risk, exits held longer).
________________________________________
Bottom line: Tune the sensitivity, selectivity, and risk of REVELATIONS by these inputs. Raise thresholds and windows for only the best, most powerful signals (institutional style); lower for activity (scalpers, fast cryptos, signals in constant motion). Sizing is always adaptive—never static or martingale. Exits are always based on both price and regime health. Every input is there for your control, not to sell “complexity.” Use with discipline, and make it your own.
This strategy is not just a technical achievement: It’s a statement about trading smarter, not just more.
* I went back through the code to make sure no the strategy would not suffer from repainting, forward looking, or any frowned upon loopholes.
Disclaimer:
Trading is risky and carries the risk of substantial loss. Do not use funds you aren’t prepared to lose. This is for research and informational purposes only, not financial advice. Backtest, paper trade, and know your risk before going live. Past performance is not a guarantee of future results.
Expect more: We’ll keep pushing the standard, keep evolving the bar until “quant” actually means something in the public code space.
Use with clarity, use with discipline, and always trade your edge.
— Dskyz , for DAFE Trading Systems

SuperTrend: Silent Shadow 🕶️ SuperTrend: Silent Shadow — Operate in trend. Vanish in noise.
Overview
SuperTrend: Silent Shadow is an enhanced trend-following system designed for traders who demand clarity in volatile markets and silence during indecision.
It combines classic Supertrend logic with a proprietary ShadowTrail engine and an adaptive Silence Protocol to filter noise and highlight only the cleanest signals.
Key Features
✅ Core Supertrend Logic
Built on Average True Range (ATR), this trend engine identifies directional bias with visual clarity. Lines adjust dynamically with price action and flip when meaningful reversals occur.
✅ ShadowTrail: Stepped Counter-Barrier
ShadowTrail doesn’t predict reversals — it reinforces structure.
When price is trending, ShadowTrail forms a stepped ceiling in downtrends and a stepped floor in uptrends. This visual containment zone helps define the edges of price behavior and offers a clear visual anchor for stop-loss placement and trade containment.
✅ Silence Protocol: Adaptive Noise Filtering
During low-volatility zones, the system enters “stealth mode”:
• Trend lines turn white to indicate reduced signal quality
• Fill disappears to reduce distraction
This helps avoid choppy entries and keeps your focus sharp when the market isn’t.
✅ Visual Support & Stop-Loss Utility
When trendlines flatten or pause, they naturally highlight price memory zones. These flat sections often align with:
• Logical stop-loss levels
• Prior support/resistance areas
• Zones of reduced volatility where price recharges or rejects
✅ Custom Styling
Full control over line colors, width, transparency, fill visibility, and silence behavior. Tailor it to your strategy and visual preferences.
How to Use
• Use Supertrend color to determine bias — flips mark momentum shifts
• ShadowTrail mirrors the primary trend as a structural ceiling/floor
• Use flat segments of both lines to identify consolidation zones or place stops
• White lines = low-quality signal → stand by
• Combine with RSI, volume, divergence, or your favorite tools for confirmation
Recommended For:
• Traders seeking clearer trend signals
• Avoiding false entries in sideways or silent markets
• Identifying key support/resistance visually
• Structuring stops around real market containment levels
• Scalping, swing, or position trading with adaptive clarity
Built by Sherlock Macgyver
Forged for precision. Designed for silence.
When the market speaks, you listen.
When it doesn’t — you wait in the shadows.

OB Sweeps ReversalOB Sweeps Reversal is a high-precision market structure tool that identifies and dynamically tracks bullish and bearish order blocks — key zones where institutional participants are likely to be active. These zones act as support and resistance levels, adapting to market behavior in real time.
The script monitors price interaction with each OB and classifies its status as:
Unmitigated (price has not yet returned)
Mitigating (price is testing the zone)
Invalidated (zone has been broken)
Traders can use these zones directly as actionable support/resistance — or wait for additional confirmation via the system’s liquidity sweep detection and optional filters.
🔍 Key Features:
Automatically detects and plots bullish and bearish OBs
Tracks mitigation status and updates visuals accordingly
Detects liquidity sweeps of recent highs/lows
Optional filters:
• 200 EMA trend direction
• Momentum of current or previous candle
Plots stop-loss and take-profit lines using ATR-based logic
Clean entry labels with full contextual data
Built-in alert system with constant-string messages (automation ready)
📈 How to Use:
Load the script on any timeframe (15m–4H recommended)
Observe the live OB zones as they develop
Trade based on price interaction:
• Bounce off a bullish OB = potential long setup
• Rejection from a bearish OB = potential short
• Sweep + snapback into an OB = optional trap reversal entry
SL/TP levels are drawn automatically for reference
Use alerts to automate or monitor high-conviction setups
The order blocks themselves are valuable on their own — even without waiting for a signal. They can be used as dynamic support and resistance zones, offering excellent structure-based trading opportunities.
🧠 Ideal For:
Traders who follow price action and market structure
Those using support/resistance, OBs, or supply/demand
Intraday and swing traders looking for cleaner structure alignment
Users who prefer low-frequency, high-quality setups
⚠️ Note:
This tool does not produce frequent signals. It is designed for precision and discipline, with a focus on clarity and confluence. It complements — not replaces — a trader’s decision-making process.
This script is open-source and designed with integrity, precision, and trader usability in mind. No links, no upsells, no promotions — just a reliable system for structural market analysis.

Order Block Matrix [Alpha Extract]The Order Block Matrix indicator identifies and visualizes key supply and demand zones on your chart, helping traders recognize potential reversal points and high-probability trading setups.
This tool helps traders:
Visualize key order blocks with volume profile histograms showing liquidity distribution.
Identify high-volume price levels where institutional activity occurs.
rank historical order blocks and analyze their strength based on volume.
Receive alerts for potential trading opportunities based on price-block interactions.
🔶 CALCULATION
The indicator processes chart data to identify and analyze order blocks:
Order Block Detection
Inputs:
Price action patterns (consolidation areas followed by breakouts).
Volume data from current and lower timeframes.
User-defined lookback periods and thresholds.
Detection Logic:
Identifies consolidation areas using a dynamic range comparison.
Confirms breakout patterns with percentage threshold validation.
Maps volume distribution across price levels within each order block.
🔶Volume Analysis
Volume Profiling:
Divides each order block into configurable grid segments.
Maps volume distribution across price segments within blocks.
Highlights zones with highest volume concentration.
Strength Assessment:
Calculates total block volume and relative strength metrics.
Compares block volume to historical averages.
Determines probability of reversal based on volume patterns.
isConsolidation(len) =>
high_range = ta.highest(high, len) - ta.lowest(high, len)
low_range = ta.highest(low, len) - ta.lowest(low, len)
avg_range = (high_range + low_range) / 2
current_range = high - low
current_range <= avg_range * (1 + obThreshold)
🔶 DETAILS
Visual Features
Volume Profile Histograms:
Color-coded bars showing volume concentration within order blocks.
Gradient coloring based on relative volume (high volume = brighter colors).
Bull blocks (green/teal) and bear blocks (red) with varying opacity.
Block Visualization:
Dynamic box sizing based on volume concentration.
Optional block borders and background fills.
Volume labels showing total block volume.
Screener Table:
Real-time analysis of order block metrics.
Shows block direction, proximity, retest count, and volume metrics.
Color-coded for quick reference.
Interpretation
High Volume Areas: Zones with institutional interest and potential reversal points.
Block Direction: Bullish blocks typically support price, bearish blocks typically resist price.
Retests: Multiple tests of an order block may strengthen or weaken its influence.
Block Age: Newer blocks often have stronger influence than older ones.
Volume Concentration: Brightest segments within blocks represent the highest volume areas.
🔶 EXAMPLES
The indicator helps identify key trading opportunities:
Bullish Order Blocks
Support Zones: Identify strong support levels where price is likely to bounce.
Breakout Confirmation: Validate breakouts with volume analysis to avoid false moves.
Retest Strategies: Enter trades when price retests a bullish order block with high volume.
Bearish Order Blocks
Resistance Zones: Identify strong resistance levels where price is likely to reverse.
Distribution Areas: Detect zones where smart money is distributing to retail.
Short Opportunities: Find optimal short entry points at high-volume bearish blocks.
Combined Strategies
Order Block Stacking: Multiple aligned blocks create stronger support/resistance zones.
Block Mitigation: When price breaks through a block, it often indicates a strong trend continuation.
Volume Profile Applications: Higher volume segments provide more precise entry and exit points.
🔶 SETTINGS
Customization Options
Order Block Detection:
Consolidation Lookback: Adjust the period for consolidation detection.
Breakout Threshold: Set minimum percentage for breakout confirmation.
Historical Lookback Limit: Control how far back to scan for historical order blocks.
Maximum Order Blocks: Limit the number of visible blocks on the chart.
Visual Style:
Grid Segments: Adjust the number of volume profile segments.
Extend Blocks to Right: Enable/disable extending blocks to current price.
Show Block Borders: Toggle border visibility.
Border Width: Adjust thickness of block borders.
Show Volume Text: Enable/disable volume labels.
Volume Text Position: Control placement of volume labels.
Color Settings:
Bullish High/Low Volume Colors: Customize appearance of bullish blocks.
Bearish High/Low Volume Colors: Customize appearance of bearish blocks.
Border Color: Set color for block outlines.
Background Fill: Adjust color and transparency of block backgrounds.
Volume Text Color: Customize label appearance.
Screener Table:
Show Screener Table: Toggle table visibility.
Table Position: Select positioning on the chart.
Table Size: Adjust display size.
The Order Block Matrix indicator provides traders with powerful insights into market structure, helping to identify key levels where smart money is active and where high-probability trading opportunities may exist.

Bull vs Bear Volume (Enhanced)Bull vs Bear Volume (Enhanced) is a custom volume histogram that separates and visualizes estimated buying vs. selling volume within each candle. This allows traders to better understand market sentiment and detect imbalances in demand and supply.
🔍 What It Does:
Plots bullish volume (green) above the x-axis and bearish volume (red) below.
Estimates bull/bear volume by analyzing the close location within the candle's range.
Highlights volume spikes with lime (bullish) or maroon (bearish) when volume exceeds a user-defined threshold.
Includes an optional total volume line for added context.
Supports smoothing via simple moving average (SMA) to reduce noise.
🛠️ Inputs:
Toggle smoothing and set its length.
Enable/disable threshold spike highlighting.
Show/hide the total volume overlay.
Adjust the threshold multiplier for spike detection.
⚠️ Important:
This script uses a proxy method based on candle structure to estimate volume split — it does not use real-time order flow or trade direction data.
Works best on liquid assets with consistent volume.

Multitimeframe Order Block Finder (Zeiierman)█ Overview
The Multitimeframe Order Block Finder (Zeiierman) is a powerful tool designed to identify potential institutional zones of interest — Order Blocks — across any timeframe, regardless of what chart you're viewing.
Order Blocks are critical supply and demand zones formed by the last opposing candle before an impulsive move. These areas often act as magnets for price and serve as smart-money footprints — ideal for anticipating reversals, retests, or breakouts.
This indicator not only detects such zones in real-time, but also visualizes their mitigation, bull/bear volume pressure, and a smoothed directional trendline based on Order Block behavior.
█ How It Works
The script fetches OHLCV data from your chosen timeframe using request.security() and processes it using strict pattern logic and volume-derived strength conditions. It detects Order Blocks only when the structure aligns with dominant pressure and visually extends valid zones forward for as long as they remain unmitigated.
⚪ Bull/Bear Volume Power Visualization
Each OB includes proportional bars representing estimated buy/sell effort:
Buy Power: % of volume attributed to buyers
Sell Power: % of volume attributed to sellers
This adds a visual, intuitive layer of intent — showing who controlled the price before the OB formed.
⚪ Order Block Trendline (Butterworth Filtered)
A smoothed trendline is derived from the average OB value over time using a two-pole Butterworth low-pass filter. This helps you understand the broader directional pressure:
Trendline up → favor bullish OBs
Trendline down → favor bearish OBs
█ How to Use
⚪ Trade From Order Blocks Like Institutions
Use this tool to find institutional footprints and reaction zones:
Enter at unmitigated OBs
⚪ Volume Power
Volume Pressure Bars inside each OB help you:
Confirm strong buyer/seller dominance
Detect possible traps or exhaustion
Understand how each zone formed
⚪ Find Trend & Pullbacks
The trendline not only helps traders detect the current trend direction, but the built-in trend coloring also highlights potential pullback areas within these trends.
█ Settings
Timeframe – Selects which timeframe to scan for Order Blocks.
Lookback Period – Defines how many bars back are used to detect bullish or bearish momentum shifts.
Sensitivity – When enabled, the indicator uses smoothed price (RMA) with rising/falling logic instead of raw candle closes. This allows more flexible detection of trend shifts and results in more Order Blocks being identified.
Minimum Percent Move – Filters out weak moves. Higher = only strong price shifts.
Mitigated on Mid – OB is removed when price touches its midpoint.
Show OB Table – Displays a panel listing all active (unmitigated) Order Blocks.
Extend Boxes – Controls how far OB boxes stretch into the future.
Show OB Trend – Toggles the trendline derived from Order Block strength.
Passband Ripple (dB) – Controls trendline reactivity. Higher = more sensitive.
Cutoff Frequency – Controls smoothness of trendline (0–0.5). Lower = smoother.
-----------------
Disclaimer
The content provided in my scripts, indicators, ideas, algorithms, and systems is for educational and informational purposes only. It does not constitute financial advice, investment recommendations, or a solicitation to buy or sell any financial instruments. I will not accept liability for any loss or damage, including without limitation any loss of profit, which may arise directly or indirectly from the use of or reliance on such information.
All investments involve risk, and the past performance of a security, industry, sector, market, financial product, trading strategy, backtest, or individual's trading does not guarantee future results or returns. Investors are fully responsible for any investment decisions they make. Such decisions should be based solely on an evaluation of their financial circumstances, investment objectives, risk tolerance, and liquidity needs.

BK AK-9I am incredibly proud to introduce my fourth indicator to the TradingView community:
BK AK-9 — a next-level momentum-volatility hybrid, built for traders who demand precision.
🔥 Why “AK-9”? The Meaning Behind the Name
This indicator is deeply personal to me.
The “AK” in the name represents the initials of my mentor — the man whose guidance shaped my journey in trading, discipline, and strategy.
His wisdom is woven into every line of code, every design choice, and every purpose behind this tool.
The “9” holds its own powerful meaning:
9 is the number of completion and breakthrough — the moment where preparation meets opportunity.
The AK-9 weapon itself is a suppressed variant of the legendary AK platform, built for stealth, precision, and maximum impact in close-quarters combat.
It’s quiet, adaptive, and deadly effective — just like this indicator cuts through market noise, adapts to volatility, and pinpoints moments of maximum opportunity.
✨ About the BK AK-9 Indicator
The BK AK-9 is not just an oscillator.
It’s a multi-layered trading weapon combining:
✅ RSI → Stochastic → Bollinger Bands on Stoch RSI → momentum measured inside volatility.
✅ Dynamic or Static Background Flash → when extremes hit, you get instant visual alerts.
✅ Color-coded %K zones →
🔴 Red: oversold
🟢 Green: overbought
🔵 Blue: neutral
✅ Volatility-adaptive bands → instead of relying on static levels, the bands expand and contract dynamically using standard deviation.
🛡️ Why This Indicator Matters
Pinpoints exhaustion zones statistically, not emotionally.
Confirms breakouts with volatility evidence, not just price action.
Filters noise and helps you wait for high-probability setups.
Gives you visual edge with color-coded momentum and background flash.
Perfect for:
🔹 Breakout traders confirming momentum surges.
🔹 Mean-reversion traders catching exhaustion pivots.
🔹 Swing traders using multi-layered momentum analysis.
🔹 Momentum traders hunting volatility-backed entries.
💥 How to Use BK AK-9
Breakout Confirmation → when Stoch RSI breaks above upper Bollinger Band (green zone, flash ON), ride the trend.
Mean Reversion Trades → when Stoch RSI drops below lower Bollinger Band (red zone, flash ON), look for reversals.
Noise Filtering → stay patient inside the blue zone, wait for extremes.
Advanced Sync → align it with Gann levels, harmonic patterns, Fibonacci clusters, or Elliott waves for maximum edge.
🙏 Final Thoughts
This isn’t just another tool — it’s a weapon in your trading arsenal.
🔹 Dedicated to my mentor, A.K., whose wisdom and legacy guide my work.
🔹 Designed around the number 9, the number of completion, transition, and breakthrough.
🔹 Built to help traders act with precision, discipline, and clarity.
But above all, I give praise and glory to Gd — the true source of wisdom, insight, and success.
Markets will test your patience and your skill, but faith tests your soul. Through every challenge, every victory, and every setback, Gd remains the constant.
This tool is simply another way to use the gifts He has given — to help others rise.
⚡ Stay Ready, Stay Sharp
The markets are a battlefield. But with the right tools, the right strategy, and the right mindset — you will always stay 10 steps ahead.
🔥 Stay locked. Stay loaded. Trade with precision. 🔥
Gd bless, and may He guide us all to wisdom and success. 🙏

Pivot Candle PatternsPivot Candle Patterns Indicator
Overview
The PivotCandlePatterns indicator is a sophisticated trading tool that identifies high-probability candlestick patterns at market pivot points. By combining Williams fractals pivot detection with advanced candlestick pattern recognition, this indicator targets the specific patterns that statistically show the highest likelihood of signaling reversals at market tops and bottoms.
Scientific Foundation
The indicator is built on extensive statistical analysis of historical price data using a 42-period Williams fractal lookback period. Our research analyzed which candlestick patterns most frequently appear at genuine market reversal points, quantifying their occurrence rates and subsequent success in predicting reversals.
Key Research Findings:
At Market Tops (Pivot Highs):
- Three White Soldiers: 28.3% occurrence rate
- Spinning Tops: 13.9% occurrence rate
- Inverted Hammers: 11.7% occurrence rate
At Market Bottoms (Pivot Lows):
- Three Black Crows: 28.4% occurrence rate
- Hammers: 13.3% occurrence rate
- Spinning Tops: 13.1% occurrence rate
How It Works
1. Pivot Point Detection
The indicator uses a non-repainting implementation of Williams fractals to identify potential market turning points:
- A pivot high is confirmed when the middle candle's high is higher than surrounding candles within the lookback period
- A pivot low is confirmed when the middle candle's low is lower than surrounding candles within the lookback period
- The default lookback period is 2 candles (user adjustable from 1-10)
2. Candlestick Pattern Recognition
At identified pivot points, the indicator analyzes candle properties using these parameters:
- Body percentage threshold for Spinning Tops: 40% (adjustable from 10-60%)
- Shadow percentage threshold for Hammer patterns: 60% (adjustable from 40-80%)
- Maximum upper shadow for Hammer: 10% (adjustable from 5-20%)
- Maximum lower shadow for Inverted Hammer: 10% (adjustable from 5-20%)
3. Pattern Definitions
The indicator recognizes these specific patterns:
Single-Candle Patterns:
- Spinning Top : Small body (< 40% of total range) with significant upper and lower shadows (> 25% each)
- Hammer : Small body (< 40%), very long lower shadow (> 60%), minimal upper shadow (< 10%), closing price above opening price
- Inverted Hammer : Small body (< 40%), very long upper shadow (> 60%), minimal lower shadow (< 10%)
Multi-Candle Patterns:
- Three White Soldiers : Three consecutive bullish candles, each closing higher than the previous, with each open within the previous candle's body
- Three Black Crows : Three consecutive bearish candles, each closing lower than the previous, with each open within the previous candle's body
4. Visual Representation
The indicator provides multiple visualization options:
- Highlighted candle backgrounds for pattern identification
- Text or dot labels showing pattern names and success rates
- Customizable colors for different pattern types
- Real-time alert functionality on pattern detection
- Information dashboard displaying pattern statistics
Why It Works
1. Statistical Edge
Unlike traditional candlestick pattern indicators that simply identify patterns regardless of context, PivotCandlePatterns focuses exclusively on patterns occurring at statistical pivot points, dramatically increasing signal quality.
2. Non-Repainting Design
The pivot detection algorithm only uses confirmed data, ensuring the indicator doesn't repaint or provide false signals that disappear on subsequent candles.
3. Complementary Pattern Selection
The selected patterns have both:
- Statistical significance (high frequency at pivots)
- Logical market psychology (reflecting institutional supply/demand changes)
For example, Three White Soldiers at a pivot high suggests excessive bullish sentiment reaching exhaustion, while Hammers at pivot lows indicate rejection of lower prices and potential buying pressure.
Practical Applications
1. Reversal Trading
The primary use is identifying potential market reversals with statistical probability metrics. Higher percentage patterns (like Three White Soldiers at 28.3%) warrant more attention than lower probability patterns.
2. Confirmation Tool
The indicator works well when combined with other technical analysis methods:
- Support/resistance levels
- Trend line breaks
- Divergences on oscillators
- Volume analysis
3. Risk Management
The built-in success rate metrics help traders properly size positions based on historical pattern reliability. The displayed percentages reflect the probability of the pattern successfully predicting a reversal.
Optimized Settings
Based on extensive testing, the default parameters (Body: 40%, Shadow: 60%, Shadow Maximums: 10%, Lookback: 2) provide the optimal balance between:
- Signal frequency
- False positive reduction
- Early entry opportunities
- Pattern clarity
Users can adjust these parameters based on their timeframe and trading style, but the defaults represent the statistically optimal configuration.
Complementary Research: Reclaim Analysis
Additional research on "reclaim" scenarios (where price briefly breaks a level before returning) showed:
- Fast reclaims (1-2 candles) have 70-90% success rates
- Reclaims with increasing volume have 53.1% success rate vs. decreasing volume at 22.6%
This complementary research reinforces the importance of candle patterns and timing at critical market levels.

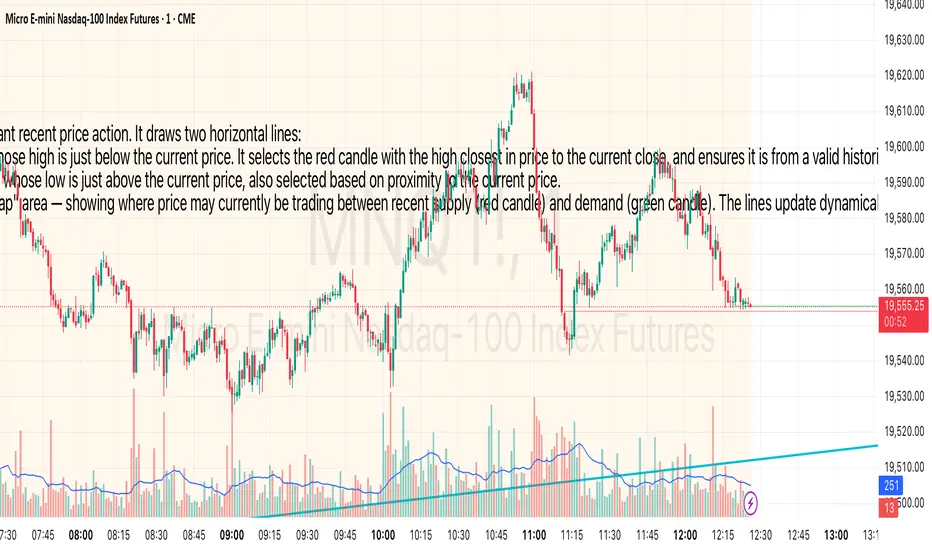
Price Channel MarkerThis indicator identifies a dynamic price channel based on the most relevant recent price action. It draws two horizontal lines:
* 🔴 Red Line – Marks the high of the most recent red candle (bearish) whose high is just below the current price. It selects the red candle with the high closest in price to the current close, and ensures it is from a valid historical context (ignoring recent highs above the current price).
* 🟢 Green Line – Marks the low of the most recent green candle (bullish) whose low is just above the current price, also selected based on proximity to the current price.
Together, these two lines define a potential price compression zone or "trap" area — showing where price may currently be trading between recent supply (red candle) and demand (green candle). The lines update dynamically and extend into the future to help visualize breakout or rejection levels.
Use Cases:
* Spot potential breakout zones.
* Define short-term support and resistance.
* Filter for entries in range-bound or squeeze conditions.
Customization:
* Adjustable lookback range (up to 5000 bars).
* Colors and line style are easily customizable.
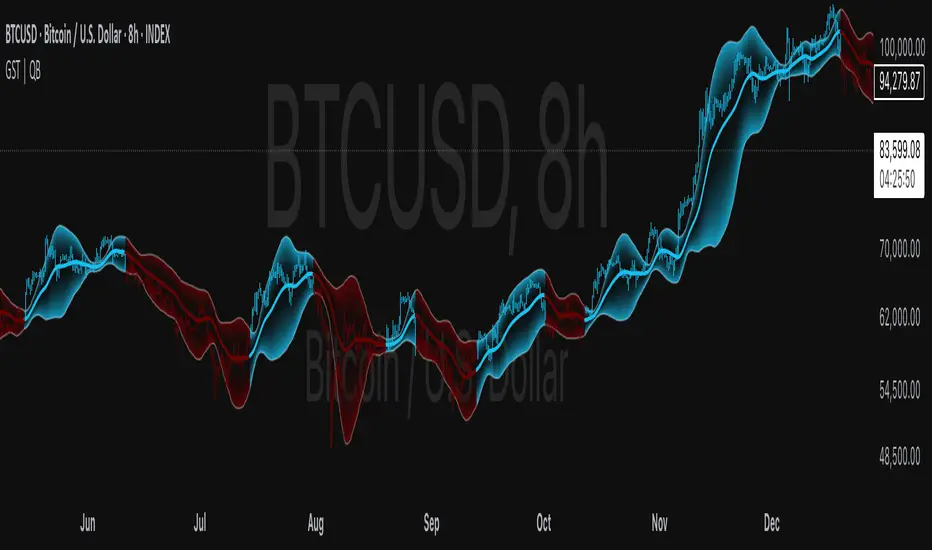
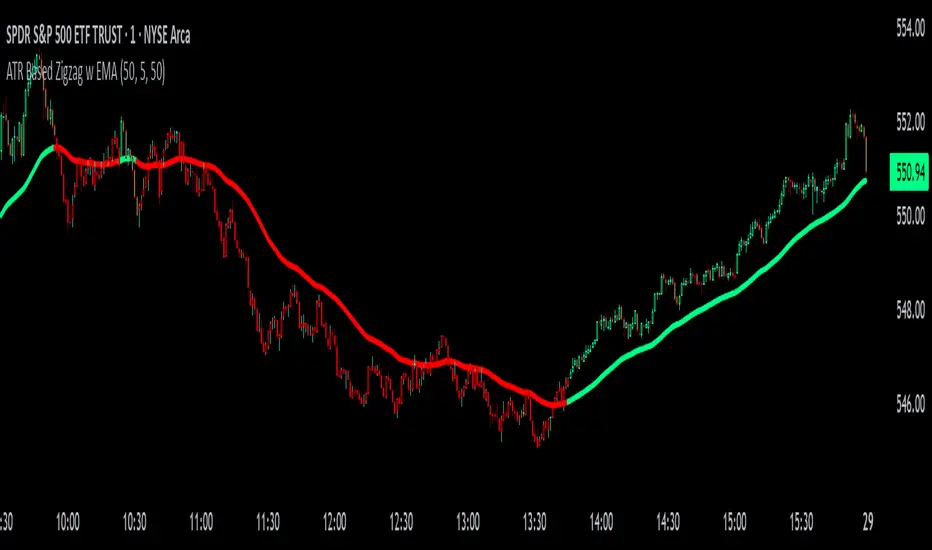
ATR Based Zigzag w EMAThe "ATR Based Zigzag with EMA" indicator is a refined trend-following tool designed for traders who demand clarity, precision, and robust trend detection. This script uses an ATR (Average True Range)-based breakout mechanism to dynamically determine the current market trend, while overlaying a clean, smoothed EMA (Exponential Moving Average) line to visually represent the active directional bias.
The indicator continuously tracks new swing highs and lows based on ATR volatility thresholds. When price moves sufficiently against the current trend — exceeding an ATR-multiplied distance — the trend is considered reversed. This adaptive method ensures that trend flips are based not on arbitrary price action, but on meaningful, volatility-adjusted movements.
Instead of plotting zigzag-style pivots which can create visual noise, the indicator draws a single, smooth EMA line calculated from the median price ((high + low) / 2). The color of the line shifts instantly based on the active trend: green (or your customized color) for uptrends, and red for downtrends. In addition, individual price bars are optionally colored to match the trend, further enhancing at-a-glance clarity without cluttering the chart.
Key user-defined inputs include the ATR length, ATR multiplier (sensitivity for trend flips), EMA smoothing length (responsiveness of the trend line), and full color customization for uptrend and downtrend states.
This indicator excels at providing a clear and immediate understanding of trend conditions, making it highly effective for:
Trend-following strategies
Reversal spotting based on volatility breaks
Entry/exit confirmation
Visual chart cleanliness and minimalism
Whether used standalone or alongside other tools, the "ATR Based Zigzag with EMA" offers a disciplined, volatility-sensitive view of market structure — engineered for traders who refuse to tolerate noise, hesitation, or ambiguity in their decision-making.
US30 Smart Money 5M/4H Strategy🧠 How It Works
✅ 1. 4H Trend Bias Detection
Uses the 4-hour chart (internally) to determine if the market is in an uptrend or downtrend.
Background turns green for bullish trend, red for bearish trend.
This helps filter trades — only take longs during uptrend, shorts during downtrend.
✅ 2. Liquidity Sweeps (Stop Hunts) on 5M
Highlights candles that break previous highs/lows and then reverse (typical of institutional stop raids).
Draws a shaded red box above sweep-high candles and green box under sweep-lows.
These indicate key reversal zones.
✅ 3. Order Block Zones
Detects bullish/bearish engulfing patterns after liquidity sweeps.
Draws a supply or demand zone box extending forward.
These zones show where institutions likely placed large orders.
✅ 4. FVG Midpoint from 30-Min Chart
Detects Fair Value Gaps (imbalances) on the 30-minute chart.
Plots a line at the midpoint of the gap (EQ level), which is often revisited for entries or rejections.
✅ 5. Buy/Sell Signals (Non-Repainting)
Buy = 4H uptrend + 5M liquidity sweep low + bullish engulfing candle.
Sell = 4H downtrend + 5M liquidity sweep high + bearish engulfing.
Prints green “BUY” or red “SELL” label on the chart — these do not repaint.
📈 How to Use It
Wait for trend bias — only take trades in the direction of the 4H trend.
Watch for liquidity sweep boxes — these hint a stop hunt just occurred.
Look for a signal label (BUY/SELL) — confirms entry criteria.
Use FVG EQ lines & Order Block zones as confluence or targets.
Take trades after NY open (9:30 AM EST) for best momentum.

Apex Edge SMC Tactical Suite
🛰 Apex Edge SMC Tactical Suite
Apex Edge SMC Tactical Suite is a precision-engineered multi-signal tool designed for advanced traders who demand real-time edge detection, breakout identification, and smart volatility-based risk placement. Built to blend seamlessly into any price action, SMC, or momentum-based strategy.
🔧 Core Features:
📍 Entry Signals
Green & red arrows appear only when a candle meets strict "Power Candle" criteria:
High momentum breakout
Volume spike confirmation
OBV spike divergence
Trend & HTF filter optional
Volatility-adjusted stop placement
💥 Power Candles
Smart detection of explosive volume+range candles
Custom "fuel score" system ranks their momentum potential
Displays as either candle highlights or subtle labels
📊 Fuel Meter
RSI-based energy tracker with customizable threshold
Plots real-time bar strength on a mini histogram
🧠 Trap Detection + Reversals
Detects stop hunt wicks or "liquidity traps"
Shows reversal diamonds on potential reclaim setups
Built-in swing logic confirms trap reversals
🧮 HTF Filtering
Optional higher-timeframe trend filter via Hull MA
Keeps signals aligned with broader market direction
📦 TP/SL Zones
Risk is calculated using volatility clustering (recent swing zones)
TP auto-calculated using ATR-based expansion
🔔 Alerts Included:
✅ Power Candle Detection
✅ Long/Short Entry Alerts
✅ Exit Signal Alerts
✅ Trap Defense Alerts
✅ Trap Reversal Confirmations
🎯 Ideal For:
SMC / ICT traders
Breakout traders
Trend followers
Scalpers / intraday setups
Momentum + volume combo traders
⚠️ Tip: Best paired with clean chart layouts, market structure, or order block frameworks. Can be combined with internal/external liquidity sweep logic for extra confluence.
Feel free to play around with the code and if you're a professional coder (unlike me) then please tag me into any versions that you can make better. Enjoy!
Disclaimer - This script was created entirely with many hours using the assistance of ChatGPT

cd_full_poi_CxOverview
This indicator tracks the price in 16 different time frames (optional) in order to answer the question of where the current price has reacted or will react.
It appears on the chart and in the report table when the price approaches or touches the fvg or mitigations (order block / supply-demand), the rules of which will be explained below.
In summary, it follows the fvg and mitigations in the higher timeframe than the lower timeframe.
Many traders see fvg or mitigates as an point of interest and see the high, low swept in those zones as a trading opportunity. Key levels, Session high/lows and Equal high and lows also point of interest.
If we summarise the description of the point of interest ;
1- Fair value gaps (FVG) (16 time frames)
2- Mitigation zones (16 time frames)
3- Previous week, day, H4, H1 high and low levels
4- Sessions zones (Asia, London and New York)
5- Equal high and low levels are in indicator display.
Details:
1- Fair Value Gaps : It is simply described as a price gap and consists of a series of 3 candles. The reaction of the price to the gap between the 1st and 3rd candle wicks is observed.
The indicator offers 3 options for marking. These are :
1-1- ‘Colours are unimportant’: candle colours are not considered for marking. Fvg formation is sufficient.(Classical)
1-2- ‘First candle opposite colour’ : when a price gap occurs, the first candle of a series of 3 candles must be opposite.
For bullish fvg : bearish - bullish - free
For Bearish fvg : bullish - bearish - free
1-3- ‘All same colour’ : all candles in a series of 3 candles must be the same direction.
For bullish fvg: bullish - bullish - bullish
For bearish fvg : bearish - bearish – bearish
Examples:
2- Mitigation zones: Opposite candles with a fvg in front of them or candles higher/lower than the previous and next candle and with the same colour as the fvg series are marked.
Examples :
3- Previous week, day, H4, H1 high and low levels
4- Sessions regions (Asia, London and New York)
5- Equal high and low levels:
Annotation: Many traders want to see a liquidity grab on the poi, then try to enter the trade with the appropriate method.
Among the indicators, there is also the indication of grabs/swepts that occur at swing points. It is also indicated when the area previously marked as equal high/low is violated (grab).
At the end, sample setups will be shown to give an idea about the use of the indicator.
Settings:
- The options to be displayed from the menu are selected by ticking.
- 1m, 2m, 3m, 5m, 5m, 10m, 15m, 30m, h1, h4, h4, h6, h8, h12, daily, weekly, monthly and quarterly, 16 time zones in total can be displayed.
- The ‘Collapse when the price touches mitigate’ tab controls whether to collapse the box as the price moves into the inner region of the mitigate. If not selected, the size of the mitigate does not change.
- ‘Approach limit =(ATR / n)’ tab controls how close the price is to the fvg or mitigate. Instant ATR(10) value is calculated by dividing by the entered ‘n’ value.
- All boxes and lines are automatically removed from the screen when the beyond is closed.
- Colour selections, table, text features are controlled from the menu.
- Sessions hours are set as standard hours, the user can select special time zones. Timezone is set to GMT-4.
- On the candle when the price touches fvg or mitigate, the timeframe information of the POI is shown in the report table together with the graphical representation.
The benefits and differences :
1- We can evaluate the factors we use for setup together.
2- We are aware of what awaits us in the high time frame in the following candles.
3- It offers the user the opportunity to be selective with different candle selection options in fvg selection.
4- Mitige areas are actually unmitige areas because they have a price gap in front of them. The market likes to retest these areas.
5- Equal high/low zones are the levels that the price creates to accumulate liquidity or fails to go beyond (especially during high volume hours). Failure or crossing of the level may give a reversal or continuation prediction.
Sample setup 1:
Sample setup 2:
Sample setup 3:
Cheerful trades…
Enjoy…

Fractal Wave MarkerFractal Wave Marker is an indicator that processes relative extremes of fluctuating prices within 2 periodical aspects. The special labeling system detects and visually marks multi-scale turning points, letting you visualize fractal echoes within unfolding cycles dynamically.
What This Indicator Does
Identifies major and minor swing highs/lows based on adjustable period.
Uses Phi in power exponent to compute a higher-degree swing filter.
Labels of higher degree appear only after confirmed base swings — no phantom levels, no hindsight bias. What you see is what the market has validated.
Swing points unfold in a structured, alternating rhythm . No two consecutive pivots share the same hierarchical degree!
Inspired by the Fractal Market Hypothesis, this script visualizes the principle that market behavior repeats across time scales, revealing structured narrative of "random walk". This inherent sequencing ensures fractal consistency across timeframes. "Fractal echoes" demonstrate how smaller price swings can proportionally mirror larger ones in both structure and timing, allowing traders to anticipate movements by recursive patterns. Cycle Transitions highlight critical inflection points where minor pivots flip polarity such as a series of lower highs progress into higher highs—signaling the birth of a new macro trend. A dense dense clusters of swing points can indicate Liquidity Zones, acting as footprints of institutional accumulation or distribution where price action validates supply and demand imbalances.
Visualization of nested cycles within macro trend anchors - a main feature specifically designed for the chartists who prioritize working with complex wave oscillations their analysis.

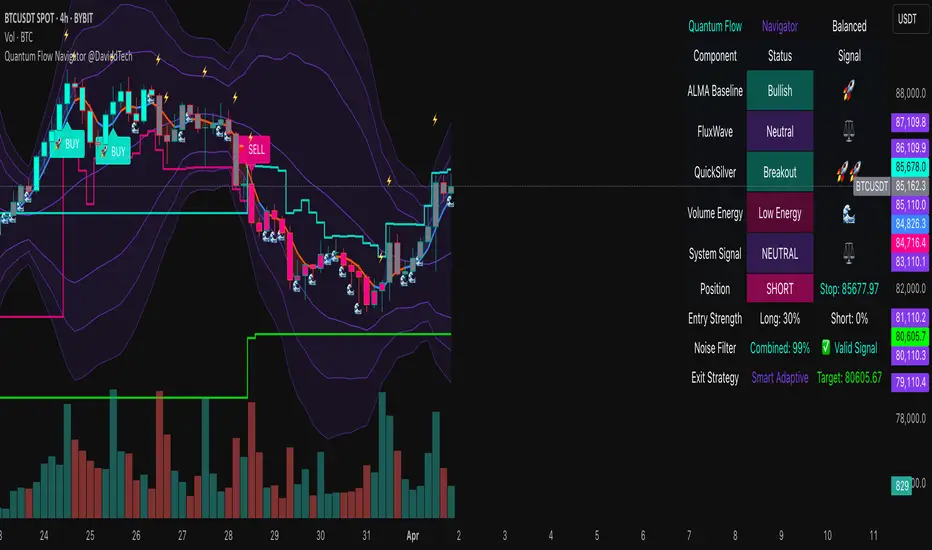
Quantum Flow Navigator @DaviddTechQuantum Flow Navigator – DaviddTech
Precision Strategy Builder Powered by Adaptive Filters, Statistical Noise Reduction & Multi-Modal Confirmation
🚀 Bullish Signal : Enter when ALMA, FluxWave, and QuickSilver all confirm bullish trend, with high volume and valid noise filter state.
🔻 Bearish Signal : Enter short when all components align bearishly and filters validate the signal.
🚪 Exit : Automatically managed by dynamic SL/TP or indicator-based reversal logic.
✅ Overview & DaviddTech Methodology
Quantum Flow Navigator is an advanced, multi-component trading system engineered around the strict modular logic of the DaviddTech methodology .
It integrates every core component required for a fully rule-based and signal-driven strategy—baseline, confirmations, volume filter, exit system, and noise filter.
Designed for traders who demand structure, clarity, and data-backed decision-making on 15M, 1H, and 4H charts.
🔍 Indicator Components
Baseline: Adaptive ALMA Filter
Smooth and responsive dynamic trend detection, with momentum validation and optional filled zones for enhanced visual feedback.
Confirmation #1: FluxWave Oscillator
Developed from an enhanced Trendlio concept by @dudeowns , FluxWave uses ALMA-smoothed rate-of-change logic with configurable signal behavior.
Confirmation #2: QuickSilver Band System
Custom breakout engine that maps volatility envelopes using multi-layered deviation bands for clear confirmation of structure breaks and trend direction.
Volume Filter: Normalized Volume Energy
Innovative volume filter inspired by @ceyhun 's work. Filters trades by classifying energy into High, Normal, or Low based on normalized volume context.
Exit System: Dynamic Momentum Stop Loss
Choose from Smart Adaptive, Trailing, Stepped, Percentage, ATR, or Volatility-adjusted logic. Supports TP via risk/reward, ATR multiples, or percentage targets.
Noise Filtration: Quantum Statistical Noise Reduction
Fuses Kalman smoothing with wavelet decomposition to eliminate non-signal noise and improve trade quality and confidence.
🎨 Visual System & Dashboard
🚀/🔻/🚪 Emoji Labels : Buy, sell, and exit trades clearly marked for instant recognition.
Color-Shifting Bars : Reflect FluxWave’s trend bias in real-time.
ALMA Fill Zone : Visual trend envelope between price and ALMA baseline.
QuickSilver Bands : Volatility envelopes with graduated depth for support/resistance awareness.
SL & TP Visuals : Dynamic stop-loss and take-profit zones plotted directly on chart.
Navigator Panel : In-chart dashboard displays real-time trend status, volume energy, noise filter state, signal strength, and active position tracking.
📈 How to Trade with It
Entry Mode Selection : Choose between Combined, ALMA, FluxWave, QuickSilver, or Custom scoring logic.
Final Signals : Trigger only when confirmations align, volume energy is valid, and noise is low.
Dashboard Summary : Use real-time signal display to validate entry strength.
Timeframes : 15M–1H recommended for swing/intraday setups; 5M–15M for automation.
💡 Advanced Features
Entry Strength Scoring: Composite weight of all active components + filters.
Cooldown System: Limits excessive signals in volatile periods.
Multiple Exit Strategies: SL & TP modes with optional indicator-based exits.
Statistical Filtering: Wavelet + Kalman combination optimizes entry confidence.
Full Alert Suite: Covers entries, exits, filter triggers, volume states, and more.
🧠 Suggested Strategy Usage
Wait for full confirmation from ALMA, FluxWave, and QuickSilver.
Ensure volume energy is High and noise filter confirms trend clarity.
Use adaptive SL/TP or indicator-based exits.
Monitor dashboard for live signal strength ≥ threshold.
Use “Balanced” mode for general use; switch to “Aggressive” for tighter signals.
📝 Credits & Originality
Concept based on DaviddTech’s component-driven methodology .
FluxWave Oscillator built as an evolved version of Trendlio with full signal customization — credit @dudeowns .
Volume Energy Filter adapted from the work of @ceyhun .
Noise filtration and system architecture developed independently using Pine Script v6.
All code and logic is original, non-rehashed, and completely refactored to ensure uniqueness.
Quantum Flow Navigator fuses adaptive baselines, confirmation logic, energy-based filters, and statistical refinement into a precision signal engine—optimized for traders who value structure, clarity, and control.
Liquidity Zones Alerts"Liquidity Zones Alerts" is a powerful smart-money-based indicator designed to detect key liquidity grabs and provide high-probability reversal signals using a combination of market structure, volume, volatility, and candlestick confirmation.
🧠 How It Works
The core logic of this indicator is built around the Smart Money Concepts:
🔺 Liquidity Sweeps: Detects when price takes out previous daily or weekly highs/lows, suggesting stop hunts or engineered liquidity moves by institutional players.
📈 Volume Filter: Ensures signals only appear during above-average volume, filtering out noise and low-interest moves.
⚡ Volatility Filter: Flags high-range candles relative to the average, catching flash crashes/spikes that often precede strong reversals.
🔄 Engulfing Candle Confirmation: Confirms entry with a bullish or bearish engulfing pattern after liquidity is taken — increasing signal reliability.
🧭 Premium/Discount Zone Logic: Trades are filtered to ensure longs are only taken in discount zones, and shorts in premium zones, using a 20-period market range for context.
📌 Features
✅ Daily & Weekly liquidity zones toggle
✅ Visual signals with clean 🔻(short) & 🔺(long) arrows
✅ Auto-detection of flash crashes
✅ Alerts on both long and short setups
✅ Optional previous high/low level plotting for context
✅ Background highlighting of valid signal candles
✅ Multi-timeframe friendly and compatible with any asset
🛠️ Use Case
Whether you're a scalper or a swing trader, this tool helps you spot institutional entry zones before the move happens. It works especially well when combined with your existing bias or supply/demand zones.
💬 “Price doesn't move randomly — it hunts liquidity. This indicator shows you where and when it happens.”

SMC+The "SMC+" indicator is a comprehensive tool designed to overlay key Smart Money Concepts (SMC) levels, support/resistance zones, order blocks (OB), fair value gaps (FVG), and trap detection on your TradingView chart. It aims to assist traders in identifying potential areas of interest based on price action, swing structures, and volume dynamics across multiple timeframes. This indicator is fully customizable, allowing users to adjust lookback periods, colors, opacity, and sensitivity to suit their trading style.
Key Components and Functionality
1. Key Levels (Support and Resistance)
This section plots horizontal lines representing support and resistance levels based on highs and lows over three distinct lookback periods, plus daily nearest levels.
Short-Term Lookback Period (Default: 20 bars)
Plots the highest high (short_high) and lowest low (short_low) over the specified period.
Visualized as dotted lines with customizable colors (Short-Term Resistance Color, Short-Term Support Color) and opacity (Short-Term Resistance Opacity, Short-Term Support Opacity).
Adjustment Tip: Increase the lookback (e.g., to 30-50) for less frequent but stronger levels on higher timeframes, or decrease (e.g., to 10-15) for scalping on lower timeframes.
Long-Term Lookback Period (Default: 50 bars)
Plots broader support (long_low) and resistance (long_high) levels using a solid line style.
Customizable via Long-Term Resistance Color, Long-Term Support Color, and their respective opacity settings.
Adjustment Tip: Extend to 100-200 bars for swing trading or major trend analysis on daily/weekly charts.
Extra-Long Lookback Period (Default: 100 bars)
Identifies significant historical highs (extra_long_high) and lows (extra_long_low) with dashed lines.
Configurable with Extra-Long Resistance Color, Extra-Long Support Color, and opacity settings.
Adjustment Tip: Use 200-500 bars for monthly charts to capture macro-level key zones.
Daily Nearest Resistance and Support Levels
Dynamically calculates the nearest resistance (daily_res_level) and support (daily_sup_level) based on the current day’s price action relative to historical highs and lows.
Displayed with Daily Resistance Color and Daily Support Color (with opacity options).
Adjustment Tip: Works best on intraday charts (e.g., 15m, 1h) to track daily pivots; combine with volume profile for confirmation.
How It Works: These levels update dynamically as new highs/lows form, providing a visual guide to potential reversal or breakout zones.
2. SMC Inputs (Smart Money Concepts)
This section identifies swing structures, order blocks, fair value gaps, and entry signals based on SMC principles.
SMC Swing Lookback Period (Default: 12 bars)
Defines the period for detecting swing highs (smc_swing_high) and lows (smc_swing_low).
Adjustment Tip: Increase to 20-30 for smoother swings on higher timeframes; reduce to 5-10 for faster signals on lower timeframes.
Minimum Swing Size (%) (Default: 0.5%)
Filters out minor price movements to focus on significant swings.
Adjustment Tip: Raise to 1-2% for volatile markets (e.g., crypto) to avoid noise; lower to 0.2-0.3% for forex pairs with tight ranges.
Order Block Sensitivity (Default: 1.0)
Scales the size of detected order blocks (OBs) for bullish reversal (smc_ob_bull), bearish reversal (smc_ob_bear), and continuation (smc_cont_ob).
Visuals include customizable colors, opacity, border thickness, and blinking effects (e.g., SMC Bullish Reversal OB Color, SMC Bearish Reversal OB Blink Thickness).
Adjustment Tip: Increase to 1.5-2.0 for wider OBs in choppy markets; keep at 1.0 for precision in trending conditions.
Minimum FVG Size (%) (Default: 0.3%)
Sets the minimum gap size for Fair Value Gaps (fvg_high, fvg_low), displayed as boxes with Fair Value Gap Color and FVG Opacity.
Adjustment Tip: Increase to 0.5-1% for larger, more reliable gaps; decrease to 0.1-0.2% for scalping smaller inefficiencies.
How It Works:
Bullish Reversal OB: Detects a bearish candle followed by a bullish break, marking a potential demand zone.
Bearish Reversal OB: Identifies a bullish candle followed by a bearish break, marking a supply zone.
Continuation OB: Spots strong bullish momentum after a prior high, indicating a continuation zone.
FVG: Highlights bullish gaps where price may retrace to fill.
Entry Signals: Plots triangles (SMC Long Entry) when price retests an OB with a liquidity sweep or break of structure (BOS).
3. Trap Inputs
This section detects potential bull and bear traps based on price action, volume, and key level rejections.
Min Down Move for Bear Trap (%) (Default: 1.0%)
Sets the minimum drop required after a bearish OB to qualify as a trap.
Visualized with Bear Trap Color, Bear Trap Opacity, and blinking borders.
Adjustment Tip: Increase to 2-3% for stronger traps in trending markets; lower to 0.5% for ranging conditions.
Min Up Move for Bull Trap (%) (Default: 1.0%)
Sets the minimum rise required after a bullish OB to flag a trap.
Customizable with Bull Trap Color, Bull Trap Border Thickness, etc.
Adjustment Tip: Adjust similarly to bear traps based on market volatility.
Volume Lookback for Traps (Default: 5 bars)
Compares current volume to a moving average (avg_volume) to filter low-volume traps.
Adjustment Tip: Increase to 10-20 for confirmation on higher timeframes; reduce to 3 for intraday sensitivity.
How It Works:
Bear Trap: Triggers when price drops significantly after a bearish OB but reverses up with low volume or support rejection.
Bull Trap: Activates when price rises after a bullish OB but fails with low volume or resistance rejection.
Boxes highlight trap zones, resetting when price breaks out.
4. Visual Customization
Line Width (Default: 2)
Adjusts thickness of support/resistance lines.
Tip: Increase to 3-4 for visibility on cluttered charts.
Blink On (Default: Close)
Sets whether OB/FVG borders blink based on Open or Close price interaction.
Tip: Use "Open" for intraday precision; "Close" for confirmed reactions.
Colors and Opacity: Each element (OBs, FVGs, traps, key levels) has customizable colors, opacity (0-100), border thickness (1-5 or 1-7), and blink effects for dynamic visualization.
How to Use SMC+
Setup: Apply the indicator to any chart and adjust inputs based on your timeframe and market.
Key Levels: Watch for price reactions at short, long, extra-long, or daily levels for potential reversals or breakouts.
SMC Signals: Look for entry signals (triangles) near OBs or FVGs, confirmed by liquidity sweeps or BOS.
Traps: Avoid false breakouts by monitoring trap boxes, especially near key levels with low volume.
Notes:
This indicator is a visual aid and does not guarantee trading success. Combine it with other analysis tools and risk management strategies.
Performance may vary across markets and timeframes; test settings thoroughly before use.
For optimal results, experiment with lookback periods and sensitivity settings to match your trading style.
The default settings are optimal for 1 minute and 10 second time frames for small cap low float stocks.
Continuation OB are Blue.
Bullish Reversal OB color is Green
Bearish Reversal OB color is Red
FVG color is purple
Bear Trap OB is red with a green border and often appears with a Bearish Reversal OB signaling caution to a short position.
Bull trap OB is green with a Red border signaling caution to a long position.
All active OB area are highlighted and solid in color while other non active OB area are dimmed.
My personal favorite setups are when we have an active bullish reversal with an active FVG along with an active Continuation OB.
Another personal favorite is the Bearish reversal OB signaling an end to a recent uptrend.
The Trap OB detection are also a unique and Original helpful source of information.
The OB have a white boarder by default that are colored black giving a simulated blinking effect when price is acting in that zone.
The Trap OB border are colored with respect to direction of intended trap, all of which can be customized to personal style.
All vaild OB zones are shown compact in size ,a unique and original view until its no longer valid.

NR_VersatilitiesLibrary "NR_Versatilities"
Versatilities (aka, Versatile Utilities) includes:
- Seventeen Price Variants returned as a tuple,
- Eight Smoothing functions rolled into one,
- Pick any Past Value from any series with offset,
- Or just the previous value from any series.
pastVal(src, len)
Fetches past value from src that came len distance ago
Parameters:
src (float) : source series
len (int) : lookback distance - (optional) default is 1
Returns: latest src if len <= 0, else src
previous(src)
Fetches past value from src that came len distance ago
Parameters:
src (float) : source series
Returns: previous value in the series if found, else current value
price_variants()
Computes Several different averages using current and previous OHLC values
Returns: Seventeen Uncommon Average Price Combinations
dynamic_MA(matyp, masrc, malen, lsmaoff, almasgm, almaoff, almaflr)
Dynamically computes Eight different MAs on-demand individually, or an average of all taken together
Parameters:
matyp (string) : pick one of these MAs - ALMA, EMA, HMA, LSMA, RMA, SMA, SWMA, WMA, ALL
masrc (float) : source series to compute MA
malen (simple int) : lookback distance for MA
lsmaoff (simple int) : optional LSMA offset - default is 0
almasgm (simple float) : optional ALMA sigma - default is 5
almaoff (simple float) : optional ALMA offset - default is 0.5
almaflr (simple bool) : optional ALMA floor flag - default is false
Returns: MA series for chosen type or, an average of all of them, if chosen so

Gaussian Smooth Trend | QuantEdgeB🧠 Introducing Gaussian Smooth Trend (GST) by QuantEdgeB
🛠️ Overview
Gaussian Smooth Trend (GST) is an advanced volatility-filtered trend-following system that blends multiple smoothing techniques into a single directional bias tool. It is purpose-built to reduce noise, isolate meaningful price shifts, and deliver early trend detection while dynamically adapting to market volatility.
GST leverages the Gaussian filter as its core engine, wrapped in a layered framework of DEMA smoothing, SMMA signal tracking, and standard deviation-based breakout thresholds, producing a powerful toolset for trend confirmation and momentum-based decision-making.
🔍 How It Works
1️⃣ DEMA Smoothing Engine
The indicator begins by calculating a Double Exponential Moving Average (DEMA), which provides a responsive and noise-resistant base input for subsequent filtering.
2️⃣ Gaussian Filter
A custom Gaussian kernel is applied to the DEMA signal, allowing the system to detect smooth momentum shifts while filtering out short-term volatility.
This is especially powerful during low-volume or sideways markets where traditional MAs struggle.
3️⃣ SMMA Layer with Z-Filtering
The filtered Gaussian signal is then passed through a custom Smoothed Moving Average (SMMA). A standard deviation envelope is constructed around this SMMA, dynamically expanding/contracting based on market volatility.
4️⃣ Signal Generation
• ✅ Long Signal: Price closes above Upper SD Band
• ❌ Short Signal: Price closes below Lower SD Band
• ➖ No trade: Price stays within the band → market indecision
✨ Key Features
🔹 Multi-Stage Trend Detection
Combines DEMA → Gaussian Kernel → SMMA → SD Bands for robust signal integrity across market conditions.
🔹 Gaussian Adaptive Filtering
Applies a tunable sigma parameter for the Gaussian kernel, enabling you to fine-tune smoothness vs. responsiveness.
🔹 Volatility-Aware Trend Zones
Price must close outside of dynamic SD envelopes to trigger signals — reducing whipsaws and increasing signal quality.
🔹 Dynamic Color-Coded Visualization
Candle coloring and band fills reflect live trend state, making the chart intuitive and fast to read.
⚙️ Custom Settings
• DEMA Source: Price stream used for smoothing (default: close)
• DEMA Length: Period for initial exponential smoothing (default: 7)
• Gaussian Length / Sigma: Controls smoothing strength of kernel filter
• SMMA Length: Final smoothing layer (default: 12)
• SD Length: Lookback period for standard deviation filtering (default: 30)
• SD Mult Up / Down: Adjusts distance of upper/lower breakout zones (default: 2.5 / 1.8)
• Color Modes: Six distinct color palettes (e.g., Strategy, Warm, Cool)
• Signal Labels: Toggle on/off entry markers ("𝓛𝓸𝓷𝓰", "𝓢𝓱𝓸𝓻𝓽")
📌 Trading Applications
✅ Trend-Following → Enter on confirmed breakouts from Gaussian-smoothed volatility zones
✅ Breakout Validation → Use SD bands to avoid false breakouts during chop
✅ Volatility Compression Monitoring → Narrowing bands often precede large directional moves
✅ Overlay-Based Confirmation → Can complement other QuantEdgeB indicators like K-DMI, BMD, or Z-SMMA
📌 Conclusion
Gaussian Smooth Trend (GST) delivers a precision-built trend model tailored for modern traders who demand both clarity and control. The layered signal architecture, combined with volatility awareness and Gaussian signal enhancement, ensures accurate entries, clean visualizations, and actionable trend structure — all in real-time.
🔹 Summary Highlights
1️⃣ Multi-stage Smoothing — DEMA → Gaussian → SMMA for deep signal integrity
2️⃣ Volatility-Aware Filtering — SD bands prevent false entries
3️⃣ Visual Trend Mapping — Gradient fills + candle coloring for clean charts
4️⃣ Highly Customizable — Adapt to your timeframe, style, and volatility
📌 Disclaimer: Past performance is not indicative of future results. No trading strategy can guarantee success in financial markets.
📌 Strategic Advice: Always backtest, optimize, and align parameters with your trading objectives and risk tolerance before live trading.