Cerca negli script per "ema"
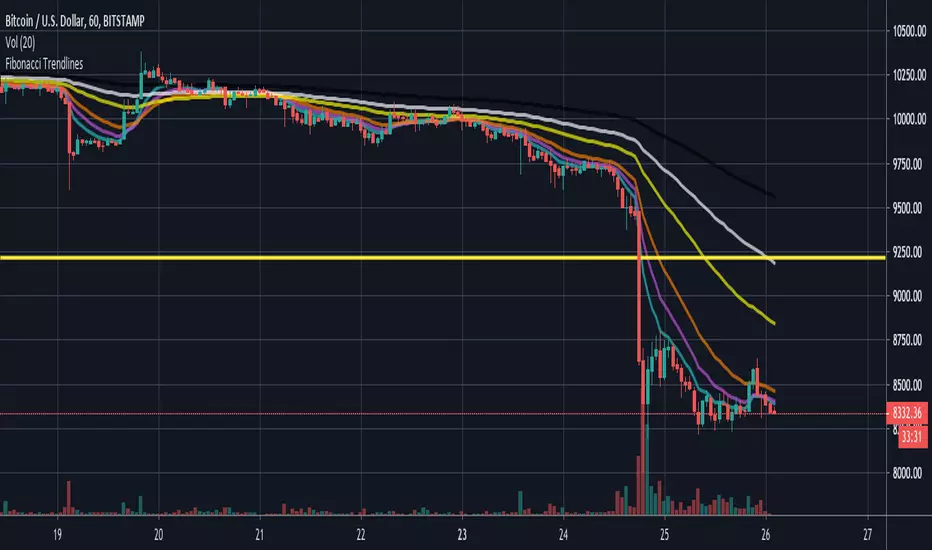
Fibonacci EMA averages (21, 34, 55, 89, 144)Just a simple script that plots the following EMA averages that are based on the fibonacci sequence: 21, 34, 55, 89, 144


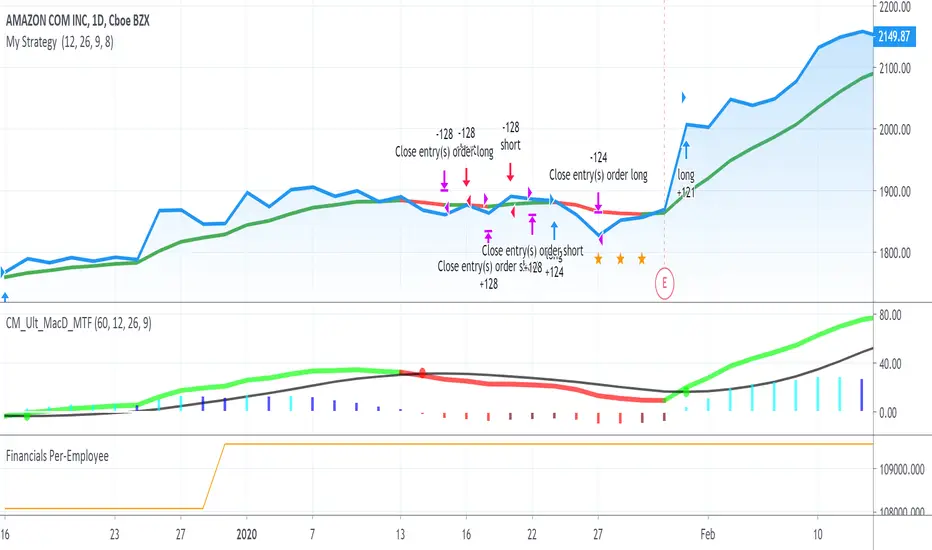
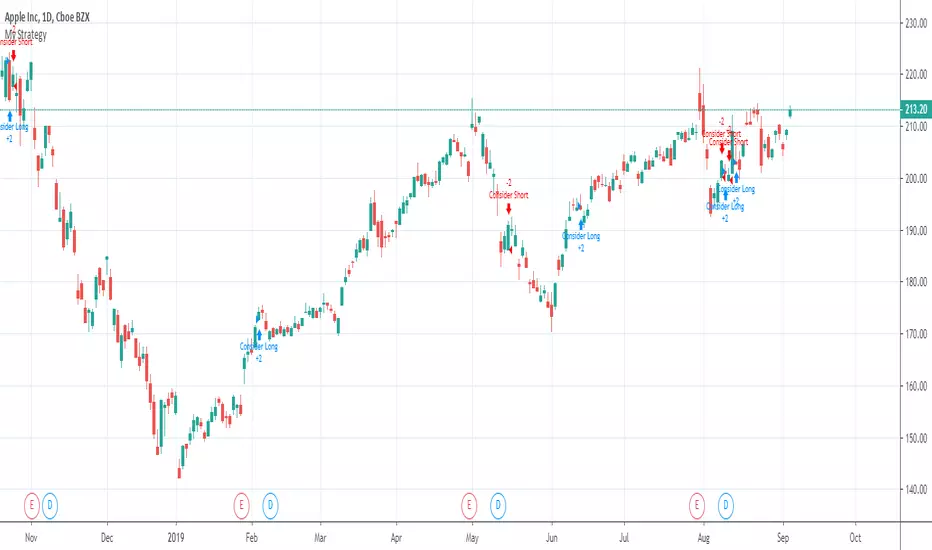
First Script, buy/sell on EMASpent many hours working on a script to find out when the next earnings report is.. there should be a builtin feature but anyways, it's done now.. The strat is to buy and sell based on the EMA (Whatever that is) and to exit all entries if the Earnings report is within a week.

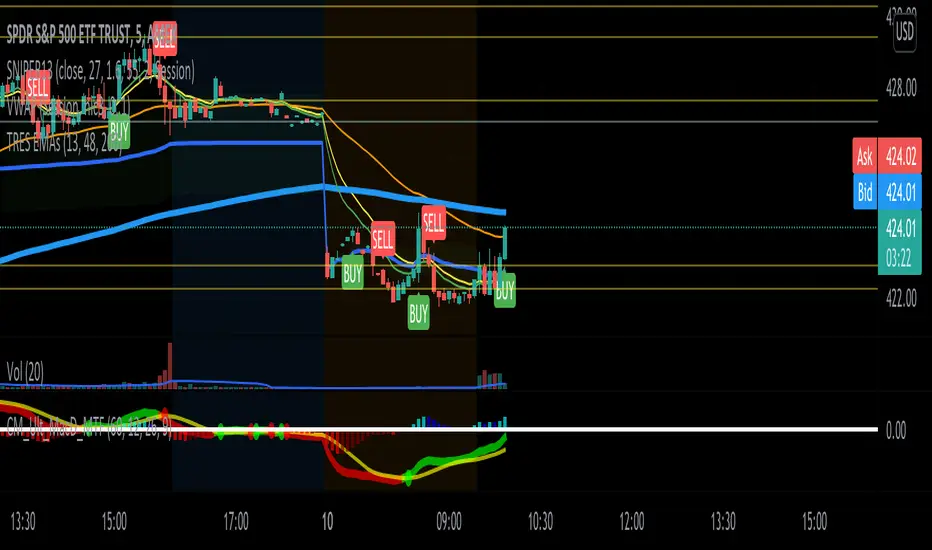
8 On 34 ema'sHi guy's
this simple dude send nice message
consider short/long when 8Ema Cross 34 Ema - If you learn this sutep and clear the false alarms (thats why it's - "consider") you can ride some waves
Enjoy
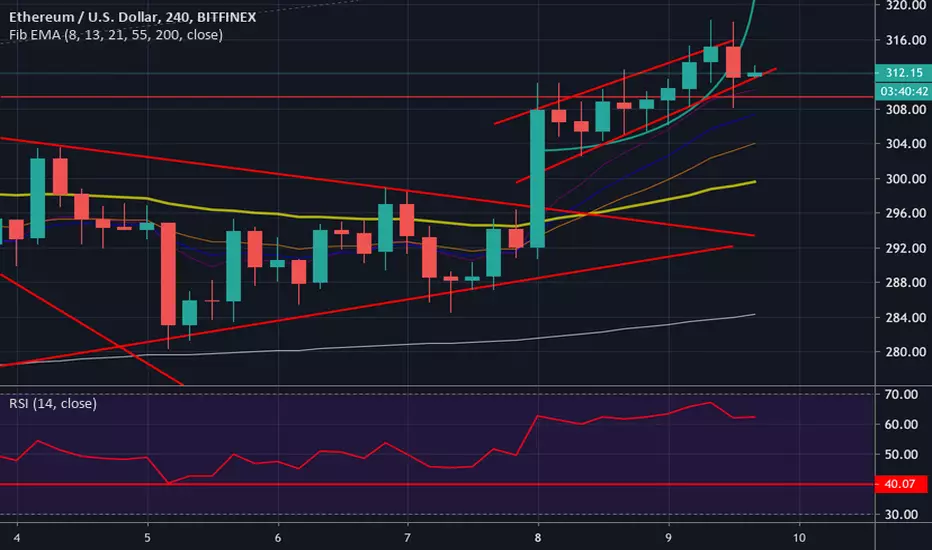

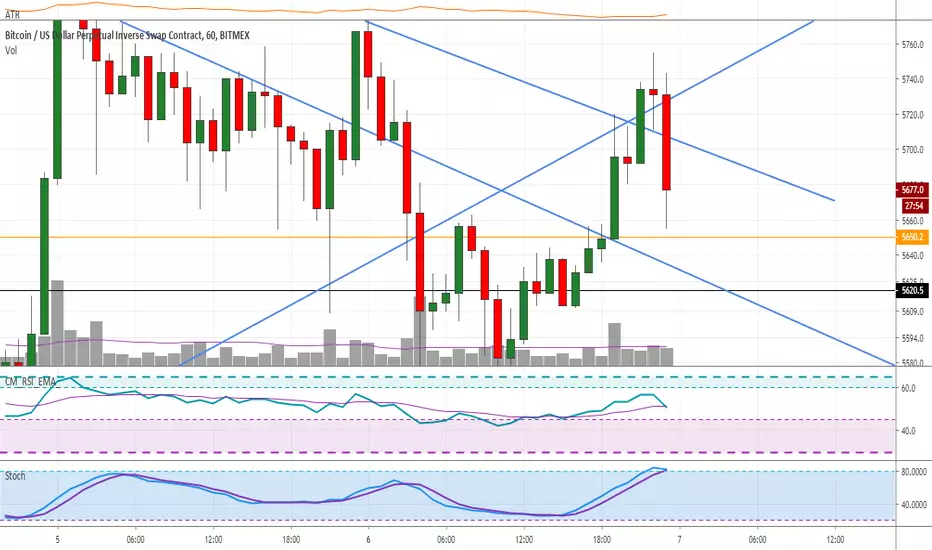
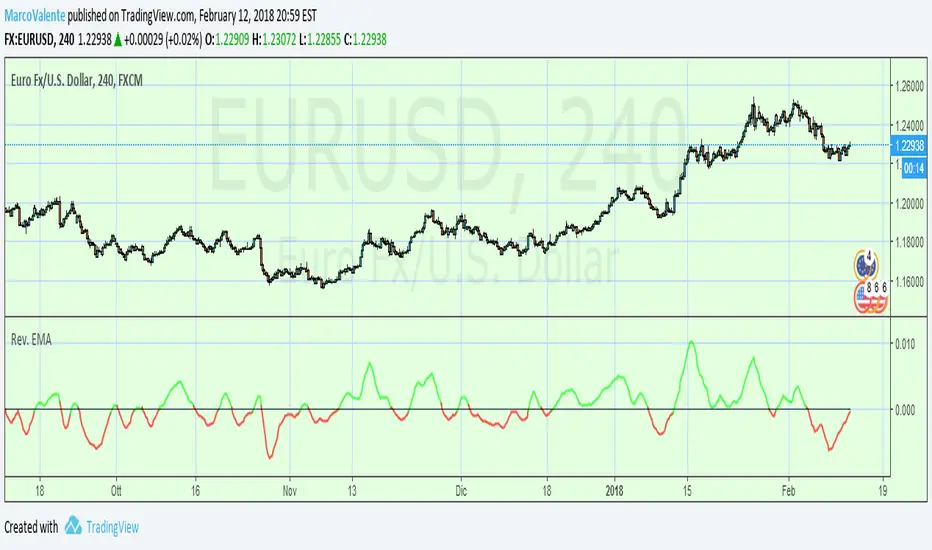
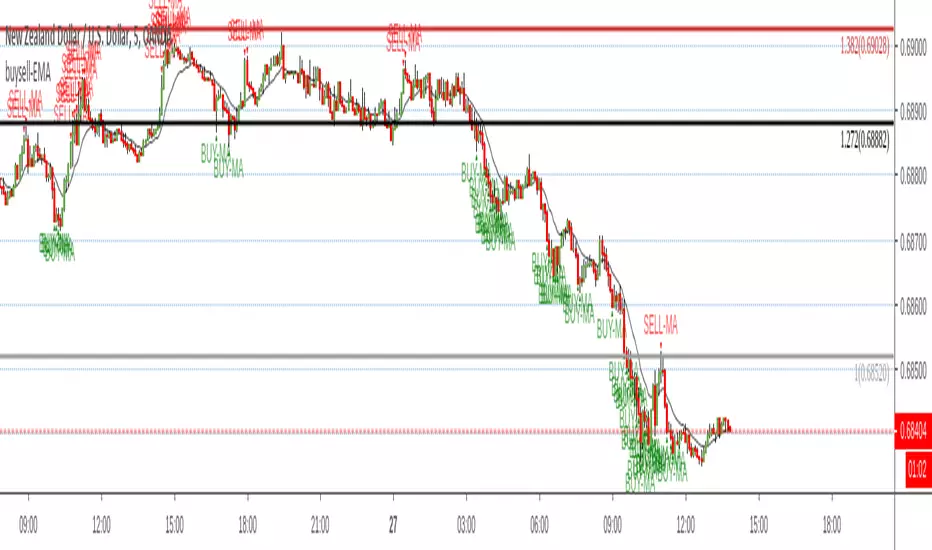
Reversal off EMASimple script find when a probable reversal will start. When price moves sharply away from the 13 EMA a BUY/SELL signal will pop up. Scripted to work on 5m 1h, 4h, and daily chart. But it doesn't work on all charts. Not sure why. I'm a forex trader and use this on NZDUSD. It doesn't give too good results on the JPY charts. I think its a fairly good reversal indicator. It definitely doesn't catch them all, and if there is a strong bearish or bullish impulse it doesn't work too well. But with all indicators, you need other conformations when to get in and when to get out. Hope it helps someone.
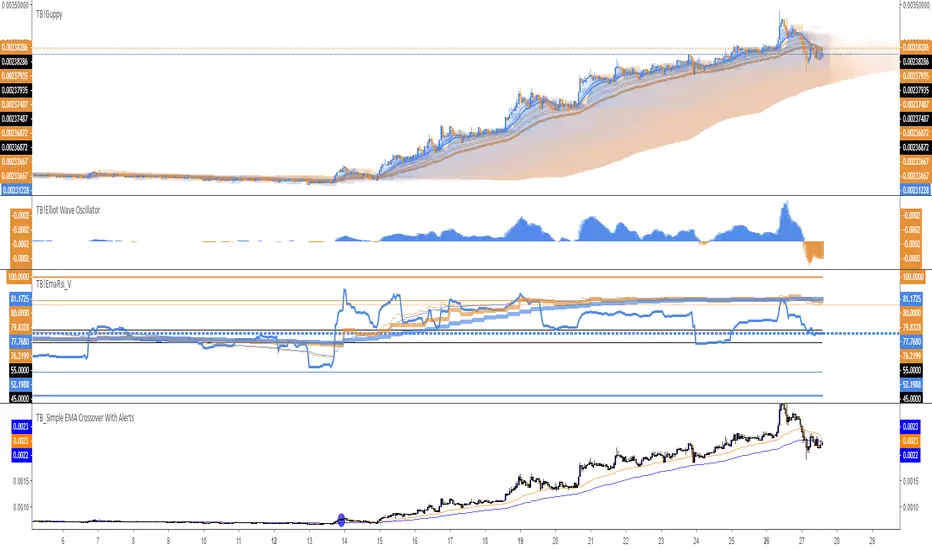
TB_Simple EMA Crossover With AlertsA SImple anti Repaint MTF EMA Crossover with Alerts
For more (Cooler) Custom Scripts PM me


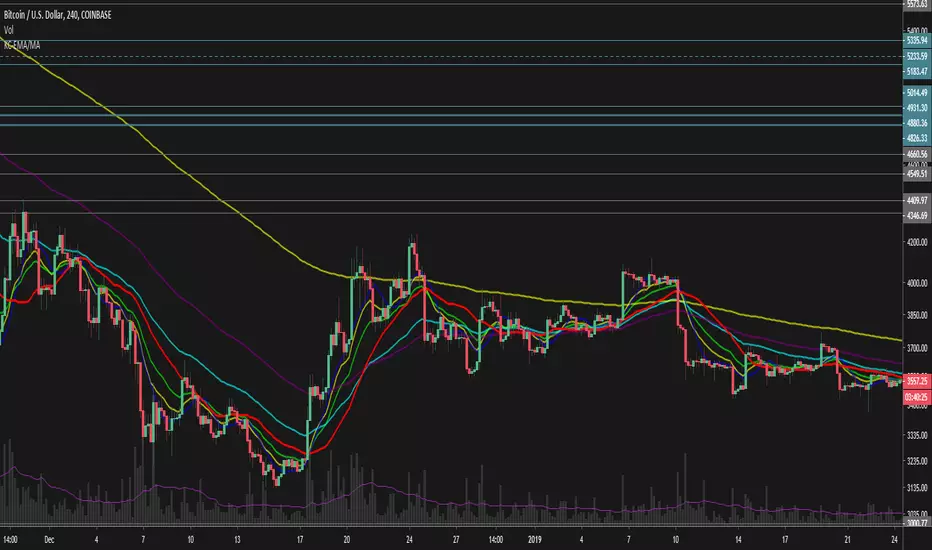
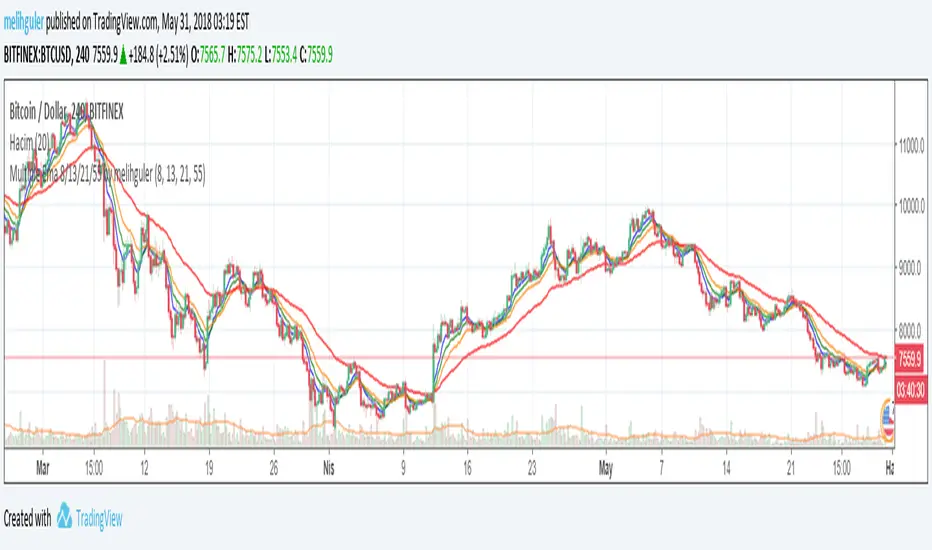
Multiple Ema 8/13/21/55 by melihgulerIn one graph, 4 different periods include EMA (8/13/21/55). It is not recommended for short-term investments. You can get efficient results using at least 4 hours chart.
It is not an investment recommendation. Your use is at your own risk.


Fibonacci EMAs 8 13 21 55Plot 4 EMA based on fibonacci number
5+3 = 8
5 + 8 = 13
13 + 8 = 21
21 + 34 = 55
Quick Mafs :D
If you want to understand how to use them look at Philakone videos on youtube

Reverse EMA “The Reverse EMA Indicator” , author John Ehlers presents very interesting filtering technique based on a Z-transform of the exponential moving average.