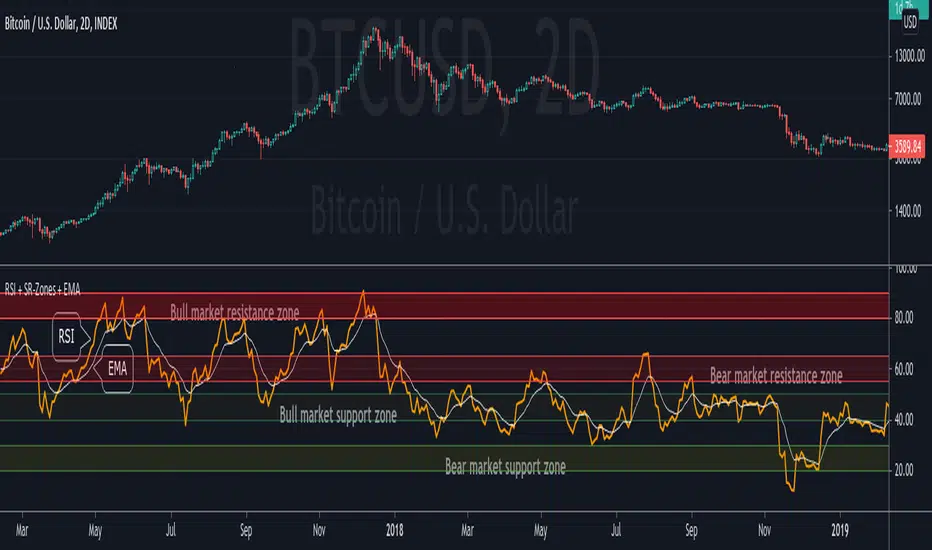
RSI + Support/Resistance Zones + EMAThis indicator enhances the RSI with support and resistance zones and an EMA.
RSI: a regular RSI (default: orange / 14 period)
EMA: an EMA on the RSI (default: light gray / 10 period)
RSI support/resistance zones
SR-Zones for bull markets: In a bull market the price tends to find resistance between 80 and 90 and support between 40 and 50 RSI.
SR-Zones for bear markets: In a bear market the price tends to find resistance between 55 and 65 and support between 20 and 30 RSI.
The concept of these support and resistance zones has been popularized by Constance Brown in her book Technical Analysis for the Trading Professional . The SR zones are described in the first chapter which is available in the preview section on Amazon.
RSI-EMA
The EMA on the RSI can also be used as support and resistance. For example, you can be use it for a simple strategy such as the following: In an uptrend after a significant correction during which the RSI has been below the EMA for some time, wait for the RSI to cross above the EMA to go long and exit (partially) after the RSI crossed down the EMA.
Hint: All visual elements (RSI, EMA, support zones) can be enabled/disabled and adjusted individually.
Cerca negli script per "ema"
Multi SMA EMA WMA HMA BB (4x5 MAs Bollinger Bands) Adv MTF - RRBMulti SMA EMA WMA HMA 4x5 Moving Averages with Bollinger Bands Advanced MTF by RagingRocketBull 2019
Version 1.0
This indicator shows multiple MAs of any type SMA EMA WMA HMA etc with BB and MTF support, can show MAs as dynamically moving levels.
There are 4 MA groups + 1 BB group, a total of 4 TFs * 5 MAs = 20 MAs. You can assign any type/timeframe combo to a group, for example:
- EMAs 12,26,50,100,200 x H1, H4, D1, W1 (4 TFs x 5 MAs x 1 type)
- EMAs 8,10,13,21,30,50,55,100,200,400 x M15, H1 (2 TFs x 10 MAs x 1 type)
- D1 EMAs and SMAs 8,10,12,26,30,50,55,100,200,400 (1 TF x 10 MAs x 2 types)
- H1 WMAs 7,77,89,167,231; H4 HMAs 12,26,50,100,200; D1 EMAs 89,144,169,233,377; W1 SMAs 12,26,50,100,200 (4 TFs x 5 MAs x 4 types)
- +1 extra MA type/timeframe for BB
There are several versions: Simple, MTF, Pro MTF, Advanced MTF and Ultimate MTF. This is the Advanced MTF version. The Differences are listed below. All versions have BB
- Simple: you have 2 groups of MAs that can be assigned any type (5+5)
- MTF: +2 custom Timeframes for each group (2x5 MTF) +1 TF for BB, TF XY smoothing
- Pro MTF: 4 custom Timeframes for each group (4x3 MTF), 1 TF for BB, MA levels and show max bars back options
- Advanced MTF: +2 extra MAs/group (4x5 MTF), custom Ticker/Symbols, Timeframe <>= filter, Remove Duplicates Option
- Ultimate MTF: +individual settings for each MA, custom Ticker/Symbols
Features:
- 4x5 = 20 MAs of any type
- 4x MTF groups with XY step line smoothing
- +1 extra TF/type for BB MAs
- 4x5 = 20 MA levels with adjustable group offsets, indents and shift
- supports any existing type of MA: SMA, EMA, WMA, Hull Moving Average (HMA)
- custom tickers/symbols for each group - you can compare MAs of the same symbol across exchanges
- show max bars back option
- show/hide both groups of MAs/levels/BB and individual MAs
- timeframe filter: show only MAs/Levels with TFs <>= Current TF
- hide MAs/Levels with duplicate TFs
- support for custom TFs that are not available in free accounts: 2D, 3D etc
- support for timeframes in H: H, 2H, 4H etc
Notes:
- Uses timeframe textbox instead of input resolution dropdown to allow for 240 120 and other custom TFs
- Uses symbol textbox instead of input symbol to avoid establishing multiple dummy security connections to the current ticker - otherwise empty symbols will prevent script from running
- Possible reasons for missing MAs on a chart:
- there may not be enough bars in history to start plotting it. For example, W1 EMA200 needs at least 200 bars on a weekly chart.
- price << default Y smoothing step 5. For charts with low/fractional prices (i.e. 0.00002 << 5) adjust X Y smoothing as needed (set Y = 0.0000001) or disable it completely (set X,Y to 0,0)
- TradingView Replay Mode UI and Pinescript security calls are limited to TFs >= D (D,2D,W,MN...) for free accounts
- attempting to plot any TF < D1 in Replay Mode will only result in straight lines, but all TFs will work properly in history and real-time modes. This is not a bug.
- Max Bars Back (num_bars) is limited to 5000 for free accounts (10000 for paid), will show error when exceeded. To plot on all available history set to 0 (default)
- Slow load/redraw times. This indicator becomes slower, its UI less responsive when:
- Pinescript Node.js graphics library is too slow and inefficient at plotting bars/objects in a browser window. Code optimization doesn't help much - the graphics engine is the main reason for general slowness.
- the chart has a long history (10000+ bars) in a browser's cache (you have scrolled back a couple of screens in a max zoom mode).
- Reload the page/Load a fresh chart and then apply the indicator or
- Switch to another Timeframe (old TF history will still remain in cache and that TF will be slow)
- in max possible zoom mode around 4500 bars can fit on 1 screen - this also slows down responsiveness. Reset Zoom level
- initial load and redraw times after a param change in UI also depend on TF. For example:
D1/W1 - 2 sec, H1/H4 - 5-6 sec, M30 - 10 sec, M15/M5 - 4 sec, M1 - 5 sec.
M30 usually has the longest history (up to 16000 bars) and W1 - the shortest (1000 bars).
- when indicator uses more MAs (plots) and timeframes it will redraw slower. Seems that up to 5 Timeframes is acceptable, but 6+ Timeframes can become very slow.
- show_last=last_bars plot limit doesn't affect load/redraw times, so it was removed from MA plot
- Max Bars Back (num_bars) default/custom set UI value doesn't seem to affect load/redraw times
- In max zoom mode all dynamic levels disappear (they behave like text)
1. based on 3EmaBB, uses plot*, barssince and security functions
2. you can't set certain constants from input due to Pinescript limitations - change the code as needed, recompile and use as a private version
3. Levels = trackprice implementation
4. Show Max Bars Back = show_last implementation
5. swma has a fixed length = 4, alma and linreg have additional offset and smoothing params
6. Smoothing is applied by default for visual aesthetics on MTF. To use exact ma mtf values (lines with stair stepping) - disable it
Good Luck! You can explore, modify/reuse the code to build your own indicators.

Overlay Higher Timeframe EMA 10Plot the daily and weekly EMA 10 on any timeframe.
The Daily EMA 10 is useful for helping a trader decide whether the price is overextended without switching back to the daily timeframe and losing focus. It will change colour to indicate which order the EMA 10 and EMA 20 is in.
The Weekly EMA 10 is useful for helping a trader decide whether to take a trade based on long term momentum. If it is over the current price then the market has more momentum to the downside and if it is under then the market has more momentum to the upside. It will also change colour depending on which order the EMA 10 and EMA 20 is in. The weekly is often forgotten in trade planning.
You can switch the Daily and the Weekly on and off independently and change styles if you wish.

Pivot Hourly x EMA RibbonHourly Fibonacci Pivot + EMA is an intraday analysis tool that combines hourly Fibonacci-based pivot levels with exponential moving averages (EMAs). It is designed to help traders visualize potential intraday support/resistance zones and short-term trend direction on any timeframe.
The indicator calculates pivot levels from hourly price data and then projects Fibonacci extensions and retracements around a central pivot. These levels can be used to see where price has previously reacted and where future reactions may occur. The EMAs provide an additional layer of context by highlighting the prevailing short-term trend and momentum.
Key features:
Hourly Fibonacci pivot levels (support and resistance zones derived from hourly ranges)
Multiple Fibonacci bands to show potential reaction areas above and below the central pivot
One or more configurable EMAs to show short-term trend direction and dynamic support/resistance
Works on all symbols and intraday timeframes supported by TradingView
Typical use:
Monitor how price behaves when approaching or rejecting Fibonacci pivot levels
Look for confluence between pivot zones and EMA direction or EMA bounces
Use the levels as potential areas of interest for trade planning, stop placement, or partial profit zones within your own trading system
Also have "C" Label it's mean Candle for example C1 is First Candle of the source timeframe, if the source timeframe set to 4 Hour it will be the first 4h candle, the C2 is the second 4h candle of the day.
This script is intended purely as a technical analysis tool and does not generate buy/sell signals or guarantee any particular outcome. It is not financial advice. Always combine it with your own analysis, risk management, and trading plan before making any trading decisions.

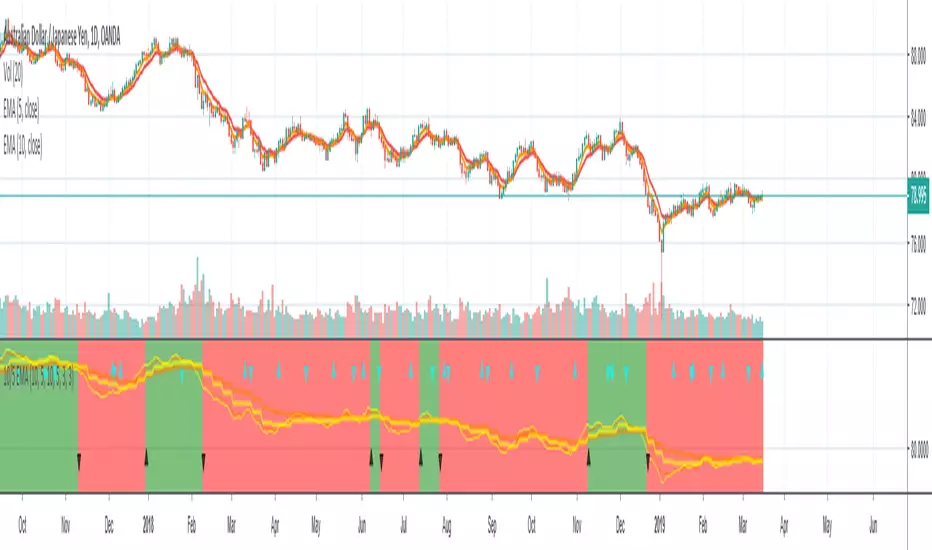
EMA Range OscillatorEMA Range Oscillator (ERO) - User Guide
Overview
The EMA Range Oscillator (ERO) is a technical indicator that measures the distance between two Exponential Moving Averages (EMAs) and the distance between price and EMA. It normalizes these distances into a 0-100 range, helping traders identify trend strength, market momentum, and potential reversal points.
Components
Main Line
Green Line: EMA20 > EMA50 (Uptrend)
Red Line: EMA20 < EMA50 (Downtrend)
Histogram
White Histogram: Price distance from EMA20
Key Levels
Upper Level (80): High divergence zone
Middle Level (50): Neutral zone
Lower Level (20): Low divergence zone
Parameters
ParameterDefaultDescriptionFast EMA20Short-term EMA periodSlow EMA50Long-term EMA periodNormalization Period100Lookback period for scalingUpper80Upper threshold levelLower20Lower threshold level
How to Read the Indicator
High Values (Above 80)
Strong trend in progress
EMAs are widely separated
High momentum
Potential overbought/oversold conditions
Watch for possible trend exhaustion
Low Values (Below 20)
Consolidation phase
EMAs are close together
Low volatility
Potential breakout setup
Range-bound market conditions
Middle Zone (20-80)
Normal market conditions
Moderate trend strength
Balanced momentum
Look for directional clues from color changes

Pucci Trend EMA-SMA Crossover with TolerancePucci Trend EMA-SMA Crossover with Tolerance
This indicator helps identify market trends and generates trading signals based on the crossover between an Exponential Moving Average (EMA) and a Simple Moving Average (SMA) with an adjustable tolerance threshold. The signals work as follows:
Buy Signal (B) -> Triggers when the EMA crosses above the SMA, exceeding a user-defined tolerance (in basis points). Optionally, a price filter can require the high or low to be below the EMA for confirmation.
Sell Signal (S) -> Triggers when the SMA crosses above the EMA, exceeding the tolerance. The optional price filter may require the high or low to be above the EMA.
The tolerance helps reduce false signals by requiring a minimum distance between the moving averages before confirming a crossover. The price filter adds an extra confirmation layer by checking if price action respects the EMA level.
Important Notes:
1º No profitability guarantee: This tool is for analysis only and may generate losses.
2º "As Is" disclaimer: Provided without warranties or responsibility for trading outcomes.
3º Use Stop Loss: Users must determine their own risk management.
4º Parameter adjustment needed: Optimal MA periods and tolerance vary by timeframe.
5º Filter impact varies: Enabling/disabling the price filter may improve or worsen performance.

EMA Trend Pro: Dynamic Clouds & ColorsEMA Trend Pro is your ultimate trend companion, built for traders who want clarity, precision, and confidence in their entries.
This script fuses dynamic EMA cloud zones with breakout and pullback signals — giving you real-time insights into market structure and momentum. Whether you're trading crypto, forex, stocks, or futures, EMA Trend Pro adapts to your style.
🔧 Key Features:
✅ EMA Stack Clouds with Folding Sensitivity (9/21/48/200)
✅ Bullish / Bearish trend labels with real-time dashboard
✅ Volume strength analysis (High, Normal, Low)
✅ Breakout signal alerts (momentum-based)
✅ Pullback signal alerts (trend resumption)
✅ Fully customizable: EMA lengths, signal visibility, cloud opacity
✅ Works across all assets and timeframes
🛠️ Designed for scalping, swing trading, and intraday setups.
🔔 Built-in alerts make automation seamless — no guesswork.
💡 Usage Tips:
Use clouds and trend labels to identify structure and bias
Trade breakouts when EMAs align and volume confirms
Look for pullbacks into the EMA zone and enter on resumption
📅 Market Hours Filter: Keeps signals relevant during core trading hours (9:30 AM–4 PM ET).
👤 Developed by @glapougbaegarmondeh
🧠 Version 1.0 | 📆 Released: April 24, 2025

ADR Nivele Horizontale dhe EMAThe user provided a Pine Script code for an indicator called "ADR Nivele Horizontale dhe EMA". The task is to explain how this code works. Hmm, first, I need to understand what this indicator does. The title mentions ADR levels and EMA, so it's probably combining horizontal lines based on Average Daily Range and some Exponential Moving Averages.
Looking at the code, the first part is the indicator declaration with version 6. The settings include an ADR period, levels above and below the mid, and line style. Then there's a section for calculations. They request daily high and low to compute the daily range. The ADR is the SMA of the daily range over the specified period. The mid is the average of daily high and low. The adr_val is half of ADR, maybe to create symmetrical levels around the mid.
Next, they create arrays for lines and labels above and below the mid. The loops go from 1 to levels_above/below, calculate each level, draw lines and labels. The mid line is also drawn with a different color. Then, there are several EMAs plotted: 13, 50, 200, 400, 600, 800, each with different colorsWait, but in Pine Script, when you use arrays to store lines and labels, you have to manage them properly to avoid repainting or memory issues. The code uses array.concat to add new lines and labels each bar. However, since this code is running on each bar, the for loops might be creating multiple lines each time, leading to too many objects. Oh right, but they use var to initialize the arrays, so they are only initialized once. Wait, no. The var keyword initializes the variable once, but in each iteration, they are concatenating new lines. Wait, no: the for loops are inside the main script, which runs on each bar. So every time a new bar is processed, the loops will run again, adding new lines and labels. That's a problem because each bar would create new lines, leading to an ever-increasing number of lines, which could hit the maximum limit (max_lines_count is set to 20, but maybe they have more bars). Oh, the indicator has max_lines_count=20, but the code might be creating multiple lines per bar. So maybe the code isn't handling the line management correctly. For example, if levels_above is 2, then each bar would create 2 new lines above and 2 below, plus the mid line. Over 20 bars, that's way over 20 lines. So this could cause the indicator to stop drawing after 20 lines. The user might not have realized that the lines are being recreated every bar, leading to a buildup. But perhaps the original code intended to have the lines update each bar, extending to the current bar. Let's see: in line.new, they use bar_index as the starting x1 and bar_index as x2. So each line is drawn from the previous bar's index to the current one. But since this is done on every bar, each line is only one bar long. Wait, no. Because on each new bar, the code creates a new line from the previous bar's index (bar_index , which is now the bar before the current one) to the current bar_index. So each line is just a segment from the previous bar to the current bar. But when the next bar comes, a new line is created again. So the result is that each level line is a series of one-bar-length segments, which might not be intended. The user probably wants continuous lines that extend from the left to the right, not just per bar. So this approach is incorrect. The correct way would be to have a line that starts at the first bar of the calculation and extends to the right, updating each bar. But the current code creates a new line each bar, leading to multiple short lines instead of one continuous line. That's a mistake.
So the main issue here is that the code is generating a new line segment for each bar, which is not efficient and would quickly hit the line limit. To fix this, instead of creating a new line every bar, they should create the line once and then update its position each bar. But in Pine Script, you can't directly update a line after it's created; instead, you need to track the line ID and use line.set_xy() to extend it. However, the current code uses array.concat to add new lines each bar, which isn't the right approach.
Therefore, the code as written will create multiple short lines instead of continuous horizontal lines. The correct approach for horizontal levels that extend to the right is to create the line once, starting at a certain bar and extending indefinitely, or to update the line's end point each new bar. But in Pine Script, you can't extend lines infinitely; you have to manage them each bar. Alternatively, using the 'line.extend' style might help, but I think the original code's logic is flawed here.
Additionally, the EMA part is straightforward: plotting multiple EMAs with different periods. That part should work as expected.
So the explanation should mention that the ADR levels are calculated based on the daily high and low, then the code attempts to draw horizontal lines above and below the mid-point. However, the way the lines are drawn may lead to multiple short segments instead of continuous lines, potentially causing performance issues or hitting the maximum line count. The EMAs are plotted correctly with various periods..

PlayBit EMAPlayBit EMA Indicator
Introducing the PlayBit EMA, a highly esteemed technical analysis tool within the PlayBit Community and a personal favorite of Bitcoin Playboy. This indicator has cemented its place as a staple among traders for its simplicity and effectiveness.
Key Features:
PB EMA: Utilizes two Exponential Moving Averages (EMAs) to identify support and resistance zones and help identify potential reversal points.
Dynamic Fill Color:
The fill color will change based on if the closing price is above, below, or in between.
This indicator is not only a reflection of market dynamics but also an essential tool for traders looking to make informed decisions based on the relationship between price action and moving averages. Whether you're a seasoned trader or just starting out, the PlayBit EMA is an invaluable addition to your trading arsenal.

Shifted EMAsJa verschobene EMAS halt lol.
Oder wie ChatGPT sagen würde:
The "Shifted EMAs" indicator on TradingView is a customizable tool that displays three Exponential Moving Averages (EMAs) on the chart. Users can adjust the EMA lengths and apply vertical shifts to the EMAs, enabling flexible analysis of trends and potential support/resistance levels. Each EMA is represented with distinct colors for easy differentiation, providing traders with valuable insights into price movements and aiding in making well-informed trading decisions.
EMA-Deviation-Corrected T3 [Loxx]EMA-Deviation-Corrected T3 is a T3 moving average that uses EMA deviation correcting to produce signals. This comes via the beloved genius Mladen.
The origin of the correcting algorithm can be attributed to Dr. Alexander Uhl, who developed a method to filter the moving average and identify signals. Originally, this method utilized standard deviation as a measure to correct the average values.
However, the current indicator in question employs a modified version of the correcting method. Instead of using standard deviation for calculation, it uses EMA deviation, which stands for Exponential Moving Average deviation. The idea behind using EMA deviation is two-fold:
Efficiency: EMA deviation can be calculated faster than standard deviation, resulting in more efficient code execution.
Signal Reduction: Surprisingly, this modified "correcting" approach generates fewer signals compared to using standard deviation. This is because EMA deviation is more responsive to price changes, making the correcting process less sensitive to whipsaws or false signals.
What is T3?
The T3 moving average, short for "Tim Tillson's Triple Exponential Moving Average," is a technical indicator used in financial markets and technical analysis to smooth out price data over a specific period. It was developed by Tim Tillson, a software project manager at Hewlett-Packard, with expertise in Mathematics and Computer Science.
The T3 moving average is an enhancement of the traditional Exponential Moving Average (EMA) and aims to overcome some of its limitations. The primary goal of the T3 moving average is to provide a smoother representation of price trends while minimizing lag compared to other moving averages like Simple Moving Average (SMA), Weighted Moving Average (WMA), or EMA.
To compute the T3 moving average, it involves a triple smoothing process using exponential moving averages. Here's how it works:
Calculate the first exponential moving average (EMA1) of the price data over a specific period 'n.'
Calculate the second exponential moving average (EMA2) of EMA1 using the same period 'n.'
Calculate the third exponential moving average (EMA3) of EMA2 using the same period 'n.'
The formula for the T3 moving average is as follows:
T3 = 3 * (EMA1) - 3 * (EMA2) + (EMA3)
By applying this triple smoothing process, the T3 moving average is intended to offer reduced noise and improved responsiveness to price trends. It achieves this by incorporating multiple time frames of the exponential moving averages, resulting in a more accurate representation of the underlying price action.
Included
Bar coloring
Signals
Alerts
Loxx's Expanded Source Types

Delox EMA CrossThis indicator works with the change of trend of emas
When the fast 14 crosses above the 21 this is an uptrend.
and when the slow ema of 21 crosses below the slow ema of 14 then we have a downtrend.
It is accompanied by the Stochastic indicator that when there is a cross of Emas will give a bullish or bearish signal.
Bearish signal
When the D-stochastic or the Orange line of the stochastic is greater than 60 and there is a trend reversal crossover it will give a bearish signal painted on the background of the chart.
Bullish signal
When the stochastic D which is the orange line of the stochastic is less than 30 and has a line crossing on the lines it will give a bullish signal.
White bar
White bar appears when there is a change in trend between ema 14 and ema 21.
Remember this is not an investment recommendation this script is for educational purposes only.
If you like the script please follow me this helps a lot and you can also follow me this would help me a lot to keep uploading videos and new scripts for the community.

Supertrend, MA 44|6, EMA FIBS 13|21|34I have this indicator based on my strategy. This indicator is based on existing functions available in the system. I haven't added anything new. This indicator uses Supertrend, MA44|6, EMA fibs 13|21|34 combining to find a profitable trade.
- Supertrend : Indicator uses supertrend strategy with default ATR period of 10 and Factor value 3. These values can be customized based on your preferences. Uptrend is denoted by green color and downtrend by red color. You can change the colors based on your preferences.
- MA 44|6: Indicator plots moving averages of 44 and 6. These values can be customized based on your preferences. Although it is highly recommended to keep 44 as is. Value 6 can be adjusted based on your preference. Default color for uptrend is green and for downtrend is red. You can change the colors based on your preferences.
- FIBS EMA 13|21|34: Indicator plots EMA of fibbonacci numbers 13, 21,34 to identify consolidation and breakout. The periods can be adjusted but it is highly recommended not to do so. Default colors for 13,21 and 34 is Aqua, Blue and Navy respectively. You can change the colors based on your preferences.
When to take trade?
To take a trade all conditions needs to be fulfilled.
Supertrend : Always take a trade in the direction of Supertrend. It is always advisable to take trade if the trend is changing or price is taking support of resistance.
MA 44|6: Moving average 44 indicates average price of 44 last candles and 6 for last 6 candles. Price crossing MA 44 indicates change in trend. It is advisable to take trade at crossing the line above or below. If many candles closing near MA 44 then it indicates consolidation. The more far the candle closes from MA44 the better. MA 6 is used to identify when to enter or exit the trade. If candle closes away from MA 6 then you can wait for candle to start near the MA 6 line. If candle closes above/below MA 6 you can exit your trade.
Fibonacci 13|21|34: When all lines are closed it indicates consolidation. When price breakouts to either direction you can take a trade in that direction with following conditions.
Bullish Trade:
When to enter?
If candle closed above MA 44, Supertrend is uptrend and EMA Fibs are moving away and are above MA 44. The price is near to MA 6 line then you can enter into bullish trade. If price is away from MA 6 then you should wait until the price/line comes near to avoid loss.
When to exit?
Price moving in opposite direction:
You should set a stop loss when you enter the trade. The stop loss can be set below the low of the previous candle or any other strategy you have. But it is really important to set the stop loss. If price moves in opposite direction then your stop loss will hit and you will be out of the trade.
Price moving in same direction:
Once you enter the trade you can exit based on two conditions whichever suits you.
1. Exit the trade if candle closes below MA6. The drawback is you may exit too early. You can also adjust the period based on your preferences.
2. Exit the trade if candle closed below low of previous candle. The drawback is you may book less profit but you can capture the movement very well.
Bearish Trade:
When to enter?
If candle closed below MA 44, Supertrend is downtrend and EMA Fibs are moving away and are below MA 44. The price is near to MA 6 line then you can enter into bearish trade. If price is away from MA 6 then you should wait until the price/line comes near to avoid loss.
When to exit?
Price moving in opposite direction:
You should set a stop loss when you enter the trade. The stop loss can be set below the low of the previous candle or any other strategy you have. But it is really important to set the stop loss. If price moves in opposite direction then your stop loss will hit and you will be out of the trade.
Price moving in same direction:
Once you enter the trade you can exit based on two conditions whichever suits you.
1. Exit the trade if candle closes below MA6. The drawback is you may exit too early. You can also adjust the period based on your preferences.
2. Exit the trade if candle closed below low of previous candle. The drawback is you may book less profit but you can capture the movement very well.
When not to take trade?
1. If MA 44 is completely horizontal and EMA Fibs are very close to each other. This indicates that the market is consolidated and if you enter the trade you may hit stop loss very often.
Note: Please note that I am not expert and I don't take any responsibility of your profits or losses. I have created this indicator based on my knowledge and it is for study purpose. Use of this indicator is totally your responsibility. Use all your knowledge and expertise and don't totally depend on the indicator. Don't forget to use stop loss and do money management.
Happy Trading!

Stacked EMAsStacked Daily & Weekly EMAs + Labels
Pretty much self-explanatory indicator that shows the current momentum based on the key exponential moving averages.
Three stages of the EMAs:
1. Stacked Positively (Bullish) - EMAs are stacked on top of each other which represents a healthy bullish uptrend (green Label).
2. Stacked Negatively (Bearish) - EMAs are stacked below each other meaning the trend is bearish (red label).
3. Stacked Neutral (Neutral) - EMAs are crossing each other without any clear direction = chop (yellow label).
Hope it helps.

FTL - Range Filter X2 + EMA + UOThjs script combines two range filters, an EMA and the Ultimate oscillator.
This is an indicator type of script with alerts that is ideal for one minute scalping and was developed initially for NAS100 but has been used successfully with other symbols.
The two range filters are used to detect when the short and mid term trends are in the same direction.
The EMA indicates the longer term trend and the UO is used to determine if an asset is overbought or oversold.
This indicator pairs well with divergence indicators to add confluence to a change in direction.
Additional features of this indicator:
- Configure whether to show buy and sell labels only when asset is not overbought or oversold
- Select whether to show buys only when price is above the EMA , or sells only below the EMA
- Indicate a bar where a trend crosses the EMA and select if the crossover or cross under should be shown only in a counter trend.
- Pullbacks within a trend can be identified. This may indicate trend continuation.
- Alerts can be created for pullbacks, EMA crossing and for buy or sell signals

BBW EMA RIBBON+BB%B+EMA BUY/SELL SignalsBINANCE:BTCUSDT
* * * TESTED ON BTCUSDT 4H CHART * * *
The indicator gives signals based on possible ENTRY/EXIT zones (calculated using an ema ribbon of the BBW) and BB%B oversold/overbought conditions, also a 200 EMA filter is used to trade following the major trend.
ENTRY/EXIT zones can be used as a confirmation on other strategies (green zones suggest a possible entry for a long in an uptrend and for a short in a downtrend, red zones suggest a possible exit for long & short)
Only LONG signals are given.
Signals are divided in 3 categories based on their strenght:
- Weak BUY/SELL (green/red circles on chart)
- normal BUY/SELL (green/red triangles with "BUY" or "SELL" text on chart)
- strong BUY/SELL (green/red labels with "STRONG BUY" or "STRONG SELL" text on chart)
You can use signals from the same category as triggers for entering or exiting a trade or you can try using signals from different categories
All indicators settings can be costumized
Possible EXTRY/EXIT zones can be turned ON/OFF
Every signal label can be turned ON/OFF
EMA that changes color based on last candle close can be turned ON/OFF
Alerts can be set for:
- General Signals (every signal will trigger it)
- Weak Signals (only weak signals will trigger it)
- Normal Signals (only normal signals will trigger it)
- Strong Signals (only strong signals will trigger it)
There are 3 BB%B Oversold & 3 BB%B Overbought value presets:
- BASIC (default values)
- LOW (slightly lower values from default)
- HIGH (slightly higher values from default)
Tips:
Use BB%B OS LOW preset to find entries at a better price
Use BB%B OS HIGH preset to find entries faster
Use BB%B OB LOW preset to find exits faster
Use BB%B OB HIGH preset to find exits at a better price
There are 3 Filters already included:
- A checkbox to toggle ON/OFF the use of Heikin Ashi candels to detect trades
- A checkbox to toggle ON/OFF the use of an ema filter for the ribbon that tries to reduce the number of false signals on over-extended price movements
- A checkbox to toggle ON/OFF the use of an ema filter that tries to reduce the number of false signals when price crosses the moving average many times consecutively

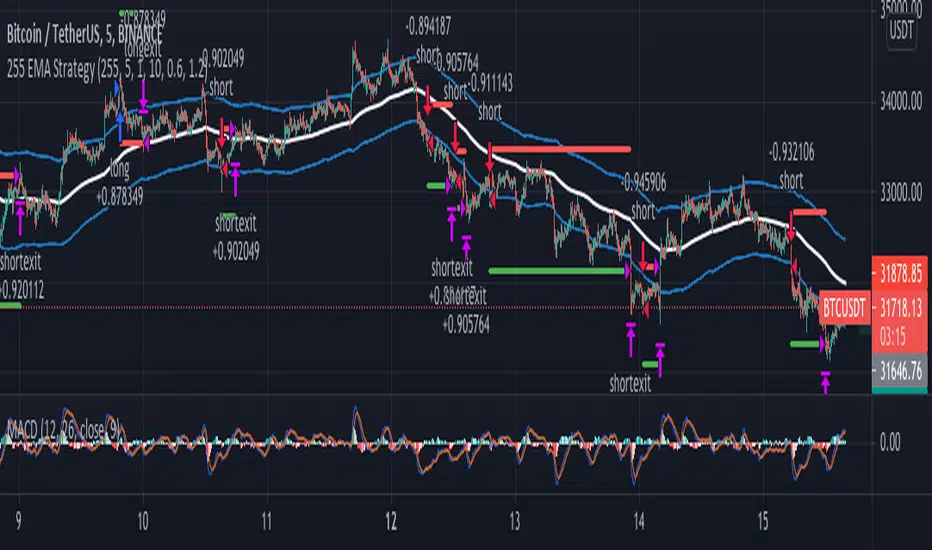
255 EMA Strategy//--- From 15 Trading Examples by Trader Alyx ---
// Seems like this strategy works better if we reverse the EMA filter logic.
// "Description: This basic scalping strategy allows you to enter the market based upon sentiment
// provided by the EMA, set at 255 periods. When price is trading below the 255 EMA, you would
// look to enter a LONG BUY positions, and when price is trading above the 255 EMA, you would
// look to enter a SELL SHORT position. The MACD lagging indicator will show you clear signals for
// when to do this. When the MACD lines cross in a bullish manner and price is below the 255
// EMA, buy. When the MACD lines cross in a bearish manner and price is above the 255 EMA,
// sell.
// NOTE: Make sure that price is trading away from the 255EMA before entering a LONG or SHORT
// position. As you can see in the chart below, the clearest signs for trade entry were presented
// when price was trading AWAY from the 255EMA"
10/5 Weekly/Daily EMAs with ConfirmationsPlots Daily and Weekly 10 & 5 EMAs (but fully customizable to your own).
In addition to plotting the EMAs it color coordinates trend bias and has cross confirmation signals.
Philosophy and how to read:
I use this indicator when trading strictly on the daily timeframe. I have not tested it on other timeframes.
In my trade system I start with both the monthly and weekly charts to define overall bias.
Here’s the general rule of thumb.
10 EMA is direction (bias) and 5 EMA is price.
If 5EMA is below 10EMA there is a bear bias. If 5EMA is above 10EMA there is a bull bias.
This indicator will plot both the daily and weekly 10 & 5 EMAs.
It will also color code the background based on how these EMAs relate to each other.
Light red typically is just the daily is confirmed bear (typically because it could be either or)
Dark red, both daily and weekly in confirmed bear.
Light green, typically just daily is confirmed bull (typically because it could be either or)
Dark green, both daily and weekly in confirmed bull.
In addition to background highlight there is confirmation crosses.
The daily confirmation cross is default yellow triangle.
Down triangle is 5 crossing the 10 downward.
Up triangle is the 5 crossing the 10 upward.
The weekly confirmation is the same only is aqua color.
Generally, on a color change you want to see one or both confirmation in the direction of the bias change.
If you only want to plot the daily bias in the options unclick the setting: Include Weekly Background Plotting. Unclicking this will remove the background coloring for the weekly bias. This might be helpful if you only want to see the strength of what the weekly timeframe is telling you.
Also, I’m primarily a trend trader but I also do have a reversal system I trade with lower R:R parameters.
A good reversal confirmation signal I’ve noticed is the instrument that you are trading should go through a cycle of light color to dark color.
You could also create alerts with this indicator based on just signals. When the signal fires the value will be 1.
Future Updates:
I want to find some way to correlate the distance between these EMAs to enhance the signal. Also to include a velocity component. Plus a few more things.
If you like this indicator please like and leave a comment down below.
MACD/EMA Long StrategyThis incredibly simple strategy uses a combination of the 20 EMA and bullish/bearish MACD crosses as a low risk method of getting in and out of markets.
Depending on whether the market is above or below the 200 SMA, the script determines if the market is in bullish or bearish territory. Above the 200 SMA, the script will ignore the 20 EMA as a buy condition and buy solely on the confirmation of a bullish MACD cross upon the close of a candle. In this bullish market, the script will only enable the sell condition if both the MACD is bearish AND a close below the 20 EMA occurs. This is to reduce the chances of the script selling prematurely in the event of a bearish MACD cross, if the market is still in overall bullish territory.
When the market is below the 200 SMA, the confirmation occurs in the opposite direction. The buy condition will only be met if both the MACD is bullish AND a close above the 20 EMA occurs. However, the sell condition ignores the 20 EMA and will sell solely on the confirmation of a bearish MACD cross upon the close of the candle.
This strategy can be used in both bullish and bearish markets. This conservative strategy will slightly underperform in a bull market, with the sell condition occasionally being met and then potentially buying back higher. However, it will successfully get you out of a turning market and automatically switch into a more 'risk-off' mentality during a bear market. This strategy is not recommended for sideways markets, as trading around the 20 EMA coupled with a relatively flat MACD profile can cause the strategy to buy the peaks and sell troughs easily.

Multi SMA EMA WMA HMA BB (4x3 MAs Bollinger Bands) Pro MTF - RRBMulti SMA EMA WMA HMA 4x3 Moving Averages with Bollinger Bands Pro MTF by RagingRocketBull 2018
Version 1.0
This indicator shows multiple MAs of any type SMA EMA WMA HMA etc with BB and MTF support, can show MAs as dynamically moving levels.
There are 4 MA groups + 1 BB group. You can assign any type/timeframe combo to a group, for example:
- EMAs 50,100,200 x H1, H4, D1, W1 (4 TFs x 3 MAs x 1 type)
- EMAs 8,13,21,55,100,200 x M15, H1 (2 TFs x 6 MAs x 1 type)
- D1 EMAs and SMAs 12,26,50,100,200,400 (1 TF x 6 MAs x 2 types)
- H1 WMAs 7,77,231; H4 HMAs 50,100,200; D1 EMAs 144,169,233; W1 SMAs 50,100,200 (4 TFs x 3 MAs x 4 types)
- +1 extra MA type/timeframe for BB
compile time: 25-30 sec
full redraw time after parameter change in UI: 3 sec
There are several versions: Simple, MTF, Pro MTF, Advanced MTF and Ultimate MTF. This is the Pro MTF version. The Differences are listed below. All versions have BB
- Simple: you have 2 groups of MAs that can be assigned any type (5+5)
- MTF: +2 custom Timeframes for each group (2x5 MTF)
- Pro MTF: +4 custom Timeframes for each group (4x3 MTF), MA levels and show max bars back options
- Advanced MTF: +2 extra MAs/group (4x5 MTF), custom Ticker/Symbol, backreferences for type, TF and MA lengths in UI
- Ultimate MTF: +individual settings for each MA, custom Ticker/Symbols
Features:
- 4x3 = 12 MAs of any type including Hull Moving Average (HMA)
- 4x MTF groups with step line smoothing
- BB +1 extra TF/type for BB MAs
- 12 MA levels with adjustable group offsets, indents and shift
- show max bars back
- you can show/hide both groups of MAs/levels and individual MAs
Notes:
1. based on 3EmaBB, uses plot*, barssince and security functions
2. you can't set certain constants from input due to Pinescript limitations - change the code as needed, recompile and use as a private version
3. Levels = trackprice implementation
4. Show Max Bars Back = show_last implementation
5. uses timeframe textbox instead of input resolution to allow for 120 240 and other custom TFs. Also supports TFs in hours: 2H or H2
6. swma has a fixed length = 4, alma and linreg have additional offset and smoothing params
7. Smoothing is applied by default for visual aesthetics on MTF. To use exact ma mtf values (lines with stair stepping) - disable it
MTF Notes:
- uses simple timeframe textbox instead of input resolution dropdown to allow for 120, 240 and other custom TFs, also supports timeframes in H: 2H, H2
- Groups that are not assigned a Custom TF will use Current Timeframe (0).
- MTF will work for any MA type assigned to the group
- MTF works both ways: you can display a higher TF MA/BB on a lower TF or a lower TF MA/BB on a higher TF.
- MTF MA values are normally aligned at the boundary of their native timeframe. This produces stair stepping when a higher TF MA is viewed on a lower TF.
Therefore X Y Point Density/Smoothing is applied by default on MA MTF for visual aesthetics. Set both to 0 to disable and see exact ma mtf values (lines with stair stepping and original mtf alignment).
- Smoothing is disabled for BB MTF bands because fill doesn't work with smoothed MAs after duplicate values are replaced with na.
- MTF MA Value fluctuation is possible on the current bar due to default security lookahead
Smoothing:
- X,Y == 0 - X,Y smoothing disabled (stair stepping on high TFs)
- X == 0, Y > 0 - X,Y smoothing applied to all TFs
- Y == 0, X > 0 - X smoothing applied to all TFs < deltaX_max_tf, Y smoothing disabled
- X > 0, Y > 0 - Y smoothing applied to all TFs, then X smoothing applied to all TFs < deltaX_max_tf
X Smoothing with Y == 0 - shows only every deltaX-th point starting from the first bar.
X Smoothing with Y > 0 - shows only every deltaX-th point starting from the last shown Y point, essentially filling huge gaps remaining after Y Smoothing with points and preserving the curve's general shape
X Smoothing on high TFs with already scarce points produces weird curve shapes, it works best only on high density lower TFs
Y Smoothing reduces points on all TFs, removes adjacent points with prices within deltaY, while preserving the smaller curve details.
A combination of X,Y produces the most accurate smoothing. Higher delta value - larger range, more points removed.
Show Max Bars Back:
- can't set plot show_last from input -> implemented using a timenow based range check
- you can't delete/modify history once plotted, so essentially it just sets a start point for plotting (from num_bars bars back) that works only in realtime mode (not in replay)
Levels:
You can plot current MA value using plot trackprice=true or by checking Show Price Line in Style. Problem is:
- you can only change color (not the dashed line style, width), have both ma + price line (not just the line), and it's full screen wide
- you can't set plot trackprice from input => implemented using plotshape/plotchar with fixed text labels serving as levels
- there's no other way of creating a dynamic level: hline, plot, offset - nothing else works.
- you can't plot a text var - all text strings must be constants, so you can't change the style, width and text labels without recompiling.
- from input you can only adjust offset, indent and shift for each level group, and change color
- the dot below each level line is the exact MA value. If you want just the line swap plotshape with plotchar, recompile and save as your private version, adjust Y shift.
To speed up redraw times: reduce last_bars to ~2000, recompile and use as your own private version
Pinescript is a rudimentary language (should be called Painscript instead) that can basically only plot data. You can't do much else. Please see the code for tips and hints.
Certain things just can't be done or require shady workarounds and weeks of testing trying to resolve weird node.js compiler errors.
Feel free to learn from/reuse/change the code as needed and use as your own private version. See comments in code. Good Luck!

Multi SMA EMA WMA HMA BB (5+5 MAs + Bollinger Bands) MTF by RRBMulti SMA EMA WMA HMA BB (5+5 Moving Averages of Any Type with Bollinger Bands) MTF by RagingRocketBull 2018
Version 1.0
This indicator shows multiple MAs of any type (SMA EMA WMA HMA etc) with BB and MTF support
There are several versions: Simple, MTF, Pro MTF and Ultimate MTF. This is the MTF version. The Differences are listed below. All versions have BB
- Simple: you have 2 groups of MAs that can be assigned any type (5+5)
- MTF: +assign 1 custom Timeframe to any group combo (5+5 Custom TF)
- Pro MTF: +multiple Timeframes for multiple MA groups (4*3 MTF), horizontal levels and show max bars back options
- Ultimate MTF: +individual settings for each MA, multiple Timeframes
There are 2 groups of MAs, 3rd group is BB. You can:
- show/hide all MAs in a group. Use length 0 to hide a particular MA independently or uncheck in Style.
- apply any MA type to all MAs in a particular MA group. For example, you can assign all EMAs the HMA type. Groups are called EMAs and SMAs just for reference.
- assign Custom Timeframe to a particular MA/BB group combination or all groups. For example, show daily (D) EMAs+SMAs on H1 Timeframe, or only H4 (240) BB on H1.
You can use different types of MAs as dynamic S/R levels to trade of off and MA crosses as signals for possible trend change (golden/death bull/bear crosses).
Current Timeframe MAs can be used together with Custom Timeframe MAs on a single chart. Higher TF MAs are more important than lower TF MAs.
Most common MA types are: SMA, EMA, WMA, HMA.
Most common MA lengths are: 12, 20, 26, 30, 50, 100, 200, 400 etc.
MTF Notes:
- Script UI uses simple timeframe textbox instead of input resolution dropdown to allow for 240 120 and other custom TFs
- Groups that are not assigned a Custom TF will use Current Timeframe (0).
- MTF will work for any MA type assigned to the group. BB group always uses SMA type.
- MTF works both ways: you can display a higher TF MA/BB on a lower TF or a lower TF MA/BB on a higher TF.
- MTF MA values are normally aligned at the boundary of their native timeframe. This produces stair stepping when a higher TF MA is viewed on a lower TF.
Therefore Point Density/Smoothing is applied by default on MA MTF for visual aesthetics. Set to 0 to disable and see exact ma mtf values (lines with stair stepping and original mtf alignment).
- Smoothing is disabled for BB MTF because fill doesn't work with smoothed MAs after duplicate values are replaced with na.
- MTF MA Value fluctuation is possible on the current bar due to default security lookahead
Features:
- 2 groups of custom 5+5 MAs of any type including Hull Moving Average (HMA)
- BB
- 1x Custom Timeframe with step line smoothing for 3 groups (MAs + BB)
1. based on 3EmaBB, uses plot, fill, security, change, barstate, stdev and custom hma functions
2. you can't set certain constants from input due to Pinescript limitations - change the code as needed, recompile and use as a private script version
3. you can't have plot* inside ?/if/for/function, and implementing condition forks using 2 sets of plots (na vs non-na) doubles indicator params and styles - confusing
4. swma has a fixed length = 4, alma and linreg have additional offset and smoothing params
Feel free to use. Good Luck!

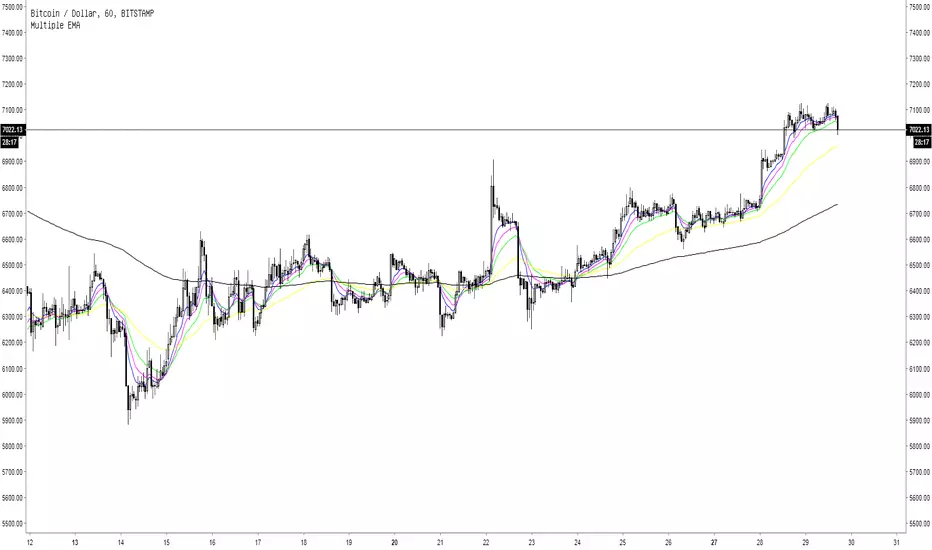
Multiple EMA5 Exponential Moving Averages
EMA 1: length 8, blue line
EMA 2: length 13, pink line
EMA 3: length 21, green line
EMA 4: length 55, yellow line
EMA 5: length 200, black line
EMA Pro Signals (Clean)EMA Pro Signals (Clean), EMA Pro Signals (Clean)
EMA Pro Signals (Clean)
EMA Pro Signals (Clean)
EMA Pro Signals (Clean)
EMA Pro Signals (Clean)
