EMA with Buy/Sell Signals by lbkindCertainly! Here's a description of the code:
This Pine Script code is designed to plot Exponential Moving Averages (EMAs) on a chart and generate buy/sell signals based on specific conditions. The code includes a filter to reduce false signals by considering the trend of the EMA 200.
The key components of the code are as follows:
1. Input Variables: The code starts by defining input variables such as the periods for the EMAs (ema200Period, ema50Period, ema13Period), the Average True Range period (atrPeriod), and the chopiness threshold (chopinessThreshold).
2. Calculating EMAs: The EMAs (ema200, ema50, ema13) are calculated using the `ema()` function based on the closing price.
3. Average True Range (ATR): The ATR is calculated using the `atr()` function with the specified period (atrPeriod).
4. Normalized ATR: The normalized ATR is computed by dividing the ATR by the closing price and multiplying by 100. This allows for better comparison across different price levels.
5. EMA 200 Trend Direction: The code determines the trend direction of the EMA 200 by comparing the current value with the previous value. The variables `ema200TrendUp` and `ema200TrendDown` are assigned `true` or `false` values based on the trend direction.
6. Generate Buy/Sell Signals: The buySignal is generated when the following conditions are met:
- There is a crossover of the shorter EMAs (ema13, ema50).
- The EMA 200 is in an uptrend (`ema200TrendUp` is true).
- The current close is above the EMA 200.
- The normalized ATR is below the specified chopiness threshold.
The sellSignal is generated when the opposite conditions are met.
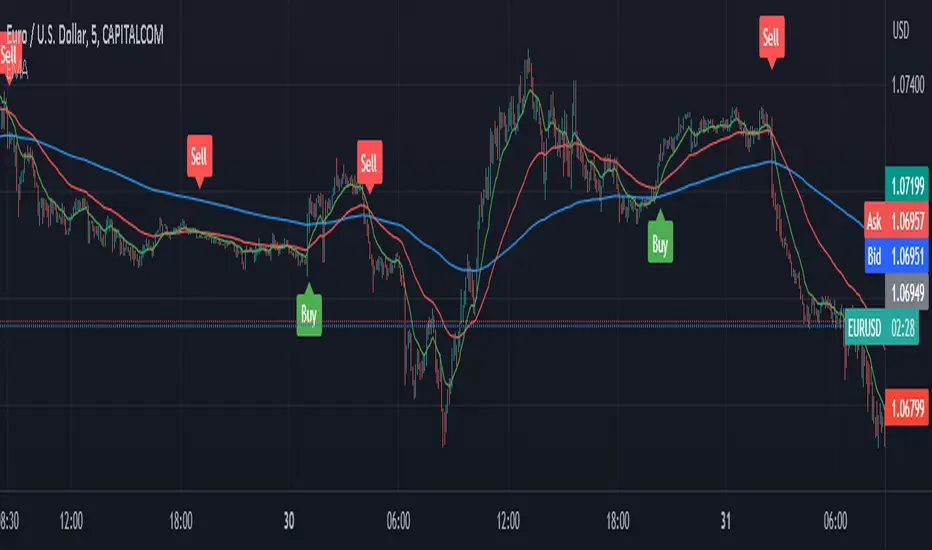
7. Plotting: The EMAs (ema200, ema50, ema13) are plotted on the chart using the `plot()` function. The buy and sell signals are plotted as labels using the `plotshape()` function. The buySignal is displayed below the candle (`location=location.belowbar`), and the sellSignal is displayed above the candle (`location=location.abovebar`).
By incorporating these features, the code provides a visual representation of the EMAs, along with buy and sell signals that consider the EMA 200 trend, crossover of shorter EMAs, and the normalized ATR condition. This helps in identifying potential entry and exit points in the market while attempting to reduce false signals.
Cerca negli script per "ema"
EMA bridge and dashboard with color coding.
Summary:
This is a custom moving average indicator script that calculates and plots different Exponential Moving Averages (EMAs) based on user-defined input values. The script also displays MACD and RSI, and provides a table that displays the current trend of the market in a color-coded format.
Explanation:
- The script starts by defining the name of the indicator and the different inputs that the user can customize.
- The inputs include bridge values for three different EMAs (high, close, and low), and four other EMAs (5, 50, 100, and 200).
- The script assigns values to these inputs using the `ta.ema()` function.
- Additionally, the script calculates EMAs for higher timeframes (3m, 5m, 15m, and 30m).
- The script then plots the EMAs on the chart using different colors and line widths.
- The script defines conditions for going long or short based on the crossover of two EMAs.
- It plots triangles above or below bars to indicate the crossover events.
- The script also calculates and displays the RSI and MACD of the asset.
- Finally, the script creates a table that displays the current trend of the market in a color-coded format. The table can be positioned on the top, middle, or bottom of the chart and on the left, center, or right side of the chart.
Parameters:
- i_ema_h: Bridge value for high EMA (default=34)
- i_ema_c: Bridge value for close EMA (default=34)
- i_ema_l: Bridge value for low EMA (default=34)
- i_ema_5: Value for 5-period EMA (default=5)
- i_ema_50: Value for 50-period EMA (default=50)
- i_ema_100: Value for 100-period EMA (default=100)
- i_ema_200: Value for 200-period EMA (default=200)
- i_f_ema: Value for fast EMA used in MACD calculation (default=9)
- i_s_ema: Value for slow EMA used in MACD calculation (default=21)
- fastInput: Value for fast length used in MACD calculation (default=7)
- slowInput: Value for slow length used in MACD calculation (default=14)
- tableYposInput: Vertical position of the table (options: top, middle, bottom; default=middle)
- tableXposInput: Horizontal position of the table (options: left, center, right; default=right)
- bullColorInput: Color of the table cell for a bullish trend (default=green)
- bearColorInput: Color of the table cell for a bearish trend (default=red)
- neutColorInput: Color of the table cell for a neutral trend (default=white)
- neutColorLabelInput: Color of the label for neutral trend in the table (default=fuchsia)
Usage:
To use this script, simply copy and paste it into the Pine Editor on TradingView. You can then customize the input values to your liking or leave them at their default values. Once you have added the script to your chart, you can view the EMAs, MACD, RSI, and trend table on the chart. The trend table provides a quick way to assess the current trend of the market at a glance.

EMAs Bullish/Bearish Confluence [Trend Bias]EMA Confluence Zones
This indicator is designed to simplify trend identification by visually highlighting "Confluence Zones" —areas where short-term, medium-term, and long-term momentum are fully aligned.
While traders can manually add three Moving Averages to a chart, identifying the exact moment all three align (the "Perfect Stack") can be visually difficult during live trading. This script automates that process, converting complex line crosses into simple background color zones and providing actionable alerts for the exact moment a trend alignment begins.
🛠 How It Works
The script utilizes three customizable Exponential Moving Averages (EMAs) to detect the market bias:
Short EMA: Represents immediate price action/momentum.
Medium EMA: Represents the intermediate trend.
Long EMA: Represents the major trend baseline.
Calculations & Logic
The indicator checks for a specific hierarchical alignment (Stacking) of these averages:
1. 🟢 Bullish Confluence (Buy Zone):** Returns true when `Short > Medium` AND `Medium >Long`. This confirms that momentum is rising across all three monitored timeframes.
2. 🔴 Bearish Confluence (Sell Zone):** Returns true when `Short < Medium` AND `Medium < Long`. This confirms that momentum is falling across all three monitored timeframes.
3. ⚪ Neutral (No Color): Any other state indicates a choppy or consolidating market where the EMAs are intertwined.
---
🚀 Key Features
*Visual Bias Confirmation: The background highlights Green (Bullish) or Red (Bearish) only when the "Perfect Stack" conditions are met.
Trend Start Alerts: Unlike standard EMA cross alerts, this script includes custom alert conditions that trigger only on the first bar where the confluence becomes valid. This prevents spam alerts during a prolonged trend.
Full Customization: Users can adjust the lengths of all three EMAs to fit specific strategies (e.g., Scalping vs. Swing Trading).
Clean Chart Mode: Includes options to hide the EMA lines entirely and rely solely on the background color for a minimalist "Naked Trading" setup.
🎯 How to Use
1. Trend Filter: Use the background color to determine your directional bias. If the background is Green, look only for Long setups on lower timeframes. If Red, look only for Short setups.
2. Breakout Confirmation: If price breaks a key level, wait for the background color to flip. This confirms that the Moving Averages have caught up to the move, validating the breakout strength.
3. Exit Signal: If you are in a trend trade and the background color disappears (turns transparent), it indicates the trend momentum is fading and the EMAs are beginning to cross/compress.
⚙️ Settings
EMA Lengths: Default is 20, 50, 100. These can be changed to common combinations like (9, 21, 55) or (50, 100, 200).
Visuals: Toggle lines or background colors on/off and adjust transparency to keep your chart readable.
---
Disclaimer: This script is for informational purposes only. Past performance of a trend following method does not guarantee future results. Always use proper risk management.

EMA + RSI Autotrade Webhook - VarunOverview
The EMA + RSI Autotrade Webhook is a powerful trend-following indicator designed for automated crypto futures trading. This indicator combines the reliability of Exponential Moving Average (EMA) crossovers with RSI momentum filtering to generate high-probability buy and sell signals optimized for webhook integration with crypto exchanges like Delta Exchange, Binance Futures, and Bybit.Key Features
Simple & Effective: Uses proven EMA 9/21 crossover strategy
RSI Momentum Filter: Eliminates low-probability trades in ranging markets
Webhook Ready: Two clean alerts (LONG Entry, SHORT Entry) for seamless automation
Exchange Compatible: Works with Delta Exchange, 3Commas, Alertatron, and other webhook platforms
Zero Lag Signals: Real-time alerts on crossover confirmation
Visual Clarity: Clean chart markers for easy signal identification
How It Works
Entry Signals:
LONG Entry: Triggers when EMA 9 crosses above EMA 21 AND RSI is above 52 (bullish momentum confirmed)
SHORT Entry: Triggers when EMA 9 crosses under EMA 21 AND RSI is below 48 (bearish momentum confirmed)
Technical Components:
Fast EMA: 9-period (tracks short-term price action)
Slow EMA: 21-period (identifies primary trend)
RSI: 14-period (confirms momentum strength)
RSI Long Threshold: 52 (filters weak bullish signals)
RSI Short Threshold: 48 (filters weak bearish signals)
Best Use Cases
Crypto Futures Trading: Bitcoin, Ethereum, Altcoin perpetual contracts
Automated Trading Bots: Integration with Delta Exchange webhooks, TradingView alerts
Timeframes: Optimized for 15-minute charts (works on 5min-1H)
Markets: Trending crypto markets with clear directional moves
Risk Management: Best used with 1-2% stop loss per trade (managed externally)
Webhook Automation Setup
Add indicator to your TradingView chart
Create alerts for "LONG Entry" and "SHORT Entry"
Configure webhook URL from your exchange (Delta Exchange, Binance, etc.)
Use alert message: Entry LONG {{ticker}} @ {{close}} or Entry SHORT {{ticker}} @ {{close}}
Exchange automatically reverses positions on opposite signals
Advantages
✅ No manual trading required - fully automated
✅ Eliminates emotional trading decisions
✅ Catches trending moves early with EMA crossovers
✅ RSI filter reduces whipsaws in choppy markets
✅ Works 24/7 without monitoring
✅ Simple two-alert system (easy to manage)
✅ Compatible with multiple exchanges via webhooksStrategy Philosophy
This indicator follows a trend-following with momentum confirmation approach. By waiting for both EMA crossover AND RSI confirmation, it ensures you're entering trades with genuine momentum behind them, not just random price noise. The tight RSI thresholds (52/48) keep you aligned with the prevailing trend.Recommended Settings
Timeframe: 15-minute (primary), 5-minute (scalping), 1-hour (swing)
Markets: BTC/USDT, ETH/USDT, high-liquidity altcoin perpetuals
Position Sizing: 100% capital per signal (exchange manages reversals)
Stop Loss: 2% (managed via exchange or external bot)
Leverage: 1-2x for conservative approach, up to 5x for aggressive
Important Notes
⚠️ This indicator generates entry signals only - position reversals are handled automatically by your exchange
⚠️ Always backtest on historical data before live trading
⚠️ Use proper risk management and position sizing
⚠️ Best performance in trending markets; may generate false signals in tight ranges
⚠️ Requires TradingView Premium or higher for webhook functionalityTags
cryptocurrency futures automated-trading ema-crossover rsi webhook delta-exchange tradingview-alerts trend-following momentum bitcoin ethereum crypto-bot algo-trading 15-minute-strategy

EMA 9, 21 & 50 Indicator with Floating Labels🟢 EMA 9, 21 & 50 Indicator with Floating Labels
📘 Overview
This indicator plots three exponential moving averages (EMAs) to visualize short-, medium-, and longer-term trend structure on any timeframe:
EMA 9 – Bright Green (short-term momentum)
EMA 21 – Bright Yellow (medium-term trend)
EMA 50 – Red (broader trend confirmation)
Each EMA has a floating label on the right edge of the chart, so line identities remain visible as new candles form.
🪶 Features
Clear, fixed colors for easy recognition (Green 9 / Yellow 21 / Red 50)
Floating labels that stay visible off the right edge
Clean overlay compatible with any chart style
Lightweight and fast to render
📈 How to Use
Trend Filter:
Price above 21 & 50 → bullish bias; look for long setups or pullbacks toward the 9/21.
Price below 21 & 50 → bearish bias; look for short setups or rallies into 9/21.
Momentum vs. Structure:
9 EMA = momentum guide for quick swings.
21 EMA = primary trend line for swing entries/exits.
50 EMA = confirmation of broader direction.
🔧 Tips
Analyze trend on Daily or 4H; fine-tune entries on 1H/15m near the 9 or 21 EMA.
Pair with volume or RSI/MACD for extra confirmation at EMA touches/crosses.

EMA inFusion Pro - Multiple SourcesEMA Fusion Pro: Dynamic Trend & Momentum Strategy with Three Exit Modes
EMA Fusion Pro is a highly customizable, multi-exit trend-following strategy designed for traders who value both precision and flexibility. By leveraging exponential moving averages (EMA), average directional index (ADX), and volume analysis, this strategy aims to capture trending market moves while offering three distinct exit modes for optimal risk management across varying market conditions.
Strategy Overview
This strategy systematically identifies potential entry points using a moving average crossover with highly configurable data sources (including price, volume, rate of change, or their Heikin Ashi versions) and filters signal quality with ADX trend strength and volume spikes. Each trade is managed with one of three advanced exit methodologies—reverse signal, ATR-based stop/take profit, or fixed percentage—giving you the control to adapt your risk profile to different market regimes.
Key Features
Customizable EMA Source: Calculate the core trend-filtering EMA from price (default), volume, rate of change, or their Heikin Ashi counterparts for unique market perspectives.
Trend Filter with ADX: Confirm entries only when the trend is strong, as measured by the user-adjustable ADX threshold.
Volume Spike Confirmation: Optional filter to only take trades with above-average volume activity, reducing false signals.
Three Exit Modes:
Reverse Signal: Exit trades when a new, opposite entry signal occurs.
ATR-Based Stop/Take Profit: Dynamic risk management using multiples of the average true range (ATR) for both take profit and stop loss.
Percent-Based Stop/Take Profit: Fixed-percentage risk management with user-defined thresholds.
Visual Annotations: Signal markers, EMA line color-coded by source, trend background coloring, and optional ATR/percent-based TP/SL levels.
Info Panel: Real-time display of all core indicators, current trading mode, exit parameters, and position status for quick oversight.
How It Works
Entry Logic: A crossover signal (above/below the EMA) triggers a new entry, but only if both ADX trend strength and (optionally) volume spike conditions are met.
Exit Logic: Three selectable modes allow you to exit trades on reverse signals, at a dynamic ATR-based profit or loss, or at a fixed percentage gain/loss.
Flexible Data Analysis: The EMA source can be chosen from six options—standard price, volume, rate of change, or their Heikin Ashi variants—allowing experimentation with different market dimensions.
Risk Management: All exits are precisely controlled, either by the next opposing signal, by volatility-adjusted levels, or by fixed risk/reward ratios.
Backtest & Optimization: The strategy is fully backtestable within TradingView’s Strategy Tester, with adjustable parameters for optimization.
Customization & Usage
Indicator Source: Select your preferred data type for EMA calculation, opening the door to creative strategy variations (e.g., volume momentum, pure price trend, rate of change divergence).
Filter Toggles: Enable/disable ADX and volume filters as desired—useful for different market environments.
Exit Mode Selection: Switch between reverse, ATR, or percent-based exits with a single parameter—ideal for adapting to ranging vs. trending markets.
Visual Clarity: The EMA line color reflects its underlying source, and the info panel summarizes all critical values for easy monitoring.
Who Should Use This Strategy?
Trend Followers seeking to ride strong moves with multiple exit options.
Experienced Traders who want to experiment with different data types (volume, momentum, Heikin Ashi) for trend analysis.
Algorithmic Traders looking for a robust, flexible base to build upon with their own ideas.
Getting Started
Apply the script to your chart and review default settings.
Customize parameters—EMA length, ADX threshold, volume settings, exit type—as desired.
Backtest on multiple instruments and timeframes to evaluate performance.
Optimize filters, exit rules, and risk parameters for your preferred trading style.
Monitor with the real-time info panel and trade alerts.
Disclaimer
This script is for educational and entertainment purposes only. It is not financial advice. Past performance is not indicative of future results. Always conduct thorough testing and consider your risk tolerance before trading real capital.
— Happy Trading —
Feel free to adapt, share, and contribute to this open-source strategy!

EMA Distance & Sector InfoThis indicator provides insights into price trends relative to Exponential Moving Averages (EMAs) and displays sector/industry information about the asset. Below is a detailed explanation of its purpose and what it is designed to achieve:
Purpose of the Code
The indicator offers two key functionalities:
1. Analyzing Price Distance from Multiple EMAs:
• Helps traders understand how far the current price is from key EMAs, expressed as a percentage.
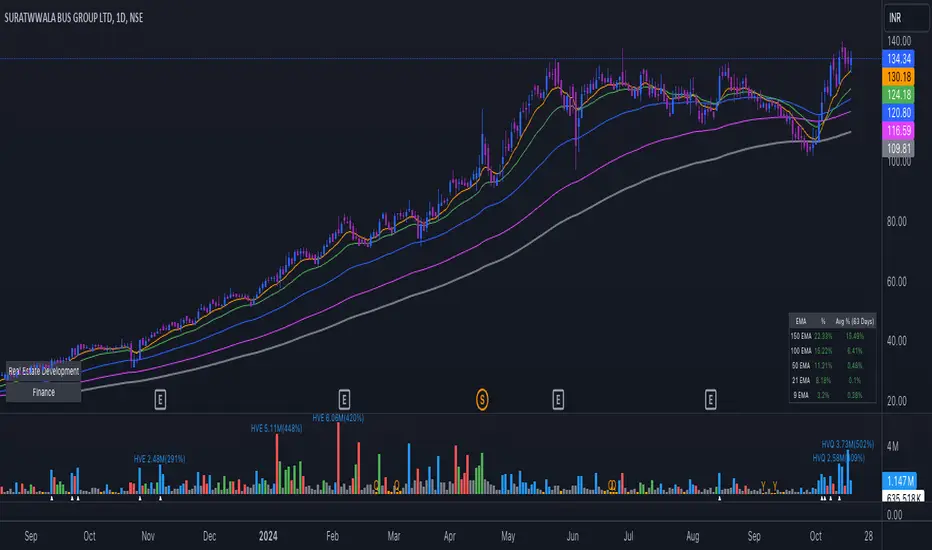
• Calculates average percentage distances over a specified period (default: 63 days) to spot consistent trends or mean reversion opportunities.
• Useful for trend-following strategies, allowing the trader to see when the price is above or below important EMAs (e.g., 9, 21, 50, 100, and 150-period EMAs).
2. Displaying Asset Sector and Industry Information:
• Displays the sector and industry of the asset being analyzed (e.g., Technology, Consumer Goods).
• Provides additional context when evaluating performance across a specific sector or comparing an asset to its peers.
Who Would Use This Indicator?
This indicator is particularly helpful for:
1. Swing Traders and Positional Traders:
• They can use it to track whether the price is trading significantly above or below critical EMAs, which often signals overbought/oversold conditions or trend strength.
• The average percentage distances help to identify momentum shifts or pullback opportunities.
2. Sector/Industry-Focused Investors:
• Understanding an asset’s sector and industry helps investors gauge how the asset fits into the broader market context.
• This is valuable for sector rotation strategies, where investors shift funds between sectors based on performance trends.
How It Helps in Trading Decisions
1. Entry and Exit Points:
• If the price is far above an EMA (e.g., 21 EMA), it might indicate an overbought condition or a strong trend, while a negative percentage could signal a pullback or reversal opportunity.
• The average percentage distances smooth the fluctuations and reveal longer-term trends.
2. Contextual Information:
• Knowing the sector and industry is useful when analyzing trends. For example, if Technology stocks are doing well, and this asset belongs to that sector, it could indicate sector-wide momentum.
Summary of the Indicator’s Purpose
This code provides:
• EMA trend monitoring: Visualizes the price position relative to multiple EMAs and averages those distances for smoother insights.
• Sector and industry information: Adds valuable context for asset performance analysis.
• Decision-making support: Helps traders identify overbought/oversold levels and assess the asset within the broader market landscape.
In essence, this indicator is a multi-purpose tool that combines technical analysis (through EMA distances) with fundamental context (via sector/industry info), making it valuable for traders and investors aiming to time entries/exits or understand market behavior better.
EMA/SMA Support/Resistance Levels////////////////////////////////////////////////////////////
// saxonlucius 07/08/2019
// EMA/SMA Major Support/Resistance levels
////////////////////////////////////////////////////////////
The script contains major support/resistance EMA's and SMA's.
This includes:
EMA
EMA 21
EMA 34
EMA 50
EMA 89
EMA 100
EMA 200
EMA 377
SMA
SMA 10
SMA 100
SMA 200
SMA 900
The EMA 34 and SMA 900 are not as relevant as the others.

EMA Slope - RSI Indicator# EMA Slope - RSI Indicator
## Script Description (for Publishing Page)
**EMA Slope - RSI Indicator** combines normalized EMA slope momentum analysis with RSI divergence detection and momentum comparison to create a visual signal indicator with five distinct signal types. The indicator's originality lies in its unique "No Trade Zone" (NTZ) concept applied to slope momentum, combined with centered RSI format for direct comparison, and multiple complementary signal methods that work together to identify both trend-following and reversal opportunities across different market conditions.
**Core Concept - EMA Slope Normalization:** Calculates rate of change of long MA (default 160 EMA) by comparing current value to N bars ago (default 3 bars). Raw slope difference normalized to -100 to +100 scale using 500-bar rolling range: normalizedSlope = 100 * (longMA - longMA ) / (highest(maDF, 500) - lowest(maDF, 500)). Creates consistent momentum oscillator comparable across price levels and timeframes.
**No Trade Zone (NTZ) Logic:** NTZ (±8 default) creates neutral zone where slope momentum is too weak for reliable signals. Indicator only triggers NTZ Cross signals when slope crosses out of threshold zone, ensuring signals occur only when momentum is sufficiently strong.
**Centered RSI Format (RSI-50):** Traditional RSI (0-100 range) difficult to compare with slope. This indicator uses centered RSI = (RSI - 50), creating -50 to +50 range zero-centered on same scale as normalized slope. Enables direct visual and mathematical comparison between RSI and slope momentum, enabling Slope-RSI exhaustion detection and RSI-Slope Oscillator signals.
**Component Integration:** Five signal types target different market conditions. NTZ Cross and Acceleration target trend-following when momentum strong. RSI Divergence and Slope-RSI Divergence target reversals when price/momentum diverge. RSI-Slope Oscillator targets momentum alignment when RSI and slope converge. Multi-method approach provides signals across trending, reversing, and ranging markets.
### 📊 Technical Calculations
**Slope Normalization:** maDF = longMA - longMA , normalized: maDf = 100 * maDF / (highest(maDF, 500) - lowest(maDF, 500)), ranges -100 to +100.
**Acceleration Detection:** maAcce = abs(maDf - maDf ) * smoothBars * 2, normalized: maAcc = 50 * maAcce / highest(maAcce, 200). Values above threshold (35 display, 40 signals) indicate sudden momentum shifts. Visualized as colored circles: cyan (bullish), red (bearish).
**RSI Calculation:** rsi = sma(rsi(source, length), smoothing), centered: cRsi = rsi - 50 (ranges -50 to +50). Smoothed using SMA (default 3 bars) to reduce noise.
**RSI Divergence:** Uses pivot high/low detection on smoothed RSI. Pivot lookback = 16 - sensitivityInput (inverse: sensitivity 6 = 10-bar lookback, sensitivity 10 = 6-bar lookback). Compares price pivots (actual high/low including wicks) against RSI pivots. Bullish: priceLowerLow AND rsiHigherLow. Bearish: priceHigherHigh AND rsiLowerHigh. Stores multiple previous pivots (default 8 max) for comparison.
**Slope-RSI Exhaustion:** Compares normalized slope against centered RSI on same scale. Bearish: slope accelerating up (delta > 0, slope > NTZ) BUT RSI declining (cRsi < cRsi AND cRsi < cRsi ). Bullish: slope accelerating down (delta < 0, slope < -NTZ) BUT RSI rising. Gap threshold (default 10.0 points) filters noise. Visualized with dashed lines and gap labels.
**RSI-Slope Oscillator:** State machine tracks cross events (rsiSlopeCrossUp = cRsi > maDf AND cRsi <= maDf ), waits for confirmation: both RSI and slope heading same direction. Long: RSI crosses above slope AND both heading UP. Short: RSI crosses below slope AND both heading DOWN. Useful for range-bound markets.
**Stretch Filter:** maPercentDiff = (longMA - shortMA) / shortMA * 100. Blocks long signals if longMA > shortMA by threshold (overextended up). Blocks short signals if shortMA > longMA by threshold (overextended down). Default 0.45% prevents signals when MAs too far apart.
**Delta Calculation:** Measures change in normalized slope between bars. Timeframe mode: compares current confirmed slope with previous confirmed (more reliable, slight delay). Standard mode: compares current with previous bar (faster, may use unconfirmed). Minimum threshold (default 3.4) filters weak momentum changes.
**Trailing Stop (Blackflag FTS Swingarm):** Uses Wilder's MA of true range. Modified mode: trueRange = max(HiLo, HRef, LRef) with enhanced gap handling. Unmodified: standard true range. Trailing stop calculated based on ATR factor and price trend direction. Separate settings for divergence signals (wider stops, grace periods).
### 🚀 Signal Types and Conditions
**1. NTZ Cross Signals:** Long: Slope crosses above +NTZ (default +8) AND positive delta ≥ threshold (default 3.4) AND stretch filter allows AND optional trend confirmation (short MA > long MA). Short: Slope crosses below -NTZ AND negative delta ≥ threshold AND filters allow. Exit: Slope re-enters NTZ OR reverses direction for confirmation bars OR trailing stop.
**2. Acceleration Signals:** Long: Acceleration ≥ threshold (default 40) AND slope above NTZ AND positive delta sufficient AND filters allow. Short: Acceleration ≥ threshold AND slope below -NTZ AND negative delta sufficient AND filters allow. Visual: Colored circles (cyan bullish, red bearish). Works independently to catch sudden momentum bursts.
**3. RSI Divergence Signals:** Bullish: Price lower low while smoothed RSI higher low, detected via pivot comparison (default up to 8 pivots). Bearish: Price higher high while RSI lower high. Optional Slope-RSI confirmation. Visual: Purple lines (bearish), lime lines (bullish). Exit: Divergence-specific trailing stop (wider ATR, grace period).
**4. Slope-RSI Divergence Signals:** Bullish: Slope accelerating down (negative delta, slope < -NTZ) BUT RSI rising over lookback AND gap exceeds threshold (default 10.0 points). Bearish: Slope accelerating up (positive delta, slope > NTZ) BUT RSI declining AND gap exceeds threshold. Visual: Orange triangles (bullish exhaustion), yellow triangles (bearish exhaustion) with dashed lines. Exit: Divergence-specific trailing stop.
**5. RSI-Slope Oscillator Signals:** Long: RSI crosses above slope AND both heading upward. Short: RSI crosses below slope AND both heading downward. State machine tracks cross then confirms direction. Exit: Opposite oscillator condition (allows reversal) OR trailing stop after grace period.
### 📖 How to Use
**Adding to Chart:** TradingView → Indicators → Search "EMA Slope - RSI Indicator" → Add (displays in separate pane below price).
**Visual Elements:** Colored area = normalized EMA slope (Green = bullish above NTZ, Red = bearish below -NTZ, Gray = NTZ zone). Blue line = Centered RSI (-50 to +50). Colored circles = Acceleration (Cyan = bullish, Red = bearish). Green triangles (↑) = Long signals (bottom). Red triangles (↓) = Short signals (top). Orange X = Exit signals. Dashed lines = NTZ boundaries. Purple/Lime lines = RSI divergences. Orange/Yellow triangles = Slope-RSI exhaustion. Table (top-right) = Current Slope, RSI, Gap values.
**Parameter Configuration:** MA Settings: Short 40 (stretch filter), Long 160 (slope), Types: SMA/EMA/DEMA/TEMA/WMA/VWMA/SMWMA/SWMA/HMA. Ratios: 20/80 (fast), 40/160 (standard), 50/200 (slow). Core: NTZ Threshold 8 (5-6 more signals, 10-12 stronger), Min Delta 3.4 (5-10 stronger, 1-3 sensitive), Max Stretch 0.45% (0.3% conservative, 1.0% permissive, 0 disable), Use Timeframe Delta true (confirmed bar vs previous bar). RSI: Length 14, Smoothing 3, Source close. Divergence: Sensitivity 6 (higher = more sensitive, 6 = 10-bar lookback, 10 = 6-bar lookback), Max Peaks 8 (2-15 range), Show Divergences true. Slope-RSI: Lookback 4 (2-10, higher = conservative), Min Gap 10.0 pts (0-100, higher = strong only, 0 disable), Show Exhaustion true. Signal Enables: NTZ Cross true, Acceleration true, RSI Divergence false, Slope-RSI Divergence true, RSI-Slope Oscillator true, Require Slope-RSI Confirmation false. Exit: Confirmation Bars 4 (0-10, 0 immediate, 2-4 filters false), Show Trailing Stop true, Trail Type Modified/Unmodified, ATR Period 10, ATR Factor 4.0 (2-3 tight, 4 standard, 5-6 wide), Divergence Grace 3 bars, Divergence ATR 4.0 (recommend 5-8), Oscillator Grace 3 bars, Oscillator ATR 4.0.
**Alerts:** Right-click indicator pane → Add Alert → Choose condition (Long/Short Entry/Exit) → Configure notifications.
**Interpreting Signals:** Trending Markets: Focus NTZ Cross and Acceleration, higher NTZ (10-12) for stronger signals, use trend confirmation. Reversal Opportunities: Enable RSI Divergence and Slope-RSI Divergence, look for exhaustion markers and divergence lines, use wider stops. Range-Bound: Enable RSI-Slope Oscillator, signals when RSI and slope align, allows position reversal. Multi-Timeframe: Higher TF for trend, lower TF for timing, stronger when aligned. Market Adjustments: Crypto 20/80 MA, NTZ 6-7, Delta 4-5 | Forex 40/160 MA, NTZ 8, Delta 3.4 | Stocks 50/200 MA, NTZ 10-12, Delta 2-3.
### 📈 Use Cases
Day Trading (5m-15m, fast MAs 20/80), Swing Trading (1h-4h, standard 40/160), Position Trading (4h-Daily, slow 50/200), Trend Following (NTZ Cross/Acceleration in trends), Reversal Trading (RSI Divergence/Slope-RSI at reversals), Range Trading (RSI-Slope Oscillator in choppy markets), Momentum Analysis (Centered RSI and normalized slope comparison), Trend Exhaustion Detection (Slope-RSI exhaustion markers).
### ⚠️ Important Disclaimer
**THIS IS NOT FINANCIAL ADVICE**
This indicator is for educational and informational purposes only. Trading involves substantial risk of loss and is not suitable for all investors. Past performance does not guarantee future results. No guarantee of accuracy - signals may be false. Not professional financial advice - consult a qualified advisor. Use only as part of comprehensive analysis. Always use proper risk management. Combine with other analysis techniques before making trading decisions. Indicator signals don't guarantee profitable trades. You are solely responsible for trading decisions and risk management. By using this indicator, you acknowledge understanding the risks and that you use it at your own risk. Never invest more than you can afford to lose. Works on all markets: Crypto, Forex, Stocks, Commodities, Futures
## Short Description (for Script Header - 200-300 chars)
Visual signal indicator combining normalized EMA slope momentum (No Trade Zone concept) with centered RSI format for direct comparison. Five signal types: NTZ momentum crosses, acceleration bursts, price-RSI divergences, slope-RSI exhaustion reversals, and RSI-slope oscillator alignment. Includes stretch filter, exit confirmation bars, and trailing stop exits with separate settings per signal type.
## Tags (for Publishing)
EMA, Moving Average, Slope, Momentum, No Trade Zone, NTZ, Indicator, Technical Analysis, RSI, Relative Strength Index, Centered RSI, RSI-50, Divergence, Slope-RSI, Exhaustion, RSI-Slope Oscillator, Normalized Comparison, Stretch Filter, Trend Confirmation, Exit Confirmation, Trailing Stop, Alerts, Signals, Visual Signals, Entry Signals, Exit Signals, Crypto, Forex, Stocks, Futures, Swing Trading, Day Trading, Reversal Trading, Range Trading, Momentum Analysis
## Category
**Indicators** → **Momentum**

EMA Cross + RSI + ADX - Autotrade Strategy V2Overview
A versatile trend-following strategy combining EMA 9/21 crossovers with RSI momentum filtering and optional ADX trend strength confirmation. Designed for both cryptocurrency and traditional futures/options markets with built-in stop loss management and automated position reversals.
Key Features
Multi-Market Compatibility: Works on both crypto futures (Bitcoin, Ethereum) and traditional markets (NIFTY, Bank NIFTY, S&P 500 futures, equity options)
Triple Confirmation System: EMA crossover + RSI filter + ADX strength (optional)
Automated Risk Management: 2% stop loss with wick-touch detection
Position Auto-Reversal: Opposite signals automatically close and reverse positions
Webhook Ready: Six distinct alert messages for automation (Entry Buy/Sell, Close Long/Short, SL Hit Long/Short)
Performance Metrics
NIFTY Futures (15min): 50%+ win rate with ADX filter OFF
Crypto Markets: Requires extensive backtesting before live deployment
Optimal Timeframes: 15-minute to 1-hour charts (patience required for higher timeframes)
Strategy Logic
Entry Signals:
LONG: EMA 9 crosses above EMA 21 + RSI > 55 + ADX > 20 (if enabled)
SHORT: EMA 9 crosses below EMA 21 + RSI < 45 + ADX > 20 (if enabled)
Exit Signals:
Opposite EMA crossover (auto-closes current position)
Stop loss hit at 2% from entry price (tracks candle wicks)
Technical Indicators:
Fast EMA: 9-period (short-term trend)
Slow EMA: 21-period (primary trend)
RSI: 14-period with 55/45 thresholds (momentum confirmation)
ADX: 14-period with 20 threshold (trend strength filter - optional)
Market-Specific Settings
Traditional Markets (NIFTY, Bank NIFTY, S&P Futures, Options)
Recommended Settings:
ADX Filter: Turn OFF (less choppy, cleaner trends)
Timeframe: 15-minute chart
Win Rate: 50%+ on NIFTY Futures
Why No ADX: Traditional markets have more institutional participation and smoother price action, making ADX unnecessary
Cryptocurrency Markets (BTC, ETH, Altcoins)
Recommended Settings:
ADX Filter: Turn ON (ADX > 20)
Timeframe: 15-minute to 1-hour
Extensive backtesting required before live trading
Why ADX: Crypto markets are highly volatile and prone to false breakouts; ADX filters low-quality chop
Best Practices
✅ Backtest thoroughly on your specific instrument and timeframe
✅ Use larger timeframes (1H, 4H) for higher quality signals and better risk/reward
✅ Adjust RSI thresholds based on market volatility (try 52/48 for more signals, 60/40 for fewer but stronger)
✅ Monitor ADX effectiveness - disable for traditional markets, enable for crypto
✅ Proper position sizing - adjust default_qty_value based on your capital and instrument price
✅ Paper trade first - test for 2-4 weeks before risking real capital
Risk Management
Fixed 2% stop loss per trade (adjustable)
Stop loss tracks candle wicks for accurate execution
Positions auto-reverse on opposite signals (no manual intervention needed)
0.075% commission built into backtest (adjust for your broker)
Customization Options
All parameters are adjustable via inputs:
EMA periods (default: 9/21)
RSI length and thresholds (default: 14-period, 55/45 levels)
ADX length and threshold (default: 14-period, 20 threshold)
Stop loss percentage (default: 2%)
Webhook Automation
This strategy includes six distinct alert messages for automated trading:
"Entry Buy" - Long position opened
"Entry Sell" - Short position opened
"Close Long" - Long position closed on opposite crossover
"Close Short" - Short position closed on opposite crossover
"SL Hit Long" - Long stop loss triggered
"SL Hit Short" - Short stop loss triggered
Compatible with Delta Exchange, Binance Futures, 3Commas, Alertatron, and other webhook platforms.
Important Notes
⚠️ Crypto markets require extensive backtesting - volatility patterns differ significantly from traditional markets
⚠️ Higher timeframes = better results - 15min works but 1H/4H provide cleaner signals
⚠️ ADX toggle is critical - OFF for traditional markets, ON for crypto
⚠️ Not financial advice - always conduct your own research and use proper risk management
⚠️ Past performance ≠ future results - backtest results may not reflect live trading conditions
Disclaimer
This strategy is for educational and informational purposes only. Trading futures and options involves substantial risk of loss. Always backtest thoroughly, start with paper trading, and never risk more than you can afford to lose. The author assumes no responsibility for any trading losses incurred using this strategy.

EMA RSI CrossThe EMA RSI Cross (ERC) indicator combines exponential moving average (EMA) crossovers with relative strength index (RSI) momentum signals to highlight potential bullish and bearish trading opportunities.
It works in two layers:
EMA Cross Layer: Tracks short‑term vs. mid‑term trend shifts using EMA(5) crossing above/below EMA(20), while also displaying EMA(50) and EMA(200) for longer‑term structure.
RSI Confirmation Layer: Confirms momentum by requiring RSI(14) to cross its moving average (SMA 14) within a recent lookback window.
Only when both conditions align, and the price confirms the setup in relation to EMA20, a signal is generated:
Bullish Signal (green triangle): EMA5 crosses above EMA20 + RSI crosses up + close above EMA20
Bearish Signal (red triangle): EMA5 crosses below EMA20 + RSI crosses down + close below EMA20
Features
Customizable timeframe input for multi‑timeframe analysis
Adjustable lookback period for RSI confirmation
Clear charting with EMA overlays and arrow signals when confirmed setups occur
RSI panel with dynamic background and overbought/oversold visualization
How to Use
Add the script to your chart, select your preferred signal timeframe.
Look for green arrows as bullish entry confirmation and red arrows for bearish setups.
Use additional filters (trend direction, support/resistance, volume) to refine trades.
Avoid relying on signals in sideways/choppy markets where EMA and RSI may give false triggers.

EMA/SMA Ribbon Pro (AUTO HTF + Labels)This indicator is a multi-timeframe (MTF) moving average ribbon that dynamically adjusts to the next highest timeframe. It provides a visual representation of market trends by stacking multiple EMAs and SMAs with customizable color fills and labels.
Features
✅ Multi-Timeframe (MTF) Support: Automatically detects the next highest time frame or allows for manual selection
✅ Customizable Moving Averages: Supports EMA and SMA with different lengths for flexible configuration
✅ Ribbon Visualization: Smooth color transitions between different moving averages for better trend identification
✅ Crossover Labels: Detects bullish and bearish EMA/SMA crossovers and marks them on the chart
✅ Price Labels & Timeframe Display: Displays moving average values to the right of the price axis with customizable label padding and colors
How It Works
Select the HTF mode: Manual or automatic
Choose EMA/SMA lengths to create different ribbons
Enable/disable price labels for each moving average
Customize colors and transparency for ribbons and labels
Crossover labels appear when faster moving averages cross slower ones and vice versa
Use Cases
📌 Trend Identification: Identify bullish and bearish trends using multiple EMAs and SMAs
📌 Support & Resistance Zones: MAs can act as dynamic support and resistance levels
📌 Reversal & Confirmation Signals: Watch for MTF crossovers to confirm trend changes
Customization
🔹 Standard EMA Lengths: 6, 8, 13, 21, 34, 48, 100, 200, 300, 400
🔹 SMA Lengths: 48, 100, 200
🔹 Color Adjustments: Set custom colors for bullish/bearish ribbons
🔹 Crossovers: Enable/disable custom crossover pairs (e.g., 100/200 EMA, 200 EMA/SMA).
This indicator is perfect for traders who rely on multi-timeframe confluence while seeking to enhance their market analysis and decision-making process.
As always, by combining EMA/SMA Ribbon with other tools, traders ensure that they are not relying on a single indicator. This layered approach can reduce the likelihood of false signals and improve overall trading accuracy.
As always, be sure to use any indicator with price action and volume indicators for better trade confirmation!

EMA orderly stacked or notThis script plots a green circle on top of the chart when the EMAs are stacked positively, a red circle if they are stacked negatively and gray if neither positively nor negatively stacked.
The EMAs used are:
8 EMA
21 EMA
34 EMA
55 EMA
89 EMA
Useful when you look for a quick and easy way to see if these EMAs are stacked positively or negatively as a confirmation to the Squeeze Pro indicator if going long or short (Squeeze Pro is developed by John Carter at SimplerTrading.com and can be purchased there).
Default 100 bars back, but that can be adjusted.
Remember to do your own research.
Feel free to adjust the script to your liking.
The script is not meant to be, and do not constitute, financial, investment, trading, or other types of advice or recommendations supplied or endorsed by me.
Have fun!

EMA HeatmapEMA Heatmap — Indicator Description
The EMA Order Heatmap is a visual trend-structure tool designed to show whether the market is currently trending bullish, trending bearish, or moving through a neutral consolidation phase. It evaluates the alignment of multiple exponential moving averages (EMAs) at three different structural layers: short-term daily, medium-term daily, and weekly macro trend. This creates a quick and intuitive picture of how well price movement is organized across timeframes.
Each layer of the heatmap is scored from bearish to bullish based on how the EMAs are stacked relative to each other. When EMAs are in a fully bullish configuration, the row displays a bright green or lime color. Fully bearish alignment is shown in red. Yellow tones appear when the EMAs are mixed or compressing, indicating uncertainty, trend exhaustion, or a change in market character. The three rows combined offer a concise view of whether strength or weakness is isolated to one timeframe or broad across the market.
This indicator is best used as a trend filter before making trading decisions. Traders may find more consistent setups when the majority of the heatmap supports the direction of their trade. Green-dominant conditions suggest a trending bullish environment where long trades can be favored. Red-dominant conditions indicate bearish momentum and stronger potential for short opportunities. When yellow becomes more prominent, the market may be transitioning, ranging, or gearing up for a breakout, making timing more challenging and risk higher.
• Helps quickly identify directional bias
• Highlights when trends strengthen, weaken, or turn
• Provides insight into whether momentum is supported by higher timeframes
• Encourages traders to avoid fighting market structure
It is important to recognize the limitations. EMAs are lagging indicators, so the heatmap may confirm a trend after the initial move is underway, especially during fast reversals. In sideways or low-volume environments, the structure can shift frequently, reducing clarity. This tool does not generate entry or exit signals on its own and should be paired with price action, momentum studies, or support and resistance analysis for precise trade execution.
The EMA Order Heatmap offers a clean and reliable way to stay aligned with the broader market environment and avoid lower-quality trades in indecisive conditions. It supports more disciplined decision-making by helping traders focus on setups that match the prevailing structural trend.

EMA Cross Alert V666 [noFuck]EMA Cross Alert — What it does
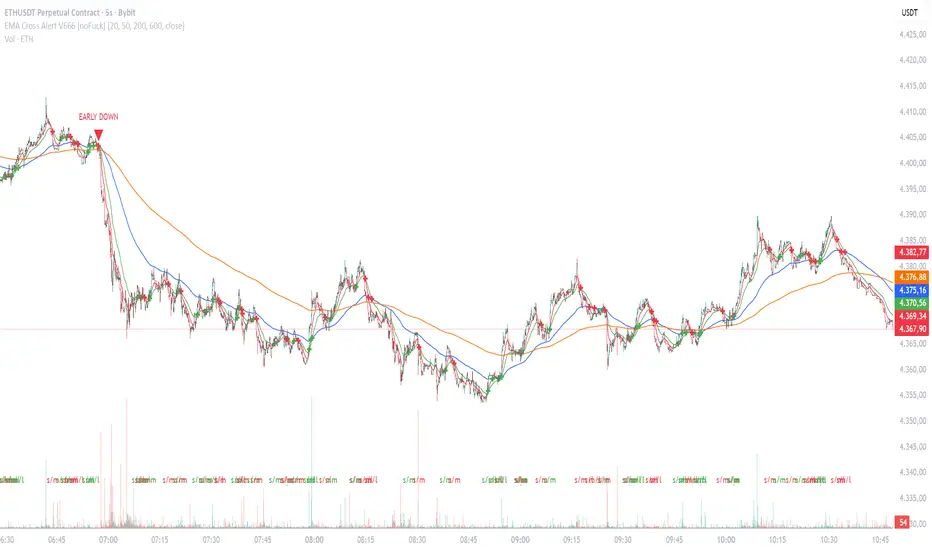
EMA Cross Alert watches three EMAs (Short, Mid, Long), detects their crossovers, and reports exactly one signal per bar by priority: EARLY > Short/Mid > Mid/Long > Short/Long. Optional EARLY mode pings when Short crosses Long while Mid is still between them—your polite early heads-up.
Why you might like it
Three crossover types: s/m, m/l, s/l
EARLY detection: earlier hints, not hype
One signal per bar: less noise, more focus
Clear visuals: tags, big cross at signal price, EARLY triangles
Alert-ready: dynamic alert text on bar close + static alertconditions for UI
Inputs (plain English)
Short/Mid/Long EMA length — how fast each EMA reacts
Extra EMA length (visual only) — context EMA; does not affect signals
Price source — e.g., Close
Show cross tags / EARLY triangles / large cross — visual toggles
Enable EARLY signals (Short/Long before Mid) — turn early pings on/off
Count Mid EMA as "between" even when equal (inclusive) — ON: Mid counts even if exactly equal to Short or Long; OFF (default): Mid must be strictly between them
Enable dynamic alerts (one per bar close) — master alert switch
Alert on Short/Mid, Mid/Long, Short/Long, EARLY — per-signal alert toggles
Quick tips
Start with defaults; if you want more EARLY on smooth/low-TF markets, turn “inclusive” ON
Bigger lengths = calmer trend-following; smaller = faster but choppier
Combine with volume/structure/risk rules—the indicator is the drummer, not the whole band
Disclaimer
Alerts, labels, and triangles are not trade ideas or financial advice. They are informational signals only. You are responsible for entries, exits, risk, and position sizing. Past performance is yesterday; the future is fashionably late.
Credits
Built with the enthusiastic help of Code Copilot (AI)—massively involved, shamelessly proud, and surprisingly good at breakfasting on exponential moving averages.
EMA Grid + Martingale Indicator (Long-Only)Title:
EMA Grid + Martingale Indicator (Long-Only)
Short Summary:
A 4-EMA trend filter combined with a grid-based entry system and optional martingale sizing to visualize staged long entries and exits in bullish markets.
Full Description:
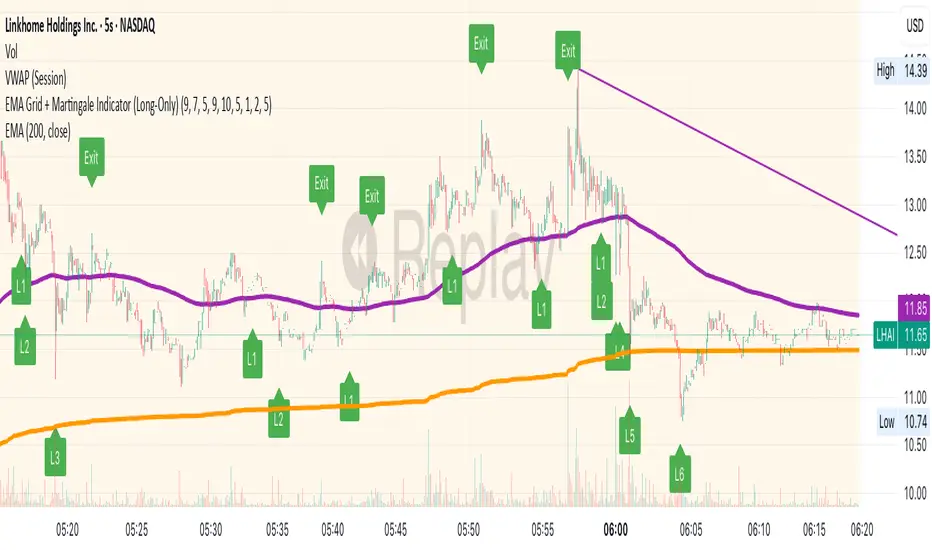
This indicator combines a 4-EMA trend filter with a grid-based entry system and optional martingale-style position sizing to help traders visualize staged long entries and exits in trending markets.
How It Works
1. Trend Detection: Uses two sets of EMAs (fast/slow pairs) to confirm bullish momentum. A long signal is generated when both EMA groups align in an uptrend.
2. Grid Entries: After the initial long entry, additional grid levels are triggered every time price drops by the specified grid step (in pips).
3. Martingale Sizing (Optional): Each subsequent entry can increase in size based on the defined martingale factor.
4. Weighted-Average Exit: Calculates the weighted average of all grid entries and signals an exit when the price reaches or surpasses this level plus an optional buffer.
Key Features
• 4 EMA Trend Filter with fully customizable lengths.
• Dynamic grid entries with visual labels (L1, L2, etc.).
• Optional martingale position sizing.
• Weighted-average exit with adjustable buffer.
• Customizable parameters for EMAs, grid steps, max entries, and buffer pips.
• Clear chart visualization of EMAs and entry/exit levels.
Use Cases
• For traders using cost-averaging or grid strategies in bullish markets.
• Visualizes multiple entry levels and profit targets.
• Useful for backtesting and strategy planning.
Note: This indicator is for visualization and planning purposes only. It does not execute trades automatically. It does not guarantee profits and is not financial advice.
Scalping all timeframe EMA & RSIEMA 50 and EMA 100 combined with RSI 14
Should also be accompanied by the RSI 14 chart.
With the following conditions:
IF the EMAs are close but not crossing:
* Be prepared to take a Sell position if the first Bearish Candlestick crosses the lowest EMA, and the RSI value is equal to or below 40.
* Be prepared to take a Buy position if the first Bullish Candlestick crosses the highest EMA, and the RSI value is equal to or above 60.
IF the EMAs are overlapping and crossing:
* Be prepared to take a Sell position if the first Bearish Candlestick crosses both EMAs, and the RSI value crosses below 50.
*Be prepared to take a Buy position if the first Bullish Candlestick crosses both EMAs, and the RSI value crosses above 50.

EMA Clouds with Strict Buy/Sell SignalsEMA Clouds with Strict Buy/Sell Signals - Precision Trading Unleashed
Unlock the power of trend-following precision with the EMA Clouds with Strict Buy/Sell Signals indicator, a sophisticated tool built for traders who demand reliability and clarity in their decision-making. Inspired by the legendary Ripster EMA Clouds, this indicator takes the classic cloud concept to the next level by incorporating stricter, high-confidence signals—perfect for navigating the markets on 15-minute or higher timeframes.
Why You’ll Want This on Your Chart:
Dual EMA Clouds for Crystal-Clear Trends: Watch as two dynamic clouds—formed by carefully paired Exponential Moving Averages (8/21 and 34/50)—paint a vivid picture of market momentum. The green short-term cloud and red long-term cloud provide an intuitive, at-a-glance view of trend direction and strength.
Stricter Signals, Fewer False Moves: Tired of chasing weak signals? This indicator only triggers buy and sell signals when the stars align: a cloud crossover (short-term crossing above or below long-term) and price confirmation above or below both clouds. The result? Fewer trades, higher conviction, and a cleaner chart.
Customizable Timeframe Power: Whether you’re a scalper on the 15-minute chart or a swing trader on the daily, tailor the clouds to your preferred higher timeframe (15min, 30min, 1hr, 4hr, or daily) for seamless integration into your strategy.
Visual Mastery Meets Actionable Alerts: Green buy triangles below the bars and red sell triangles above them make spotting opportunities effortless. Pair this with built-in alerts, and you’ll never miss a high-probability trade again.
How It Works:
Buy Signal: Triggers when the short-term cloud crosses above the long-term cloud and the price surges above both, signaling a robust bullish breakout.
Sell Signal: Activates when the short-term cloud dips below the long-term cloud and the price falls beneath both, confirming bearish dominance.
Cloud Visualization: The green cloud (8/21 EMA) tracks fast-moving trends, while the red cloud (34/50 EMA) anchors the broader market direction—together, they filter noise and spotlight tradable moves.
Why Traders Will Love It:
Designed for those who value precision over guesswork, this indicator cuts through market clutter to deliver signals you can trust. Whether you’re trading stocks, forex, crypto, or futures, its adaptability and strict logic make it a must-have tool for serious traders. Customize the EMA lengths, tweak the timeframe, and watch your edge sharpen.
Add EMA Clouds with Strict Buy/Sell Signals to your chart today and experience the confidence of trading with a tool that’s as disciplined as you are. Your next big move is waiting—don’t let it slip away.

EMA RibbonI added 7 EMA in a ribbon form ( basically, I took from the open script base and just combined them)
By default:
To see Short trends ( Alligator)
EMA(5)
EMA(8)
EMA(13)
To See Longer Trends
EMA(20)
EMA(50)
EMA(100)
EMA(200)
Cheers
EMA Grid + Martingale Strategy (Long-Only) with CooldownTitle:
EMA Grid + Martingale Strategy (Long-Only) with Cooldown
Short Summary:
A long-only strategy combining EMA trend filters, grid-based entries, optional martingale sizing, and a cooldown feature to manage position timing and exits.
Full Description:
This strategy uses a 4-EMA trend confirmation system to detect bullish momentum, then deploys a grid-style entry method with optional martingale position sizing. It includes a cooldown mechanism to prevent reentry too soon after a completed trade cycle.
How It Works
1. Trend Confirmation: Two EMA groups (fast/slow) determine whether market conditions are bullish.
2. Initial Entry: A new position is entered when both EMA groups confirm an uptrend and no position is currently active.
3. Grid Entries: Additional long entries are placed when price drops by a defined pip distance from the last entry, respecting the maximum number of entries.
4. Martingale Sizing (Optional): Grid orders can increase in size with each level using a customizable multiplier.
5. Weighted-Average Exit: All positions close once price reaches or exceeds the average entry price plus a buffer.
6. Cooldown Timer: After closing a position set, the strategy waits a defined number of bars before opening a new grid.
Key Features
• 4 customizable EMAs for trend confirmation.
• Dynamic grid-style long entries based on pip intervals.
• Optional martingale-style position sizing.
• Weighted-average price exit logic with buffer control.
• Cooldown bar period to limit overtrading.
• Suitable for optimization and backtesting with full control over inputs.
Use Cases
• Designed for trending markets where pullbacks present entry opportunities.
• Helps manage staged entries while avoiding premature reentry.
• Ideal for testing martingale and grid-based strategies with exit precision.
Note: This strategy is for testing and educational purposes only. It does not guarantee profits and is not financial advice.

EMAs MTF (Miu)This indicator plots multiple EMA (Exponential Moving Average) on chart.
You can set up to 3 different EMA for the current timeframe and you can add up to 3 more different EMA with a different timeframe. So you can have up to 6 EMAs on your chart.
This way you can easily see multiple EMA lines with a single indicator to setup.
Indicator will automaticaly plot labels with symbol's price, timeframe and which EMA is set for easy identification.
You can also set an alert that will trigger anytime current price crosses any active EMA.
Alerts will provide detailed information such as:
1) Symbol
2) Which EMA and timeframe that has been crossed
3) Current symbol price
Feel free to give feedbacks on comments section below. Suggestions are welcome.
Enjoy!

EMA + ATR Support and Resistance + Take Profit SignalThe 'EMA+ ATR Support Resistance Take Profit signal' indicator is a technical analysis tool designed to help traders identify potential support and resistance levels, using the Exponential Moving Average (EMA) and the Average True Range (ATR) indicators. This indicator not only tracks the EMA and ATR but also plots these levels as support and resistance lines, providing useful insights into potential buy and sell points.
The indicator allows you to set the lengths for both the EMA and ATR, with default values set to 20 and 14, respectively. Moreover, you can specify the multiplier for the ATR in the Support/Resistance (S/R) length setting, which defaults to 2. The line width for the plotted lines can also be adjusted according to your preference.
The EMA line in center is invisible by default but you can change that by going to the setting of the indicator. The support and resistance lines are plotted in green and red, respectively. When the price hits the support or resistance levels, the indicator provides a visual signal with a cross shape below or above the respective bars, in lime and red, respectively. If you do not need the take profit signals you can disable them in the setting.
How to Use:
1. Define the EMA and ATR lengths according to your trading strategy. Higher lengths will provide smoother lines but may also lag the current price action.
2. Set the S/R length to determine the distance of the support and resistance lines from the EMA line. Higher values will place these lines further away from the EMA.
3. Monitor the chart for instances when the price hits the support or resistance levels. This is indicated by a cross shape below (for support hit) or above (for resistance hit) the price bar. These points may be considered as potential take profit points or entry/exit points, depending on your strategy.
4. Use the indicator in conjunction with other tools and indicators to confirm signals and reduce the risk of false signals. So the assumption is you enter a trade using your other indicators but you can rely on this indicator to remind you to take profit if you are long by a red cross of the resistance line and if you are short reminds you by a green cross on the support line.
Disclaimer: This indicator should not be used as the sole determinant for any investment decision. Always conduct thorough research and consider multiple factors before trading.

Ripster EMA CloudsEMA Cloud By Ripster
EMA Cloud System is a Trading System Invented by Ripster where areas are shaded between two desired EMAs. The concept implies the EMA cloud area serves as support or resistance for Intraday & Swing Trading. This can be utilized effectively on 10 Min for day trading and 1Hr/Daily for Swings. Ripster himself utilizes various combinations of the 5-12, 34-50, 8-9, 20-21 EMA clouds but the possibilities are endless to find what works best for you.
“Ideally, 5-12 or 5-13 EMA cloud acts as a fluid trendline for day trades. 8-9 EMA Clouds can be used as pullback Levels –(optional). Additionally, a high level price over or under 34-50 EMA clouds confirms either bullish or bearish bias on the price action for any timeframe” – Ripster
