Displaced EMA Channel[UO]Riding a bull run is almost always riding an EMA value. 21 is the default here and it is my favorite.
You buy the asset when it touches the EMA again. But where to sell?
This indicator plots displaced EMA values guggesting possible sell targets. EMA is displaced by a given target profit.
The default values are adjusted on AAVE.
Thus the indicator presents a custom channel for your trading
Cerca negli script per "ema"

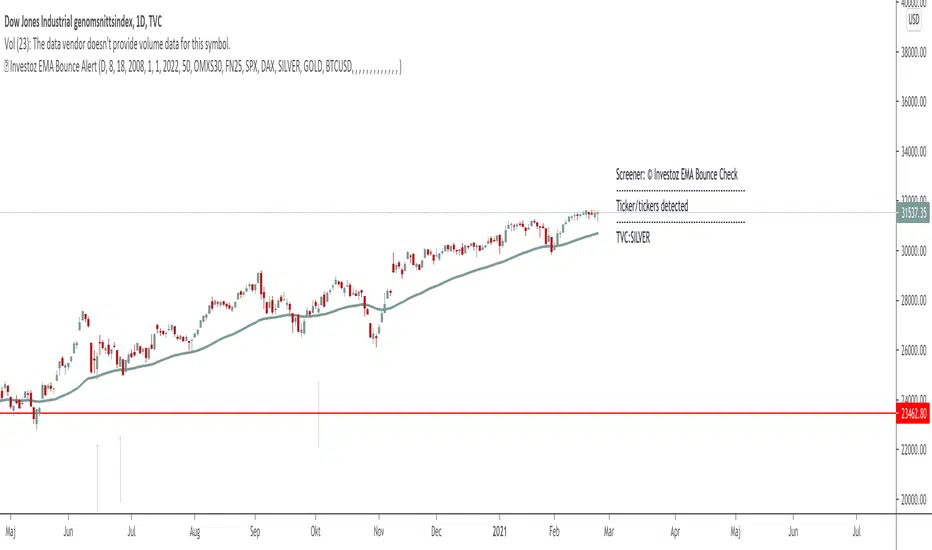
TheBlackFish EMA bounce alertAbout
This indicator is an EMA indicator with a built-in screener.
20 different ticker symbols are included in the screener. These ticker symbols must be replaced manually. All ticker symbols are from the Stockholm Stock Exchange, Large Cap.
How it works
The lowest price of a bar should be less than EMA and yesterday's closing greater than EMA.
If no conditions are found, there will be no ticker symbols in the box.
If the conditions are met, the ticker symbol / symbols are displayed in the black text box. The information in the box disappears after each new bar.
The default setting is set to EMA 50, but you can select which EMA value you want in its settings.
Change ticker
If you want to change the ticker symbol, do not forget to change both in "Check tickers" and in "Labels content".
Enjoy!
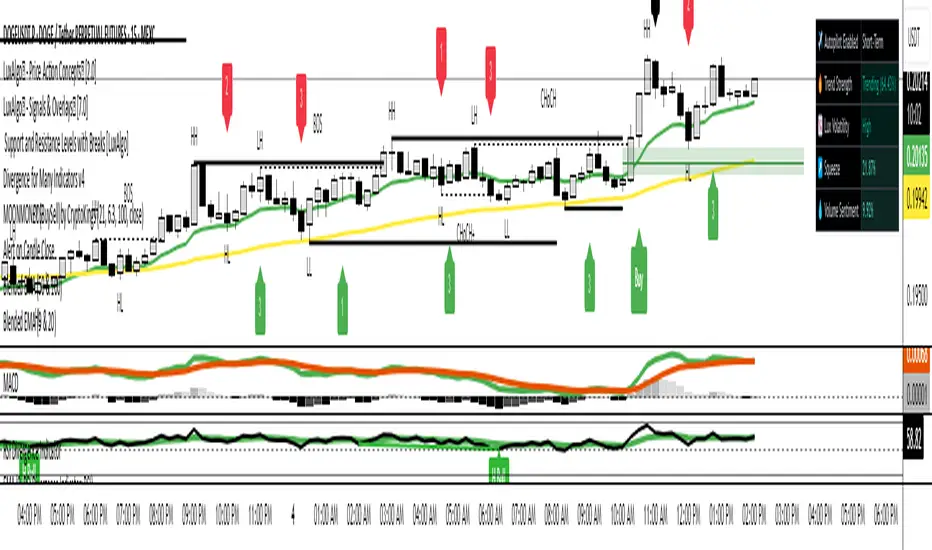
Blended EMA (9 & 20)Shows EMA 9, EMA 20, and their blended average
Toggle to hide/show the original EMAs
Clean, easy to read — ideal for entry setups on lower timeframes
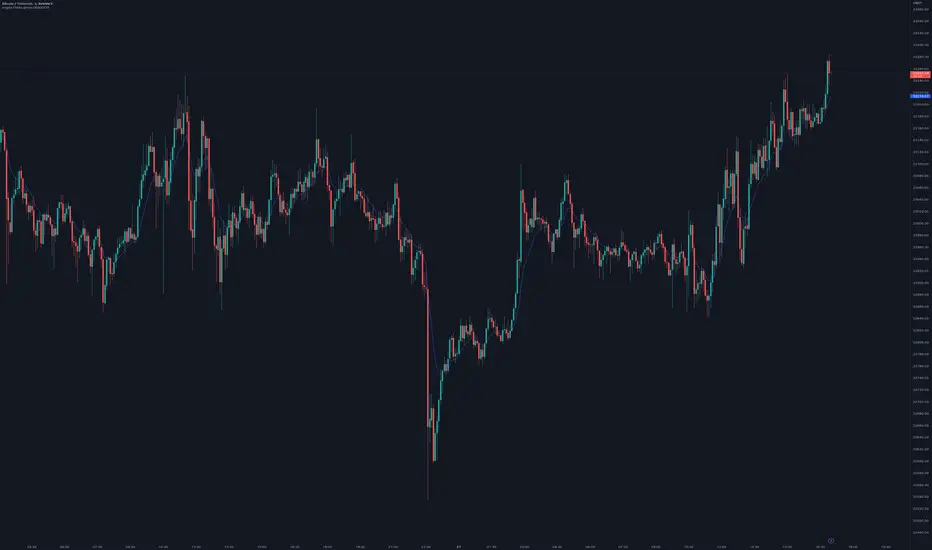
Larry Williams 3 Period EMAs strategyLarry R. Williams explains this strategy in his book "Long-Term secrets to Short-Term trading", it consists of using two 3-period EMAs, one representing the Highs and the other the Lows.
When the price falls below the 3-period Lows EMA we have a long signal.
The trade is closed when the price closes above the 3-period Highs EMA . BINANCE:BTCUSDT

Ranging EMA SpreadAn attempt at identifying ranging price behavior at EMA crossover points.
I noticed that when price consolidates that the spread between two EMAs at times will sort of fluctuate between a tight range before it breaks out.
Basically this just highlights the bars that are within a predefined EMA spread percentage range for X amount of bars.
Sometimes the crossovers just happen cleanly, but the above example sort of illustrates my idea.


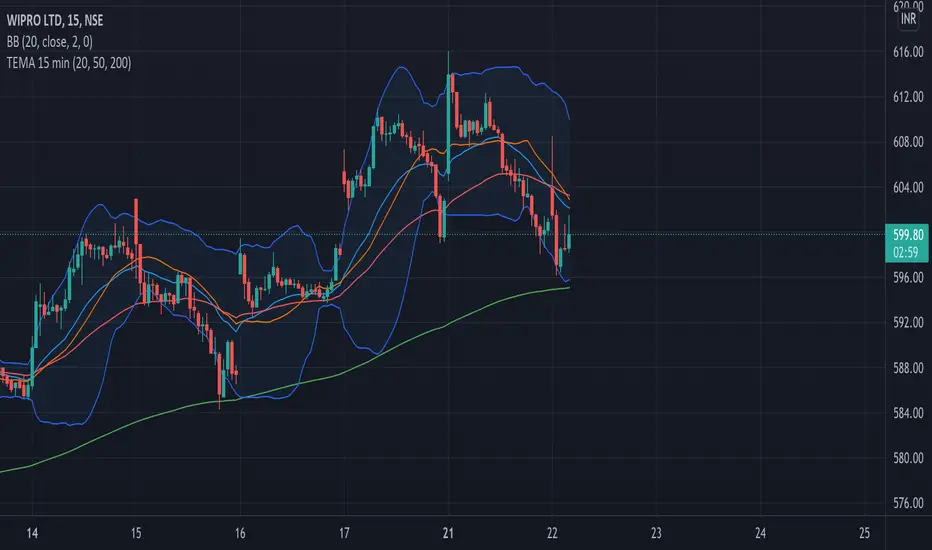
50 EMA HLC Tejas50 EMA with All important sources. Made it with 50 EMA and Based on my understanding and observations.

Customizable EMA 10/20/50/100Customizable EMA indicator. Fully adjustable with inputs so you can change EMA lengths and colors directly from the indicator settings panel.

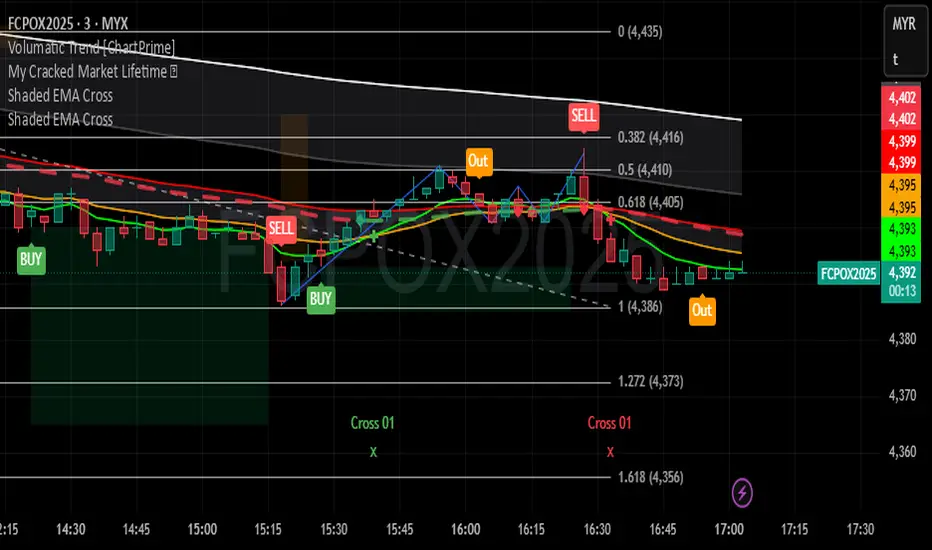
Shaded EMA CrossIndicator included 5 EMA's ( 9,20,50,100,200 ) with EMA cross marker
and shaded area between EMAs.
Shaded EMA100 and EMA200 to see market trend.
Shaded EMA20 and EMA50 to see market short trend.
Trend Filter (Higher Timeframe EMA)English (EN)
This indicator overlays the higher timeframe (default: 1H) EMA trend onto your current chart to serve as a directional filter for trading decisions.
- Fetches and plots EMA20 / EMA50 / EMA200 from a higher timeframe (user-configurable)
- Identifies LONG trend when EMA20 > EMA50 > EMA200, SHORT trend when EMA20 < EMA50 < EMA200
- Changes background color based on trend direction (Green = Long, Red = Short)
- Can trigger alerts when a new trend direction is detected
1. Apply this script to lower timeframes such as 5m or 15m charts to see the higher timeframe trend.
2. When the background is green, consider long setups; when red, consider short setups.
3. Use this as a filter in conjunction with your main entry signals, not as a standalone strategy.
- Default higher timeframe is 1 hour, but you can change it in the settings.
- This script does not provide financial advice. Use at your own risk.
日本語(JP)
このインジケーターは、現在のチャートに上位足(デフォルト:1時間足)のEMAトレンドを重ねて表示し、売買方向のフィルターとして利用できます。
【機能】
- 上位足(設定可能)のEMA20 / EMA50 / EMA200 を取得して表示
- EMA20 > EMA50 > EMA200 でロングトレンド、EMA20 < EMA50 < EMA200 でショートトレンド判定
- トレンド方向に応じて背景色を変化(緑=ロング、赤=ショート)
- トレンド発生時にアラートを送信可能
【使い方】
1. 5分足や15分足など短期足に適用し、背景色で上位足の流れを確認します。
2. 背景が緑の時は買い目線、赤の時は売り目線で短期エントリーを検討します。
3. 単独での売買判断ではなく、他のテクニカル指標と併用してご利用ください。
【注意】
- デフォルトは1時間足で計算していますが、設定から変更可能です。
- 本スクリプトは投資助言を行うものではありません。ご利用は自己責任でお願いします。

Custom EMAsNow the indicator includes 10 different types of EMAs, each with a changeable length and selectable type. You can use the input settings to adjust the type and length for each EMA. The plot shows all 10 EMAs on the chart.

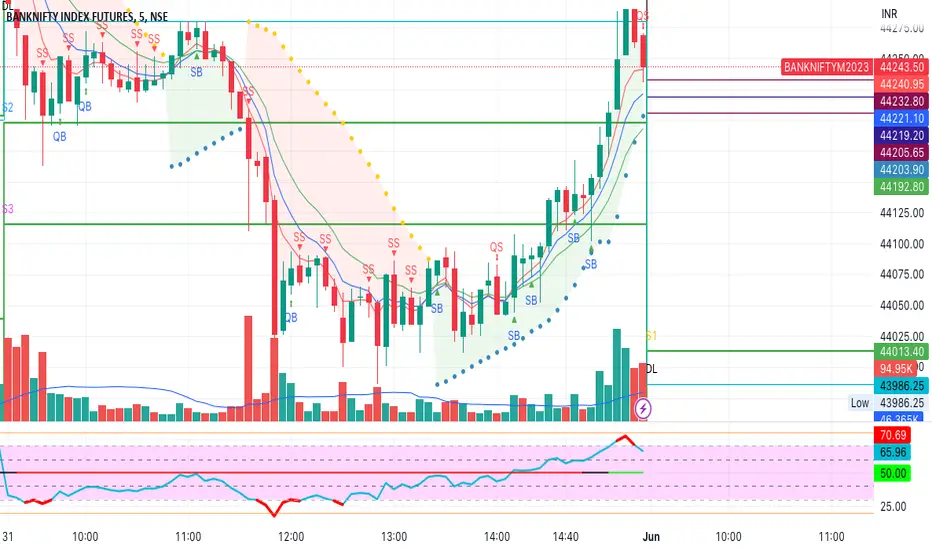
Buy Sell using 5-8-13 EMA, RSI, PSAR IndicatorThis indicator generates Scalping and Strong Buy/Sell Signals.
Quick Scalp signals are generated using 5 EMA and RSI.
Strong Buy/Sell Signals are generated using combination of 5-8-13 EMA and Parabolic SAR.
Signals generated:
QB: Quick Buy
QS: Quick Sell
SB: Strong Buy
SS: Strong Sell

Triple EMAThis script contains triple EMAs (20, 50 and 200) you can edit them according to your preferences by going to settings and select whatever EMA you are used to.
crypto EMAs - @rlvsThere are lots of indicators to show EMAs.
This one is different because it shows EMAs 12 and 26 for the current timeframe, and, the same EMAs for the next timeframe.
Following this sequence: 1' -> 5' -> 15' -> 1h -> 4h -> 1d -> 1w -> 1 month
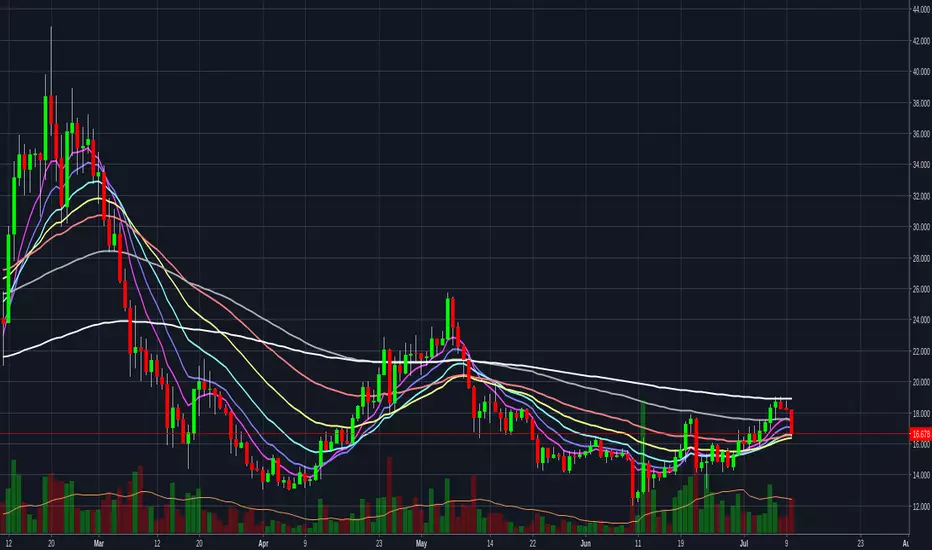
Nine Fibonacci EMAsAre you running short on available indicators in your chart?
Here you get 9 EMAs of the fibonacci sequence in one ;)
EMAs 8, 13, 21, 34, 55, 89, 144, 233 and 377.

Fibonacci EMAFibonacci EMAs (8,13,21,34,55) and Slow EMAs (100,200) for trend as well as S/R determination
smag ema distanceThis script will plot an ema of defined lenght with two lines at predefined %-distances from that ema


Goldencrossover - ema 5 over 13&26Goldencrossover - ema 5 over ema13& ema26 over the same candle.
Both up and down. If there is any such crossover during the same candle, then the indicator will highlight.

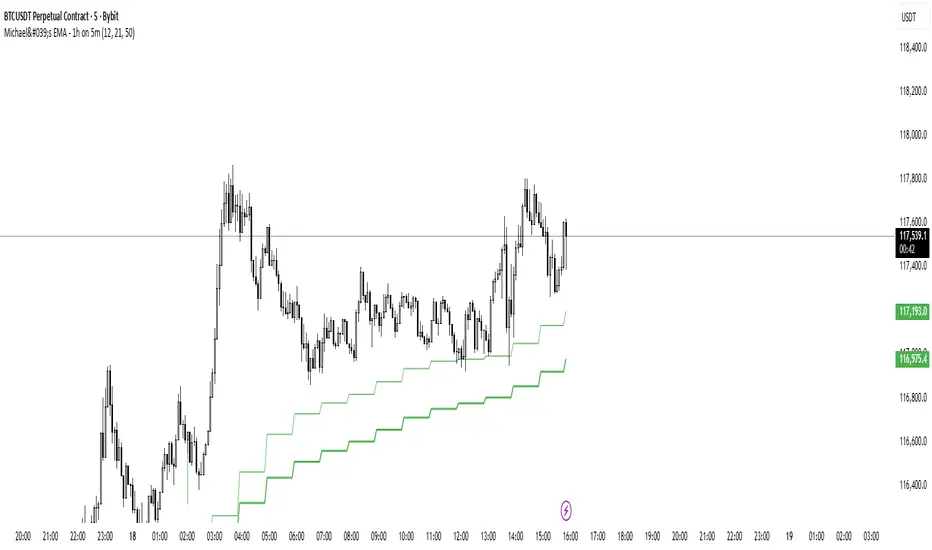
Michael's EMA - 1h on 5mMichael's EMA - 1h You can use this indicator on all time frame and be able to see the H4 Bands, that help you with less layout and better view
GM
Michael's EMA - 15m on 5mMichael's EMA - 15m on 5m You can use this indicator on all time frame and be able to see the H4 Bands, that help you with less layout and better view
GM
Michael's EMA - 4h on 5mH4 Michael's EMA on all TF, You can use this indicator on all time frame and be able to see the H4 Bands, that help you with less layout and better view
GM
