Entry ChecklistThis Pine Script creates a checklist table displayed in the bottom-right corner of the chart. It shows:
1. Whether the next earnings date is within the next 2 weeks
2. Whether the current month is a traditionally weak month (May, August, or September)
Each row includes:
• A check title
• The current value (e.g., date or month)
• A ❌ red cross if the condition is met (warning signal)
Useful for quickly assessing seasonal and earnings-related risks.
Cerca negli script per "entry"

ENTRY CONFIRMATION V2An indicator from candle man. Helps determine whether supply and demand zone are truly supply or demand.

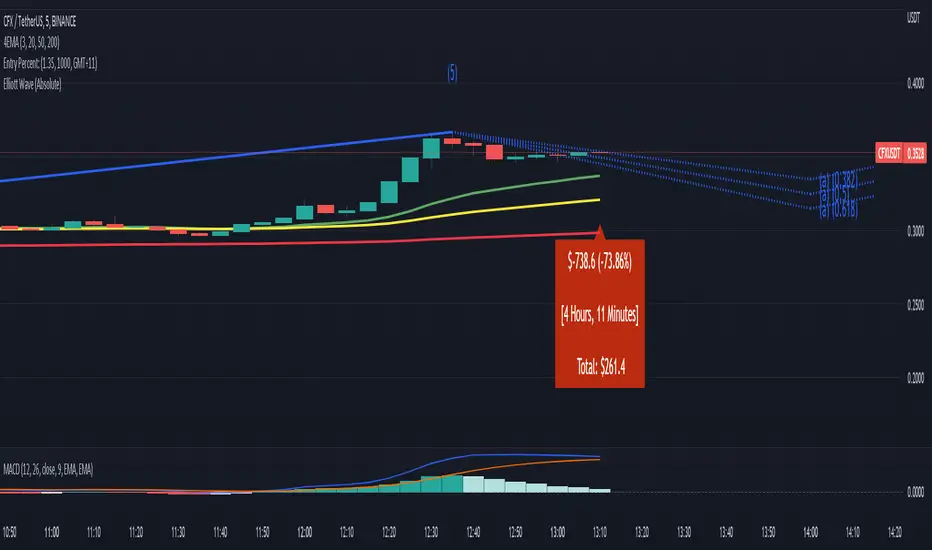
Entry Percent: EssamThis Pine Script code is designed to perform the task of computing and showcasing the profit percentage, profit value, and the duration for which a specific asset is held, all in real-time. The script effectively leverages the built-in resources to provide a seamless and robust experience, as it presents the calculated figures in an easily readable format on the chart, without causing any lag or disruptions to the chart.
Positional Swings by Batman TradesEntry and Exit Signals for higher timeframes based on Ema & Sma with RSI overbought/oversold plots for possible reversal indication.
It can be used for booking profit in the existing trade and take fresh position once the new candle breaks the high/low of alert candle depending upon the side.
Best work with high timeframes. (>1 Hour)
Best recommended for stocks

Entry Size 1barCalculates how many lots (100) you should buy/sell for any given bar with a fixed risk in USD and shows if Long (L), Short (S) or wait (w) with a label.
Requires max loss per week, trading days per day and lossing trading per day.

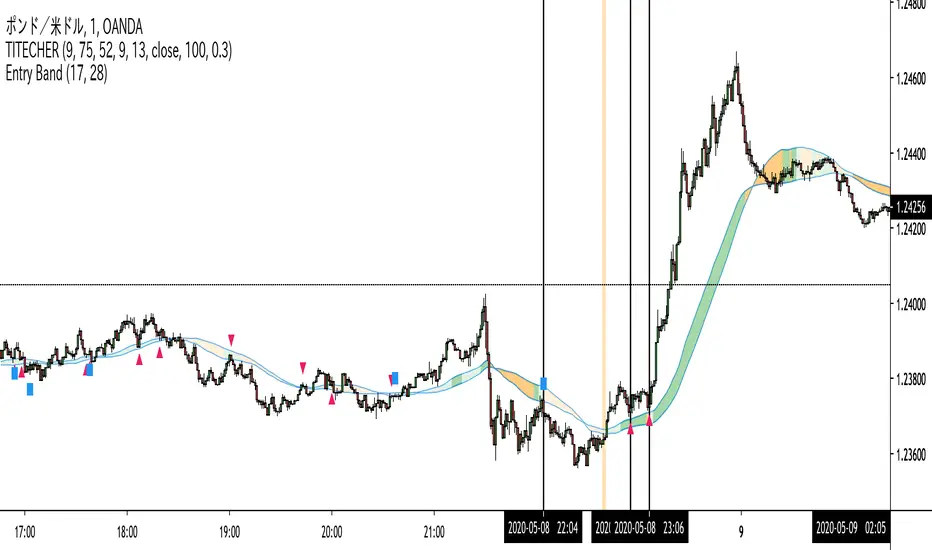
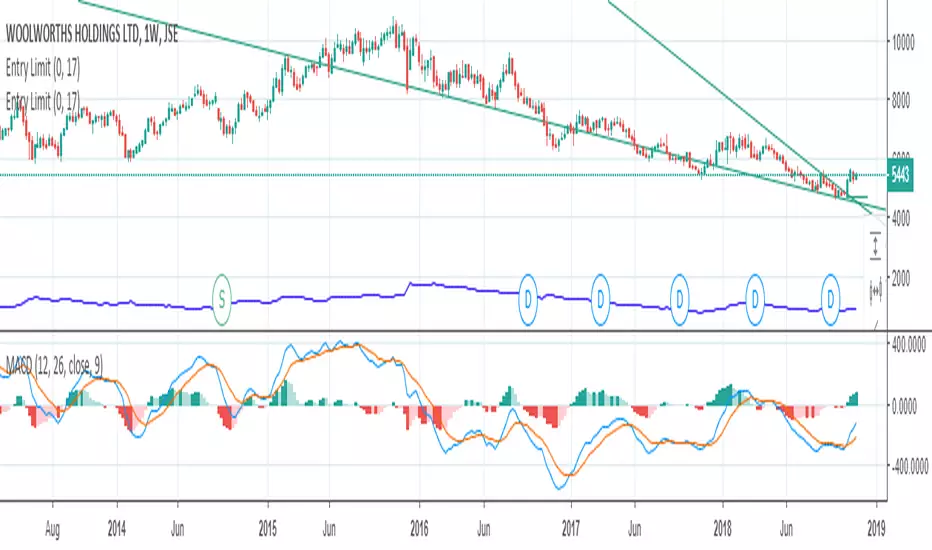
Entry Band(trial)This indicator is trial version. You can use for a month for free.
The indicator includes moving average and exponential moving average .
you can set the parameters you want.
you can see the trend.
green : up trend
orange : down trend
if you want to use this indicator, Please join the URL:

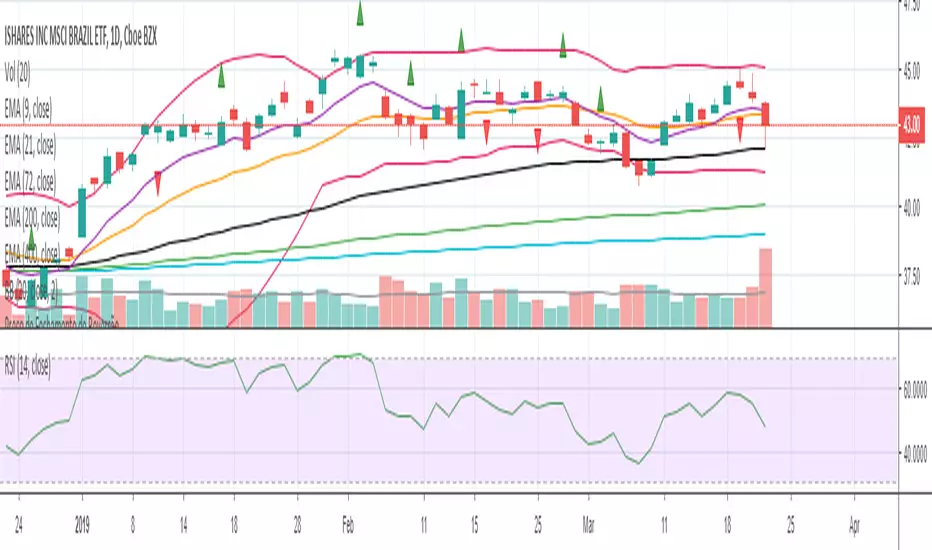
Entry BandThe indicator includes moving average and exponential moving average.
you can set the parameters you want.
you can see the trend.
green : up trend
orange : down trend
if you want to use this indicator, Please join the URL:
Entry FactorFind the most relevant price direction changes with ease, with this geometry-based indicator.
Stop wasting your time with moves that don't offer a satisfactory range for good profits.

Entry Bars -This algorithm takes in consideration Media averages, Volatility Movements and other Mathematical Properties.
-After adding this signal on TradingView, you will get notified every of potential long and short points triggered by the indicator.
-This signal alerts you anytime bars form a bullish or bearish pattern and price start to move in the suggested direction.
-It works in any time frame or market like Forex, Crypto, Commodities even Stocks.
-Recommended for bots or manual trading.
Do you need an Script or an expert adviser for Forex, contact our coding service
Get this indicator today! contact us

RocketScalperEntry follows the first normal candle after the highlights - use in conjunction with basic patterns, SFPs, and the until1mil indicators (SSO/MACD/MI/BZ)


[MV] %B with SMA + Volume Based Colored Bars
Entry Signal when %B Crosses with SMA and this is more meaningful if it supports colored bars.
Black Bar when prices go down and volume is bigger than 150% of its average, that indicates us price action is supported by a strong bearish volume
Blue Bar when prices go up and volume bigger than 150% of its average, that indicates us price action is supported by a strong bullish volume
VBC author @KIVANCfr3762

FX Sniper: T3-CCI Strategy - With 100 IndicatorsEntry signal when moving above -100, sell signal when going below 100


Amazing Crossover SystemEntry Rules
BUY when the 5 EMA crosses above the 10 EMA from underneath and the RSI crosses above the 50.0 mark from the bottom.
SELL when the 5 EMA crosses below the 10 EMA from the top and the RSI crosses below the 50.0 mark from the top.
Make sure that the RSI did cross 50.0 from the top or bottom and not just ranging tightly around the level.
How to setup Alert:
1) Add the Amazing Crossover System to your chart via Indicators
2) Find your currency pair
3) Set the timeframe on the chart to 1 hour
4) Press 'Alt + A' (create alert shortcut)
5) Set the following criteria for the alert:
Condition = 'Amazing Crossover System', Plot, ' BUY Signal'
The rest of the alert can be customized to your preferences
5) Repeat steps 1 - 4, but set the Condition = 'Amazing Crossover System', Plot, ' SELL Signal'

Razzere Cloned! EzAlgo V.8.1showBuySell = input(true, "Show Buy & Sell", group="BUY & SELL SIGNALS")
hassasiyet = input.float(3, "Hassasiyet (1-6)", 0.1, 99999, group="BUY & SELL SIGNALS")
percentStop = input.float(1, "Stop Loss % (0 to Disable)", 0, group="BUY & SELL SIGNALS")
offsetSignal = input.float(5, "Signals Offset", 0, group="BUY & SELL SIGNALS")
showRibbon = input(true, "Show Trend Ribbon", group="TREND RIBBON")
smooth1 = input.int(5, "Smoothing 1", 1, group="TREND RIBBON")
smooth2 = input.int(8, "Smoothing 2", 1, group="TREND RIBBON")
showreversal = input(true, "Show Reversals", group="REVERSAL SIGNALS")
showPdHlc = input(false, "Show P.D H/L/C", group="PREVIOUS DAY HIGH LOW CLOSE")
lineColor = input.color(color.yellow, "Line Colors", group="PREVIOUS DAY HIGH LOW CLOSE")
lineWidth = input.int(1, "Width Lines", group="PREVIOUS DAY HIGH LOW CLOSE")
lineStyle = input.string("Solid", "Line Style", )
labelSize = input.string("normal", "Label Text Size", )
labelColor = input.color(color.yellow, "Label Text Colors")
showEmas = input(false, "Show EMAs", group="EMA")
srcEma1 = input(close, "Source EMA 1")
lenEma1 = input.int(7, "Length EMA 1", 1)
srcEma2 = input(close, "Source EMA 2")
lenEma2 = input.int(21, "Length EMA 2", 1)
srcEma3 = input(close, "Source EMA 3")
lenEma3 = input.int(144, "Length EMA 3", 1)
showSwing = input(false, "Show Swing Points", group="SWING POINTS")
prdSwing = input.int(10, "Swing Point Period", 2, group="SWING POINTS")
colorPos = input(color.new(color.green, 50), "Positive Swing Color")
colorNeg = input(color.new(color.red, 50), "Negative Swing Color")
showDashboard = input(true, "Show Dashboard", group="TREND DASHBOARD")
locationDashboard = input.string("Middle Right", "Table Location", , group="TREND DASHBOARD")
tableTextColor = input(color.white, "Table Text Color", group="TREND DASHBOARD")
tableBgColor = input(#2A2A2A, "Table Background Color", group="TREND DASHBOARD")
sizeDashboard = input.string("Normal", "Table Size", , group="TREND DASHBOARD")
showRevBands = input.bool(true, "Show Reversal Bands", group="REVERSAL BANDS")
lenRevBands = input.int(30, "Length", group="REVERSAL BANDS")
// Fonksiyonlar
smoothrng(x, t, m) =>
wper = t * 2 - 1
avrng = ta.ema(math.abs(x - x ), t)
smoothrng = ta.ema(avrng, wper) * m
rngfilt(x, r) =>
rngfilt = x
rngfilt := x > nz(rngfilt ) ? x - r < nz(rngfilt ) ? nz(rngfilt ) : x - r : x + r > nz(rngfilt ) ? nz(rngfilt ) : x + r
percWidth(len, perc) => (ta.highest(len) - ta.lowest(len)) * perc / 100
securityNoRep(sym, res, src) => request.security(sym, res, src, barmerge.gaps_off, barmerge.lookahead_on)
swingPoints(prd) =>
pivHi = ta.pivothigh(prd, prd)
pivLo = ta.pivotlow (prd, prd)
last_pivHi = ta.valuewhen(pivHi, pivHi, 1)
last_pivLo = ta.valuewhen(pivLo, pivLo, 1)
hh = pivHi and pivHi > last_pivHi ? pivHi : na
lh = pivHi and pivHi < last_pivHi ? pivHi : na
hl = pivLo and pivLo > last_pivLo ? pivLo : na
ll = pivLo and pivLo < last_pivLo ? pivLo : na
f_chartTfInMinutes() =>
float _resInMinutes = timeframe.multiplier * (
timeframe.isseconds ? 1 :
timeframe.isminutes ? 1. :
timeframe.isdaily ? 60. * 24 :
timeframe.isweekly ? 60. * 24 * 7 :
timeframe.ismonthly ? 60. * 24 * 30.4375 : na)
f_kc(src, len, hassasiyet) =>
basis = ta.sma(src, len)
span = ta.atr(len)
wavetrend(src, chlLen, avgLen) =>
esa = ta.ema(src, chlLen)
d = ta.ema(math.abs(src - esa), chlLen)
ci = (src - esa) / (0.015 * d)
wt1 = ta.ema(ci, avgLen)
wt2 = ta.sma(wt1, 3)
f_top_fractal(src) => src < src and src < src and src > src and src > src
f_bot_fractal(src) => src > src and src > src and src < src and src < src
f_fractalize (src) => f_top_fractal(src) ? 1 : f_bot_fractal(src) ? -1 : 0
f_findDivs(src, topLimit, botLimit) =>
fractalTop = f_fractalize(src) > 0 and src >= topLimit ? src : na
fractalBot = f_fractalize(src) < 0 and src <= botLimit ? src : na
highPrev = ta.valuewhen(fractalTop, src , 0)
highPrice = ta.valuewhen(fractalTop, high , 0)
lowPrev = ta.valuewhen(fractalBot, src , 0)
lowPrice = ta.valuewhen(fractalBot, low , 0)
bearSignal = fractalTop and high > highPrice and src < highPrev
bullSignal = fractalBot and low < lowPrice and src > lowPrev
// Bileşen...
source = close
smrng1 = smoothrng(source, 27, 1.5)
smrng2 = smoothrng(source, 55, hassasiyet)
smrng = (smrng1 + smrng2) / 2
filt = rngfilt(source, smrng)
up = 0.0, up := filt > filt ? nz(up ) + 1 : filt < filt ? 0 : nz(up )
dn = 0.0, dn := filt < filt ? nz(dn ) + 1 : filt > filt ? 0 : nz(dn )
bullCond = bool(na), bullCond := source > filt and source > source and up > 0 or source > filt and source < source and up > 0
bearCond = bool(na), bearCond := source < filt and source < source and dn > 0 or source < filt and source > source and dn > 0
lastCond = 0, lastCond := bullCond ? 1 : bearCond ? -1 : lastCond
bull = bullCond and lastCond == -1
bear = bearCond and lastCond == 1
countBull = ta.barssince(bull)
countBear = ta.barssince(bear)
trigger = nz(countBull, bar_index) < nz(countBear, bar_index) ? 1 : 0
ribbon1 = ta.sma(close, smooth1)
ribbon2 = ta.sma(close, smooth2)
rsi = ta.rsi(close, 21)
rsiOb = rsi > 70 and rsi > ta.ema(rsi, 10)
rsiOs = rsi < 30 and rsi < ta.ema(rsi, 10)
dHigh = securityNoRep(syminfo.tickerid, "D", high )
dLow = securityNoRep(syminfo.tickerid, "D", low )
dClose = securityNoRep(syminfo.tickerid, "D", close )
ema1 = ta.ema(srcEma1, lenEma1)
ema2 = ta.ema(srcEma2, lenEma2)
ema3 = ta.ema(srcEma3, lenEma3)
= swingPoints(prdSwing)
ema = ta.ema(close, 144)
emaBull = close > ema
equal_tf(res) => str.tonumber(res) == f_chartTfInMinutes() and not timeframe.isseconds
higher_tf(res) => str.tonumber(res) > f_chartTfInMinutes() or timeframe.isseconds
too_small_tf(res) => (timeframe.isweekly and res=="1") or (timeframe.ismonthly and str.tonumber(res) < 10)
securityNoRep1(sym, res, src) =>
bool bull_ = na
bull_ := equal_tf(res) ? src : bull_
bull_ := higher_tf(res) ? request.security(sym, res, src, barmerge.gaps_off, barmerge.lookahead_on) : bull_
bull_array = request.security_lower_tf(syminfo.tickerid, higher_tf(res) ? str.tostring(f_chartTfInMinutes()) + (timeframe.isseconds ? "S" : "") : too_small_tf(res) ? (timeframe.isweekly ? "3" : "10") : res, src)
if array.size(bull_array) > 1 and not equal_tf(res) and not higher_tf(res)
bull_ := array.pop(bull_array)
array.clear(bull_array)
bull_
TF1Bull = securityNoRep1(syminfo.tickerid, "1" , emaBull)
TF3Bull = securityNoRep1(syminfo.tickerid, "3" , emaBull)
TF5Bull = securityNoRep1(syminfo.tickerid, "5" , emaBull)
TF15Bull = securityNoRep1(syminfo.tickerid, "15" , emaBull)
TF30Bull = securityNoRep1(syminfo.tickerid, "30" , emaBull)
TF60Bull = securityNoRep1(syminfo.tickerid, "60" , emaBull)
TF120Bull = securityNoRep1(syminfo.tickerid, "120" , emaBull)
TF240Bull = securityNoRep1(syminfo.tickerid, "240" , emaBull)
TF480Bull = securityNoRep1(syminfo.tickerid, "480" , emaBull)
TFDBull = securityNoRep1(syminfo.tickerid, "1440", emaBull)
= f_kc(close, lenRevBands, 3)
= f_kc(close, lenRevBands, 4)
= f_kc(close, lenRevBands, 5)
= f_kc(close, lenRevBands, 6)
= wavetrend(hlc3, 9, 12)
= f_findDivs(wt2, 15, -40)
= f_findDivs(wt2, 45, -65)
wtDivBull = wtDivBull1 or wtDivBull2
wtDivBear = wtDivBear1 or wtDivBear2
// Renkler
cyan = #00DBFF, cyan30 = color.new(cyan, 70)
pink = #E91E63, pink30 = color.new(pink, 70)
red = #FF5252, red30 = color.new(red , 70)
// Plotlar
off = percWidth(300, offsetSignal)
plotshape(showBuySell and bull ? low - off : na, "Buy Label" , shape.labelup , location.absolute, cyan, 0, "Buy" , color.white, size=size.normal)
plotshape(showBuySell and bear ? high + off : na, "Sell Label", shape.labeldown, location.absolute, pink, 0, "Sell", color.white, size=size.normal)
plotshape(ta.crossover(wt1, wt2) and wt2 <= -53, "Mild Buy" , shape.xcross, location.belowbar, cyan, size=size.tiny)
plotshape(ta.crossunder(wt1, wt2) and wt2 >= 53, "Mild Sell", shape.xcross, location.abovebar, pink, size=size.tiny)
plotshape(wtDivBull, "Divergence Buy ", shape.triangleup , location.belowbar, cyan, size=size.tiny)
plotshape(wtDivBear, "Divergence Sell", shape.triangledown, location.abovebar, pink, size=size.tiny)
barcolor(up > dn ? cyan : pink)
plotshape(showreversal and rsiOs, "Reversal Buy" , shape.diamond, location.belowbar, cyan30, size=size.tiny)
plotshape(showreversal and rsiOb, "Reversal Sell", shape.diamond, location.abovebar, pink30, size=size.tiny)
lStyle = lineStyle == "Solid" ? line.style_solid : lineStyle == "Dotted" ? line.style_dotted : line.style_dashed
lSize = labelSize == "small" ? size.small : labelSize == "normal" ? size.normal : size.large
dHighLine = showPdHlc ? line.new(bar_index, dHigh, bar_index + 1, dHigh , xloc.bar_index, extend.both, lineColor, lStyle, lineWidth) : na, line.delete(dHighLine )
dLowLine = showPdHlc ? line.new(bar_index, dLow , bar_index + 1, dLow , xloc.bar_index, extend.both, lineColor, lStyle, lineWidth) : na, line.delete(dLowLine )
dCloseLine = showPdHlc ? line.new(bar_index, dClose, bar_index + 1, dClose, xloc.bar_index, extend.both, lineColor, lStyle, lineWidth) : na, line.delete(dCloseLine )
dHighLabel = showPdHlc ? label.new(bar_index + 100, dHigh , "P.D.H", xloc.bar_index, yloc.price, #000000, label.style_none, labelColor, lSize) : na, label.delete(dHighLabel )
dLowLabel = showPdHlc ? label.new(bar_index + 100, dLow , "P.D.L", xloc.bar_index, yloc.price, #000000, label.style_none, labelColor, lSize) : na, label.delete(dLowLabel )
dCloseLabel = showPdHlc ? label.new(bar_index + 100, dClose, "P.D.C", xloc.bar_index, yloc.price, #000000, label.style_none, labelColor, lSize) : na, label.delete(dCloseLabel )
plot(showEmas ? ema1 : na, "EMA 1", color.green , 2)
plot(showEmas ? ema2 : na, "EMA 2", color.purple, 2)
plot(showEmas ? ema3 : na, "EMA 3", color.yellow, 2)
plotshape(showSwing ? hh : na, "", shape.triangledown, location.abovebar, color.new(color.green, 50), -prdSwing, "HH", colorPos, false)
plotshape(showSwing ? hl : na, "", shape.triangleup , location.belowbar, color.new(color.green, 50), -prdSwing, "HL", colorPos, false)
plotshape(showSwing ? lh : na, "", shape.triangledown, location.abovebar, color.new(color.red , 50), -prdSwing, "LH", colorNeg, false)
plotshape(showSwing ? ll : na, "", shape.triangleup , location.belowbar, color.new(color.red , 50), -prdSwing, "LL", colorNeg, false)
srcStop = close
atrBand = srcStop * (percentStop / 100)
atrStop = trigger ? srcStop - atrBand : srcStop + atrBand
lastTrade(src) => ta.valuewhen(bull or bear, src, 0)
entry_y = lastTrade(srcStop)
stop_y = lastTrade(atrStop)
tp1_y = (entry_y - lastTrade(atrStop)) * 1 + entry_y
tp2_y = (entry_y - lastTrade(atrStop)) * 2 + entry_y
tp3_y = (entry_y - lastTrade(atrStop)) * 3 + entry_y
labelTpSl(y, txt, color) =>
label labelTpSl = percentStop != 0 ? label.new(bar_index + 1, y, txt, xloc.bar_index, yloc.price, color, label.style_label_left, color.white, size.normal) : na
label.delete(labelTpSl )
labelTpSl(entry_y, "Entry: " + str.tostring(math.round_to_mintick(entry_y)), color.gray)
labelTpSl(stop_y , "Stop Loss: " + str.tostring(math.round_to_mintick(stop_y)), color.red)
labelTpSl(tp1_y, "Take Profit 1: " + str.tostring(math.round_to_mintick(tp1_y)), color.green)
labelTpSl(tp2_y, "Take Profit 2: " + str.tostring(math.round_to_mintick(tp2_y)), color.green)
labelTpSl(tp3_y, "Take Profit 3: " + str.tostring(math.round_to_mintick(tp3_y)), color.green)
lineTpSl(y, color) =>
line lineTpSl = percentStop != 0 ? line.new(bar_index - (trigger ? countBull : countBear) + 4, y, bar_index + 1, y, xloc.bar_index, extend.none, color, line.style_solid) : na
line.delete(lineTpSl )
lineTpSl(entry_y, color.gray)
lineTpSl(stop_y, color.red)
lineTpSl(tp1_y, color.green)
lineTpSl(tp2_y, color.green)
lineTpSl(tp3_y, color.green)
var dashboard_loc = locationDashboard == "Top Right" ? position.top_right : locationDashboard == "Middle Right" ? position.middle_right : locationDashboard == "Bottom Right" ? position.bottom_right : locationDashboard == "Top Center" ? position.top_center : locationDashboard == "Middle Center" ? position.middle_center : locationDashboard == "Bottom Center" ? position.bottom_center : locationDashboard == "Top Left" ? position.top_left : locationDashboard == "Middle Left" ? position.middle_left : position.bottom_left
var dashboard_size = sizeDashboard == "Large" ? size.large : sizeDashboard == "Normal" ? size.normal : sizeDashboard == "Small" ? size.small : size.tiny
var dashboard = showDashboard ? table.new(dashboard_loc, 2, 15, tableBgColor, #000000, 2, tableBgColor, 1) : na
dashboard_cell(column, row, txt, signal=false) => table.cell(dashboard, column, row, txt, 0, 0, signal ? #000000 : tableTextColor, text_size=dashboard_size)
dashboard_cell_bg(column, row, col) => table.cell_set_bgcolor(dashboard, column, row, col)
if barstate.islast and showDashboard
dashboard_cell(0, 0 , "EzAlgo")
dashboard_cell(0, 1 , "Current Position")
dashboard_cell(0, 2 , "Current Trend")
dashboard_cell(0, 3 , "Volume")
dashboard_cell(0, 4 , "Timeframe")
dashboard_cell(0, 5 , "1 min:")
dashboard_cell(0, 6 , "3 min:")
dashboard_cell(0, 7 , "5 min:")
dashboard_cell(0, 8 , "15 min:")
dashboard_cell(0, 9 , "30 min:")
dashboard_cell(0, 10, "1 H:")
dashboard_cell(0, 11, "2 H:")
dashboard_cell(0, 12, "4 H:")
dashboard_cell(0, 13, "8 H:")
dashboard_cell(0, 14, "Daily:")
dashboard_cell(1, 0 , "V.8.1")
dashboard_cell(1, 1 , trigger ? "Buy" : "Sell", true), dashboard_cell_bg(1, 1, trigger ? color.green : color.red)
dashboard_cell(1, 2 , emaBull ? "Bullish" : "Bearish", true), dashboard_cell_bg(1, 2, emaBull ? color.green : color.red)
dashboard_cell(1, 3 , str.tostring(volume))
dashboard_cell(1, 4 , "Trends")
dashboard_cell(1, 5 , TF1Bull ? "Bullish" : "Bearish", true), dashboard_cell_bg(1, 5 , TF1Bull ? color.green : color.red)
dashboard_cell(1, 6 , TF3Bull ? "Bullish" : "Bearish", true), dashboard_cell_bg(1, 6 , TF3Bull ? color.green : color.red)
dashboard_cell(1, 7 , TF5Bull ? "Bullish" : "Bearish", true), dashboard_cell_bg(1, 7 , TF5Bull ? color.green : color.red)
dashboard_cell(1, 8 , TF15Bull ? "Bullish" : "Bearish", true), dashboard_cell_bg(1, 8 , TF15Bull ? color.green : color.red)
dashboard_cell(1, 9 , TF30Bull ? "Bullish" : "Bearish", true), dashboard_cell_bg(1, 9 , TF30Bull ? color.green : color.red)
dashboard_cell(1, 10, TF60Bull ? "Bullish" : "Bearish", true), dashboard_cell_bg(1, 10, TF60Bull ? color.green : color.red)
dashboard_cell(1, 11, TF120Bull ? "Bullish" : "Bearish", true), dashboard_cell_bg(1, 11, TF120Bull ? color.green : color.red)
dashboard_cell(1, 12, TF240Bull ? "Bullish" : "Bearish", true), dashboard_cell_bg(1, 12, TF240Bull ? color.green : color.red)
dashboard_cell(1, 13, TF480Bull ? "Bullish" : "Bearish", true), dashboard_cell_bg(1, 13, TF480Bull ? color.green : color.red)
dashboard_cell(1, 14, TFDBull ? "Bullish" : "Bearish", true), dashboard_cell_bg(1, 14, TFDBull ? color.green : color.red)
plot(showRevBands ? upperKC1 : na, "Rev.Zone Upper 1", red30)
plot(showRevBands ? upperKC2 : na, "Rev.Zone Upper 2", red30)
plot(showRevBands ? upperKC3 : na, "Rev.Zone Upper 3", red30)
plot(showRevBands ? upperKC4 : na, "Rev.Zone Upper 4", red30)
plot(showRevBands ? lowerKC4 : na, "Rev.Zone Lower 4", cyan30)
plot(showRevBands ? lowerKC3 : na, "Rev.Zone Lower 3", cyan30)
plot(showRevBands ? lowerKC2 : na, "Rev.Zone Lower 2", cyan30)
plot(showRevBands ? lowerKC1 : na, "Rev.Zone Lower 1", cyan30)
fill(plot(showRibbon ? ribbon1 : na, "", na, editable=false), plot(showRibbon ? ribbon2 : na, "", na, editable=false), ribbon1 > ribbon2 ? cyan30 : pink30, "Ribbon Fill Color")
// Alarmlar
alert01 = ta.crossover(ribbon1, ribbon2)
alert02 = bull
alert03 = wtDivBull
alert04 = wtDivBear
alert05 = bull or bear
alert06 = ta.crossover(wt1, wt2) and wt2 <= -53
alert07 = ta.crossunder(wt1, wt2) and wt2 >= 53
alert08 = ta.crossunder(ribbon1, ribbon2)
alert09 = rsiOb or rsiOs
alert10 = bear
alert11 = ta.cross(ribbon1, ribbon2)
alerts(sym) =>
if alert02 or alert03 or alert04 or alert06 or alert07 or alert10
alert_text = alert02 ? "Buy Signal EzAlgo" : alert03 ? "Strong Buy Signal EzAlgo" : alert04 ? "Strong Sell Signal EzAlgo" : alert06 ? "Mild Buy Signal EzAlgo" : alert07 ? "Mild Sell Signal EzAlgo" : "Sell Signal EzAlgo"
alert(alert_text, alert.freq_once_per_bar_close)
alerts(syminfo.tickerid)
alertcondition(alert01, "Blue Trend Ribbon Alert", "Blue Trend Ribbon, TimeFrame={{interval}}")
alertcondition(alert02, "Buy Signal", "Buy Signal EzAlgo")
alertcondition(alert03, "Divergence Buy Alert", "Strong Buy Signal EzAlgo, TimeFrame={{interval}}")
alertcondition(alert04, "Divergence Sell Alert", "Strong Sell Signal EzAlgo, TimeFrame={{interval}}")
alertcondition(alert05, "Either Buy or Sell Signal", "EzAlgo Signal")
alertcondition(alert06, "Mild Buy Alert", "Mild Buy Signal EzAlgo, TimeFrame={{interval}}")
alertcondition(alert07, "Mild Sell Alert", "Mild Sell Signal EzAlgo, TimeFrame={{interval}}")
alertcondition(alert08, "Red Trend Ribbon Alert", "Red Trend Ribbon, TimeFrame={{interval}}")
alertcondition(alert09, "Reversal Signal", "Reversal Signal")
alertcondition(alert10, "Sell Signal", "Sell Signal EzAlgo")
alertcondition(alert11, "Trend Ribbon Color Change Alert", "Trend Ribbon Color Change, TimeFrame={{interval}}")

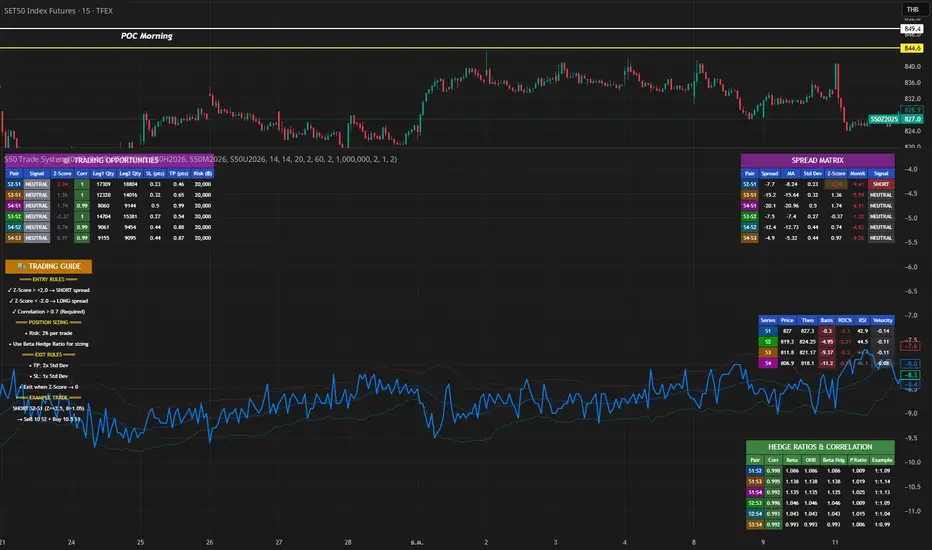
S50 Complete Hedge & Trade SystemTFEX:S501!
คู่มือการเทรด CALENDAR SPREAD
1. กลยุทธ์หลัก: MEAN REVERSION SPREAD TRADING
หลักการ:
- Spread ระหว่าง series จะมีค่าเฉลี่ย (Mean) และแกว่งไปมารอบๆ ค่าเฉลี่ยนี้
- เมื่อ Spread เบี่ยงเบนไปจาก Mean มากเกินไป จะกลับมาหาค่าเฉลี่ย (Mean Reversion)
2. INDICATORS ที่ใช้
A. Z-Score
Z-Score = (Spread ปัจจุบัน - Spread เฉลี่ย) / Standard Deviation
การตีความ:
- Z > +2.0 → Spread แพงเกินไป → SHORT spread
- Z < -2.0 → Spread ถูกเกินไป → LONG spread
- Z ≈ 0 → Spread อยู่ที่ค่าเฉลี่ย → EXIT
B. Correlation
Correlation > 0.9 = ดีมาก (เคลื่อนไหวพร้อมกัน 90%+)
Correlation > 0.7 = ดี (ใช้ได้)
Correlation < 0.7 = ไม่แนะนำ (Hedge ไม่มีประสิทธิภาพ)
C. Beta & Hedge Ratio
Beta = Cov(S1, S2) / Var(S2)→ บอกว่า S1 เคลื่อนไหวเท่าไหร่เมื่อ S2 เคลื่อนไหว 1 หน่วย
Hedge Ratio = Beta→ ใช้คำนวณจำนวน contract ที่ต้อง hedge
3. วิธีการเทรด SPREAD (ทีละขั้นตอน)
STEP 1: หาโอกาส
เงื่อนไข Entry:
1. |Z-Score| >= 2.0
2. Correlation > 0.7
3. Signal = "SHORT SPREAD" หรือ "LONG SPREAD"
STEP 2: คำนวณ Position Size
ตัวอย่าง:
- Account Size = 1,000,000 บาท
- Risk Per Trade = 2% = 20,000 บาท
- Spread Std Dev = 15 จุด
- Stop Loss = 1.0x Std Dev = 15 จุด
- S50 มูลค่า = 5 บาท/จุด
Position Size = Risk Amount / (SL Distance × Point Value)
= 20,000 / (15 × 5)
= 20,000 / 75
= 266 contracts (ปัดเป็น 26 สัญญา)
STEP 3: คำนวณ Hedge Ratio
สมมติ: Beta (S1:S2) = 1.05
ถ้าเทรด SHORT S2-S1 spread:
- Sell S2: 26 contracts
- Buy S1: 26 × 1.05 = 27.3 → ปัดเป็น 27 contracts
Portfolio Delta ≈ 0 (Market Neutral)
4. ตัวอย่างการเทรดจริง
SCENARIO A: SHORT SPREAD (Z-Score = +2.5)
สถานการณ์:
- S2-S1 Spread = 50 จุด
- Spread MA = 35 จุด
- Spread Std Dev = 6 จุด
- Z-Score = (50-35)/6 = +2.5 ⚠️ แพงเกินไป
- Correlation = 0.92 ✅
- Beta = 1.05
TRADE PLAN:
1. SELL S2: 10 contracts @ 1,200
2. BUY S1: 10 × 1.05 = 10.5 → 11 contracts @ 1,150
Initial Spread = 50 จุด
Take Profit (TP):
- Target Spread = MA = 35 จุด
- TP Distance = 50 - 35 = 15 จุด
- Profit = 15 × 5 = 75 บาท/spread
- Total Profit = 75 × 10 = 750 บาท
Stop Loss (SL):
- SL Spread = MA + (1.5 × Std Dev) = 35 + 9 = 44 จุด
- SL Distance = 50 - 44 = 6 จุด (ผิดพลาด - ควรเป็น 50 + 6 = 56)
- Loss = 6 × 5 × 10 = 300 บาท
Risk:Reward = 300:750 = 1:2.5
SCENARIO B: LONG SPREAD (Z-Score = -2.3)
สถานการณ์:
- S3-S2 Spread = 20 จุด
- Spread MA = 35 จุด
- Spread Std Dev = 6.5 จุด
- Z-Score = (20-35)/6.5 = -2.3 ⚠️ ถูกเกินไป
- Correlation = 0.88 ✅
- Beta = 1.03
TRADE PLAN:
1. BUY S3: 10 contracts @ 1,230
2. SELL S2: 10 × 1.03 = 10.3 → 10 contracts @ 1,210
Initial Spread = 20 จุด
Take Profit:
- Target Spread = 35 จุด
- Profit = (35-20) × 5 × 10 = 750 บาท
Stop Loss:
- SL Spread = MA - (1.5 × Std Dev) = 35 - 9.75 = 25.25 จุด
- SL = 20 - (20-25.25) = 14 จุด
- Loss = 6 × 5 × 10 = 300 บาท
5. RISK MANAGEMENT
A. Position Sizing Rules
1. อย่าเสี่ยงเกิน 2-3% ต่อการเทรด
2. ใช้ Beta Hedge Ratio เสมอ
3. ตรวจสอบ Margin requirement
B. Stop Loss Strategy
วิธีที่ 1: Fixed Std Dev
- SL = Entry ± (1.0-1.5x Std Dev)
วิธีที่ 2: ATR-based
- SL = Entry ± (1.5x ATR)
วิธีที่ 3: Time-based
- ปิดภายใน 3-5 วัน ถ้าไม่ได้กำไร
C. Take Profit Strategy
วิธีที่ 1: Target MA
- TP เมื่อ Spread กลับมาที่ MA
วิธีที่ 2: Partial Profit
- ปิด 50% เมื่อได้ 1x Std Dev
- ปิดอีก 50% เมื่อ Z-Score = 0
วิธีที่ 3: Trailing Stop
- Trailing SL = 0.5x Std Dev
6. สูตรคำนวณสำคัญ
1. Position Size
position_size = (account_size × risk_pct) / (sl_distance × point_value)
2. Hedge Contracts
hedge_contracts = position_size × beta
3. Profit/Loss Calculation
pnl = (exit_spread - entry_spread) × contracts × point_value
4. Risk:Reward Ratio
risk = sl_distance × contracts × point_value
reward = tp_distance × contracts × point_value
rr_ratio = reward / risk // ควร >= 2:1
5. Spread Value
spread_value = price_far - price_near
7. CHECKLIST ก่อนเทรด
☐ Z-Score >= ±2.0
☐ Correlation > 0.7
☐ Beta Hedge Ratio คำนวณแล้ว
☐ Position Size ไม่เกิน 2-3% risk
☐ TP/SL กำหนดชัดเจน
☐ Risk:Reward >= 2:1
☐ Margin เพียงพอ
☐ ตรวจสอบ Expiry Date ทั้ง 2 series
8. เทคนิคขั้นสูง
A. Calendar Roll Strategy
เมื่อ Near series ใกล้หมดอายุ:
1. ปิด Near leg
2. เปิด Next series leg ใหม่
3. รักษา Spread position ต่อไป
B. Butterfly Spread
ใช้ 3 series พร้อมกัน:
- Buy S1
- Sell 2×S2
- Buy S3
เหมาะกับตลาดไซด์เวย์
C. Dynamic Hedging
ปรับ Hedge Ratio ตาม:
- Beta ที่เปลี่ยนแปลง
- Volatility
- Time to Expiry
C2 Closure Alert From Key Level (FVG & Swings)This indicator is designed based on the C2 Closure Trader, specifically focusing on identifying high-probability C2 Candle Closures and Key Level Sweeps. It automates the detection of "Candle 2" setups where price sweeps a key level (Swing High/Low or FVG) and closes back inside, signaling a potential reversal or continuation.
Key Features :
Advanced C2 Detection:
Detects when the current candle (C2) sweeps the previous candle (C1).
Deep Context Check: It validates the setup by checking if C1 was interacting with a Key Level (Swing High/Low or FVG) OR if C1 just created a Fresh FVG.
Logic: Ensures no valid setup is missed, even if the sweep happens instantly after FVG creation.
Straight Sweep Lines (Visuals):
Draws a clean, straight horizontal line from the C1 High/Low to the C2 candle.
Helps you visualize exactly which level was swept.
Customization: You can change the line color and width from settings.
Smart FVG & Swing Levels:
Automatically plots Active Bullish/Bearish FVGs and Swing Highs/Lows.
Mitigation Logic: Levels remain active until a valid signal is generated or price invalidates them. Once used, they turn gray (mitigated) to keep the chart clean.
Mechanical Settings Menu:
Fully customizable inputs organized into clean groups (Algorithm, Signal, Visuals, Limits).
Label Size Control: Adjust the signal label size (Tiny to Huge) to fit your screen.
Transparent Labels: Clean "C2" text without background boxes for a professional look.
Robust Alert System:
Three specific alert options added for automation:
Bullish C2 Closure: Fires only on valid Long setups.
Bearish C2 Closure: Fires only on valid Short setups.
Any C2 Close: Fires on any valid setup.
Note: Alerts are strictly set to trigger Once Per Bar Close to avoid false signals during running candles.
How to Use:
Add to Chart: Apply the indicator to your timeframe (Recommended: 15m, 1H, 4H for narrative).
Identify Signals: Look for the "C2" text label.
Green C2: Bullish Setup (Sweep of Low + Close Up).
Red C2: Bearish Setup (Sweep of High + Close Down).
Validation: The indicator automatically checks if the sweep occurred at a valid Swing Point or FVG. If you see the signal, the context is valid.
Entry: Use the close of the C2 candle as your confirmation to frame a trade or look for lower timeframe entries.
Settings Guide:
Algorithm Sensitivity: Adjust Pivot Left/Right Bars to define how strict the Swing Highs/Lows should be.
Signal Appearance: Change the text (e.g., "Entry") or adjust the Label Size.
Active/History Limits: Control how many active or old (mitigated) lines/boxes stay on the chart to manage clutter.
Visuals: Customize colors for Bull/Bear FVGs, Highs/Lows, and Sweep Lines to match your chart theme.
Disclaimer: This tool is for educational and analytical purposes only. Always manage your risk properly.
