Force DashboardScalping Dashboard - Complete User Guide
Overview
This scalping system consists of two complementary TradingView indicators designed for intraday trading with no overnight holds:
Force Dashboard - Single-row table showing real-time market bias and entry signals
Large Order Detection - Visual diamonds showing institutional order flow
Together, they provide a complete at-a-glance view of market conditions optimized for quick entries and exits.
Recommended Timeframes
Primary Scalping Timeframes
1-minute chart: Ultra-fast scalps (30 seconds - 3 minutes hold time)
2-minute chart: Quick scalps (2-5 minutes hold time)
5-minute chart: Standard scalps (5-15 minutes hold time)
Best Practices
Use 1-2 minute for highly liquid instruments (ES, NQ, major forex pairs)
Use 5-minute for less liquid markets or if you prefer fewer signals
Never hold past the last hour of trading to avoid overnight risk
Set hard stop times (e.g., exit all positions by 3:45 PM EST)
Dashboard Components Explained
Core Indicators (Circles ●)
MACD (5/13/5)
Green ● = Bullish momentum (MACD histogram positive)
Red ● = Bearish momentum (MACD histogram negative)
Gray ● = No clear momentum
Use: Confirms trend direction and momentum shifts
EMA (9/20/50)
Green ● = Price > EMA9 > EMA20 (uptrend)
Red ● = Price < EMA9 < EMA20 (downtrend)
Gray ● = Choppy/sideways
Use: Identifies the immediate micro-trend
Stoch (5-period Stochastic)
Green ● = Oversold (<20) - potential reversal up
Red ● = Overbought (>80) - potential reversal down
Gray ● = Neutral zone (20-80)
Use: Spots reversal opportunities at extremes
RSI (7-period)
Green ● = Oversold (<30)
Red ● = Overbought (>70)
Gray ● = Neutral
Use: Confirms overbought/oversold conditions
CVD (Cumulative Volume Delta)
Green ● = CVD above its moving average (buying pressure)
Red ● = CVD below its moving average (selling pressure)
Gray ● = Neutral
Use: Shows overall buying vs selling pressure
ΔCVD (Delta CVD - Rate of Change)
Green ● = CVD accelerating upward (buying acceleration)
Red ● = CVD accelerating downward (selling acceleration)
Gray ● = No acceleration
Use: Detects momentum shifts in order flow
Imbal (Order Flow Imbalance)
Green ● = Buy pressure >2x sell pressure
Red ● = Sell pressure >2x buy pressure
Gray ● = Balanced
Use: Identifies extreme one-sided order flow
Vol (Volume Strength)
Green ● = Volume >1.5x average (strong interest)
Red ● = Volume <0.7x average (low interest)
Gray ● = Normal volume
Yellow background = Volume surge (>2x average) - BIG MOVE ALERT
Use: Confirms conviction behind price moves
Tape (Tape Speed)
Green ● = Fast order flow (>1.3x normal)
Red ● = Slow order flow (<0.7x normal)
Gray ● = Normal speed
Yellow background = Very fast tape (>1.5x) - RAPID EXECUTION ALERT
Use: Measures urgency and speed of orders
Key Levels
Support (Supp)
Shows the nearest high-volume support level below current price
Bright Green background = Price is AT support (within 0.3%) - BOUNCE ZONE
Green background = Price above support (healthy)
Red background = Price below support (broken support, now resistance)
Resistance (Res)
Shows the nearest high-volume resistance level above current price
Bright Orange background = Price is AT resistance (within 0.3%) - REJECTION ZONE
Red background = Price below resistance (facing overhead supply)
Green background = Price above resistance (breakout)
These levels update automatically every 3 bars based on volume profile
Entry Signal Components
Score
Displays format: "6L" (6 long indicators) or "4S" (4 short indicators)
Bright Green = 6-7 indicators aligned for long
Light Green = 5 indicators aligned for long
Yellow = 4 indicators aligned (weaker setup)
Gray = No alignment
Red/Orange colors = Same scale for short setups
Score of 5+ indicates high-probability setup
SCALP (Main Entry Signal)
BRIGHT GREEN "LONG" = High-quality long scalp (Score 5+)
Green "LONG" = Decent long scalp (Score 4)
BRIGHT ORANGE "SHORT" = High-quality short scalp (Score 5+)
Red "SHORT" = Decent short scalp (Score 4)
Gray "WAIT" = No clear setup - STAY OUT
Entry Strategies
Strategy 1: High-Probability Scalps (Conservative)
When to Enter:
SCALP column shows BRIGHT GREEN "LONG" or BRIGHT ORANGE "SHORT"
Score is 5 or higher
Vol or Tape has yellow background (volume surge)
Example Long Setup:
SCALP = BRIGHT GREEN "LONG"
Score = 6L
Vol = Yellow background
Price AT Support (bright green Supp cell)
EMA, MACD, CVD, ΔCVD, Imbal all green
Entry: Enter immediately on next candle
Target: 0.5-1% move or resistance level
Stop: Below support or -0.3%
Hold Time: 2-10 minutes
Strategy 2: Momentum Scalps (Aggressive)
When to Enter:
Tape has yellow background (fast tape)
Vol has yellow background (volume surge)
ΔCVD is green (for longs) or red (for shorts)
Imbal shows strong imbalance in your direction
Score is 4+
Example Short Setup:
Tape & Vol = Yellow backgrounds
ΔCVD = Red, Imbal = Red
Price AT Resistance (bright orange)
Score = 5S
Entry: Enter immediately
Target: Quick 0.3-0.7% move
Stop: Tight -0.2%
Hold Time: 1-5 minutes
Strategy 3: Reversal Scalps (Mean Reversion)
When to Enter:
Stoch shows oversold (green) or overbought (red)
RSI confirms the extreme
Price is AT Support (for longs) or AT Resistance (for shorts)
ΔCVD and Imbal start reversing direction
Score is 4+
Example Long Setup:
Stoch = Green (oversold)
RSI = Green (oversold)
Supp = Bright green (at support)
ΔCVD turns green
Imbal turns green
Score = 4L or 5L
Entry: Wait for confirmation candle
Target: Move back to EMA9 or mid-range
Stop: Below the low
Hold Time: 3-8 minutes
Large Order Detection Usage
Diamond Signals
Green diamonds below bar = Large buy orders (institutional buying)
Red diamonds above bar = Large sell orders (institutional selling)
Size matters: Larger diamonds = larger order flow
How to Use with Dashboard
Confirmation Entries
Dashboard shows "LONG" signal
Green diamond appears
Enter immediately - institutions are buying
Divergence Alerts (CAUTION)
Dashboard shows "LONG" signal
RED diamond appears (institutions selling)
DO NOT ENTER - conflicting order flow
Cluster Patterns
Multiple green diamonds in row = Strong accumulation, stay long
Multiple red diamonds in row = Strong distribution, stay short
Alternating colors = Chop, avoid trading
Risk Management Rules
Position Sizing
Risk 0.5-1% of account per scalp
Maximum 3 concurrent positions
Reduce size after 2 consecutive losses
Stop Loss Guidelines
Tight stops: 0.2-0.3% for 1-2 min charts
Standard stops: 0.3-0.5% for 5 min charts
Always use stop loss - no exceptions
Place stops below support (longs) or above resistance (shorts)
Take Profit Targets
Target 1: 0.3-0.5% (take 50% off)
Target 2: 0.7-1% (take remaining 50%)
Move stop to breakeven after Target 1 hit
Trail stop if Score remains high
Time-Based Exits
Exit immediately if:
SCALP changes from LONG/SHORT to WAIT
Score drops below 3
Large diamond appears in opposite direction
Maximum hold time: 15 minutes (even if profitable)
Hard exit time: 30 minutes before market close
Trading Sessions
Best Times to Scalp
High-Liquidity Sessions
9:30-11:00 AM EST (Market open, highest volume)
2:00-3:30 PM EST (Afternoon session, good moves)
Avoid
11:30 AM-1:30 PM EST (Lunch, low volume)
Last 30 minutes (unpredictable, don't initiate new trades)
News releases (wait 5 minutes for volatility to settle)
Common Patterns & Setups
The Perfect Storm (Highest Probability)
Score = 6L or 7L
SCALP = BRIGHT GREEN
Vol + Tape = Yellow backgrounds
Green diamond appears
Price AT Support
Win rate: ~70-80%
The Fade Setup (Counter-Trend)
Price hits resistance (bright orange)
Stoch + RSI overbought (red)
Red diamond appears
CVD starts turning red
SCALP shows "SHORT"
Win rate: ~60-70%
The Breakout Continuation
Price breaks resistance (Res turns green)
EMA, MACD green
Vol surge (yellow)
Multiple green diamonds
SCALP = "LONG"
Win rate: ~65-75%
Warning Signs - DO NOT TRADE
Red Flags
❌ SCALP shows "WAIT"
❌ Score below 3
❌ Vol and Tape both gray (no volume)
❌ Conflicting signals (dashboard says LONG but red diamonds appearing)
❌ Alternating green/red circles (choppy market)
❌ Support and Resistance very close together (tight range)
Market Conditions to Avoid
Low volume periods
Major news releases (first 5 minutes after)
First 2 minutes after market open
Wide spreads
Consecutive losing trades (take a break after 2 losses)
Quick Reference Checklist
Before Taking ANY Trade:
☑ SCALP shows LONG or SHORT (not WAIT)
☑ Score is 4 or higher
☑ Vol or Tape shows activity
☑ No conflicting diamond signals
☑ Stop loss level identified
☑ Target profit level identified
☑ Not in restricted time periods
After Entering:
☑ Set stop loss immediately
☑ Set profit targets
☑ Watch SCALP column - exit if changes to WAIT
☑ Watch for opposite-colored diamonds
☑ Move stop to breakeven after first target
☑ Exit all by market close
Advanced Tips
Scalping Psychology
Be patient: Wait for Score 5+ setups
Be decisive: When signal appears, act immediately
Be disciplined: Follow your stop loss always
Be flexible: Exit quickly if dashboard reverses
Optimization
Backtest on your specific instrument
Adjust RSI/Stoch levels for your market
Fine-tune volume thresholds
Keep a trade journal to track which setups work best
Multi-Timeframe Confirmation
Use 5-min dashboard as "trend filter"
Take 1-min trades only in direction of 5-min SCALP signal
Increases win rate by ~10-15%
Troubleshooting
Q: Dashboard shows WAIT most of the time
Normal - scalping is about patience. Quality > Quantity
3-8 good setups per day is excellent
Q: Too many false signals
Increase minimum Score requirement to 5 or 6
Only trade with volume surge (yellow backgrounds)
Add large order detection confirmation
Q: Signals too slow
You may be on too high a timeframe
Try 1-minute chart for faster signals
Ensure real-time data feed is active
Q: Support/Resistance not updating
Normal - updates every 3 bars
If completely stuck, remove and re-add indicator
Summary
This scalping system works best when:
✅ Multiple indicators align (Score 5+)
✅ Volume and tape speed confirm the move
✅ Order flow (diamonds) confirms direction
✅ Price is at key levels (support/resistance)
✅ You manage risk strictly
✅ You exit before market close
The golden rule: When SCALP says WAIT, you WAIT. Discipline beats frequency.
Cerca negli script per "entry"

Opening Range Breakout with Multi-Timeframe Liquidity]═══════════════════════════════════════
OPENING RANGE BREAKOUT WITH MULTI-TIMEFRAME LIQUIDITY
═══════════════════════════════════════
A professional Opening Range Breakout (ORB) indicator enhanced with multi-timeframe liquidity detection, trading session visualization, volume analysis, and trend confirmation tools. Designed for intraday trading with comprehensive alert system.
───────────────────────────────────────
WHAT THIS INDICATOR DOES
───────────────────────────────────────
This indicator combines multiple trading concepts:
- Opening Range Breakout (ORB) - Customizable time period detection with automatic high/low identification
- Multi-Timeframe Liquidity - HTF (Higher Timeframe) and LTF (Lower Timeframe) key level detection
- Trading Sessions - Tokyo, London, New York, and Sydney session visualization
- Volume Analysis - Volume spike detection and strength measurement
- Multi-Timeframe Confirmation - Trend bias from higher timeframes
- EMA Integration - Trend filter and dynamic support/resistance
- Smart Alerts - Quality-filtered breakout notifications
───────────────────────────────────────
HOW IT WORKS
───────────────────────────────────────
OPENING RANGE BREAKOUT (ORB):
Concept:
The Opening Range is a period at the start of a trading session where price establishes an initial high and low. Breakouts beyond this range often indicate the direction of the day's trend.
Detection Method:
- Default: 15-minute opening range (configurable)
- Custom Range: Set specific session times with timezone support
- Automatically identifies ORH (Opening Range High) and ORL (Opening Range Low)
- Tracks ORB mid-point for reference
Range Establishment:
1. Session starts (or custom time begins)
2. Tracks highest high and lowest low during the period
3. Range confirmed at end of opening period
4. Levels extend throughout the session
Breakout Detection:
- Bullish Breakout: Close above ORH
- Bearish Breakout: Close below ORL
- Mid-point acts as bias indicator
Visual Display:
- Shaded box during range formation
- Horizontal lines for ORH, ORL, and mid-point
- Labels showing level values
- Color-coded fills based on selected method
Fill Color Methods:
1. Session Comparison:
- Green: Current OR mid > Previous OR mid
- Red: Current OR mid < Previous OR mid
- Gray: Equal or first session
- Shows day-over-day momentum
2. Breakout Direction (Recommended):
- Green: Price currently above ORH (bullish breakout)
- Red: Price currently below ORL (bearish breakout)
- Gray: Price inside range (no breakout)
- Real-time breakout status
MULTI-TIMEFRAME LIQUIDITY:
Two-Tier System for comprehensive level identification:
HTF (Higher Timeframe) Key Liquidity:
- Default: 4H timeframe (configurable to Daily, Weekly)
- Identifies major institutional levels
- Uses pivot detection with adjustable parameters
- Suitable for swing highs/lows where large orders rest
LTF (Lower Timeframe) Key Liquidity:
- Default: 1H timeframe (configurable)
- Provides precision entry/exit levels
- Finer granularity for intraday trading
- Captures minor swing points
Calculation Method:
- Pivot high/low detection algorithm
- Configurable left bars (lookback) and right bars (confirmation)
- Timeframe multiplier for accurate multi-timeframe detection
- Automatic level extension
Mitigation System:
- Tracks when levels are swept (broken)
- Configurable mitigation type: Wick or Close-based
- Option to remove or show mitigated levels
- Display limit prevents chart clutter
Asset-Specific Optimization:
The indicator includes quick reference settings for different assets:
- Major Forex (EUR/USD, GBP/USD): Default settings optimal
- Crypto (BTC/ETH): Left=12, Right=4, Display=7
- Gold: HTF=1D, Left=20
TRADING SESSIONS:
Four Major Sessions with Full Customization:
Tokyo Session:
- Default: 04:00-13:00 UTC+4
- Asian trading hours
- Often sets daily range
London Session:
- Default: 11:00-20:00 UTC+4
- Highest liquidity period
- Major institutional activity
New York Session:
- Default: 16:00-01:00 UTC+4
- US market hours
- High-impact news events
Sydney Session:
- Default: 01:00-10:00 UTC+4
- Earliest Asian activity
- Lower volatility
Session Features:
- Shaded background boxes
- Session name labels
- Optional open/close lines
- Session high/low tracking with colored lines
- Each session has independent color settings
- Fully customizable times and timezones
VOLUME ANALYSIS:
Volume-Based Trade Confirmation:
Volume MA:
- Configurable period (default: 20)
- Establishes average volume baseline
- Used for spike detection
Volume Spike Detection:
- Identifies when volume exceeds MA * multiplier
- Default: 1.5x average volume
- Confirms breakout strength
Volume Strength Measurement:
- Calculates current volume as percentage of average
- Shows relative volume intensity
- Used in alert quality filtering
High Volume Bars:
- Identifies bars above 50th percentile
- Additional confirmation layer
- Indicates institutional participation
MULTI-TIMEFRAME CONFIRMATION:
Trend Bias from Higher Timeframes:
HTF 1 (Trend):
- Default: 1H timeframe
- Uses EMA to determine intermediate trend
- Compares current timeframe EMA to HTF EMA
HTF 2 (Bias):
- Default: 4H timeframe
- Uses 50 EMA for longer-term bias
- Confirms overall market direction
Bias Classifications:
- Bullish Bias: HTF close > HTF 50 EMA AND Current EMA > HTF1 EMA
- Bearish Bias: HTF close < HTF 50 EMA AND Current EMA < HTF1 EMA
- Neutral Bias: Mixed signals between timeframes
EMA Stack Analysis:
- Compares EMA alignment across timeframes
- +1: Bullish stack (lower TF EMA > higher TF EMA)
- -1: Bearish stack (lower TF EMA < higher TF EMA)
- 0: Neutral/crossed
Usage:
- Filters false breakouts
- Confirms trend direction
- Improves trade quality
EMA INTEGRATION:
Dynamic EMA for Trend Reference:
Features:
- Configurable period (default: 20)
- Customizable color and width
- Acts as dynamic support/resistance
- Trend filter for ORB trades
Application:
- Above EMA: Favor long breakouts
- Below EMA: Favor short breakouts
- EMA cross: Potential trend change
- Distance from EMA: Momentum gauge
SMART ALERT SYSTEM:
Quality-Filtered Breakout Notifications:
Alert Types:
1. Standard ORB Breakout
2. High Quality ORB Breakout
Quality Criteria:
- Volume Confirmation: Volume > 1.2x average
- MTF Confirmation: Bias aligned with breakout direction
Standard Alert:
- Basic breakout detection
- Price crosses ORH or ORL
- Icon: 🚀 (bullish) or 🔻 (bearish)
High Quality Alert:
- Both volume AND MTF confirmed
- Stronger probability setup
- Icon: 🚀⭐ (bullish) or 🔻⭐ (bearish)
Alert Information Includes:
- Alert quality rating
- Breakout level and current price
- Volume strength percentage (if enabled)
- MTF bias status (if enabled)
- Recommended action
One Alert Per Bar:
- Prevents alert spam
- Uses flag system to track sent alerts
- Resets on new ORB session
───────────────────────────────────────
HOW TO USE
───────────────────────────────────────
OPENING RANGE SETUP:
Basic Configuration:
1. Select time period for opening range (default: 15 minutes)
2. Choose fill color method (Breakout Direction recommended)
3. Enable historical data display if needed
Custom Range (Advanced):
1. Enable Custom Range toggle
2. Set specific session time (e.g., 0930-0945)
3. Select appropriate timezone
4. Useful for specific market opens (NYSE, LSE, etc.)
LIQUIDITY LEVELS SETUP:
Quick Configuration by Asset:
- Forex: Use default settings (Left=15, Right=5)
- Crypto: Set Left=12, Right=4, Display=7
- Gold: Set HTF=1D, Left=20
HTF Liquidity:
- Purpose: Major support/resistance levels
- Recommended: 4H for day trading, 1D for swing trading
- Use as profit targets or reversal zones
LTF Liquidity:
- Purpose: Entry/exit refinement
- Recommended: 1H for day trading, 4H for swing trading
- Use for position management
Mitigation Settings:
- Wick-based: More sensitive (default)
- Close-based: More conservative
- Remove or Show mitigated levels based on preference
TRADING SESSIONS SETUP:
Enable/Disable Sessions:
- Master toggle for all sessions
- Individual session controls
- Show/hide session names
Session High/Low Lines:
- Enable to see session extremes
- Each session has custom colors
- Useful for range trading
Customization:
- Adjust session times for your broker
- Set timezone to match your location
- Customize colors for visibility
VOLUME ANALYSIS SETUP:
Enable Volume Analysis:
1. Toggle on Volume Analysis
2. Set MA length (20 recommended)
3. Adjust spike multiplier (1.5 typical)
Usage:
- Confirm breakouts with volume
- Identify climactic moves
- Filter false signals
MULTI-TIMEFRAME SETUP:
HTF Selection:
- HTF 1 (Trend): 1H for day trading, 4H for swing
- HTF 2 (Bias): 4H for day trading, 1D for swing
Interpretation:
- Trade only with bias alignment
- Neutral bias: Be cautious
- Bias changes: Potential reversals
EMA SETUP:
Configuration:
- Period: 20 for responsive, 50 for smoother
- Color: Choose contrasting color
- Width: 1-2 for visibility
Usage:
- Filter trades: Long above, Short below
- Dynamic support/resistance reference
- Trend confirmation
ALERT SETUP:
TradingView Alert Creation:
1. Enable alerts in indicator settings
2. Enable ORB Breakout Alerts
3. Right-click chart → Add Alert
4. Select this indicator
5. Choose "Any alert() function call"
6. Configure delivery method (mobile, email, webhook)
Alert Filtering:
- All alerts include quality rating
- High Quality alerts = Volume + MTF confirmed
- Standard alerts = Basic breakout only
───────────────────────────────────────
TRADING STRATEGIES
───────────────────────────────────────
CLASSIC ORB STRATEGY:
Setup:
1. Wait for opening range to complete
2. Price breaks and closes above ORH or below ORL
3. Volume > average (if enabled)
4. MTF bias aligned (if enabled)
Entry:
- Bullish: Buy on break above ORH
- Bearish: Sell on break below ORL
- Consider retest entries for better risk/reward
Stop Loss:
- Bullish: Below ORL or range mid-point
- Bearish: Above ORH or range mid-point
- Adjust based on volatility
Targets:
- Initial: Range width extension (ORH + range width)
- Secondary: HTF liquidity levels
- Final: Session high/low or major support/resistance
ORB + LIQUIDITY CONFLUENCE:
Enhanced Setup:
1. Opening range established
2. HTF liquidity level near or beyond ORH/ORL
3. Breakout occurs with volume
4. Price targets the liquidity level
Entry:
- Enter on ORB breakout
- Target the HTF liquidity level
- Use LTF liquidity for position management
Management:
- Partial profits at ORB + range width
- Move stop to breakeven at LTF liquidity
- Final exit at HTF liquidity sweep
ORB REJECTION STRATEGY (Counter-Trend):
Setup:
1. Price breaks above ORH or below ORL
2. Weak volume (below average)
3. MTF bias opposite to breakout
4. Price closes back inside range
Entry:
- Failed bullish break: Short below ORH
- Failed bearish break: Long above ORL
Stop Loss:
- Beyond the failed breakout level
- Or beyond session extreme
Target:
- Opposite end of opening range
- Range mid-point for partial profit
SESSION-BASED ORB TRADING:
Tokyo Session:
- Typically narrower ranges
- Good for range trading
- Wait for London open breakout
London Session:
- Highest volume and volatility
- Strong ORB setups
- Major liquidity sweeps common
New York Session:
- Strong trending moves
- News-driven volatility
- Good for momentum trades
Sydney Session:
- Quieter conditions
- Suitable for range strategies
- Sets up Tokyo session
EMA-FILTERED ORB:
Rules:
- Only take bullish breaks if price > EMA
- Only take bearish breaks if price < EMA
- Ignore counter-trend breaks
Benefits:
- Reduces false signals
- Aligns with larger trend
- Improves win rate
───────────────────────────────────────
CONFIGURATION GUIDE
───────────────────────────────────────
OPENING RANGE SETTINGS:
Time Period:
- 15 min: Standard for most markets
- 30 min: Wider range, fewer breakouts
- 60 min: For slower markets or swing trades
Custom Range:
- Use for specific market opens
- NYSE: 0930-1000 EST
- LSE: 0800-0830 GMT
- Set timezone to match exchange
Historical Display:
- Enable: See all previous session data
- Disable: Cleaner chart, current session only
LIQUIDITY SETTINGS:
Left Bars (5-30):
- Lower: More frequent, sensitive levels
- Higher: Fewer, more significant levels
- Recommended: 15 for most markets
Right Bars (1-25):
- Confirmation period
- Higher: More reliable, less frequent
- Recommended: 5 for balance
Display Limit (1-20):
- Number of active levels shown
- Higher: More context, busier chart
- Recommended: 7 for clarity
Extension Options:
- Short: Levels visible near formation
- Current: Extended to current bar (recommended)
- Max: Extended indefinitely
VOLUME SETTINGS:
MA Length (5-50):
- Shorter: More responsive to spikes
- Longer: Smoother baseline
- Recommended: 20 for balance
Spike Multiplier (1.0-3.0):
- Lower: More sensitive spike detection
- Higher: Only extreme spikes
- Recommended: 1.5 for day trading
MULTI-TIMEFRAME SETTINGS:
HTF 1 (Trend):
- 5m chart: Use 15m or 1H
- 15m chart: Use 1H or 4H
- 1H chart: Use 4H or 1D
HTF 2 (Bias):
- One level higher than HTF 1
- Provides longer-term context
- Don't use same as HTF 1
EMA SETTINGS:
Length:
- 20: Responsive, more signals
- 50: Smoother, stronger filter
- 200: Long-term trend only
Style:
- Choose contrasting color
- Width 1-2 for visibility
- Match your trading style
───────────────────────────────────────
BEST PRACTICES
───────────────────────────────────────
Chart Timeframe Selection:
- ORB Trading: Use 5m or 15m charts
- Session Review: Use 1H or 4H charts
- Swing Trading: Use 1H or 4H charts
Quality Over Quantity:
- Wait for high-quality alerts (volume + MTF)
- Avoid trading every breakout
- Focus on confluence setups
Risk Management:
- Position size based on range width
- Wider ranges = smaller positions
- Use stop losses always
- Take partial profits at targets
Market Conditions:
- Best results in trending markets
- Reduce position size in choppy conditions
- Consider session overlaps for volatility
- Avoid trading near major news if inexperienced
Continuous Improvement:
- Track win rate by session
- Note which confluence factors work best
- Adjust settings based on market volatility
- Review performance weekly
───────────────────────────────────────
PERFORMANCE OPTIMIZATION
───────────────────────────────────────
This indicator is optimized with:
- max_bars_back declarations for efficient processing
- Conditional calculations based on enabled features
- Proper memory management for drawing objects
- Minimal recalculation on each bar
Best Practices:
- Disable unused features (sessions, MTF, volume)
- Limit historical display to reduce rendering
- Use appropriate timeframe for your strategy
- Clear old drawing objects periodically
───────────────────────────────────────
EDUCATIONAL DISCLAIMER
───────────────────────────────────────
This indicator combines established trading concepts:
- Opening Range Breakout theory (price action)
- Liquidity level detection (pivot analysis)
- Session-based trading (time-of-day patterns)
- Volume analysis (confirmation technique)
- Multi-timeframe analysis (trend alignment)
All calculations use standard technical analysis methods:
- Pivot high/low detection algorithms
- Moving averages for trend and volume
- Session time filtering
- Timeframe security functions
The indicator identifies potential trading setups but does not predict future price movements. Success requires proper application within a complete trading strategy including risk management, position sizing, and market context.
───────────────────────────────────────
USAGE DISCLAIMER
───────────────────────────────────────
This tool is for educational and analytical purposes. Opening Range Breakout trading involves substantial risk. The alert system and quality filters are designed to identify potential setups but do not guarantee profitability. Always conduct independent analysis, use proper risk management, and never risk capital you cannot afford to lose. Past performance does not indicate future results. Trading intraday breakouts requires experience and discipline.
───────────────────────────────────────
CREDITS & ATTRIBUTION
───────────────────────────────────────
ORIGINAL SOURCE:
This indicator builds upon concepts from LuxAlgo's-ORB

Cnagda Pure Price ActionCnagda Pure Price Action (CPPA) indicator is a pure price action-based system designed to provide traders with real-time, dynamic analysis of the market. It automatically identifies key candles, support and resistance zones, and potential buy/sell signals by combining price, volume, and multiple popular trend indicators.
How Price Action & Volume Analysis Works
Silver Zone – Logic, Reason, and Trade Planning
Logic & Visualization:
The Silver Zone is created when the closing price is the lowest in the chosen window and volume is the highest in that window.
Visually, a large silver-colored box/rectangle appears on the chart.
Thick horizontal lines (top and bottom) are drawn at the high and low of that candle/bar, extending to the right.
Reasoning:
This combination typically occurs at strong “accumulation” or support areas:
Sellers push the price down to the lowest point, but aggressive buyers step in with high volume, absorbing supply.
Indicates potential exhaustion of selling and likely shift in market control to buyers.
How to Plan Trades Using Silver Zone:
Watch if price returns to the Silver Zone in the future: It often acts as powerful support.
Bullish entries (buys) can be planned when price tests or slightly pierces this zone, especially if new buy signals occur (like yellow/green candle labels).
Place your stop-loss below the bottom line of the Silver Zone.
Target: Look for the nearest resistance or opposing zone, or use indicator’s bullish label as confirmation.
Extra Tip:
Multiple touches of the Silver Zone reinforce its importance, but if price closes deeply below it with high volume, that’s a caution signal—support may be breaking.
Black Zone – Logic, Reason, and Trade Planning (as CPPA):
Logic & Visualization:
The Black Zone is created when the closing price is the highest in the chosen window and volume is the lowest in that window.
Visually, a large black-colored box/rectangle appears on the chart, along with thick horizontal lines at the top (high) and bottom (low) of the candle, extending to the right.
Reasoning:
This combination signals a strong “distribution” or resistance area:
Buyers push the price up to a local high, but low volume means there is not much follow-through or conviction in the move.
Often marks exhaustion where uptrend may pause or reverse, as sellers can soon step in.
How to Plan Trades Using Black Zone:
If price revisits the Black Zone in the future, it often acts as major resistance.
Bearish entries (sells) are considered when price is near, testing, or slightly above the Black Zone—especially if new sell signals appear (like blue/red candle labels).
Place your stop-loss just above the top line of the Black Zone.
Target: Nearest support zone (such as a Silver Zone) or next indicator’s bearish label.
Extra Tip:
Multiple touches of the Black Zone make it stronger, but if price closes far above with rising volume, be cautious—resistance might be breaking.
Support Line – Logic, Reason, and Trade Planning (as Cppa):
Logic & Visualization:
The Support Line is a dynamically drawn dashed line (usually blue) that marks key price levels where the market has previously shown significant buying interest.
The line is generated whenever a candle forms a high price with high volume (orange logic).
The script checks for historical pivot lows, past support zones, and even higher timeframe (HTF) supports, and then extends a blue dashed line from that price level to the right, labeling it (sometimes as “Prev Support Orange, HTF”).
Reasoning:
This line helps you visually identify where demand has been strong enough to hold price from falling further—essentially a floor in the market used by professional traders.
If price approaches or re-tests this line, there’s a good chance buyers will defend it again.
How to Plan Trades Using Support Line:
Watch for price to approach the Support Line during down moves. If you see a bullish candlestick pattern, buy labels (yellow/green), or other indicators aligning, this can be a high-probability entry zone.
Great for planning stop-loss for long trades: place stops just below this line.
Target: Next resistance zone, Black Zone, or the top of the last swing.
Extra Tip:
Multiple confirmations (support line + Silver Zone + bullish label) provide powerful entry signals.
If price closes strongly below the Support Line with volume, be cautious—support may be breaking, and a trend reversal or deeper correction could follow.
Resistance Line – Logic, Reason, and Trade Planning (from CPPA):
Logic & Visualization:
The Resistance Line is a dynamically drawn dashed line (usually purple or red) that identifies price levels where the market has previously faced significant selling pressure.
This line is created when a candle reaches a high price combined with high volume (orange logic), or from a historical pivot high/resistance,
The script also tracks higher timeframe (HTF) resistance lines, labeled as “Prev Resistance Orange, HTF,” and extends these dashed lines to the right across the chart.
Reasoning:
Resistance Lines are visual markers of “supply zones,” where buyers previously failed, and sellers took control.
If the price returns to this line later, sellers may get active again to defend this level, halting the uptrend.
How to Plan Trades Using Resistance Line:
Watch for price to approach the Resistance Line during up moves. If you see bearish candlestick patterns, sell labels (blue/red), or bearish indicator confirmation, this becomes a strong shorting opportunity.
Perfect for placing stop-loss in short trades—put your stop just above the Resistance Line.
Target: Next support zone (Silver Zone) or bottom of the last swing.
If the price breaks above with high volume, avoid shorting—resistance may be failing.
Extra Tip:
Multiple resistances (Resistance Line + Black Zone + bearish label) make short signals stronger.
Choppy movement around this line often signals indecision; wait for a clear rejection before entering trades.
Bullish / Bearish Label – Logic, Reason, and Trade Planning:
Logic & Visualization:
The indicator constantly calculates a "Bull Score" and a "Bear Score" based on several factors:
Trend direction from price slope
Confirmation by popular indicators (RSI, ADX, SAR, CMF, OBV, CCI, Bollinger Bands, TWAP)
Adaptive scoring (higher score for each bullish/bearish condition met)
If Bull Score > Bear Score, the chart displays a green "BULLISH" label (usually below the bar).
If Bear Score > Bull Score, the chart displays a red "BEARISH" label (usually above the bar).
If neither dominates, a "NEUTRAL" label appears.
Reasoning:
The labels summarize complex price action and indicator analysis into a simple, actionable sentiment cue:
Bullish: Majority of conditions indicate buying strength; trend is up.
Bearish: Majority signals show selling pressure; trend is down.
How to Use in Trade Planning:
Use the Bullish label as confirmation to enter or hold long (buy) positions, especially if near support/Silver Zone.
Use the Bearish label to enter/hold short (sell) positions, especially if near resistance/Black Zone.
For best results, combine with candle color, volume analysis, or other labels (yellow/green for buys, blue/red for sells).
Avoid trading against these labels unless you have strong confluence from zones/support levels.
Yellow Label (Buy Signal) – Logic, Reason & Trade Planning:
Logic & Visualization:
The yellow label appears below a candle (label.style_label_up, yloc.belowbar) and marks a potential buy signal.
Script conditions:
The candle must be a “yellow candle” (which means it’s at the local lowest close, not a high, with normal volume).
Volume is decreasing for 2 consecutive candles (current volume < previous volume, previous volume < second previous).
When these conditions are met, a yellow label is plotted below the candle.
Reasoning:
This scenario often marks the end of selling pressure and start of possible accumulation—buyers may be stepping in as sellers exhaust.
Decreasing volume during a local price low means selling is slowing, possibly hinting at a reversal.
How to Trade Using Yellow Label:
Entry: Consider buying at/just above the yellow-labeled candle’s close.
Stop-loss: A bit below the candle’s low (or Silver Zone line, if present).
Target: Next resistance level, Black Zone, or chart’s bullish label.
Extra Tip:
If the yellow label is found at/near a Silver Zone or Support Line, and trend is “Bullish,” the setup gets even stronger.
Avoid trading if overall indicator shows “Bearish.”
Green Label (Buy with Increasing Volume) – Logic, Reason & Trade Planning:
Logic & Visualization:
The green label is plotted below a candle (label.style_label_up, yloc.belowbar) and marks a strong buy signal.
Script conditions:
The candle must be a “yellow candle” (at the local lowest close, normal volume).
Volume is increasing for 2 consecutive candles (current volume > previous volume, previous volume > second previous).
When these conditions are met, a green label is plotted below the candle.
Reasoning:
This scenario signals that buyers are stepping in aggressively at a local price low—the end of a downtrend with strong, rising activity.
Increasing volume at a price low is a classic sign of accumulation, where institutions or large players may be buying.
How to Trade Using Green Label:
Entry: Consider buying at/just above the green-labeled candle’s close for a momentum-based reversal.
Stop-loss: Slightly below the candle’s low, or the Silver Zone/support line if present.
Target: Nearest resistance zone/Black Zone, indicator’s bullish label, or next swing high.
Extra Tip:
If the green label is near other supports (Silver Zone, Support Line), the setup is extra strong.
Use confirmation from Bullish labels or trend signals for best results.
Green label setups are suitable for quick, high momentum trades due to increasing volume
Blue Label (Sell Signal on Decreasing Volume) – Logic, Reason & Trade Planning:
Logic & Visualization:
The blue label is plotted above a candle (label.style_label_down, yloc.abovebar) as a potential sell signal.
Script conditions:
The candle is a “blue candle” (local highest close, but not also lowest, and volume is neither highest nor lowest).
Volume is decreasing over 2 consecutive candles (current volume < previous, previous < two ago).
When these match, a blue label appears above the candle.
Reasoning:
This typically signals buyer exhaustion at a local high: price has gone up, but volume is dropping, suggesting big players may not be buying any more at these levels.
The trend is losing strength, and a reversal or pullback is likely.
How to Trade Using Blue Label:
Entry: Look to sell at/just below the candle with the blue label.
Stop-loss: Just above the candle’s high (or above the Black Zone/resistance if present).
Target: Nearest support, Silver Zone, or a swing low.
Extra Tip:
Blue label signals are stronger if they appear near Black Zones or Resistance Lines, or when the general market label is "Bearish."
As with buy setups, always check for confirmation from trend or volume before trading aggressively.
Here’s a summary of all key chart labels, zones, and trading logic of your Price Action script:
Silver Zone: Powerful support zone. Created at lowest close + highest volume. Best for buy entries near its lines.
Black Zone: Strong resistance zone. Created at highest close + lowest volume. Ideal for short trades near its levels.
Support Line: Blue dashed line at historical demand; buyers defend here. Look for bullish setups when price approaches.
Resistance Line: Purple/red dashed line at supply; sellers defend here. Great for bearish setups when price nears.
Bullish/Bearish Labels: Summarize trend direction using price action + multiple indicator confirmations. Plan buys, holds on bullish; sells, shorts on bearish.
Yellow Label: Buy signal on decreasing volume and local price low. Entry above candle, stop below, target next resistance.
Green Label: Strong buy on increasing volume at a price low. Entry for momentum trade, stop below, target next zone.
Blue Label: Sell signal on dropping volume and local price high. Entry below candle, stop above, target next support.
Best Practices:
Always combine zone/label signals for higher probability trades.
Use stop-loss near zones/lines for risk management.
Prefer trading in the trend direction (bullish/bearish label agrees with your entry).
if Any Question, Suggestion Feel free to ask
Disclaimer:
All information provided by this indicator is for educational and analysis purposes only, and should not be considered financial advice.

Gabriel's Squeeze Momentum📊 Gabriel’s Squeeze Momentum — Deluxe Volatility + Momentum Suite
An advanced, all-in-one squeeze & momentum framework that times volatility compression/expansion and trend shifts, with optional CVD (cumulative volume delta) momentum, ATR zone context, Discontinued Signal Lines (DSL) scalps, Colored DMI trend label, Williams VIX Fix (WVF) low-volatility exhaustion pings, Buff’s VTTI/VPCI volume confirmation, and real-time divergence detection.
What it does:
Discover Squeezes. They occur when volatility contracts, often preceding significant price moves.
Measures momentum with a fast, ATR-normalized linear regression—optionally on Price or CVD—so you see direction and “how hard it’s pushing.”
🧭 Signal Legend ~ Colors the squeeze so you instantly know regime:
🟡 / 🟣 (Tight/Very Tight): Coiled spring; prepare a plan.
🔴 / ⚫ = (Regular/Wide): Watch for Divergences between Price and Momentum.
🟢 (Fired): Expansion started; trade with momentum cross and bias.
Adds context bands at ±1/±2/±3 ATR (“trend / expansion / OB-OS”) to filter late or weak signals.
DSL (Discontinued Signal Lines) give early scalp flips on momentum vs. adaptive bands.
DMI label & triangles communicate trend strength and whether +DI / −DI is in control.
Williams VIX Fix flags capitulation/exhaustion style spikes (with optional VIX proxy).
VTTI/VPCI modules confirm when volume aligns with price trend or contradicts it.
Divergences (regular & hidden) auto-draw with optional live (may repaint) or on-close.
🎢 Squeeze Momentum — How the Logic Works 🎢
The Squeeze Momentum model is built on the principle of volatility compression and expansion. In markets, periods of low volatility are often followed by explosive moves, while high volatility eventually contracts. The “squeeze” seeks to identify these compression phases and prepare traders for the likely expansion that follows.
This indicator achieves that by comparing Bollinger Bands (BB) to Keltner Channels (KC).
Bands: Bollinger vs. Keltner
Bollinger Bands (BB): Calculated using a Simple Moving Average (SMA) of price and standard deviations (σ) of the closing price. The bands expand and contract depending on volatility.
Keltner Channels (KC): Built from an SMA plus/minus multiples of the Average True Range (ATR). Unlike some simplified squeeze indicators that approximate ATR, this implementation uses a true ATR-based KC, ensuring accuracy across different assets and timeframes.
By comparing whether the Bollinger Bands are inside or outside the Keltner Channels, the indicator identifies different squeeze regimes, each representing a distinct volatility environment.
📦 Regime Colors
The squeeze states are color-coded for quick interpretation:
🔹Wide Squeeze (⚫): BB inside KC with a high ATR multiplier. Extremely low volatility, often before major expansion.
🔹Normal Squeeze (🔴): BB inside KC with a moderate ATR multiplier (about 25% more sensitive than Wide). Typical compression setting.
🔹Narrow Squeeze (🟡): BB inside KC with a lower ATR multiplier (about 50% more sensitive than Wide). Signals tighter compression.
🔹Very Narrow Squeeze (🟣): BB inside KC with the lowest ATR multiplier (100% more sensitive than Wide). Indicates extreme coiling.
🔹Fired Squeeze (🟢): BB break outside KC. Marks the release of volatility and potential trend acceleration.
This multi-layered system improves upon classical SQZPRO by using precisely calculated Keltner Channels and multiple sensitivity levels, giving traders more granular information about volatility states.
🔒 Multi-Timeframe Support
The indicator automatically adjusts squeeze thresholds for different timeframes — hourly, 4-hour, daily, weekly, and monthly charts. Each regime has been manually tuned for its timeframe, allowing traders to use the same tool whether scalping, swing trading, or holding longer-term positions.
🎯 Momentum Core
Detecting a squeeze is only half the equation — the indicator also includes a momentum engine to determine direction and strength.
Price momentum is measured as the distance of Close from its Highest High and Lowest Low range, smoothed with a Simple Moving Average, and refined with Linear Regression.
This value is then divided by ATR, normalizing momentum relative to volatility.
Optionally, CVD Mode (Cumulative Volume Delta ÷ Volume) can replace price momentum for assets where order-flow and volume dynamics dominate (e.g., crypto).
🦆 Signal Line
Momentum is paired with a Simple Moving Average signal line:
🔹Bullish: Momentum > Signal.
🔹Bearish: Momentum < Signal.
This crossover logic provides directional bias and filters for false squeezes.
🚀 When to Use Price vs. CVD
CVD Mode (Crypto, FX with tick volume): Best for assets with strong volume/order-flow signals.
Price Mode (Equities, Commodities, Higher TFs): Best for assets with irregular or thin volume data.
🛢️ATR Zones (context filter) 🛢️
Its design is straightforward yet effective: it measures the difference between the current price from its highest highs, lowest lows, and a moving average over a chosen period, then expresses that difference in terms of the Average True Range (ATR) over the same period. By normalizing price deviations against volatility, ATR provides a clear sense of how far and how fast price is moving relative to its “normal” range.
Interpreting the Zone
Positive Values: When it is above zero, price is trading above its HH, LL, and moving average, suggesting bullish momentum. The higher the value, the stronger the momentum relative to volatility.
Negative Values: When the Momentum is below zero, price is trading below its HH, LL, and moving average, signaling bearish momentum. The deeper the reading, the stronger the downside pressure.
Magnitude Matters: Because the Momentum is expressed in ATR units, traders can immediately gauge whether the move is small (less than 1 ATR), moderate (1–2 ATRs), or extreme (3+ ATRs). This makes it especially useful for assessing overbought or oversold conditions in a normalized way.
Strengths:
🔹Volatility-Normalized: Unlike simple squeeze momentum oscillators that have different OB/OS levels, this Momentum adjusts for volatility. This makes signals more consistent across assets with different volatility profiles.
🔹Simplicity:
±1 ATR: trending zone (bulls above +1, bears below −1)
±2 ATR: expansion (keep, add, or trail). Stretch/risk of mean reversion.
±3 ATR: potential exhaustion/mean-revert zone.
🔹Momentum Clarity: By framing momentum in ATR terms, it is easier to distinguish between a small deviation from trend and a genuinely significant move. Sometimes it is a good sign that it trend to ±3/2 ATR, looks for similar directional moves.
Color: The script shades +2/+3 (OB) and −2/−3 (OS) areas and provides swing alerts at ±1 ATR.
💚 What Are Discontinued Signal Lines (DSL)? 💚
In technical analysis, one of the most common tools for smoothing out noisy data is the signal line. This concept appears in many indicators, such as the MACD or stochastic oscillator, where the raw value of an indicator is compared to a smoothed version of itself. The signal line acts as a lagging filter, making it easier to identify shifts in momentum, crossovers, and directional changes.
While useful, the classic signal line approach has limitations. By design, a single smoothed line introduces lag, which means traders may receive signals later than ideal. Additionally, a one-size-fits-all smoothing process often struggles to adapt to different levels of volatility or rapidly changing market conditions.
This is where Discontinued Signal Lines (DSL) come in. DSL is an advanced extension of the traditional signal line concept. Instead of relying on just one smoothed comparison, DSL employs multiple adaptive lines that adjust dynamically to the current state of the indicator. These adaptive lines effectively “discontinue” the dependence on a single, fixed smoothing method, producing a more flexible and nuanced representation of market conditions.
How DSL Works?
Traditional Signal Line: Compares an the Momentum against its own moving average. Provides crossover signals when the raw indicator value moves above or below the smoothed line.
Strength: reduces noise. Weakness: delayed signals and limited adaptability.
DSL Extension: Uses multiple adaptive lines that respond differently to the indicator’s current behavior. Instead of one static moving average, the DSL approach creates faster and slower “reaction lines.” These lines adapt dynamically, capturing acceleration or deceleration in the indicator’s state.
Result: Traders see how momentum is evolving across multiple adaptive thresholds. This reduces false signals and improves responsiveness in volatile conditions.
Benefits of Discontinued Signal Lines
🔹Nuanced Trend Detection
DSL doesn’t just flag when momentum changes direction—it shows the quality of that shift, highlighting whether it is gaining strength, losing steam, or consolidating.
🔹Adaptability Across Markets
Because DSL adjusts to the Momentum’s own dynamics, it works well across different asset classes and timeframes, from equities and futures to forex and crypto.
🔹Earlier Signal Recognition
Multiple adaptive lines allow traders to spot developing trends earlier than with a single smoothed signal line, without being overwhelmed by raw indicator noise.
🔹Better Confirmation
DSL is particularly useful for confirmation. If both adaptive lines agree then a fill is applied in the direction, confidence in the trend is higher as the color turns bull/bear.
🔹Practical Uses
Momentum Trading: Spot acceleration or deceleration in trend strength.
Trend Confirmation: Verify whether a breakout has momentum behind it.
Noise Filtering: Smooth out erratic moves while retaining adaptability.
⚖️ Colored Directional Movement Index (CDMI) ⚖️
The Directional Movement Index (DMI), created by J. Welles Wilder, is one of the most respected trend-following indicators in technical analysis. It is actually a family of three separate indicators combined into one: the +DI (Positive Directional Indicator), the –DI (Negative Directional Indicator), and the ADX (Average Directional Index). Together, they measure not only whether the market is trending but also the strength of that trend. Traders have used the DMI for decades to identify trend direction, gauge momentum, and filter out periods of market noise.
However, despite its reliability, the traditional DMI can be challenging to interpret. Reading three separate lines at once and extracting meaningful signals requires both experience and careful observation. This complexity often discourages newer traders from fully utilizing its power.
The Colored Directional Movement Index (CDMI) is a modern reinterpretation of Wilder’s classic tool. It condenses the same information into a single visual line while using color, shape, and density to communicate what’s happening beneath the surface. The goal is simple: make the DMI’s insights faster to read, easier to act upon, and more intuitive to integrate into trading decisions.
Key Features of CDMI
🔹Color Scale for Trend Strength
The main triangle changes its base color depending on the strength of the DI reading. Dark Red or Green, colors correspond to stronger trends, while faded Gray or lighter yellow tones signal weaker or fading trends. This makes it visually clear when the market is consolidating versus trending strongly.
🔹Color Density for Momentum
Beyond strength, the CDMI uses color density to represent momentum in the trend’s strength. If the ADX is rising (trend gaining momentum), the triangles grows more darker. If the ADX is falling (trend losing momentum), the triangle becomes paler. This provides an instant sense of whether a trend is accelerating or decelerating.
🔹Directional Triangles for Trend Direction
To replace the separate +DI and –DI lines, the CDMI plots small triangle shapes along the bottom axis. An upward-facing triangle indicates that +DI is dominant, confirming bullish direction. A downward-facing triangle signals –DI dominance, confirming bearish direction. This way, both strength and direction are shown without the clutter of multiple overlapping lines.
🔹Label Display for Detailed Values
For traders who want precise data alongside the visuals, CDMI includes a label that shows:
Current trend strength (ADX value).
Current +DI and –DI values.
Momentum status of the ADX (rising or falling).
Historical values of DMI readings, so traders can track how the indicator has evolved over time.
Tooltips are also available to explain “How to read the colored DMI line”, making this version more beginner-friendly.
Why CDMI Matters
The CDMI retains the proven reliability of Wilder’s DMI while solving its biggest drawback—interpretation difficulty. Instead of juggling three separate plots, traders get a single, information-rich line supplemented with intuitive shapes and labels. This streamlined format makes trend verification, momentum analysis, and signal confirmation much faster.
For trading applications, the CDMI can help:
Confirm Entries by showing whether the market is trending strongly enough to justify a position.
Avoid False Signals by filtering out periods of low ADX (weak trend).
Enhance Timing by tracking momentum shifts in trend strength.
By simplifying the complexity of the original DMI into an elegant, color-coded tool, the CDMI makes one of technical analysis’ most advanced indicators practical for everyday use.
😅 The VIX, the Williams Vix Fix, and Market Bottoms 😎
The VIX, formally known as the CBOE Volatility Index, has long been considered one of the most reliable indicators for spotting major market bottoms. Often referred to as the “fear gauge,” it measures the market’s expectation of volatility in the S&P 500 over the next 30 days. When fear grips investors and volatility spikes, the VIX rises sharply. Historically, these moments of extreme fear often coincide with powerful buying opportunities, as markets have a tendency to rebound once panic selling exhausts itself.
Larry Williams, a well-known trader and author, developed the Williams Vix Fix as a way to replicate the insights of the VIX across any tradable asset. While the VIX itself is tied specifically to S&P 500 options, Williams wanted a tool that could capture similar panic-driven dynamics in stocks, futures, forex, and other markets where the VIX is not directly applicable. His “fix” uses price action and volatility formulas to approximate the same emotional extremes reflected in the official VIX, creating almost identical results in practice. This makes the Williams Vix Fix a powerful addition to the trader’s toolbox, allowing the same principle that works on U.S. equities to be applied universally.
One of the most important characteristics of both the VIX and the Williams Vix Fix is that they are far more reliable at signaling market bottoms than market tops. The reason is psychological as much as it is mathematical. At market bottoms, fear and panic are widespread. Retail investors often capitulate, selling in a frenzy as prices drop. This panic drives volatility higher, producing the spikes we see in the VIX. At the same time, professional traders and institutions—those with larger capital and more disciplined strategies—tend to step in when volatility is stretched. They buy when others are fearful, using the panic of retail investors as an opportunity to acquire assets at discounted prices. This confluence of retail panic and institutional buying power is what makes the VIX such a strong bottom-finding tool.
In contrast, at market tops, the dynamic is very different. Tops tend not to be marked by panic or fear. Instead, they form quietly as enthusiasm fades, liquidity dries up, and buying interest wanes. Investors are often complacent, assuming prices will continue to rise, while professional money begins distributing their positions. Because there is no surge in fear, volatility remains muted, and the VIX does not offer a clear warning. This is why traders who rely on the VIX or the Williams Vix Fix must understand its limitations: it is exceptional for detecting bottoms but less useful for anticipating tops.
For traders, the lesson is straightforward. When you see the VIX or Williams Vix Fix spiking to extreme levels, it often indicates a high-probability environment for a rebound. These tools should not be used in isolation, but when combined with support levels, sentiment indicators, and market breadth, they can provide some of the most reliable bottom-fishing signals available. While no indicator is perfect, few have stood the test of time as consistently as the VIX—and thanks to Williams’ adaptation, its power can now be applied to nearly every market.
Indicator Signals (Great in risk-off charts):
🔹Flags spike events (tops/bottoms) with both original and filtered (AE/FE) criteria.
🔹Great as a risk overlay: tighten stops into AE/FE, or require “no spike” to enter.
🤯 Volume Comfirmation: VTTI & VPCI (Buff Dormeier) 🤯
Volume Trend Technical Indicator (VTTI)
The Volume Trend Technical Indicator (VTTI) is a momentum-style tool that analyzes how volume trends interact with price movement. Unlike basic volume measures that simply report how many shares or contracts were traded, the VTTI evaluates whether volume is expanding or contracting in the same direction as the prevailing price trend. The underlying logic is that healthy trends are supported by rising volume, while weakening trends often occur on shrinking volume.
At its core, VTTI looks at the rate of change in volume compared to price movements. By smoothing and normalizing these relationships, the indicator helps traders determine whether momentum is accelerating, decelerating, or diverging.
Rising VTTI: Suggests that volume is confirming the current price trend, strengthening the case for continuation. Flips BG Green after crossing it's signal.
Falling VTTI: Indicates that the trend may be losing participation, often a sign of possible consolidation or reversal. Flips BG Red after crossing it's signal.
Traders often use VTTI to filter entries and exits. For example, if price breaks out but VTTI does not rise above zero, the breakout may lack conviction. On the other hand, when both price and VTTI are aligned, probability of continuation improves.
Volume Price Confirmation Indicator (VPCI)
The Volume Price Confirmation Indicator (VPCI), developed by Buff Dormeier, takes the relationship between price and volume a step further. While traditional indicators like On-Balance Volume (OBV) or Chaikin Money Flow look at cumulative patterns, VPCI breaks price and volume into trend and volatility components and then recombines them to measure how well they confirm each other.
In essence, VPCI asks: “Does volume confirm what price is signaling?”
The formula integrates:
Price Trend Component – whether the market is trending upward or downward.
Volume Trend Component – whether trading activity supports that price trend.
Volatility Adjustments – to account for irregular swings.
The resulting oscillator fluctuates around a zero line:
Positive VPCI: Indicates that price and volume trends are in agreement (bullish confirmation).
Negative VPCI: Suggests that price and volume are diverging (bearish warning or false move).
Crossovers of Zero: Can serve as potential buy or sell signals, depending on context.
A key strength of VPCI is its sensitivity to divergence. When prices continue rising but VPCI begins falling, it often foreshadows a weakening rally. Conversely, a rising VPCI during a flat or down market can highlight early accumulation.
VTTI (Entry Signal) vs. VPCI (Exit Signal)
While both indicators study price-volume dynamics, their focus differs:
VTTI is simpler, emphasizing the trend of volume relative to price for momentum confirmation.
VPCI is more advanced, decomposing both price and volume into multiple components to produce a nuanced oscillator.
Used together, they provide complementary insights. VTTI helps quickly spot whether volume is supporting a move, while VPCI offers deeper confirmation and highlights subtle divergences.
Note: The Up/Down Volume Alert works better on the 4 HR, for Daily scalps or 30 minute for HR scalps. Intraday it's 2/10 minute.
🦅 Divergence toolkit 🦅
Divergences in Technical Analysis
Divergence occurs when the price action of an asset moves in one direction while a technical indicator, such as RSI, MACD, or Momentum, moves in the opposite direction. This disagreement between price and indicator often signals a shift in underlying market dynamics. Traders use divergences to anticipate either potential reversals or continuations in trends.
There are two main types of divergences: regular divergences, which typically precede reversals, and hidden divergences, which suggest continuation of the current trend.
Regular Divergence (Reversal Signals)
A regular divergence occurs when price and indicator disagree during a trend extension. These divergences signal that momentum is no longer fully supporting the current trend and that a reversal may be imminent.
🔹Regular Bullish Divergence
Price Action: Forms a lower low.
Indicator: Forms a higher low.
Interpretation: Price is making new lows, but the indicator is gaining strength. This suggests that selling pressure is weakening, and a reversal to the upside may occur.
Example: RSI rising while price dips to fresh lows.
🔹Regular Bearish Divergence
Price Action: Forms a higher high.
Indicator: Forms a lower high.
Interpretation: Price is reaching new highs, but the indicator shows weakening momentum. This implies that buying pressure is fading, warning of a potential downside reversal.
Example: MACD histogram falling while price makes higher highs.
Regular divergences are often spotted near the end of trends and are most powerful when aligned with key support/resistance levels or overbought/oversold conditions.
Hidden Divergence (Continuation Signals)
A hidden divergence occurs during retracements within a trend. Unlike regular divergences, hidden divergences suggest that the prevailing trend still has strength and is likely to continue.
🔹Hidden Bullish Divergence
Price Action: Forms a higher low.
Indicator: Forms a lower low.
Interpretation: Price is retracing within an uptrend, but the indicator is overshooting downward. This shows that momentum remains intact, supporting continuation upward.
🔹Hidden Bearish Divergence
Price Action: Forms a lower high.
Indicator: Forms a higher high.
Interpretation: Price is retracing within a downtrend, while the indicator overshoots upward. This indicates that bearish momentum remains strong, supporting continuation downward.
Hidden divergences often appear during pullbacks, helping traders time entries in the direction of the prevailing trend.
Practical Use of Divergences
🔹Trend Reversal Alerts – Regular divergences are early warnings that a trend may be ending.
🔹Trend Continuation Signals – Hidden divergences help confirm that retracements are simply pauses, not full reversals.
🔹Confluence with Other Tools – Divergences are more reliable when combined with support/resistance, candlestick patterns, or volume analysis.
🔹Multi-Timeframe Analysis – Spotting divergences on higher timeframes often produces stronger signals.
🕭🔔🛎️ Alert 🛎️🔔🕭
🔹Squeeze
🟢 Fired Squeeze
⚫ Low (Wide) Squeeze / 🔴 Normal / 🟡 Tight / 🟣 Very Tight
🔹Momentum
🐂 Bullish Trend Reversal (Crossover of Momentum and Signal from sub −2)
🐻 Bearish Trend Reversal (Crossover of Momentum and Signal from above +2)
📈 Bullish Swing (cross above +1 ATR) / 📉 Bearish Swing (cross below −1 ATR)
🔹DSL
💚 Bullish DSL Scalp / 💔 Bearish DSL Scalp
🔹Volume
🎯 Strong Up Volume (VPCI > 0 and VTTI up)
⏳ Strong Down Volume (VPCI < 0 and VTTI down)
🔹Divergences
🦅 Bullish, 🦆 Bearish, 🦅 Bullish Hidden, 🦆 Bearish Hidden
Management: Search Vanguard ETFs in your browser, look up full list of VOO holdings. Download it, or copy paste all the ticker symbols. Place that with a AI, just ask it to place , in between each ticker. NVDA, TSLA, AVGO, etc. Create a new watchlist, in the + add all tickers separated by commas. Place a watchlist alert ⚠️ only available for premium + subscribers.
Practical playbook
1) Classic Squeeze Break
Setup: 🔴(D)/🟡(2D)/🟣(3D) squeeze → wait for 🟢(1HR) Fired.
Confirm: Momentum > Signal and above +1 ATR (or DMI strong & rising).
Manage: add on pullbacks that hold +1 ATR; scale near +2 ATR or WVF AE/FE.
2) DSL Scalp in Trend
Setup: Clear trend (DMI strong) + DSL bull/bear trigger in the direction of trend.
Filter: avoid tight/very tight yellow/purple unless you want micro-scalps.
Exit: opposite DSL or ATR midline loss.
3) Mean-Reversion Fade
Setup: Momentum extended to ±3 ATR, WVF spike, and a regular divergence.
Entry: Counter signal only when mom crosses back through ±3 ATR toward mid. Exit early if squeeze ⚫/🔴, Momentum may extend to ±3/2 ATR in the same direction.
Risk: reduce size; this is a fade, not trend following.
4) Volume-Confirmed Breakout
Setup: Squeeze → 🟢 Fired + VPCI > 0 and VTTI up → trend continuation.
Manage: trail behind +1 ATR (long) or −1 ATR (short). 9 SMA works good.
Inputs at a glance (key ones)
Mode: Price or CVD momentum; Squeeze Sensitivity (σ); Momentum Length; Signal Length; ATR Smoothing.
🧮 Colors:
SQZMOM: per squeeze regime, momentum, ATR fills.
DSL: On/Off, Fast/Slow, Length.
ATR Zones: Bullish/Bearish levels (±1), ±2/±3 zone lines & fills.
DMI: Lengths, key & weak thresholds, label on/off.
WVF/VIX: Lookbacks, bands, AE/FE toggles, VIX proxy symbol.
VTTI/VPCI: Fast/slow/signal (VTTI), Short/Long (VPCI), and volume source (Tick/CVD/NVI/PVI/OBV/PVT/AccDist/VWAP).
Divergences: Regular/Hidden toggles, Sensitivity %, Lifetime, Live vs On-Close, Lines/Labels.
🔎 Suggested defaults (feel free to tweak)
Calibration: Size Momentum, so that when it's above zero the asset is trending up. For the signal, it can be kept the same or lower.
Intraday (60–240m): σ = 2.0, 18~20, 3~5, DSL Fast, DMI key 23, weak 17.
Daily/Weekly: keep σ = 2.0, consider DSL Slow, DMI key 25, weak 20, widen ATR filters; lean on VPCI/VTTI (4-HR).
CVD mode: use where tick/volume quality is high (index futures, liquid equities, crypto majors).
🪟 Tips & caveats
Swing Screener: Favor liquid underlyings (index futures/ETFs, large caps). Large-Cap, 2 M Vol, Mid-Cap, 500K Vol. Squeeze: BB( 20) upper < KC (20) upper, and BB (20) lower > KC (20) lower. Optional: Price above 9 SMA, 21 SMA, and 50 SMA, they are my SMA of choice. 200 SMA too, unless you are willing to fish in a bear market. Vice-versa for shorts. Optional: ADX 4 HR > 17, or 23 depending on what you are looking for.
Scalp Screener: Same as above, change the D 9 SMA to 5, and the BB/KC from D to 1 HR. Scalps may last 2~3 days.
Position Screener: Change all daily setting to W, aside from Volume. Optional: PEG < 1.5, FCF > 0, ROA > 8% or ROE > 6%.
Good with Moving averages (9/21/50) and low-volume zones.
Position size by IV, ATR, and account risk. Consider stop/hedge rules around ±2/±3 ATR.
Let alerts stage your watchlist; act only on combined squeeze + momentum signals.
Divergences in live mode can repaint (Real-Time); for algo or alerts, use on-close.
Tight/Very tight squeezes are great for scalps but choppy; combine with DMI rising + VPCI>0.
±3 ATR is exhaustion context, not an auto-fade—look for WVF/Div/DSL confirmation.
For alerts, pair “Fired Squeeze + Bullish Swing” (or bearish) to avoid false starts.
🎯 How to Trade Entry ~ Recap:
Tight/very tight squeeze → fires → momentum crosses up (or DSL bull).
Exit/Flip: Momentum crosses down into/after expansion or hits +2/+3 ATR with fade signs. Filter: Avoid fresh longs at +3 ATR; avoid fresh shorts at −3 ATR unless fading with confirmation.
📐 Options Integrations
✅ Risk Reversal/Modified Risk Reversal (Bullish: Short Put + Long Call)
Use when: Squeeze fires up from 🟡/🟣 and momentum crosses above signal (or zero/DSL).
Playbook Entry: On or just after the bullish fire and momentum upcross. DMI or Volume supports trend as well.
Structure: Sell a put at/just below the −2 ATR reference (or recent swing support). Buy a call at/above the breakout zone (prior high/mid-range +1 to +2 ATR).
A classic risk reversal is a long call plus a short put. That’s a very bullish structure—you gain if the price rallies (via the call), and you collect a premium by selling a put. But it has a naked downside risk. The modified risk reversal fixes that by adding a long lower put (making the short put into a defined put credit spread).
Management: If momentum stays above signal, ride toward +2 → +3 ATR. Sell the put near the current price → receive big premium. Buy the lower put → spend part of that premium (risk cap). Buy the call above the current price → spend more, but the short put premium mostly pays for it.
Exits/Adjust: Momentum downcross or squeeze flips back on (new compression) → reduce. If price retests −1/−2 ATR and holds, you can roll the short put down/out.
Breakout = Big Success; No Breakout = you keep the initial credit. Reversal = Max loss is capped by the long lower put.
✅ Iron Condor (Neutral: Short OTM Put Spread + Short OTM Call Spread)
Use when: Squeeze is active (🟡/🟣), momentum is flat near zero, and there is no directional edge. 🟢 lasts for around 5~8 bars typically. I measure the historical duration of it, and wait for a range period to occur.
Playbook Entry: During compression, set wings outside ±2 ATR (or recent range extremes). I prefer identifying boxes where the rectangle pattern occurs on the chart.
Management: Time decay works while price remains trapped in the coil. High-winrate ~80%, but 1 loser can wipe most of the gains.
Exits/Adjust: If a squeeze fires and momentum breaks hard one way, close the losing side, consider converting to a vertical or rotating to a directional spread aligned with momentum.
4HR-Bullish, closing one wing:
Tip: Align daily/weekly context with your intraday entries. 9 > 50 on Weekly, similar on Daily. Sell premium into compression; switch to directional spreads on expansion and momentum confirmation.
✅ Naked Call/Puts (Directional: 10~30 Delta Calls)
Stick to naked calls and puts when the squeezes are fired from either 🔴 or ⚫.
Look for Strikes slightly out of the money with an OI and Volume spread less than <10%.
If Strike Date is >45, manage 21 Days before expiration. Scalp: Expiration Strikes of 1/4 of the Squeeze period. Leap: Expiration Strikes of 1.75x of the Squeeze period.
📐 Futures Integrations
Playbook Entry:
Verify if the squeeze on the hourly is red or green, and enter on the 2- or 5-minute during a similar squeeze state.
Trend-Following: Traditional 2 Renko Block above 21 SMA and Momentum is bullish, or vice versa. (2~ES, 5~NQ)
Structure: Go long at/just below the ATR reference (or recent swing support). Exit below the breakout zone (prior high/mid-range +1 to +2 ATR).
Management: If momentum stays above +1 ATR ride toward +2 → +3 ATR, etc. House-money, should be kept.
Exits/Adjust: Momentum downcross or squeeze flips back on (new compression) → exit. On Renko Charts, lower the sensitivity to 0.7~1. If price retests 0/−1/−2 ATR and holds, you can enter when the 9 SMA flips. The 50 SMA is better for Daily and up; I wouldn't trade against it then.
📌 FOMO Trading Playbook
Credits & License
Credits: @JF10R (Multi-Timeframe Squeeze), @BigBeluga (DSL), @OskarGallard (Colored DMI base), @ChrisMoody (WVF ideas), @PineCodersTASC (VTTI/VPCI), @EliCobra (Divergence toolkit).
License: Mozilla Public License 2.0 (MPL-2.0).
Author: © GabrielAmadeusLau

Dual Volume Profiles: Session + Rolling (Range Delineation)Dual Volume Profiles: Session + Rolling (Range Delineation)
INTRO
This is a probability-centric take on volume profile. I treat the volume histogram as an empirical PDF over price, updated in real time, which makes multi-modality (multiple acceptance basins) explicit rather than assumed away. The immediate benefit is operational: if we can read the shape of the distribution, we can infer likely reversion levels (POC), acceptance boundaries (VAH/VAL), and low-friction corridors (LVNs).
My working hypothesis is that what traders often label “fat tails” or “power-law behavior” at short horizons is frequently a tail-conditioned view of a higher-level Gaussian regime. In other words, child distributions (shorter periodicities) sit within parent distributions (longer periodicities); when price operates in the parent’s tail, the child regime looks heavy-tailed without being fundamentally non-Gaussian. This is consistent with a hierarchical/mixture view and with the spirit of the central limit theorem—Gaussian structure emerges at aggregate scales, while local scales can look non-Gaussian due to nesting and conditioning.
This indicator operationalizes that view by plotting two nested empirical PDFs: a rolling (local) profile and a session-anchored profile. Their confluence makes ranges explicit and turns “regime” into something you can see. For additional nesting, run multiple instances with different lookbacks. When using the default settings combined with a separate daily VP, you effectively get three nested distributions (local → session → daily) on the chart.
This indicator plots two nested distributions side-by-side:
Rolling (Local) Profile — short-window, prorated histogram that “breathes” with price and maps the immediate auction.
Session Anchored Profile — cumulative distribution since the current session start (Premkt → RTH → AH anchoring), revealing the parent regime.
Use their confluence to identify range floors/ceilings, mean-reversion magnets, and low-volume “air pockets” for fast traverses.
What it shows
POC (dashed): central tendency / “magnet” (highest-volume bin).
VAH & VAL (solid): acceptance boundaries enclosing an exact Value Area % around each profile’s POC.
Volume histograms:
Rolling can auto-color by buy/sell dominance over the lookback (green = buying ≥ selling, red = selling > buying).
Session uses a fixed style (blue by default).
Session anchoring (exchange timezone):
Premarket → anchors at 00:00 (midnight).
RTH → anchors at 09:30.
After-hours → anchors at 16:00.
Session display span:
Session Max Span (bars) = 0 → draw from session start → now (anchored).
> 0 → draw a rolling window N bars back → now, while still measuring all volume since session start.
Why it’s useful
Think in terms of nested probability distributions: the rolling node is your local Gaussian; the session node is its parent.
VA↔VA overlap ≈ strong range boundary.
POC↔POC alignment ≈ reliable mean-reversion target.
LVNs (gaps) ≈ low-friction corridors—expect quick moves to the next node.
Quick start
Add to chart (great on 5–10s, 15–60s, 1–5m).
Start with: bins = 240, vaPct = 0.68, barsBack = 60.
Watch for:
First test & rejection at overlapping VALs/VAHs → fade back toward POC.
Acceptance beyond VA (several closes + growing outer-bin mass) → traverse to the next node.
Inputs (detailed)
General
Lookback Bars (Rolling)
Count of most-recent bars for the rolling/local histogram. Larger = smoother node that shifts slower; smaller = more reactive, “breathing” profile.
• Typical: 40–80 on 5–10s charts; 60–120 on 1–5m.
• If you increase this but keep Number of Bins fixed, each bin aggregates more volume (coarser bins).
Number of Bins
Vertical resolution (price buckets) for both rolling and session histograms. Higher = finer detail and crisper LVNs, but more line objects (closer to platform limits).
• Typical: 120–240 on 5–10s; 80–160 on 1–5m.
• If you hit performance or object limits, reduce this first.
Value Area %
Exact central coverage for VAH/VAL around POC. Computed empirically from the histogram (no Gaussian assumption): the algorithm expands from POC outward until the chosen % is enclosed.
• Common: 0.68 (≈“1σ-like”), 0.70 for slightly wider core.
• Smaller = tighter VA (more breakout flags). Larger = wider VA (more reversion bias).
Max Local Profile Width (px)
Horizontal length (in pixels) of the rolling bars/lines and its VA/POC overlays. Visual only (does not affect calculations).
Session Settings
RTH Start/End (exchange tz)
Defines the current session anchor (Premkt=00:00, RTH=your start, AH=your end). The session histogram always measures from the most recent session start and resets at each boundary.
Session Max Span (bars, 0 = full session)
Display window for session drawings (POC/VA/Histogram).
• 0 → draw from session start → now (anchored).
• > 0 → draw N bars back → now (rolling look), while still measuring all volume since session start.
This keeps the “parent” distribution measurable while letting the display track current action.
Local (Rolling) — Visibility
Show Local Profile Bars / POC / VAH & VAL
Toggle each overlay independently. If you approach object limits, disable bars first (POC/VA lines are lighter).
Local (Rolling) — Colors & Widths
Color by Buy/Sell Dominance
Fast uptick/downtick proxy over the rolling window (close vs open):
• Buying ≥ Selling → Bullish Color (default lime).
• Selling > Buying → Bearish Color (default red).
This color drives local bars, local POC, and local VA lines.
• Disable to use fixed Bars Color / POC Color / VA Lines Color.
Bars Transparency (0–100) — alpha for the local histogram (higher = lighter).
Bars Line Width (thickness) — draw thin-line profiles or chunky blocks.
POC Line Width / VA Lines Width — overlay thickness. POC is dashed, VAH/VAL solid by design.
Session — Visibility
Show Session Profile Bars / POC / VAH & VAL
Independent toggles for the session layer.
Session — Colors & Widths
Bars/POC/VA Colors & Line Widths
Fixed palette by design (default blue). These do not change with buy/sell dominance.
• Use transparency and width to make the parent profile prominent or subtle.
• Prefer minimal? Hide session bars; keep only session VA/POC.
Reading the signals (detailed playbook)
Core definitions
POC — highest-volume bin (fair price “magnet”).
VAH/VAL — upper/lower bounds enclosing your Value Area % around POC.
Node — contiguous block of high-volume bins (acceptance).
LVN — low-volume gap between nodes (low friction path).
Rejection vs Acceptance (practical rule)
Rejection at VA edge: 0–1 closes beyond VA and no persistent growth in outer bins.
Acceptance beyond VA: ≥3 closes beyond VA and outer-bin mass grows (e.g., added volume beyond the VA edge ≥ 5–10% of node volume over the last N bars). Treat acceptance as regime change.
Confluence scores (make boundary/target quality objective)
VA overlap strength (range boundary):
C_VA = 1 − |VA_edge_local − VA_edge_session| / ATR(n)
Values near 1.0 = tight overlap (stronger boundary).
Use: if C_VA ≥ 0.6–0.8, treat as high-quality fade zone.
POC alignment (magnet quality):
C_POC = 1 − |POC_local − POC_session| / ATR(n)
Higher C_POC = greater chance a rotation completes to that fair price.
(You can estimate these by eye.)
Setups
1) Range Fade at VA Confluence (mean reversion)
Context: Local VAL/VAH near Session VAL/VAH (tight overlap), clear node, local color not screaming trend (or flips to your side).
Entry: First test & rejection at the overlapped band (wick through ok; prefer close back inside).
Stop: A tick/pip beyond the wider of the two VA edges or beyond the nearest LVN, a small buffer zone can be used to judge whether price is truly rejecting a VAL/VAH or simply probing.
Targets: T1 node mid; T2 POC (size up when C_POC is high).
Flip: If acceptance (rule above) prints, flip bias or stand down.
2) LVN Traverse (continuation)
Context: Price exits VA and enters an LVN with acceptance and growing outer-bin volume.
Entry: Aggressive—first close into LVN; Conservative—retest of the VA edge from the far side (“kiss goodbye”).
Stop: Back inside the prior VA.
Targets: Next node’s VA edge or POC (edge = faster exits; POC = fuller rotations).
Note: Flatter VA edge (shallower curvature) tends to breach more easily.
3) POC→POC Magnet Trade (rotation completion)
Context: Local POC ≈ Session POC (high C_POC).
Entry: Fade a VA touch or pullback inside node, aiming toward the shared POC.
Stop: Past the opposite VA edge or LVN beyond.
Target: The shared POC; optional runner to opposite VA if the node is broad and time-of-day is supportive.
4) Failed Break (Reversion Snap-back)
Context: Push beyond VA fails acceptance (re-enters VA, outer-bin growth stalls/shrinks).
Entry: On the re-entry close, back toward POC.
Stop/Target: Stop just beyond the failed VA; target POC, then opposite VA if momentum persists.
How to read color & shape
Local color = most recent sentiment:
Green = buying ≥ selling; Red = selling > buying (over the rolling window). Treat as context, not a standalone signal. A green local node under a blue session VAH can still be a fade if the parent says “over-valued.”
Shape tells friction:
Fat nodes → rotation-friendly (fade edges).
Sharp LVN gaps → traversal-friendly (momentum continuation).
Time-of-day intuition
Right after session anchor (e.g., RTH 09:30): Session profile is young and moves quickly—treat confluence cautiously.
Mid-session: Cleanest behavior for rotations.
Close / news: Expect more traverses and POC migrations; tighten risk or switch playbooks.
Risk & execution guidance
Use tight, mechanical stops at/just beyond VA or LVN. If you need wide stops to survive noise, your entry is late or the node is unstable.
On micro-timeframes, account for fees & slippage—aim for targets paying ≥2–3× average cost.
If acceptance prints, don’t fight it—flip, reduce size, or stand aside.
Suggested presets
Scalp (5–10s): bins 120–240, barsBack 40–80, vaPct 0.68–0.70, local bars thin (small bar width).
Intraday (1–5m): bins 80–160, barsBack 60–120, vaPct 0.68–0.75, session bars more visible for parent context.
Performance & limits
Reuses line objects to stay under TradingView’s max_lines_count.
Very large bins × multiple overlays can still hit limits—use visibility toggles (hide bars first).
Session drawings use time-based coordinates to avoid “bar index too far” errors.
Known nuances
Rolling buy/sell dominance uses a simple uptick/downtick proxy (close vs open). It’s fast and practical, but it’s not a full tape classifier.
VA boundaries are computed from the empirical histogram—no Gaussian assumption.
This script does not calculate the full daily volume profile. Several other tools already provide that, including TradingView’s built-in Volume Profile indicators. Instead, this indicator focuses on pairing a rolling, short-term volume distribution with a session-wide distribution to make ranges more explicit. It is designed to supplement your use of standard or periodic volume profiles, not replace them. Think of it as a magnifying lens that helps you see where local structure aligns with the broader session.
How to trade it (TL;DR)
Fade overlapping VA bands on first rejection → target POC.
Continue through LVN on acceptance beyond VA → target next node’s VA/POC.
Respect acceptance: ≥3 closes beyond VA + growing outer-bin volume = regime change.
FAQ
Q: Why 68% Value Area?
A: It mirrors the “~1σ” idea, but we compute it exactly from empirical volume, not by assuming a normal distribution.
Q: Why are my profiles thin lines?
A: Increase Bars Line Width for chunkier blocks; reduce for fine, thin-line profiles.
Q: Session bars don’t reach session start—why?
A: Set Session Max Span (bars) = 0 for full anchoring; any positive value draws a rolling window while still measuring from session start.
Changelog (v1.0)
Dual profiles: Rolling + Session with independent POC/VA lines.
Session anchoring (Premkt/RTH/AH) with optional rolling display span.
Dynamic coloring for the rolling profile (buying vs selling).
Fully modular toggles + per-feature colors/widths.
Thin-line rendering via bar line width.

52SIGNAL RECIPE Coinbase Institutional Smart Money DetectorCoinbase Institutional Smart Money Detector
◆ Overview
Coinbase Institutional Smart Money Detector is an innovative indicator that detects the buying and selling movements of institutional investors through Coinbase Prime in real-time. This powerful tool tracks the flow of funds from large institutions to provide valuable signals before significant market direction changes occur. It can be applied to Bitcoin charts on any exchange, allowing traders to follow the "smart money" movements of institutions anytime, anywhere.
The unique strength of this indicator lies in its comprehensive assessment of institutional investors' consecutive trading behaviors, volume patterns, and trend strength by analyzing Coinbase data in real-time. By providing clear visual representation of institutional fund flow data that is difficult for ordinary traders to access, you gain the opportunity to move alongside the big players in the market.
─────────────────────────────────────
◆ Key Features
• Coinbase Prime Data Analysis: Tracks institutional movements in real-time by analyzing data from Coinbase Prime, an institutional-only service
• Real-time Institutional Fund Flow Monitoring: Immediately detects large institutions' spot buying/selling activities, allowing positioning ahead of the market
• Universal Exchange Compatibility: Applicable to Bitcoin charts on any exchange, enabling use on your preferred trading platform
• Institutional Continuity Analysis: Identifies continuous institutional activity by tracking consecutive buying/selling patterns
• Smart Volume Analysis: Detects increased volume compared to averages and analyzes key trading time periods
• Trend Strength Measurement: Quantifies and displays the strength of upward/downward trends by analyzing candle patterns
• Intuitive Visualization: Clearly marks institutional activity points on charts through bar coloring and labels
• Real-time Strength Display: Calculates and displays current trend strength in a table in real-time
• Customizable Settings: Allows customization of key parameters to match your trading style
─────────────────────────────────────
◆ Understanding Signal Types
■ Institutional Buy Signal
• Definition: Occurs when institutional investors show consecutive buying activity through Coinbase Prime, accompanied by increased volume and strong upward trend
• Visual Representation: Translucent blue bar coloring and "Institution Buying Detected!" label on the candle where the buy signal occurs
• Market Interpretation: Indicates that institutional investors are actively buying spot Bitcoin, which is likely to lead to price increases
• Signal Strength Factors:
▶ Consecutive price increase patterns
▶ Above-average volume
▶ Strong upward trend strength measurement
▶ Significant price movement
■ Institutional Sell Signal
• Definition: Occurs when institutional investors show consecutive selling activity through Coinbase Prime, accompanied by increased volume and strong downward trend
• Visual Representation: Translucent pink bar coloring and "Institution Selling Detected!" label on the candle where the sell signal occurs
• Market Interpretation: Indicates that institutional investors are actively selling spot Bitcoin, which is likely to lead to price decreases
• Signal Strength Factors:
▶ Consecutive price decrease patterns
▶ Above-average volume
▶ Strong downward trend strength measurement
▶ Significant price movement
─────────────────────────────────────
◆ Understanding Trend Strength
■ Trend Strength Measurement Method
• Definition: Measures trend strength by analyzing the ratio of up/down candles over a recent period
• Visual Representation: Displayed in the table as "BULL STRENGTH" or "BEAR STRENGTH" with percentage value and "STRONG" or "WEAK" status
• Strength Threshold: Strong/weak determination according to user-configurable threshold
• Calculation Method:
▶ Upward trend strength = (Number of upward candles) / (Total analysis period)
▶ Downward trend strength = (Number of downward candles) / (Total analysis period)
▶ Displayed as "STRONG" when strength is above threshold, "WEAK" when below
■ Utilizing Trend Strength
• Signal Filtering: Generates signals only when trend strength is strong, reducing false signals
• Trend Confirmation: Evaluates the health and sustainability of the current market trend
• Entry/Exit Decisions: Consider entering in strong trends and exiting when trends weaken
• Risk Management: Develop strategies to reduce position size in weak trends and increase in strong trends
─────────────────────────────────────
◆ Practical Trading Applications
■ Institutional Buy Signal Strategy
• Trend Reversal Scenario:
▶ Setup: Strong institutional buy signal during a downtrend
▶ Entry: Buy after signal confirmation in the next candle
▶ Stop Loss: Below the low of the signal candle
▶ Take Profit: When reaching previous major resistance or when trend strength weakens
• Trend Continuation Scenario:
▶ Setup: Institutional buy signal after correction in an uptrend
▶ Entry: Buy after signal confirmation
▶ Stop Loss: Below recent major low
▶ Take Profit: Gradually take profits considering trend strength
■ Institutional Sell Signal Strategy
• Trend Reversal Scenario:
▶ Setup: Strong institutional sell signal during an uptrend
▶ Entry: Sell after signal confirmation in the next candle
▶ Stop Loss: Above the high of the signal candle
▶ Take Profit: When reaching previous major support or when trend strength weakens
• Trend Continuation Scenario:
▶ Setup: Institutional sell signal after bounce in a downtrend
▶ Entry: Sell after signal confirmation
▶ Stop Loss: Above recent major high
▶ Take Profit: Gradually take profits considering trend strength
■ Multi-Timeframe Approach
• Higher Timeframe Direction Confirmation:
▶ Check institutional signals and trend strength on daily/4-hour charts
▶ Use for setting main trading direction
• Lower Timeframe Entry Point Finding:
▶ Wait for lower timeframe signals that align with higher timeframe direction
▶ Use for capturing precise entry points
• Cross-Timeframe Signal Alignment:
▶ Signal strength increases when signals occur in the same direction across multiple timeframes
▶ Capture high-probability trading opportunities
─────────────────────────────────────
◆ Indicator Settings Guide
■ Main Setting Parameters
• Institutional Continuity Period:
▶ Purpose: Sets the period to check institutional consecutive buying/selling activity
▶ Lower value: Generates more signals, increases responsiveness
▶ Higher value: Reduces number of signals, increases reliability
• Trend Strength Threshold:
▶ Purpose: Sets the minimum threshold for determining strong trends
▶ Lower value: More signals, less filtering
▶ Higher value: Generates signals only in stronger trends, higher filtering
─────────────────────────────────────
◆ Synergy with Other Indicators
• Support/Resistance Levels:
▶ Institutional signals occurring at key support/resistance levels have higher probability
▶ Combination of key technical analysis levels and institutional activity provides powerful signals
• Moving Averages:
▶ Pay attention to institutional signals near key moving averages (50MA, 200MA)
▶ Strong trend change possibility when moving average crossovers coincide with institutional signals
• RSI/Momentum Indicators:
▶ Institutional buy signals in oversold conditions increase reversal probability
▶ Institutional sell signals in overbought conditions increase reversal probability
• Volume Profile:
▶ Institutional signals at high volume nodes confirm important price levels
▶ Institutional activity in key trading areas greatly impacts price direction
• Market Structure:
▶ Institutional signals near key market structures (higher highs/lows, lower highs/lows) suggest structural changes
▶ Coincidence of market structure changes and institutional activity indicates important trend turning points
─────────────────────────────────────
◆ Conclusion
Coinbase Institutional Smart Money Detector provides traders with valuable insights by tracking spot Bitcoin trading activities of institutional investors through Coinbase Prime in real-time. Because it can be applied to Bitcoin charts on any exchange, you can utilize it immediately on your preferred trading platform.
The core value of this indicator is providing intuitive visualization of institutional fund flow data that is difficult for ordinary traders to access. By comprehensively analyzing consecutive price movements, volume increases, and trend strength to capture institutional activity, you gain the opportunity to move alongside the big players in the market.
Clear buy/sell signals based on Coinbase Prime data and real-time trend strength measurements help traders quickly grasp market conditions and make strategic decisions. By integrating this powerful tool into your trading strategy, secure a competitive edge to understand where the market's smart money is flowing and position accordingly.
─────────────────────────────────────
※ Disclaimer: Like all trading tools, the Institutional Smart Money Detector should be used as a supplementary indicator and not relied upon exclusively for trading decisions. Past patterns of institutional behavior may not guarantee future market movements. Always employ appropriate risk management strategies in your trading.
Coinbase Institutional Smart Money Detector
◆ 개요
Coinbase Institutional Smart Money Detector는 코인베이스 프라임(Coinbase Prime)을 통한 기관 투자자들의 현물 비트코인 매수/매도 움직임을 실시간으로 감지하는 혁신적인 지표입니다. 이 강력한 도구는 대형 기관들의 자금 흐름을 추적하여 중요한 시장 방향 전환이 일어나기 전에 귀중한 신호를 제공합니다. 어떤 거래소의 비트코인 차트에도 적용 가능하여 트레이더들이 언제 어디서든 기관의 "스마트 머니" 움직임을 따라갈 수 있게 해줍니다.
이 지표의 독보적인 강점은 코인베이스 데이터를 실시간으로 분석하여 기관 투자자들의 연속적인 매매 행동, 거래량 패턴, 그리고 추세 강도를 종합적으로 평가한다는 점입니다. 일반 트레이더들이 접근하기 어려운 기관 자금 흐름 데이터를 시각적으로 명확하게 제공함으로써, 여러분은 시장의 큰 손들과 함께 움직일 수 있는 기회를 얻게 됩니다.
─────────────────────────────────────
◆ 주요 특징
• 코인베이스 프라임 데이터 분석: 기관 전용 서비스인 코인베이스 프라임의 데이터를 실시간으로 추적하여 기관의 움직임 포착
• 실시간 기관 자금 흐름 모니터링: 대형 기관들의 현물 매수/매도 활동을 즉각적으로 감지하여 시장에 앞서 포지셔닝 가능
• 모든 거래소 호환성: 어떤 거래소의 비트코인 차트에도 적용 가능하여 선호하는 트레이딩 플랫폼에서 활용 가능
• 기관 연속성 분석: 연속적인 매수/매도 패턴을 추적하여 기관의 지속적인 활동 식별
• 스마트 볼륨 분석: 평균 대비 거래량 증가를 감지하고 주요 거래 시간대를 분석
• 추세 강도 측정: 캔들 패턴을 분석해 상승/하락 추세의 강도를 수치화하여 표시
• 직관적 시각화: 바 컬러링과 라벨을 통해 기관 활동 지점을 차트에 명확하게 표시
• 실시간 강도 표시: 현재 추세의 강도를 실시간으로 계산하여 테이블에 표시
• 사용자 정의 설정: 주요 매개변수를 조정하여 자신의 트레이딩 스타일에 맞게 커스터마이징 가능
─────────────────────────────────────
◆ 신호 유형 이해하기
■ 기관 매수 신호
• 정의: 코인베이스 프라임을 통해 기관 투자자들이 연속적인 매수 활동을 보이며, 이와 함께 거래량 증가와 강한 상승 추세가 나타날 때 발생
• 시각적 표현: 매수 신호가 발생한 캔들에 반투명 파란색 바 컬러링과 함께 "Institution Buying Detected!" 라벨 표시
• 시장 해석: 기관 투자자들이 적극적으로 현물 비트코인을 매수하고 있으며, 이는 곧 가격 상승으로 이어질 가능성이 높음을 의미
• 신호 강도 요소:
▶ 연속적인 가격 상승 패턴
▶ 평균보다 높은 거래량
▶ 강한 상승 추세 강도 측정값
▶ 유의미한 가격 변동
■ 기관 매도 신호
• 정의: 코인베이스 프라임을 통해 기관 투자자들이 연속적인 매도 활동을 보이며, 이와 함께 거래량 증가와 강한 하락 추세가 나타날 때 발생
• 시각적 표현: 매도 신호가 발생한 캔들에 반투명 분홍색 바 컬러링과 함께 "Institution Selling Detected!" 라벨 표시
• 시장 해석: 기관 투자자들이 적극적으로 현물 비트코인을 매도하고 있으며, 이는 곧 가격 하락으로 이어질 가능성이 높음을 의미
• 신호 강도 요소:
▶ 연속적인 가격 하락 패턴
▶ 평균보다 높은 거래량
▶ 강한 하락 추세 강도 측정값
▶ 유의미한 가격 변동
─────────────────────────────────────
◆ 추세 강도 이해하기
■ 추세 강도 측정 방식
• 정의: 최근 일정 기간 동안의 상승/하락 캔들 비율을 분석하여 추세의 강도를 측정
• 시각적 표현: 테이블에 "BULL STRENGTH" 또는 "BEAR STRENGTH"로 표시되며, 백분율 값과 함께 "STRONG" 또는 "WEAK" 상태 표시
• 강도 임계값: 사용자가 설정 가능한 임계값에 따라 강함/약함 판정
• 계산 방식:
▶ 상승 추세 강도 = (상승 캔들 수) / (전체 분석 기간)
▶ 하락 추세 강도 = (하락 캔들 수) / (전체 분석 기간)
▶ 강도가 임계값 이상일 때 "STRONG", 미만일 때 "WEAK"로 표시
■ 추세 강도의 활용
• 신호 필터링: 추세 강도가 강할 때만 신호를 생성하여 허위 신호 감소
• 추세 확인: 현재 시장 추세의 건전성과 지속 가능성 평가
• 진입/퇴출 결정: 강한 추세에서 진입하고 약한 추세로 전환될 때 퇴출 고려
• 리스크 관리: 약한 추세에서는 포지션 크기를 줄이고, 강한 추세에서는 늘리는 전략 수립 가능
─────────────────────────────────────
◆ 실전 트레이딩 응용
■ 기관 매수 신호 활용 전략
• 추세 전환 시나리오:
▶ 설정: 하락 추세 중 강한 기관 매수 신호 발생
▶ 진입: 신호 확인 후 다음 캔들에서 매수
▶ 손절: 신호 캔들의 저점 아래
▶ 이익실현: 이전 주요 저항선 도달 시 또는 추세 강도가 약해질 때
• 추세 지속 시나리오:
▶ 설정: 상승 추세 중 조정 후 기관 매수 신호 발생
▶ 진입: 신호 확인 후 매수
▶ 손절: 최근 주요 저점 아래
▶ 이익실현: 추세 강도를 고려하여 단계적으로 이익실현
■ 기관 매도 신호 활용 전략
• 추세 전환 시나리오:
▶ 설정: 상승 추세 중 강한 기관 매도 신호 발생
▶ 진입: 신호 확인 후 다음 캔들에서 매도
▶ 손절: 신호 캔들의 고점 위
▶ 이익실현: 이전 주요 지지선 도달 시 또는 추세 강도가 약해질 때
• 추세 지속 시나리오:
▶ 설정: 하락 추세 중 반등 후 기관 매도 신호 발생
▶ 진입: 신호 확인 후 매도
▶ 손절: 최근 주요 고점 위
▶ 이익실현: 추세 강도를 고려하여 단계적으로 이익실현
■ 다중 시간프레임 접근법
• 상위 시간프레임 방향성 확인:
▶ 일봉/4시간봉에서 기관 신호 및 추세 강도 확인
▶ 주 트레이딩 방향 설정에 활용
• 하위 시간프레임 진입점 찾기:
▶ 상위 시간프레임 방향과 일치하는 하위 시간프레임 신호 대기
▶ 정밀한 진입점 포착에 활용
• 시간프레임 간 신호 일치 확인:
▶ 여러 시간프레임에서 동일한 방향의 신호가 발생할 때 신호 강도 증가
▶ 높은 확률의 트레이딩 기회 포착
─────────────────────────────────────
◆ 지표 설정 가이드
■ 주요 설정 매개변수
• Institutional Continuity Period (기관 연속성 확인 기간):
▶ 목적: 기관의 연속적인 매수/매도 활동을 확인할 기간 설정
▶ 낮은 값: 더 많은 신호 생성, 반응성 증가
▶ 높은 값: 신호 수 감소, 신뢰성 증가
• Trend Strength Threshold (추세 강도 임계값):
▶ 목적: 추세가 강하다고 판단할 최소 임계값 설정
▶ 낮은 값: 더 많은 신호, 낮은 필터링
▶ 높은 값: 더 강한 추세에서만 신호 생성, 높은 필터링
─────────────────────────────────────
◆ 다른 지표와의 시너지
• 지지/저항 레벨:
▶ 주요 지지/저항 레벨에서 발생하는 기관 신호는 확률이 더 높음
▶ 기술적 분석의 핵심 레벨과 기관 활동의 결합은 강력한 시그널 제공
• 이동평균선:
▶ 주요 이동평균선(50MA, 200MA) 근처에서 발생하는 기관 신호 주목
▶ 이동평균선 돌파와 기관 신호가 일치할 때 강한 추세 변화 가능성
• RSI/모멘텀 지표:
▶ 과매수/과매도 상태에서 발생하는 기관 신호는 반전 가능성 높임
▶ 모멘텀 다이버전스와 기관 신호의 일치는 강력한 반전 신호
• 볼륨 프로파일:
▶ 높은 볼륨 노드에서 발생하는 기관 신호는 중요한 가격 레벨 확인
▶ 주요 거래 영역에서의 기관 활동은 가격 방향에 큰 영향 미침
• 시장 구조:
▶ 주요 시장 구조(높은 고점/저점, 낮은 고점/저점) 근처에서 발생하는 기관 신호는 구조 변화 암시
▶ 시장 구조 변화와 기관 활동의 일치는 중요한 추세 전환점 표시
─────────────────────────────────────
◆ 결론
Coinbase Institutional Smart Money Detector는 코인베이스 프라임을 통한 기관 투자자들의 현물 비트코인 거래 활동을 실시간으로 추적하여 트레이더들에게 귀중한 통찰력을 제공합니다. 어떤 거래소의 비트코인 차트에도 적용 가능하기 때문에, 여러분이 선호하는 트레이딩 플랫폼에서 바로 활용할 수 있습니다.
이 지표의 핵심 가치는 일반 트레이더들이 접근하기 어려운 기관 자금 흐름 데이터를 직관적으로 시각화하여 제공한다는 점입니다. 연속적인 가격 움직임, 거래량 증가, 그리고 추세 강도를 종합적으로 분석하여 기관의 활동을 포착함으로써, 여러분은 시장의 큰 손들과 함께 움직일 수 있는 기회를 얻게 됩니다.
코인베이스 프라임 데이터를 기반으로 한 명확한 매수/매도 신호와 실시간 추세 강도 측정은 트레이더들이 시장 상황을 한눈에 파악하고 신속하게 전략적 결정을 내릴 수 있게 도와줍니다. 이 강력한 도구를 여러분의 트레이딩 전략에 통합함으로써, 시장의 스마트 머니가 어디로 흘러가는지 파악하고 그에 따라 포지셔닝할 수 있는 경쟁 우위를 확보하세요.
─────────────────────────────────────
※ 면책 조항: 모든 트레이딩 도구와 마찬가지로, Institutional Smart Money Detector는 보조 지표로 사용해야 하며 트레이딩 결정을 전적으로 의존해서는 안 됩니다. 과거의 기관 행동 패턴이 미래 시장 움직임을 보장하지는 않습니다. 항상 적절한 리스크 관리 전략을 트레이딩에 활용하세요.

Neuracap Gap AnalysisThe Neuracap Gap Analysis indicator is a comprehensive tool designed to identify and track price gaps, special candlestick patterns, and high-volume breakout signals. It combines multiple trading strategies into one powerful indicator for gap trading, pattern recognition, and momentum analysis.
🎯 What This Indicator Does
1. Gap Detection & Tracking
Automatically identifies price gaps (up and down)
Tracks gap fills with visual boxes that extend until closed
Manages gap history with customizable limits
Color-coded visualization (Green = Gap Up, Red = Gap Down)
2. Upside Tasuki Gap Pattern
Identifies the bullish continuation pattern
Colors candles yellow when pattern is detected
Confirms trend continuation signals
3. Episodic Pivot Detection
High-volume breakout identification
EMA filter ensures signals only in uptrends
Strong momentum confirmation
Fuchsia-colored candles with arrow markers
🔍 How to Use for Trading
📈 Gap Trading Strategy
Gap Up Trading:
Wait for gap up (green box appears)
Check volume - Higher volume = stronger signal
Entry options:
Aggressive: Enter at market open
Conservative: Wait for pullback to gap level
Stop loss: Below the gap fill level
Target: Previous resistance or 2:1 risk/reward
Gap Down Trading:
Identify gap down (red box appears)
Look for bounce opportunities
Entry: When price shows reversal signs
Stop: Below recent lows
Target: Gap fill level
💫 Tasuki Gap Strategy
Yellow candle indicates bullish continuation
Confirms uptrend is likely to continue
Entry: On next candle after pattern
Stop: Below the gap low
Target: Next resistance level
🚀 Episodic Pivot Strategy
Fuchsia candle + arrow = High probability breakout
All conditions met:
Price above EMA 20, 50, 200
High volume (2x+ average)
Strong price move (4%+)
Entry: At close or next open
Stop: Below EMA 20 or recent swing low
Target: Measured move or next resistance
📊 Reading the Visual Signals
Gap Boxes
🟢 Green Box: Gap up - potential bullish continuation
🔴 Red Box: Gap down - potential bounce or bearish continuation
Box extends until gap is filled
Box disappears when gap closes
Candle Colors
🟡 Yellow: Tasuki gap pattern (bullish continuation)
🟪 Fuchsia: Episodic pivot (high-volume breakout)
⬜ Normal: No special pattern detected
Arrows & Markers
⬆️ Triangle Arrow: Episodic pivot confirmation
💡 Trading Tips & Best Practices
✅ Do's
Combine with trend analysis - Trade gaps in direction of trend
Check volume - Higher volume = more reliable signals
Use multiple timeframes - Confirm on higher timeframes
Risk management - Always set stop losses
Wait for confirmation - Don't chase, let signals develop
❌ Don'ts
Don't trade all gaps - Focus on high-quality setups
Avoid low volume - Weak volume = unreliable signals
Don't ignore trend - Counter-trend trading is risky
Don't overtrade - Quality over quantity
Don't ignore context - Consider market conditions
⚠️ Risk Management
Position sizing: Risk 1-2% per trade
Stop losses: Always define before entry
Target levels: Set realistic profit targets
Market conditions: Avoid trading in choppy markets
📈 Performance Optimization
For Conservative Traders:
Increase minimum gap size to 1%
Set volume multiplier to 3.0x
Only trade episodic pivots in strong uptrends
Wait for gap fill confirmation
For Aggressive Traders:
Decrease minimum gap size to 0.3%
Set volume multiplier to 1.5x
Trade both gap types
Enter on pattern confirmation
🚨 Alert Setup
The indicator provides alerts for:
Gap Up Detected
Gap Down Detected
Upside Tasuki Gap
Episodic Pivot
Recommended: Enable all alerts and filter manually based on your strategy.
📝 Summary
This indicator excels at identifying high-probability trading opportunities through gap analysis, pattern recognition, and momentum confirmation. Use it as part of a complete trading system with proper risk management for best results.

Gann Ultimate Time-Price Squares Method V 1.0This Script is an outcome of my Passion towards Gann Theory and his Methodology towards Trading.
The Script is still Evolving.So wait for more updates....
# Complete Trading Guide: Gann Time-Price Squares Indicator
## 🎯 Core Trading Philosophy
**Gann's Key Principle**: "When time and price come together, a change in trend occurs."
Your indicator identifies these critical moments where **Time = Price**, creating high-probability trading opportunities.
---
## 📊 Setup & Configuration
### Recommended Settings by Timeframe
| Timeframe | Pivot Lookback | Min Price Move | Tolerance | Use Case |
|-----------|---------------|----------------|-----------|----------|
| **1-5 min** | 5-8 bars | 0.5-1.0 | 1.0-2.0 | Scalping |
| **15-30 min** | 8-12 bars | 1.0-3.0 | 1.5-2.5 | Day Trading |
| **1-4 hour** | 10-15 bars | 2.0-5.0 | 2.0-3.0 | Swing Trading |
| **Daily** | 15-25 bars | 5.0-20.0 | 3.0-5.0 | Position Trading |
### Initial Setup Steps
1. **Add indicator** to your chart
2. **Set lookback period** based on your timeframe
3. **Adjust tolerance** - start with 2.0 and fine-tune
4. **Enable all visualizations** initially
5. **Position info table** where it doesn't block price action
---
## 🚀 Trading Strategies
### Strategy 1: Square Completion Reversal Trading
#### **Long Entry Setup**
```
CONDITIONS:
✅ Bullish square completes (green box appears)
✅ Info table shows "✅ COMPLETED" status
✅ Price bounces off square's bottom edge
✅ Volume increases on bounce
✅ RSI < 30 (oversold confirmation)
ENTRY: Market buy when price breaks above square's top edge
STOP: Below square's bottom edge (-2 ATR)
TARGET: Next resistance level or 1:2 Risk/Reward
```
#### **Short Entry Setup**
```
CONDITIONS:
✅ Bearish square completes (red box appears)
✅ Info table shows "✅ COMPLETED" status
✅ Price rejects square's top edge
✅ Volume increases on rejection
✅ RSI > 70 (overbought confirmation)
ENTRY: Market sell when price breaks below square's bottom edge
STOP: Above square's top edge (+2 ATR)
TARGET: Next support level or 1:2 Risk/Reward
```
### Strategy 2: Gann Angle Trend Following
#### **1x1 Angle (45°) - The Master Angle**
- **Most Important**: This is Gann's primary trend line
- **Bullish**: Price above 1x1 = uptrend intact
- **Bearish**: Price below 1x1 = downtrend intact
- **Break**: 1x1 angle break = major trend change
#### **Multi-Angle Confluence Trading**
```
STRONG BULLISH SIGNAL:
✅ Price above 1x1 angle (45°)
✅ Bouncing off 2x1 angle (support)
✅ Volume increasing
✅ Multiple angles pointing up
ENTRY: Buy on 2x1 angle bounce
STOP: Below 1x2 angle
TARGET: Next angle resistance
```
### Strategy 3: Projection Trading (Forming Squares)
#### **Anticipation Strategy**
```
SETUP IDENTIFICATION:
👀 Info table shows "⚡ FORMING" status
👀 Progress bar > 70%
👀 P/T Ratio approaching 1.00
👀 Price approaching projected completion zone
ENTRY PREPARATION:
- Set alerts for projected completion levels
- Prepare for reversal at projection zone
- Watch for volume confirmation
- Monitor momentum indicators
```
## 📈 Step-by-Step Trading Process
### Phase 1: Market Analysis (Before Trading)
1. **Check Market Trend**: Look at info table trend indicator
2. **Identify Active Pivots**: Note last significant high/low
3. **Assess Volatility**: High volatility = larger stops needed
4. **Review Completed Squares**: These become support/resistance zones
### Phase 2: Trade Setup Identification
1. **Monitor Forming Squares**: Watch progress bars in info table
2. **Check Gann Angles**: Are they supporting or opposing your bias?
3. **Confirm with Volume**: Look for volume spikes at key levels
4. **Set Alerts**: Use TradingView alerts for completion zones
### Phase 3: Trade Execution
1. **Wait for Confirmation**: Don't trade on projections alone
2. **Enter on Breakout**: Price breaking square boundaries
3. **Set Stops Immediately**: Use square edges as stop levels
4. **Scale Out**: Take partial profits at angle intersections
### Phase 4: Trade Management
1. **Trail Stops**: Use Gann angles as trailing stop levels
2. **Monitor Progress**: Watch for new square formations
3. **Exit Signals**: New squares in opposite direction
4. **Review Performance**: Analyze win/loss against square accuracy
---
## 🎯 High-Probability Setups
### Setup A: Double Confirmation
```
BULLISH EXAMPLE:
1. Bullish square completes at major support
2. Price bounces off 1x1 Gann angle
3. Volume surge confirms reversal
4. RSI divergence present
PROBABILITY: 75-80%
RISK/REWARD: 1:3 typical
```
### Setup B: Angle Breakout
```
BEARISH EXAMPLE:
1. Price breaks below 1x1 angle
2. Bearish square forming below break
3. Multiple angles now resistance
4. Volume confirms breakdown
PROBABILITY: 70-75%
RISK/REWARD: 1:2.5 typical
```
### Setup C: Time Cycle Convergence
```
REVERSAL EXAMPLE:
1. Square completion at time cycle high/low
2. Multiple Gann angles converging
3. Momentum divergence
4. Volume climax
PROBABILITY: 80-85%
RISK/REWARD: 1:4 possible
```
---
## ⚠️ Risk Management Rules
### Position Sizing
- **Conservative**: 1-2% risk per trade
- **Aggressive**: 2-3% risk per trade
- **Never exceed**: 5% total portfolio risk
### Stop Loss Guidelines
- **Completed Squares**: Opposite edge + 1 ATR
- **Gann Angles**: Below/above angle + 0.5 ATR
- **Projections**: 50% of square height
### Take Profit Targets
- **Target 1**: Next Gann angle (1:1 R/R)
- **Target 2**: Next completed square (1:2 R/R)
- **Target 3**: Major S/R level (1:3 R/R)
---
## 📊 Reading the Info Table for Trading
### Market Trend Section
```
📈 BULLISH → Look for long setups
📉 BEARISH → Look for short setups
➡️ NEUTRAL → Wait for direction
```
### Volatility Status
```
🔥 HIGH → Larger stops needed
⚡ ELEVATED → Normal stops
😴 LOW → Tighter stops possible
📊 NORMAL → Standard approach
```
### Square Progress Monitoring
```
✅ COMPLETED → Ready to trade
⚡ FORMING → Prepare for setup
🔥 ACTIVE → Monitor closely
⏳ WAITING → No immediate action
```
### P/T Ratio Interpretation
```
🎯 Perfect (0.8-1.2) → High probability setup
⚡ Good (0.6-1.4) → Moderate probability
⚠️ Watch (outside range) → Lower probability
```
---
## 🔄 Common Trading Scenarios
### Scenario 1: Trend Continuation
**Setup**: Price pulls back to completed square in uptrend
**Action**: Buy at square support with 1x1 angle confirmation
**Management**: Trail stop below each new square formation
### Scenario 2: Reversal Trading
**Setup**: Multiple squares complete at major S/R
**Action**: Fade the move when price rejects square edges
**Management**: Quick profits, tight stops
### Scenario 3: Breakout Trading
**Setup**: Price consolidates in square, then breaks out
**Action**: Trade breakout direction with volume confirmation
**Management**: Use opposite square edge as stop
---
## 📱 Alert Setup Recommendations
### Critical Alerts
1. **Square Completion**: "Gann Square Completed - Check for reversal"
2. **1x1 Angle Break**: "Master angle broken - Trend change possible"
3. **Projection Reached**: "Forming square at 90% - Prepare for reversal"
4. **Multi-Angle Touch**: "Price at angle confluence - High probability setup"
---
Remember: **Gann analysis is both art and science**. The indicator provides the mathematical framework, but successful trading requires patience, discipline, and continuous learning. Start with small positions while you master the methodology!

Opening Range Breakout with John Wick + CDH/CDLOpening Range Breakout (ORB) De Luxe with John Wick Pattern - User Manual Table of Contents
1. Introduction
2. Key Features
3. Installation
4. Configuration Guide
5. Trading Signals
6. Pattern Recognition
7. Zone Trading
8. Alert Setup
9. Trading Strategies
10. Best Practices
11. Troubleshooting
________________________________________
1. Introduction The Opening Range Breakout (ORB) with John Wick indicator is a comprehensive trading tool designed for intraday and swing traders. It combines the classic Opening Range Breakout strategy with advanced candlestick pattern recognition, including the unique "John Wick" pattern. What is Opening Range Breakout? The Opening Range (OR) is the price range established during the first 15 minutes of a trading session. This range often acts as support and resistance for the remainder of the trading day. Breakouts above or below this range can signal strong directional moves. Key Concepts: • Opening Range High: The highest price during the first 15 minutes • Opening Range Low: The lowest price during the first 15 minutes • Breakout: Price movement above OR High (bullish) or below OR Low (bearish) • Pattern Zones: Areas around key levels where pattern recognition is most effective • PDH/PDL: Previous Day High and Previous Day Low - key reference levels from the prior trading day • CDH/CDL: Current Day High and Current Day Low - dynamically updating intraday extremes
________________________________________
2. Key Features Core Features: • Multi-Session Support: New York, London, Tokyo, Sydney, Frankfurt, and Custom sessions • Opening Range Visualization: Automatic OR High/Low detection and plotting • Pattern Recognition: Engulfing, Hammer/Shooting Star, Doji, and John Wick patterns • Zone Trading: Customizable zones around OR and PDH/PDL/CDH/CDL levels • Previous Day Levels: PDH (Previous Day High) and PDL (Previous Day Low) • Current Day Levels: CDH (Current Day High) and CDL (Current Day Low) - real-time tracking • Mid-Point Levels: Automatic calculation of OR mid-point • Real-Time Alerts: Breakout and pattern-based alerts • Multi-Timezone Support: Exchange or custom timezone selection Visual Features: • Dynamic color-coded levels • Triangle signals for breakouts • Pattern labels with clear identification • Information table with current session data • Fully customizable colors and styles
________________________________________
3. Installation Step 1: Add to Chart
4. Open TradingView and navigate to your desired chart
5. Click on "Indicators" (or press /)
6. Search for "Opening Range Breakout with John Wick"
7. Click to add the indicator to your chart Step 2: Initial Setup
8. The indicator will automatically detect your chart's timezone
9. Default session is set to "New York"
10. All features are enabled by default Recommended Timeframes: • Optimal: 1-minute to 15-minute charts • Suitable: Up to 1-hour charts • Not Recommended: Daily or higher timeframes
________________________________________
4. Configuration Guide Timezone Settings Use Exchange Timezone • Enabled (Default): Uses the exchange's native timezone • Disabled: Uses chart timezone or custom selection Timezone Selection Available when "Use Exchange Timezone" is disabled: • America/New_York • Europe/London • Europe/Amsterdam • Asia/Tokyo • Australia/Sydney Session Selection Trading Sessions • Sydney: 09:00-16:00 Sydney time • Tokyo: 09:00-15:00 Tokyo time • London: 08:00-16:30 London time • Frankfurt: 09:00-17:30 Frankfurt time • New York: 09:30-16:00 New York time • Custom: User-defined session • Previous Sessions: Shows multiple historical ORs Custom Session Settings • Custom Session Time: Define your own trading hours • Custom Session Name: Label for your custom session Display Options Line Settings • Line Width: 1-5 (Default: 2) • Line Style: Solid, Dashed, or Dotted • Show Current Only: Hide historical OR lines • Show Session Name: Display session label on chart Color Customization • OR Resistance (High): Default red • OR Support (Low): Default green • Session Colors: Unique color per session type • Zone Colors: Separate colors for OR and PDH/PDL zones Pattern Zone Settings Zone Configuration • Show Pattern Detection Zone: Enable/disable zones • OR Zone Size: Percentage of OR range (Default: 2%) • PDH/PDL Zone Size: Percentage of PDH-PDL range (Default: 1.5%) • CDH/CDL Zone Size: Percentage of CDH-CDL range (Default: 1.5%) • Show Zone Labels: Display zone boundary values • Only Detect Patterns in Zone: Limit pattern detection to zones Mid-Point Settings • Show Opening Range Mid-Point: Display OR midline • Mid-Point Color: Default gray • Mid-Point Style: Dotted, Dashed, or Solid • Show Mid-Point Label: Display midpoint value Previous Day Levels • Show Previous Day High/Low: Enable PDH/PDL lines • PDH/PDL Colors: Default yellow • PDH/PDL Line Style: Customizable style • Show PDH/PDL Labels: Display level values
Current Day Levels • Show Current Day High/Low: Enable CDH/CDL lines • CDH/CDL Colors: Default blue • CDH/CDL Line Style: Customizable style • Show CDH/CDL Labels: Display level values • Update Frequency: Real-time updates as new highs/lows are made
________________________________________
5. Trading Signals Signal Types
6. Breakout Signals • Bullish (Buy): Green triangle below candle when price breaks above OR High • Bearish (Sell): Red triangle above candle when price breaks below OR Low
7. Pattern-Enhanced Signals Signals are generated when breakouts occur WITH confirming patterns: • Stronger probability of follow-through • Reduced false breakouts • Better risk/reward setups Signal Configuration Alert Settings • Enable Alerts: Turn alerts on/off • Show Buy/Sell Signals: Visual signals on chart • Show Signal Text: Display "BUY"/"SELL" labels Pattern Filter Options • Use Candle Pattern Filter: Require patterns for signals • Pattern Combination Mode: o Any Pattern: Signal on any single pattern o Multiple Patterns: Require minimum pattern count o Specific Combo: Require specific pattern combinations
________________________________________
6. Pattern Recognition Supported Patterns
7. Engulfing Pattern • Bullish Engulfing: Large green candle completely engulfs previous red candle • Bearish Engulfing: Large red candle completely engulfs previous green candle • Label: "E"
8. Hammer/Shooting Star • Hammer: Small body at top, long lower wick (2x body size) • Shooting Star: Small body at bottom, long upper wick (2x body size) • Labels: "H" (Hammer), "S" (Shooting Star)
9. Doji Pattern • Definition: Open and close nearly equal (body < 10% of average) • Significance: Indecision, potential reversal • Label: "D"
10. John Wick Pattern (Unique Feature) • Bullish John Wick: o Opens below previous candle's low o 30-70% of body extends below previous low o Strong momentum indication • Bearish John Wick: o Opens above previous candle's high o 30-70% of body extends above previous high • Label: "JW" Pattern Visualization • Pattern Markers: Small circular labels with pattern abbreviations • Pattern Count: Number showing total patterns detected • Pattern Background: Optional highlighting (disabled by default) • Positioning: o Bullish patterns: Below candles at varying distances o Bearish patterns: Above candles at varying distances
________________________________________
7. Zone Trading Zone Concept Zones are buffer areas around key levels where price action and patterns are monitored more closely. Zone Types
8. Opening Range Zones • OR High Zone: Area around the OR High level • OR Low Zone: Area around the OR Low level • Purpose: Identify potential breakout or rejection areas
9. PDH/PDL Zones • PDH Zone: Area around Previous Day High • PDL Zone: Area around Previous Day Low • Purpose: Monitor reactions at key daily levels
10. CDH/CDL Zones • CDH Zone: Area around Current Day High • CDL Zone: Area around Current Day Low • Purpose: Track reactions at evolving intraday extremes • Dynamic Nature: These zones move as new highs/lows are established Zone Features • Visual Representation: Semi-transparent colored boxes • Customizable Size: Percentage-based calculation • Pattern Detection: Option to only detect patterns within zones • Bar Coloring: Candles change color when in zones Zone Trading Strategy
11. Wait for price to enter a zone
12. Look for pattern formation within the zone
13. Trade breakouts with pattern confirmation
14. Use zone boundaries as stop-loss references
________________________________________
8. Alert Setup Creating Alerts Step 1: Basic Alert Setup
9. Right-click on the chart
10. Select "Add Alert"
11. Choose "ORB The Luxe" from Condition dropdown
12. Select alert type Step 2: Alert Types • Any alert() function call: All indicator alerts • Crossed above OR High: Bullish breakout • Crossed below OR Low: Bearish breakout Alert Messages Alerts include: • Session name (e.g., "New York") • Direction (above/below) • Level crossed • Pattern detected (if applicable) • Zone information (if in zone) Alert Best Practices
13. Set alerts after the OR is established (15+ minutes into session)
14. Use pattern filters to reduce false signals
15. Consider zone alerts for higher probability setups
16. Set stop-loss alerts at opposite OR level
________________________________________
9. Trading Strategies Strategy 1: Classic ORB
10. Entry: o Long: Break above OR High o Short: Break below OR Low
11. Stop Loss: Opposite OR level
12. Target: 1:2 or 1:3 risk/reward
13. Best Time: First 2 hours after OR Strategy 2: ORB with Pattern Confirmation
14. Entry Requirements: o Breakout signal o At least one confirming pattern o Preferably within a zone
15. Stop Loss: Mid-point of OR
16. Target: Previous day's high/low or current day's high/low
17. Win Rate: Higher than classic ORB Strategy 3: Zone Rejection Trading
18. Setup: Price enters zone but fails to break OR
19. Entry: Reversal pattern in zone
20. Stop Loss: Just outside zone boundary
21. Target: Opposite OR level
22. Best For: Range-bound markets Strategy 4: Multi-Session Confluence
23. Look for: Alignment of multiple session ORs
24. Entry: Break of aligned levels
25. Confirmation: Pattern at confluence point
26. Target: Extended moves expected
27. Additional Edge: Watch for CDH/CDL tests during the session
Strategy 5: CDH/CDL Breakout Trading
1. Setup: Price approaches current day's high or low
2. Entry: Break and hold above CDH or below CDL
3. Confirmation: Volume increase or pattern formation
4. Stop Loss: Just inside the CDH/CDL level
5. Target: Measured move based on intraday range
6. Best For: Trending days with momentum Risk Management Rules • Position Size: Risk 1-2% per trade • Max Daily Loss: 3-5% of account • Avoid: First and last 15 minutes of session • Best Days: Tuesday through Thursday
________________________________________
10. Best Practices Do's:
• Wait for OR to be established (15 minutes)
• Use multiple confirmations (pattern + zone + volume)
• Trade in the direction of the larger trend
• Set alerts to avoid missing opportunities
• Keep a trading journal of ORB trades
• Adjust zones based on market volatility
• Use proper position sizing Don'ts:
• Trade immediately at market open
• Ignore the overall market context
• Trade every OR breakout
• Use in choppy/low volume markets
• Set stops too close to entry
• Trade against strong trends
• Over-leverage positions Market Conditions Best Performance: • Trending days • High volume sessions • Economic news days • Clear market sentiment Avoid During: • Low volume holidays • Extremely choppy conditions • Major uncertainty events • End of month/quarter repositioning
________________________________________
11. Troubleshooting Common Issues and Solutions Issue: No signals appearing Solutions: • Ensure "Show Buy/Sell Signals" is enabled • Check if pattern filter is too restrictive • Verify correct session is selected • Confirm market has broken OR levels Issue: Too many false signals Solutions: • Enable pattern filter requirement • Use "Multiple Patterns" mode • Trade only within zones • Increase zone size percentage Issue: Incorrect session times Solutions: • Check timezone settings • Verify exchange timezone option • Use custom session for specific needs • Ensure chart timeframe is appropriate Issue: Overlapping indicators Solutions: • Disable pattern markers if too cluttered • Turn off signal text • Hide PDH/PDL or CDH/CDL if not needed • Use "Show Current Only" option Performance Tips
12. Reduce Chart Load: Hide historical sessions
13. Clean View: Disable unused pattern types
14. Mobile Trading: Increase line widths for visibility
15. Multiple Monitors: Use different sessions per screen Getting Help • Check indicator settings tooltips • Test on demo account first • Document your settings for consistency • Join ORB trading communities for tips
________________________________________
Conclusion The Opening Range Breakout with John Wick indicator is a powerful tool that combines time-tested ORB strategies with advanced pattern recognition. Success comes from understanding each component, practicing proper risk management, and adapting the tool to your trading style. Remember: No indicator guarantees profits. Always use proper risk management and continuous education to improve your trading results. Happy Trading!
________________________________________
Version: 1.0 Last Updated: June 2025 Pine Script Version: 6
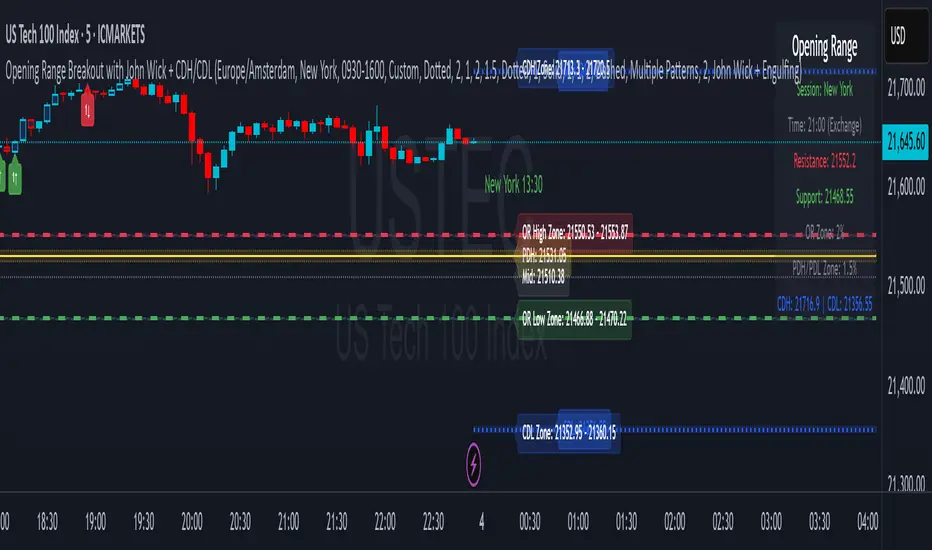
Intraday Macro & Flow Indicator# IntraMacroFlow Indicator
## Introduction
IntraMacroFlow is a volume and delta-based indicator that identifies significant price movements within trading sessions. It generates signals when volume spikes coincide with quality price movement, filtered by RSI to avoid overbought/oversold conditions.
> **Note:** This indicator provides multiple signals and should be combined with additional analysis methods such as support/resistance, trend direction, and price action patterns.
## Inputs
### Volume Settings
* **Volume Lookback Period** (14) - Number of bars for volume moving average calculation
* **Volume Threshold Multiplier** (1.5) - Required volume increase over average to generate signals
* **Delta Threshold** (0.3) - Required close-to-open movement relative to bar range (higher = stronger movement)
### Session Configuration
* **Use Dynamic Session Detection** (true) - Automatically determine session times
* **Highlight Market Open Period** (true) - Highlight first third of trading session
* **Highlight Mid-Session Period** (true) - Highlight middle portion of trading session
* **Detect Signals Throughout Whole Session** (true) - Find signals in entire session
* **Session Time** ("0930-1600") - Trading hours in HHMM-HHMM format
* **Session Type** ("Regular") - Select Regular, Extended, or Custom session
### Manual Session Settings
Used when dynamic detection is disabled:
* **Manual Session Open Hour** (9)
* **Manual Session Open Minute** (30)
* **Manual Session Open Duration** (60)
* **Manual Mid-Session Start Hour** (12)
* **Manual Mid-Session End Hour** (14)
## How It Works
The indicator analyzes each bar using three primary conditions:
1. **Volume Condition**: Current volume > Average volume × Threshold
2. **Delta Condition**: |Close-Open|/Range > Delta threshold
3. **Time Condition**: Bar falls within configured session times
When all conditions are met:
* Bullish signals appear when close > open and RSI < 70
* Bearish signals appear when close < open and RSI > 30
## Display Elements
### Shapes and Colors
* Green triangles below bars - Bullish signals
* Red triangles above bars - Bearish signals
* Blue background - Market open period
* Purple background - Mid-session period
* Bar coloring - Green (bullish), Red (bearish), or unchanged
### Information Panel
A dynamic label shows:
* Current volume relative to average (Vol)
* Delta value for current bar (Delta)
* RSI value (RSI)
* Session status (Active/Closed)
## Calculation Method
```
// Volume Condition
volumeMA = ta.sma(volume, lookbackPeriod)
volumeCondition = volume > volumeMA * volumeThreshold
// Delta Calculation (price movement quality)
priceRange = high - low
delta = math.abs(close - open) / priceRange
deltaCondition = delta > deltaThreshold
// Direction and RSI Filter
bullishBias = close > open and entrySignal and not (rsi > 70)
bearishBias = close < open and entrySignal and not (rsi < 30)
```
## Usage Recommendations
### Suitable Markets
* Equities during regular trading hours
* Futures markets
* Forex during active sessions
* Cryptocurrencies with defined volume patterns
### Recommended Timeframes
* 1-minute to 1-hour (optimal: 5 or 15-minute)
### Parameter Adjustments
* For fewer but stronger signals: increase Volume Threshold (2.0+) and Delta Threshold (0.4-0.6)
* For more signals: decrease Volume Threshold (1.2-1.5) and Delta Threshold (0.2-0.3)
### Usage Tips
* Combine with trend analysis for higher-probability entries
* Focus on signals occurring at session boundaries and mid-session
* Use opposite signals as potential exit points
* Configure alerts to receive notifications when signals occur
## Additional Notes
* RSI parameters are fixed at 14 periods with 70/30 thresholds
* The indicator handles overnight sessions correctly
* Fully compatible with TradingView alerts
* Customizable visual elements
## Release Notes
Initial release: This is a template indicator that should be customized to suit your specific trading strategies and preferences.

Money Flow Indicator (Chaikin Oscillator) with VWAPStrategy Overview
Entry Conditions:
Buy Entry:
The Chaikin Oscillator crosses above the signal line.
The current price is above the VWAP.
Sell Entry:
The Chaikin Oscillator crosses below the signal line.
The current price is below the VWAP.
Exit Conditions:
Profit Taking:
Take profit when a target profit is reached (e.g., a 2% increase from the entry price).
Stop Loss:
Set a stop loss, for example, at a 1% decline from the entry price.
Risk Management:
Manage risk by limiting each trade to no more than 1-2% of the account balance.
Calculate position size based on risk and trade accordingly.
Trend Confirmation:
Use other indicators (like moving averages) to confirm the overall trend and focus trades in the direction of the trend.
In an uptrend, prioritize buy entries; in a downtrend, prioritize sell entries.
Specific Trade Scenarios
Example 1: Buy Entry:
Enter a buy position when the Chaikin Oscillator crosses above the signal line and the price is above the VWAP.
Set a stop loss 1% below the entry price and a profit target 2% above the entry price.
Example 2: Sell Entry:
Enter a sell position when the Chaikin Oscillator crosses below the signal line and the price is below the VWAP.
Set a stop loss 1% above the entry price and a profit target 2% below the entry price.
Additional Considerations
Backtesting: Test this strategy with historical data to evaluate performance and make adjustments as needed.
Market Conditions: Pay attention to market volatility and economic indicators, adjusting the trading strategy flexibly.
Psychological Factors: Avoid emotional decisions and follow clear rules when trading.

Candlestick Pattern Detector - Vijay PrasadOverview:
This Pine Script v6 indicator is designed to detect and label key candlestick patterns on TradingView charts. It provides real-time visual markers for major bullish and bearish reversal signals, aiding traders in decision-making.
Usefulness:
✅ Saves time by automating candlestick pattern detection.
✅ Reduces manual chart analysis errors.
✅ Works across all markets & timeframes.
✅ Enhances trading strategies with accurate signals.
Candlestick Patterns Recognises:
Bullish Engulfing – A strong bullish reversal pattern.
Bearish Engulfing – Indicates a potential downtrend.
Hammer – Suggests a market bottom or reversal.
Shooting Star – A bearish reversal signal at the top of an uptrend.
Doji – Signals market indecision and possible trend change.
Key Functions:
Automated Pattern Visible
Identifies candlestick patterns dynamically and plots them on the chart.
Visual Labels for Patterns
Labels to indicate specific candlestick formations.
Labels appear only when a valid pattern is detected, avoiding unnecessary clutter.
Buy/Sell Signal
Plots buy signals at bullish patterns and sell signals at bearish patterns.
Helps traders recognize trend reversals and entry/exit points.
Bullish Engulfing Pattern (Green Label)
What it means: A bullish engulfing pattern typically signals a potential reversal from a downtrend to an uptrend. The current candle fully engulfs the previous candle, signaling strong buying interest.
Identifying Candlestick Patterns on the Chart
How to use it:
Entry: Look for a green label (bullish engulfing) at the bottom of the chart. When it appears, consider entering a long position (buy).
Confirmation: To increase reliability, wait for confirmation by observing if price moves above the high of the bullish engulfing candle.
Exit: Exit when the trend shows signs of reversing or take profit at predefined levels (e.g., resistance or a risk-to-reward ratio).
Bearish Engulfing Pattern (Red Label)
What it means: A bearish engulfing pattern is a signal of a potential reversal from an uptrend to a downtrend. The current candle fully engulfs the previous candle, signaling strong selling pressure.
How to use it:
Entry: Look for a red label (bearish engulfing) at the top of the chart. When it appears, consider entering a short position (sell).
Confirmation: Wait for the price to move below the low of the bearish engulfing candle to confirm the bearish trend.
Exit: Close the trade when the price reaches support levels or the trend shows signs of reversing.
Doji Pattern (Blue Circle)
What it means: A Doji candle signals market indecision. It represents a balance between buyers and sellers, often marking a potential reversal or consolidation point.
How to use it:
Entry: If the Doji appears after a strong trend (bullish or bearish), wait for the next candle to break above or below the Doji's high or low. This can signal a continuation or reversal.
Confirmation: You can look for additional indicators like moving averages, RSI, or MACD for confirmation before taking any action.
Exit: Exit when the price shows clear momentum in your entry direction.
Hammer Pattern (Orange Triangle)
What it means: The hammer pattern is a bullish reversal pattern that appears after a downtrend. It suggests that sellers pushed the price down during the session, but buyers managed to push the price back up.
How to use it:
Entry: When a hammer appears, consider entering a long position (buy). The price should move above the hammer's high for confirmation.
Confirmation: Look for strong volume and a follow-up bullish candle to confirm the reversal.
Exit: Set a target based on the next resistance level, or use a trailing stop to lock in profits.
Using Candlestick Patterns with Other Indicators
To increase your chances of success, combine candlestick patterns with other technical indicators.
Here are some ideas:
RSI (Relative Strength Index): Use RSI to check whether the market is overbought or oversold. A bullish engulfing in an oversold market could indicate a stronger buy signal, and a bearish engulfing in an overbought market could indicate a stronger sell signal.
Moving Averages (e.g., 50 EMA, 200 EMA): Confirm trend direction. If the candlestick pattern aligns with the direction of the moving averages, it can give a stronger signal.
MACD (Moving Average Convergence Divergence): Use MACD to confirm momentum and potential trend changes. If a candlestick pattern aligns with a MACD crossover, it strengthens the signal.
Volume: Look for higher-than-average volume when a pattern appears. This can give you additional confirmation that the market is reacting strongly.
Practice and Refine
It's important to practice using the candlestick patterns in a demo account or backtest them to see how they perform under different market conditions. Over time, you can adjust the settings and patterns to fit your trading style and preferences.

Multi-indicator Signal Builder [Skyrexio]Overview
Multi-Indicator Signal Builder is a versatile, all-in-one script designed to streamline your trading workflow by combining multiple popular technical indicators under a single roof. It features a single-entry, single-exit logic, intrabar stop-loss/take-profit handling, an optional time filter, a visually accessible condition table, and a built-in statistics label. Traders can choose any combination of 12+ indicators (RSI, Ultimate Oscillator, Bollinger %B, Moving Averages, ADX, Stochastic, MACD, PSAR, MFI, CCI, Heikin Ashi, and a “TV Screener” placeholder) to form entry or exit conditions. This script aims to simplify strategy creation and analysis, making it a powerful toolkit for technical traders.
Indicators Overview
1. RSI (Relative Strength Index)
Measures recent price changes to evaluate overbought or oversold conditions on a 0–100 scale.
2. Ultimate Oscillator (UO)
Uses weighted averages of three different timeframes, aiming to confirm price momentum while avoiding false divergences.
3. Bollinger %B
Expresses price relative to Bollinger Bands, indicating whether price is near the upper band (overbought) or lower band (oversold).
4. Moving Average (MA)
Smooths price data over a specified period. The script supports both SMA and EMA to help identify trend direction and potential crossovers.
5. ADX (Average Directional Index)
Gauges the strength of a trend (0–100). Higher ADX signals stronger momentum, while lower ADX indicates a weaker trend.
6. Stochastic
Compares a closing price to a price range over a given period to identify momentum shifts and potential reversals.
7. MACD (Moving Average Convergence/Divergence)
Tracks the difference between two EMAs plus a signal line, commonly used to spot momentum flips through crossovers.
8. PSAR (Parabolic SAR)
Plots a trailing stop-and-reverse dot that moves with the trend. Often used to signal potential reversals when price crosses PSAR.
9. MFI (Money Flow Index)
Similar to RSI but incorporates volume data. A reading above 80 can suggest overbought conditions, while below 20 may indicate oversold.
10. CCI (Commodity Channel Index)
Identifies cyclical trends or overbought/oversold levels by comparing current price to an average price over a set timeframe.
11. Heikin Ashi
A type of candlestick charting that filters out market noise. The script uses a streak-based approach (multiple consecutive bullish or bearish bars) to gauge mini-trends.
12. TV Screener
A placeholder condition designed to integrate external buy/sell logic (like a TradingView “Buy” or “Sell” rating). Users can override or reference external signals if desired.
Unique Features
1. Multi-Indicator Entry and Exit
You can selectively enable any subset of 12+ classic indicators, each with customizable parameters and conditions. A position opens only if all enabled entry conditions are met, and it closes only when all enabled exit conditions are satisfied, helping reduce false triggers.
2. Single-Entry / Single-Exit with Intrabar SL/TP
The script supports a single position at a time. Once a position is open, it monitors intrabar to see if the price hits your stop-loss or take-profit levels before the bar closes, making results more realistic for fast-moving markets.
3. Time Window Filter
Users may specify a start/end date range during which trades are allowed, making it convenient to focus on specific market cycles for backtesting or live trading.
4. Condition Table and Statistics
A table at the bottom of the chart lists all active entry/exit indicators. Upon each closed trade, an integrated statistics label displays net profit, total trades, win/loss count, average and median PnL, etc.
5. Seamless Alerts and Automation
Configure alerts in TradingView using “Any alert() function call.”
The script sends JSON alert messages you can route to your own webhook.
The indicator can be integrated with Skyrexio alert bots to automate execution on major cryptocurrency exchanges
6. Optional MA/PSAR Plots
For added visual clarity, optionally plot the chosen moving averages or PSAR on the chart to confirm signals without stacking multiple indicators.
Methodology
1. Multi-Indicator Entry Logic
When multiple entry indicators are enabled (e.g., RSI + Stochastic + MACD), the script requires all signals to align before generating an entry. Each indicator can be set for crossovers, crossunders, thresholds (above/below), etc. This “AND” logic aims to filter out low-confidence triggers.
2. Single-Entry Intrabar SL/TP
One Position At a Time: Once an entry signal triggers, a trade opens at the bar’s close.
Intrabar Checks: Stop-loss and take-profit levels (if enabled) are monitored on every tick. If either is reached, the position closes immediately, without waiting for the bar to end.
3. Exit Logic
All Conditions Must Agree: If the trade is still open (SL/TP not triggered), then all enabled exit indicators must confirm a closure before the script exits on the bar’s close.
4. Time Filter
Optional Trading Window: You can activate a date/time range to constrain entries and exits strictly to that interval.
Justification of Methodology
Indicator Confluence: Combining multiple tools (RSI, MACD, etc.) can reduce noise and false signals.
Intrabar SL/TP: Capturing real-time spikes or dips provides a more precise reflection of typical live trading scenarios.
Single-Entry Model: Straightforward for both manual and automated tracking (especially important in bridging to bots).
Custom Date Range: Helps refine backtesting for specific market conditions or to avoid known irregular data periods.
How to Use
1. Add the Script to Your Chart
In TradingView, open Indicators , search for “Multi-indicator Signal Builder”.
Click to add it to your chart.
2. Configure Inputs
Time Filter: Set a start and end date for trades.
Alerts Messages: Input any JSON or text payload needed by your external service or bot.
Entry Conditions: Enable and configure any indicators (e.g., RSI, MACD) for a confluence-based entry.
Close Conditions: Enable exit indicators, along with optional SL (negative %) and TP (positive %) levels.
3. Set Up Alerts
In TradingView, select “Create Alert” → Condition = “Any alert() function call” → choose this script.
Entry Alert: Triggers on the script’s entry signal.
Close Alert: Triggers on the script’s close signal (or if SL/TP is hit).
Skyrexio Alert Bots: You can route these alerts via webhook to Skyrexio alert bots to automate order execution on major crypto exchanges (or any other supported broker).
4. Visual Reference
A condition table at the bottom summarizes active signals.
Statistics Label updates automatically as trades are closed, showing PnL stats and distribution metrics.
Backtesting Guidelines
Symbol/Timeframe: Works on multiple assets and timeframes; always do thorough testing.
Realistic Costs: Adjust commissions and potential slippage to match typical exchange conditions.
Risk Management: If using the built-in stop-loss/take-profit, set percentages that reflect your personal risk tolerance.
Longer Test Horizons: Verify performance across diverse market cycles to gauge reliability.
Example of statistic calculation
Test Period: 2023-01-01 to 2025-12-31
Initial Capital: $1,000
Commission: 0.1%, Slippage ~5 ticks
Trade Count: 468 (varies by strategy conditions)
Win rate: 76% (varies by strategy conditions)
Net Profit: +96.17% (varies by strategy conditions)
Disclaimer
This indicator is provided strictly for informational and educational purposes .
It does not constitute financial or trading advice.
Past performance never guarantees future results.
Always test thoroughly in demo environments before using real capital.
Enjoy exploring the Multi-Indicator Signal Builder! Experiment with different indicator combinations and adjust parameters to align with your trading preferences, whether you trade manually or link your alerts to external automation services. Happy trading and stay safe!

Trading IQ - Razor IQIntroducing TradingIQ's first dip buying/shorting all-in-one trading system: Razor IQ.
Razor IQ is an exclusive trading algorithm developed by TradingIQ, designed to trade upside/downside price dips of varying significance in trending markets. By integrating artificial intelligence and IQ Technology, Razor IQ analyzes historical and real-time price data to construct a dynamic trading system adaptable to various asset and timeframe combinations.
Philosophy of Razor IQ
Razor IQ operates on a single premise: Trends must retrace, and these retracements offer traders an opportunity to join in the overarching trend. At some point traders will enter against a trend in aggregate and traders in profitable positions entered during the trend will scale out. When occurring simultaneously, a trend will retrace against itself, offering an opportunity for traders not yet in the trend to join in the move and continue the trend.
Razor IQ is designed to work straight out of the box. In fact, its simplicity requires just a few user settings to manage output, making it incredibly straightforward to manage.
Long Limit Order Stop Loss and Minimum ATR TP/SL are the only settings that manage the performance of Razor IQ!
Traders don’t have to spend hours adjusting settings and trying to find what works best - Razor IQ handles this on its own.
Key Features of Razor IQ
Self-Learning Retracement Detection
Employs AI and IQ Technology to identify notable price dips in real-time.
AI-Generated Trading Signals
Provides retracement trading signals derived from self-learning algorithms.
Comprehensive Trading System
Offers clear entry and exit labels.
Performance Tracking
Records and presents trading performance data, easily accessible for user analysis.
Self-Learning Trading Exits
Razor IQ learns where to exit positions.
Long and Short Trading Capabilities
Supports both long and short positions to trade various market conditions.
How It Works
Razor IQ operates on a straightforward heuristic: go long during the retracement of significant upside price moves and go short during the retracement of significant downside price moves.
IQ Technology, TradingIQ's proprietary AI algorithm, defines what constitutes a “trend” and a “retracement” and what’s considered a tradable dip buying/shorting opportunity. For Razor IQ, this algorithm evaluates all historical trends and retracements, how much trends generally retrace and how long trends generally persist. For instance, the "dip" following an uptrend is measured and learned from, including the significance of the identified trend level (how long it has been active, how much price has increased, etc). By analyzing these patterns, Razor IQ adapts to identify and trade similar future retracements and trends.
In simple terms, Razor IQ clusters previous trend and retracement data in an attempt to trade similar price sequences when they repeat in the future. Using this knowledge, it determines the optimal, current price level where joining in the current trend (during a retracement) has a calculated chance of not stopping out before trend continuation.
For long positions, Razor IQ enters using a market order at the AI-identified long entry price point. If price closes beneath this level a market order will be placed and a long position entered. Of course, this is how the algorithm trades, users can elect to use a stop-limit order amongst other order types for position entry. After the position is entered TP1 is placed (identifiable on the price chart). TP1 has a twofold purpose:
Acts as a legitimate profit target to exit 50% of the position.
Once TP1 is achieved, a stop-loss order is immediately placed at breakeven, and a trailing stop loss controls the remainder of the trade. With this, so long as TP1 is achieved, the position will not endure a loss. So long as price continues to uptrend, Razor IQ will remain in the position.
For short positions, Razor IQ provides an AI-identified short entry level. If price closes above this level a market order will be placed and a short position entered. Again, this is how the algorithm trades, users can elect to use a stop-limit order amongst other order types for position entry. Upon entry Razor IQ implements a TP order and SL order (identifiable on the price chart).
Downtrends, in most markets, usually operate differently than uptrends. With uptrends, price usually increases at a modest pace with consistency over an extended period of time. Downtrends behave in an opposite manner - price decreases rapidly for a much shorter duration.
With this observation, the long dip entry heuristic differs slightly from the short dip entry heuristic.
The long dip entry heuristic specializes in identifying larger, long-term uptrends and entering on retracement of the uptrends. With a dedicated trailing stop loss, so long as the uptrend persists, Razor IQ will remain in the position.
The short dip entry heuristic specializes in identifying sharp, significant downside price moves, and entering short on upside volatility during these moves. A fixed stop loss and profit target are implemented for short positions - no trailing stop is used.
As a trading system, Razor IQ exits all TP orders using a limit order, with all stop losses exited as stop market orders.
What Classifies As a Tradable Dip?
For Razor IQ, tradable price dips are not manually set but are instead learned by the system. What qualifies as an exploitable price dip in one market might not hold the same significance in another. Razor IQ continuously analyzes historical and current trends (if one exists), how far price has moved during the trend, the duration of the trend, the raw-dollar price move of price dips during trends, and more, to determine which future price retracements offer a smart chance to join in any current price trend.
The image above illustrates the Razor Line Long Entry point.
The green line represents the Long Retracement Entry Point.
The blue upper line represents the first profit target for the trade.
The blue lower line represents the trailing stop loss start point for the long position.
The position is entered once price closes below the green line.
The green Razor Lazor long entry point will only appear during uptrends.
The image above shows a long position being entered after the Long Razor Lazor was closed beneath.
Green arrows indicate that the strategy entered a long position at the highlighted price level.
Blue arrows indicate that the strategy exited a position, whether at TP1, the initial stop loss, or at the trailing stop.
Blue lines above the entry price indicate the TP1 level for the current long trade. Blue lines below the current price indicate the initial stop loss price.
If price reaches TP1, a stop loss will be immediately placed at breakeven, and the in-built trailing stop will determine the future exit price.
A blue line (similar to the blue line shown for TP1) will trail price and correspond to the trailing stop price of the trade.
If the trailing stop is above the breakeven stop loss, then the trailing stop will be hit before the breakeven stop loss, which means the remainder of the trade will be exited at a profit.
If the breakeven stop loss is above the trailing stop, then the breakeven stop loss will be hit first. In this case, the remainder of the position will be exited at breakeven.
The image above shows the trailing stop price, represented by a blue line, and the breakeven stop loss price, represented by a pink line, used for the long position!
You can also hover over the trade labels to get more information about the trade—such as the entry price and exit price.
The image above exemplifies Razor IQ's output when a downtrend is active.
When a downtrend is active, Razor IQ will switch to "short mode". In short mode, Razor IQ will display a neon red line. This neon red line indicates the Razor Lazor short entry point. When price closes above the red Razor Lazor line a short position is entered.
The image above shows Razor IQ during an active short position.
The image above shows Razor IQ after completing a short trade.
Red arrows indicate that the strategy entered a short position at the highlighted price level.
Blue arrows indicate that the strategy exited a position, whether at the profit target or the fixed stop loss.
Blue lines indicate the profit target level for the current trade when below price. and blue lines above the current price indicate the stop loss level for the short trade.
Short traders do not utilize a trailing stop - only a fixed profit target and fixed stop loss are used.
You can also hover over the trade labels to get more information about the trade—such as the entry price and exit price.
Minimum Profit Target And Stop Loss
The Minimum ATR Profit Target and Minimum ATR Stop Loss setting control the minimum allowed profit target and stop loss distance. On most timeframes users won’t have to alter these settings; however, on very-low timeframes such as the 1-minute chart, users can increase these values so gross profits exceed commission.
After changing either setting, Razor IQ will retrain on historical data - accounting for the newly defined minimum profit target or stop loss.
AI Direction
The AI Direction setting controls the trade direction Razor IQ is allowed to take.
“Trade Longs” allows for long trades.
“Trade Shorts” allows for short trades.
Verifying Razor IQ’s Effectiveness
Razor IQ automatically tracks its performance and displays the profit factor for the long strategy and the short strategy it uses. This information can be found in the table located in the top-right corner of your chart showing.
This table shows the long strategy profit factor and the short strategy profit factor.
The image above shows the long strategy profit factor and the short strategy profit factor for Razor IQ.
A profit factor greater than 1 indicates a strategy profitably traded historical price data.
A profit factor less than 1 indicates a strategy unprofitably traded historical price data.
A profit factor equal to 1 indicates a strategy did not lose or gain money when trading historical price data.
Using Razor IQ
While Razor IQ is a full-fledged trading system with entries and exits - manual traders can certainly make use of its on chart indications and visualizations.
The hallmark feature of Razor IQ is its ability to signal an acceptable dip entry opportunity - for both uptrends and downtrends. Long entries are often signaled near the bottom of a retracement for an uptrend; short entries are often signaled near the top of a retracement for a downtrend.
Razor IQ will always operate on exact price levels; however, users can certainly take advantage of Razor IQ's trend identification mechanism and retracement identification mechanism to use as confluence with their personally crafted trading strategy.
Of course, every trend will reverse at some point, and a good dip buying/shorting strategy will often trade the reversal in expectation of the prior trend continuing (retracement). It's important not to aggressively filter retracement entries in hopes of avoiding an entry when a trend reversal finally occurs, as this will ultimately filter out good dip buying/shorting opportunities. This is a reality of any dip trading strategy - not just Razor IQ.
Of course, you can set alerts for all Razor IQ entry and exit signals, effectively following along its systematic conquest of price movement.
Script a pagamento

ICSM (Impulse-Correction & SCOB Mapper) [WinWorld]DESCRIPTION
ICSM (Impulse-Correction SCOB Mapper) is the indicator that analyzes the price movement and identifies valid impulses, corrections and SCOBs. It is a powerful tool that can be used with any type of technical analysis because it's flexible, informative, easy to use and it does substantially improve trader's awareness of the most liquid zones of interest.
SETTINGS
General | Visuals
Colour theme — defines the colour theme of the ICSM.
SCOB | Visuals
Show SCOB — enables/disables SCOB;
Mark SCOB with — represents a list of style options for SCOB representation;
SCOB colour — defines the colour of the SCOB;
ICM | Visuals
Show ICM lines — enables/disables ICM (Impulse-Correction Mapper) lines;
Show IC trend — enables/disables visualization of impulse-correction trend via coloured divider at the bottom of the chart;
Line colour — defines the colour of the ICM lines;
Line style — defines the style of the ICM lines;
Alerts
ICM — enables/disables alert for breaking ICM lines;
SCOB — enables/disables alert for SCOB creation;
ICM+SCOB — enables/disables alert for SCOB occurance at the end of the single impulse/correction, which grabs ICM line's liquidity.
ICM+SCOB (same candle) — enables/disables alert for SCOB occurance at the candle, which grabs ICM line's liquidity.
IMPORTANT CONCEPTS
In order to fully understand what ICSM can do, let's do a quick overview of the most important concepts that this indicator is built on.
By ICM we mean the liquidity grabbing of Impulse-Correction Mapper's lines (ICM lines; represented as dashed horizontal lines on the chart ). Saying shortly, liquidity grabs of ICM lines posses great opportunities for finding great entries.
SCOB (Single Candle Order Block) builds up by 3 simple rules:
Previous candle's liquidity is grabbed;
Current candle closes inside previous candle;
Imbalance occurs on the next candle.
SCOB is a quite useful zone of interest, from which the price usually reverses. You can also use SCOB as POI* on HTF** or as entry zone on LTF***.
* POI — Point Of Interest
* HTF — Higher TimeFrame
* LTF — Lower TimeFrame
"ICM+SCOB" is a short name that we use for event, at which price first grabs the liquidity from ICM line and then creates a SCOB at the same impulse/correction movement ( on the same ICM line, that does the liquidity grab ). Usually the SCOB that occurs after this event represents a highly liquid zone of interest , which should be considered when choosing entry level.
"ICM+SCOB (same candle)" is basically the same as "ICM+SCOB" event but with one major difference — the candle, which grabs the liquidity of ICM line, is also the candle at which the SCOB occurs, making such SCOB an even better zone of interest than a regular SCOB from ICM+SCOB event.
BIGGEST ADVANTAGES
ICSM precisely identifies impulses and corrections. Huge load of indicators on the TradingView does only show the simplest zones of interests, while ICSM uses our team's signature algorithms to precisely identify true impulses and corrections in the market, allowing traders to see both local and global price direction better and at the same time providing traders with the most liquid zones of interest;
ICSM shows points of interest and liquidity. The indicator identifies the nearest points of interest and zones, where the liquidity is concentrated, allowing you to find great entry and exit points for your trades;
ICSM has SCOB (Single Candle Order Block) detection function. ICM is packed with the extremely useful in SMC trading SCOB detetction feature, which allows you find even more solid points of interest;
ICSM has super minimalistic design, which contains only the things you really need. Your chart will not be overloaded with unnecessary information. You will only see clear points of interest, liquidity and price movement.
WHY SHOULD YOU USE IT?
As was said above, ICSM allows you to see the most profitable points and zones of interest, which professional SMC traders consider as one of the best in the market, because they are historically the areas from which the price bounces the most, allowing the smartest traders to get quick an clean profits with low drawdown.
In the ICSM indicator these zones are SCOB and ICM line liquidity grabs. By using these zones of interest to find entry points, you increase the chance to open a trade at the most lucrative price and reduce trading risks.
Considering what was said above, this indicator can help traders reduce drawdown risks and increase potential profits simply by showing the most liquid zones of interest, which are perfect for opening a trading position.
Here are some of the examples of how you leverage ICSM in your trading process:
Example of the short trade:
Price shows overall short trend. Trend liquidity is being formed.
Price grabs liduiqity from three ICM lines in a row and then creates a long SCOB at the end of 3rd liquidity grab.
SCOB, which occured at the end of ICM line, represents much stronger zone of interest than a regular SCOB. In this case it represents a zone, which we will use to find an entry.
The entry for the trade will be SCOB candle's low, stop-loss target should be put above SCOB candle's high. Our take-profit target is trend liquidity. See the screenshot above for better understanding.
▼ Now let's see the long trade example. ▼
Example of the long trade:
Price creates trend liquidity by showing equal highs ( EQH ).
Price grabs liduiqity from four ICM lines in a row and then creates a long SCOB at the end of 4th liquidity grab.
Again: SCOB, which occured at the end of ICM line, represents much stronger zone of interest than a regular SCOB. In this case it represents a zone, which we will use to find an entry.
The entry for the trade will be SCOB candle's high, stop-loss target should be put below SCOB candle's low. Our take-profit target is EQH. See the screenshot above for better understanding.
ALERTS
ICSM provides simple and easy alert customization, allwoing to choose only the alerts you want to receive. You can choose from the following alert options:
ICM — impulse or correction liquidity grab;
SCOB — SCOB is formed, wether or not the liquidity is grabbed from the impulse or correction;
SCOB+ICM — SCOB is formed after grabbing the liquidity of the ICM line;
SCOB+ICM (same candle) — SCOB is formed in the liquidity area of the impulse or correction.
HOW CAN I GET THE MOST OUT OF IT?
ICSM displays only the first liquidity of an impulse or correction, which matches the IDM (Inducement) in the Advanced SMC strategy . This strategy is completely covered in the World Class SMC indicator and is available for free for PDF in three parts.
You can also ICSM with any other strategy, because ICSM is a very flexible indicator and will help anyone improve their trading by making one aware of the high-quality liquidity on the chart.
Let's see how you can leverage ICSM with our World Class SMC indicator and other different strategies:
Example of the long & short trades with World Class SMC.
Long (1-3):
Price reached previous OB-EXT . This is the first sign for the potential price reversal;
ICM+SCOB happened after price reached OB-EXT;
After that, you can need to look for an entry on LTF. If you don't know how to do it, you can refer to our education materials.
Short (4-6):
Price reached OB-IDM , which is also a great sign for a potential upcoming price reversal;
ICM+SCOB occured after liquidity grab of the previous SCOB. This fact does strengthen the probability of the potential upcoming price reversal;
Now you need to switch to LTF and find an entry there.
Example of the short trade with simple Fibonacci retracement strategy.
Price grabs the liquidity of the ICM lines three times in a row, forming SCOB after the 3rd grab;
Price performs correctional move down without testing the SCOB, leaving no entry opportunity by our initial strategy, so we can add another strategy — Fibonacci retracement from 0.618 level — to our analysis in order to find an entry ;
We use Fibonacci grid with our initial strategy to find the best POI, that will align with the trend direction and will eventually become our entry point.
SUMMARY
ICSM is a unique indicator that indentifies zones and points of interests with high-quiality liquidity and can be both a stand-alone tool and can be integrated into any other strategy to increase the efficiency of analysis, accuracy of trading entries and reduce trading risks.
If you want to learn the SMC strategies that our team uses in our products, you can refer to our educational materials.
We hope that you will find a great use of ICSM and it will help you improve your perfomance as a trader. Best of luck, traders!
— with love, WinWorld Team

RBS | Profitholders Thanks for source code author , I have modified this for especially Indian market.
RBS Indicator is Rang Breakout System, This is same "Opening Range Breakout" which is a common trading strategy. The indicator can analyze the market trend in the current session and give "Buy / Sell", "Take Profit" and "Stop Loss" signals. For more information about the analyzing process of the indicator, you can read "How Does It Work ?" section of the description.
Features of RBS indicator :
Buy & Sell Signals
Up To 3 Take Profit Signals
Stop-Loss Signals
Alerts for Buy / Sell, Take-Profit and Stop-Loss
Session Dashboard
Back testing Dashboard
HOW DOES IT WORK ?
This indicator works best in 15-minute timeframe. Need to change Chart time frame depends on symbols , The idea is that the trend of the current session can be forecasted by analyzing the market for a while after the session starts. However, each market has it's own dynamics and the algorithm will need fine-tuning to get the best performance possible. So, we've implemented a "Back testing Dashboard" that shows the past performance of the algorithm in the current ticker with your current settings. Always keep in mind that past performance does not guarantee future results. So this is for educational purpose.
Here are the steps of the algorithm explained briefly :
1. The algorithm follows and analyzes the first 15 minutes (can be adjusted) of the session.
2. Then, algorithm checks for breakouts of the opening range's high or low.
3. If a breakout happens in a bullish or a bearish direction, the algorithm will now check for retests of the breakout. Depending on the sensitivity setting, there must be 0 / 1 / 2 / 3 failed retests for the breakout to be considered as reliable.
4. If the breakout is reliable, the algorithm will give an entry signal.
5. After the position entry, algorithm will now wait for Take-Profit or Stop-Loss zones and signal if any of them occur.
If you wonder how does the indicator find Take-Profit & Stop-Loss zones, you can check the "Settings" section of the description.
UNIQUENESS
While there are indicators that show the opening range of the session, they come short with features like indicating breakouts, entries, and Take-Profit & Stop-Loss zones. We are also aware of that different stock markets have different dynamics, and tuning the algorithm for different markets is really important for better results, so we decided to make the algorithm fully customizable. Besides all that, our indicator contains a detailed back testing dashboard, so you can see past performance of the algorithm in the current ticker. While past performance does not yield any guarantee for future results, we believe that a back testing dashboard is necessary for tuning the algorithm. Another strength of this indicator is that there are multiple options for detection of Take-Profit and Stop-Loss zones, which the trader can select one of their liking.
⚙️SETTINGS
Keep in mind that best chart timeframe for this indicator to work is the 15-minute timeframe on Indian Market.
TP = Take-Profit
SL = Stop-Loss
EMA = Exponential Moving Average
OR = Opening Range
ATR = Average True Range
1. Algorithm
RBS Timeframe -> This setting determines the timeframe that the algorithm will analyze the market after a new session begins before giving any signals. It's important to experiment with this setting and find the best option that suits the current ticker for the best performance. More volatile stocks will often require this setting to be larger, while more stabilized stocks may have this setting shorter.
Sensitivity -> This setting determines how much failed retests are needed to take a position entry. Higher sensitivity means that less retests are needed to consider the breakout as reliable. If you think that the current ticker makes strong movements in a bullish & bearish direction after a breakout, you should set this setting higher. If you think the opposite, meaning that the ticker does not decide the trend right after a breakout, this setting show be lower.
(High = 0 Retests, Medium = 1 Retest, Low = 2 Retests, Lowest = 3 Retests)
Breakout Condition -> The condition for the algorithm to detect breakouts.
Close = Bar needs to close higher than the OR High Line in a bullish breakout, or lower than the OR Low Line in a bearish breakout. EMA = The EMA of the bar must be higher / lower than OR Lines instead of the close price.
TP Method -> The method for the algorithm to use when determining TP zones.
Dynamic = This TP method essentially tries to find the bar that price starts declining the current trend and going to the other direction, and puts a TP zone there. To achieve this, it uses an EMA line, and when the close price of a bar crosses the EMA line, It's a TP spot.
ATR = In this TP method, instead of a dynamic approach the TP zones are pre-determined using the ATR of the entry bar. This option is generally for traders who just want to know their TP spots beforehand while trading. Selecting this option will also show TP zones at the ORB Dashboard.
"Dynamic" option generally performs better, while the "ATR" method is safer to use.
EMA Length -> This setting determines the length of the EMA line used in "Dynamic TP method" and "EMA Breakout Condition". This is completely up to the trader's choice, though the default option should generally perform well. You might want to experiment with this setting and find the optimal length for the current ticker.
Stop-Loss -> Algorithm will place the Stop-Loss zone using setting.
Safer = The SL zone will be placed closer to the OR High for a bullish entry, and closer to the OR Low for a bearish entry.
Balanced = The SL zone will be placed in the center of OR High & OR Low
Risky = The SL zone will be placed closer to the OR Low for a bullish entry, and closer to the OR High for a bearish entry.
Adaptive SL -> This option only takes effect if the first TP zone is hit.
Enabled = After the 1st TP zone is hit, the SL zone will be moved to the entry price, essentially making the position risk-free.
Disabled = The SL zone will never change.
2. RBS Dashboard
RBS Dashboard shows the information about the current session.
3. RBS Back testing
RBS Back testing Dashboard allows you to see past performance of the algorithm in the current ticker with current settings.
Total amount of days that can be back tested depends on your TV subscription.
Back testing Exit Ratios -> You can select how much of percent your entry will be closed at any TP zone while back testing. For example, %90, %5, %5 means that %90 of the position will be closed at the first TP zone, %5 of it will be closed at the 2nd TP zone, and %5 of it will be closed at the last TP zone.

ORB Algo | Flux Charts💎 GENERAL OVERVIEW
Introducing our new ORB Algo indicator! ORB stands for "Opening Range Breakout" which is a common trading strategy. The indicator can analyze the market trend in the current session and give "Buy / Sell", "Take Profit" and "Stop Loss" signals. For more information about the analyzing process of the indicator, you can read "How Does It Work ?" section of the description.
Features of the new ORB Algo indicator :
Buy & Sell Signals
Up To 3 Take Profit Signals
Stop-Loss Signals
Alerts for Buy / Sell, Take-Profit and Stop-Loss
Customizable Algoritm
Session Dashboard
Backtesting Dashboard
📌 HOW DOES IT WORK ?
This indicator works best in 1-minute timeframe. The idea is that the trend of the current session can be forecasted by analyzing the market for a while after the session starts. However, each market has it's own dynamics and the algorithm will need fine-tuning to get the best performance possible. So, we've implemented a "Backtesting Dashboard" that shows the past performance of the algorithm in the current ticker with your current settings. Always keep in mind that past performance does not guarantee future results.
Here are the steps of the algorithm explained briefly :
1. The algorithm follows and analyzes the first 30 minutes (can be adjusted) of the session.
2. Then, algorithm checks for breakouts of the opening range's high or low.
3. If a breakout happens in a bullish or a bearish direction, the algorithm will now check for retests of the breakout. Depending on the sensitivity setting, there must be 0 / 1 / 2 / 3 failed retests for the breakout to be considered as reliable.
4. If the breakout is reliable, the algorithm will give an entry signal.
5. After the position entry, algorithm will now wait for Take-Profit or Stop-Loss zones and signal if any of them occur.
If you wonder how does the indicator find Take-Profit & Stop-Loss zones, you can check the "Settings" section of the description.
🚩UNIQUENESS
While there are indicators that show the opening range of the session, they come short with features like indicating breakouts, entries, and Take-Profit & Stop-Loss zones. We are also aware of that different stock markets have different dynamics, and tuning the algorithm for different markets is really important for better results, so we decided to make the algorithm fully customizable. Besides all that, our indicator contains a detailed backtesting dashboard, so you can see past performance of the algorithm in the current ticker. While past performance does not yield any guarantee for future results, we believe that a backtesting dashboard is necessary for tuning the algorithm. Another strength of this indicator is that there are multiple options for detection of Take-Profit and Stop-Loss zones, which the trader can select one of their liking.
⚙️SETTINGS
Keep in mind that best chart timeframe for this indicator to work is the 1-minute timeframe.
TP = Take-Profit
SL = Stop-Loss
EMA = Exponential Moving Average
OR = Opening Range
ATR = Average True Range
1. Algorithm
ORB Timeframe -> This setting determines the timeframe that the algorithm will analyze the market after a new session begins before giving any signals. It's important to experiment with this setting and find the best option that suits the current ticker for the best performance. More volatile stocks will often require this setting to be larger, while more stabilized stocks may have this setting shorter.
Sensitivity -> This setting determines how much failed retests are needed to take a position entry. Higher senstivity means that less retests are needed to consider the breakout as reliable. If you think that the current ticker makes strong movements in a bullish & bearish direction after a breakout, you should set this setting higher. If you think the opposite, meaning that the ticker does not decide the trend right after a breakout, this setting show be lower.
(High = 0 Retests, Medium = 1 Retest, Low = 2 Retests, Lowest = 3 Retests)
Breakout Condition -> The condition for the algorithm to detect breakouts.
Close = Bar needs to close higher than the OR High Line in a bullish breakout, or lower than the OR Low Line in a bearish breakout. EMA = The EMA of the bar must be higher / lower than OR Lines instead of the close price.
TP Method -> The method for the algorithm to use when determining TP zones.
Dynamic = This TP method essentially tries to find the bar that price starts declining the current trend and going to the other direction, and puts a TP zone there. To achieve this, it uses an EMA line, and when the close price of a bar crosses the EMA line, It's a TP spot.
ATR = In this TP method, instead of a dynamic approach the TP zones are pre-determined using the ATR of the entry bar. This option is generally for traders who just want to know their TP spots beforehand while trading. Selecting this option will also show TP zones at the ORB Dashboard.
"Dynamic" option generally performs better, while the "ATR" method is safer to use.
EMA Length -> This setting determines the length of the EMA line used in "Dynamic TP method" and "EMA Breakout Condition". This is completely up to the trader's choice, though the default option should generally perform well. You might want to experiment with this setting and find the optimal length for the current ticker.
Stop-Loss -> Algorithm will place the Stop-Loss zone using setting.
Safer = The SL zone will be placed closer to the OR High for a bullish entry, and closer to the OR Low for a bearish entry.
Balanced = The SL zone will be placed in the center of OR High & OR Low
Risky = The SL zone will be placed closer to the OR Low for a bullish entry, and closer to the OR High for a bearish entry.
Adaptive SL -> This option only takes effect if the first TP zone is hit.
Enabled = After the 1st TP zone is hit, the SL zone will be moved to the entry price, essentially making the position risk-free.
Disabled = The SL zone will never change.
2. ORB Dashboard
ORB Dashboard shows the information about the current session.
3. ORB Backtesting
ORB Backtesting Dashboard allows you to see past performance of the algorithm in the current ticker with current settings.
Total amount of days that can be backtested depends on your TV subscription.
Backtesting Exit Ratios -> You can select how much of percent your entry will be closed at any TP zone while backtesting. For example, %90, %5, %5 means that %90 of the position will be closed at the first TP zone, %5 of it will be closed at the 2nd TP zone, and %5 of it will be closed at the last TP zone.

Model Indicator |ASE|The purpose of this indicator is to allow the user to build their own model. Each feature works cohesively together and depending on the filters you enable, the model gives less and more specific entries. This benefits the trader because they have complete control over the kinds of trades they want to take, while maintaining its automatic form.
We want to be as customizable as possible while still meeting our users’ needs. We started this indicator to propel us into our ultimate project, the ASE Algo.
Features:
SMC Display
Current Structure:
Liquidity Levels:
Daily Premium Discount Array
SMT Divergence
Displacement Candles:
Entry Factors
FVG
Continuation FVGs
MTF FVGs
Order Blocks
MTF Order Blocks
Confluence Filters
MS Reversal
Liquidity Level Raid
Inducement
Daily Prem/Disc Array
Target Factors
Liquidity Level Targets
Current Structure Targets
Trade Management
Trade Overlay
Risk:Reward Target
Benefits & Examples:
In the image below the indicator signaled multiple entries based on two simple confluence filters, a MS reversal (CHoCH/MSS) and a Liquidity Raid. Going from left to right we can see a short entry at the highs with a supporting Order Block. Liquidity levels are taken before we see a double IDM right below the respected OB that leads to the next signaled entry. In the middle of the chart we see a long entry that leads right into a short entry showing the effectiveness of such a simple model.
In this supporting image we are showcasing the first implementation of the Trade Overlay feature. This feature displays the Entry and Stop Loss to make it more visible and adds a risk to reward target. Additionally displayed is the SMC Toolkit indicator showing us additional confirmation with our signaled entries playing right out of a higher timeframe FVG.
An additional entry feature is the MTF zone. Setups can form on all timeframes and subjecting yourself to only one may lead you to miss out on some perfect setups or a larger move. In the image below we are on the 1 minute timeframe. We can see the Initial Reversal Entry which played out beautifully and filled a higher timeframe SFVG. With the MTF zone we can see a 3 minute and 5 minute Zone which produces the rest of the trend reaching another higher timeframe SFVG after filling the previous one. Once again showing the benefit of the Toolkit indicator but the plotted entries from such a simple model.
In addition to the model indicators filtered out entry zone, we can use additional confluences to confirm these entries. In the image below we can see a short entry printed after a move out of the Std. Dev. vwap wave which shows over extension. Taking the entry we can have a tight stop loss at the vwap wave or the recent high where we have a liquidity level, targeting a lower liquidity level or higher timeframe FVG.
For this example we are only filtering based on MS Reversals (CHoCH/MSS) to get our entries. Because of this we need additional confirmation to be confident in taking the plotted entry. In the image below you can see a long signal printed, confirmation being the previous Failed Reversal.

Original Strategy - Backtest & Alerts [AlgoRider]█ OVERVIEW
This indicator simulates an efficient trading strategy developed by our team in a simple and effective way, the primary objective when designing it was to make its reading and use as simple as possible for TradingView users. The Backtesting feature has been designed to keep only the most essential information to obtain clear and precise results directly on the graph. The settings interface has also been designed for ergonomic and simplified use. The user is free to customize the parameters as he wishes and according to his trading profile by having the choice, for example, of using options to reduce the risk of loss, to increase the win rate, to optimize profits. Automation is made possible and facilitated thanks to preconfigured alert conditions.
█ CONCEPTS
How the strategy works :
When the price is close to its equilibrium (represented by an exponential moving average - EMA) and it starts to take an upward or downward direction the script will issue Long or Short entry orders. If the price turns and goes to the opposite direction, the script quickly cuts the position by issuing a Stop Loss order. When the price takes a real clear direction, this is where the script will be able to accumulate profits.
What makes this script unique is :
• That it is entirely developed by us, inspired by a strategy that is little known and little used in the trading world, in particular because it often involves a greater number of losing trades than winning trades.
• Its ease of reading and use. The backtesting feature was designed to clearly display the most important information in a data table directly on the chart. The user is not lost with dozens of superfluous data and can directly access the most essential information to see how the strategy has performed in the past.
• Its ease of configuration and customization. Once in the configuration window, again the user is not lost, because there is only one main parameter to modify, it is the length of the EMA, which will influence the timing of entries and exits trades. Then there are a few other non-mandatory parameters to fine-tune risk management and maximize profits. (Detailed description of the settings further down the page)
• Strategy automation made easy and fast thanks to several types of alerts which are differentiated for entries, for auto-exits and for Custom TP and SL. These alerts can be configured to send the messages by email or via Webhooks.
• The indicator has several custom options allowing its user to go further than the basic strategy. Several confirmations for entries are available as well as the possibility of adding or not a personalized TP and/or SL.
• There is no repaint, once an entry/exit symbol or drawing is displayed it doesn't change anymore. The Short, Long and auto-Exit signals appear only at the open of the candles, just after the signal was confirmed at the close of the previous candle. The custom TP and custom SL signals can appear when a candle is not yet finished, but once displayed they don't change.
█ HOW TO PROCEED
1 — Once the script is applied to your chart, it already works with its default settings. You can already see the performance of the strategy in the data table directly on the chart (in the top right corner by default).
2 — You can customize the strategy and influence the results/performance by modifying its parameters. 3 types of parameters are present and can be modified.
3 — This strategy is designed for the cryptocurrency market in priority, but you can also try it on other types of assets. It works on Futures but you can also try it on Spot market mainly for LONG trades.
4 — You can apply the script in every timeframe. We do not recommend using it below m30 because in most cases the statistics are unfavorable largely because of the fees. (This is not a financial advice but only for the use of the indicator)
█ FEATURES
Screenshot on BYBIT:EGLDUSDT Bybit Futures, H1, with default parameters, from 2022-01-01 to 2022-09-27, to show the settings window
• Settings For Backtesting
- Strategy : Choose from a drop-down list if the strategy should execute only Long trades or only Short trades or both. Default Both.
- Invest. : Choose the amount you want to invest in the simulation. Default 10000.
- Position : Choose the amount of the position (Size order) that will be used during the simulation. This will be the $ amount staked/involved for each trade entry.
Ex: If you put 20000 in position and 10000 in Invest. We consider that you use at least a leverage x2. Default 10000.
- Slipp. TP : Choose the amount in percentage of average slippage for Take Profits. This parameter makes it possible to predict a potential gap between the theoretical exit price for each TP (On the graph) and the real exit price on an exchange when implementing the strategy for real (slippage may be due to a time lag of a few seconds from execution time of the order on the exchange and/or due to the execution of a market order).
Ex: If a TP exit order of a Long trade, with entry $19000 (on BTCUSDT), is carried out in theory on the chart at $20000, in practice on the exchange the script have indeed sent an exit order at 20000 , but if the true exit price is 20050, the TP slippage is then +0.25%. Default 0.
- Slipp. SL : Choose the amount in percentage of average slippage for Stop Losses. This parameter makes it possible to predict a potential gap between the theoretical exit price for each SL (On the graph) and the real exit price on an exchange when implementing the strategy for real.
Ex: If an SL exit order of a Long trade, entry $19000 (on BTCUSDT), is carried out in theory on the chart at $18000, in practice on the exchange the script have indeed sent an exit order at 18000 $, but if the true exit price is 17950, the slippage SL is then +0.278% . Default 0.
- Fees % : Choose the percentage amount of fees applied to each trade to simulate the application of the strategy on the exchange of your choice. Applies to the entry and exit of each trade. Ex: For Binance Futures: 0.04; For Bybit futures: 0.06; For Ftx Futures: 0.075. Default 0.
- Cumulate Trades : If you check this, the Backtest will use 100% of the balance as Order Size (Position) for All or in the next X consecutive trades. Default not checked.
⚠️ Be Careful please, this option is available to show the full extent and possibilities of the algorithm when pushed to its limits thanks to the accumulation of profits (cumulative earnings), but it is a strategy that involves great risk. If a bad trade suffers a -50% loss, 50% of the account balance is lost, if the position is liquidated, the entire account balance is lost.
- All : If you check this All trades will be accumulated. Default not checked.
- Consecutive Trades : Choose the number of trades to accumulate. After X consecutive trades, the algorithm reassigns the initial order size to the current one and starts again for X consecutive trades. Minimum Value 2, Default 2.
• Settings To Optimize Performances and Risk Management
- (Main Parameter) EMA Length : Choose the length of the EMA. This value will determine the exponential moving average plot (blue line) that represents the equilibrium in this strategy. Depending on the positioning of the price around this equilibrium, the algorithm will decide to trigger Long or Short entry alerts, and exit alerts. Default 200.
- 1 - Confirm (After X Bar(s)) : If you check this, when the algorithm will detect an entry, it will wait for the number of bars you have entered to actually trigger the entry alert. Default not checked.
- Nb Bar : Enter here the number of bar you want, will be taken into account only if you check (1) Confirm (After X Bar(s)). Default 2.
- 2 - Confirm (Trend) : If you check this, when the algorithm will detect an entry, it will check that the trend is similar to the direction of the trade, if not, it will wait that the trade goes in the same direction as the trend to actually trigger the entry alert. Default not checked.
- OR/AND : This choice is taken into account only if you tick both confirmations. If you choose OR: The first of the 2 confirmations to be validated will trigger the entry alert. If you choose AND : once confirmation (1) is validated, the algorithm waits for confirmation (2) to be validated to actually trigger the entry alert. Default OR.
- Use TP / Use SL : If you check these, the algorithm will trigger personalized trade exit alerts when the price evolution has reached the amounts indicated since the trade entry. Default not Checked.
- % TP - SL : Indicate here the personalized amount in percentage that you want for your Take Profit and Stop Loss of each trade. Default 15-5.
• Settings For Appearances
- Small-size Data Table : If you check this, the data table will become smaller to free up more space on the chart to make it visually more pleasing. Default not checked.
Hide Table /
- Hide Labels / : You can check these to get a cleaner chart and focus only on what interests you in the indicator. Default not checked.
Hide Risk-Reward Areas
█ MAIN PARAMETERS TO USE
• In the default settings none of the box settings are checked. Basic strategy is made to be applied this way.
• The main parameter (the length of the EMA) is by default 200 because it is a known value that many traders rely on in many trading strategies. Moreover in this strategy it works in many cases and on different timeframes.
• To go further the user of the indicator is free to modify the parameters of the category "Leading Parameters - Risk Management" to reduce risks and to optimize profits.
• You can find below our recommendations for the EMA length value corresponding to the main timeframes.
m30 — EMA Length = 400 | 800
H1 — EMA Length = 200 | 400
H2 — EMA Length = 200 | 250
H4 — EMA Length = 100 | 200
D — EMA Length = 20 | 40
⚠️ We have chosen to recommend these settings because they will work in most cases, on most cryptoassets, but of course they will not work 100% of the time on all assets and will not always give positive results in the backtest, and they are not the most optimized parameters either. The user of the indicator is free to optimize the asset on which he wants to trade in his own way. Just as we do not give financial advice, we do not encourage to trade any asset in particular.
█ STATISTICS
The statistics presented below are an example of the results that the strategy can provide. (Reminder: These statistics are made over a past period and there is no guarantee that the same performance will reproduce in the future) .
For the demonstration we chose to apply the strategy on the Top 5 marketcap cryptos in September 2022. They are not the most favorable coins for this strategy but at least this way we don't take the most suitable assets to show wonderful and biased results. Likewise for the parameters used which are the default ones and which are not the most optimized parameters, much better results are possible. We chose Binance because it has the highest volumes and liquidity and the most historical data. We chose H1 because it is one of the most used timeframes.
BTC
Screenshot on BINANCE:BTCUSDTPERP Binance Futures, H1, with default parameters (EMA : 400), from 2022-01-01 to 2022-09-27
ETH
Screenshot on BINANCE:ETHUSDTPERP Binance Futures, H1, with default parameters (EMA : 400), from 2022-01-01 to 2022-09-27
BNB
Screenshot on BINANCE:BNBUSDTPERP Binance Futures, H1, with default parameters (EMA : 400), from 2022-01-01 to 2022-09-27
XRP
Screenshot on BINANCE:XRPUSDTPERP Binance Futures, H1, with default parameters (EMA : 200), from 2022-01-01 to 2022-09-27
ADA
Screenshot on BINANCE:ADAUSDTPERP Binance Futures, H1, with default parameters (EMA : 400), from 2022-01-01 to 2022-09-27
To show the potential of the indicator and push it to its limits, here is an example of the strategy applied for about 2 years (Up to the maximum of historical data available).
⚠️ It must be taken into account that during the period of this backtest the last Bullrun took place and it was a very favorable period for the strategy and for this altcoin (FTM), nothing ensures that it will happen again. ⚠️
FTM
Screenshot on BINANCE:FTMUSDTPERP Binance Futures, H4, with default parameters ( without cumulative earnings) and EMA : 400, start on 2020/12/03 to 2022/09/27
✅ All of the above statistics are verifiable by anyone using the indicator's backtesting system.
█ LIMITATIONS
• Despite the fact that we can see good performances when we backtest the strategy, we must take into account the fact that these are results performed in the past and that in no case does this guarantee that these same performances will be repeated again in the future.
• The automation of this strategy is made possible and is facilitated by alerts, but you must be aware of the fact that if you decide to put this strategy into practice in real life, you are solely responsible for the results that you will be able to obtain and you must be aware of the possibility at all times of partial or even total losses of your invested capital.
• Keep in mind that generating profits in trading is difficult. A strategy can perform very well at one time in the past during a period that is favorable to it, then from one day to the next it can give really bad results for several months or years.
• When backtesting a strategy, there are many factors to consider, not just trade entries to which you add a Take Profit and sometimes a Stop Loss. You must at least take into account the size of the position in relation to the capital you want to invest, the trading fees, the slippages (which can be really important depending on the exchange on which you are trading and depending on the asset you are trading), trading frequency, risk management, momentum, volumes and even more.
• This indicator has been optimized for crypto, you can try to use it on other type of assets but again, at your own risk.
The information published here on TradingView is not prohibited, doesn't constitute investment advice, and isn't created solely for qualified investors.
═════════════════════════════════════════════════════════════════════════
Important to note : our indicators with the same backtesting system are published in separate publications, because putting them together in a single script would considerably slow down the execution of the script. In addition each indicator, even when it is based on a simple technical indicator, has several options, parameters and entry/exit conditions specific to the underlying technical indicator. Finally, we want to keep the simplicity of use, configuration and understanding of our indicator by not mixing strategies that have nothing to do with each other.
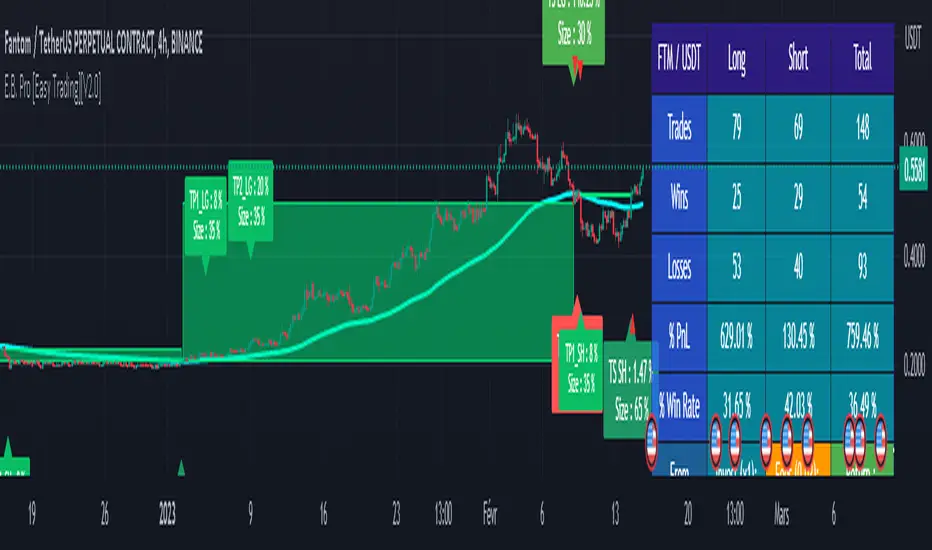
RSI Strategy - Backtest [AlgoRider]█ OVERVIEW
Hello dear Tradingviewers !
We share with you this new indicator which simulates a trading strategy based solely on the well-known technical indicator RSI . We designed it for the sole educational and analytical purposes of showing novice traders and new investors that basing a trading strategy only on one such technical indicator is not necessarily a good thing to do. We do not recommend to apply this strategy for real.
Thanks to this indicator redesigned in our own way by incorporating our simple and easy-to-use Backtest functionality, you will be able to see and report on the performance and results that such a strategy has produced in the past.
The configuration window has also been designed to be easily readable and simple to use. Our goal is to make parameter customization as easy as possible.
█ HOW THE STRATEGY WORKS
• The script will trigger Long entries when the price crosses upwards the Oversold zone (Default 38.2) and Short entries when the price crosses downward the Overbought zone (Default 61.8).
• A Short signal ends a Long trade, a Long signal ends a Short trade.
• The script also allows setting up custom TP and SL.
• Several options allow you to reverse entry and exit conditions of trades. You can choose to reverse entries or/and exits (Ex: when the script detects a Long Entry, it will actually trigger a Short trade).
• You can also change the entry conditions of the strategy. Instead of entering oversold/overbought zone conditions, it will trigger entries when the Rsi changes direction and reverses (Ex: when the rsi has been going down for 5 candles, and the rsi starts going up) , regardless of the area in which the RSI is located.
• There is no repaint, once an entry/exit symbol or drawing is displayed it doesn't change anymore. The Short and Long signals appear at the open of the candles, just after the signal was confirmed at the close of the previous candle. The custom TP and custom SL signals can appear when a candle is not yet finished, but once displayed they don't change.
█ HOW TO PROCEED
1 — Once the script is applied to your chart, it already works with its default settings. You can already see the performance of the strategy in the data table directly on the chart (in the top right corner by default).
2 — You can customize the strategy and influence the results/performance by modifying its parameters. 4 types of parameters are present and can be modified.
3 — You can use this indicator in all types of markets.
4 — You can apply the script in every timeframe.
█ PARAMETERS
• Settings For Backtesting
- Strategy : Choose from a drop-down list if the strategy should execute only Long trades or only Short trades or both. Default Both.
- Invest. : Choose the amount you want to invest in the simulation. Default 10000.
- Position : Choose the amount of the position (Size order) that will be used during the simulation. This will be the $ amount staked/involved for each trade entry.
Ex: If you put 20000 in position and 10000 in Invest. We consider that you use at least a leverage x2. Default 10000.
- Slipp. TP : Choose the amount in percentage of average slippage for Take Profits. This parameter makes it possible to predict a potential gap between the theoretical exit price for each TP (On the graph) and the real exit price on an exchange when implementing the strategy for real (slippage may be due to a time lag of a few seconds from execution time of the order on the exchange and/or due to the execution of a market order).
Ex: If a TP exit order of a Long trade, with entry $19000 (on BTCUSDT ), is carried out in theory on the chart at $20000, in practice on the exchange the script have indeed sent an exit order at 20000 , but if the true exit price is 20050, the TP slippage is then +0.25%. Default 0.
- Slipp. SL : Choose the amount in percentage of average slippage for Stop Losses. This parameter makes it possible to predict a potential gap between the theoretical exit price for each SL (On the graph) and the real exit price on an exchange when implementing the strategy for real.
Ex: If an SL exit order of a Long trade, entry $19000 (on BTCUSDT ), is carried out in theory on the chart at $18000, in practice on the exchange the script have indeed sent an exit order at 18000 $, but if the true exit price is 17950, the slippage SL is then +0.278%. Default 0.
- Fees % : Choose the percentage amount of fees applied to each trade to simulate the application of the strategy on the exchange of your choice. Applies to the entry and exit of each trade. Ex: For Binance Futures: 0.04; For Bybit futures: 0.06; For Ftx Futures: 0.075. Default 0.
- Cumulate Trades : If you check this, the Backtest will use 100% of the balance as Order Size (Position) for All or in the next X consecutive trades. Default not checked.
⚠️ Be Careful please, this option is available to show the full extent and possibilities of the algorithm when pushed to its limits thanks to the accumulation of profits (cumulative earnings ), but it is a strategy that involves great risk. If a bad trade suffers a -50% loss, 50% of the account balance is lost, if the position is liquidated, the entire account balance is lost.
- All : If you check this All trades will be accumulated. Default not checked.
- Consecutive Trades : Choose the number of trades to accumulate. After X consecutive trades, the algorithm reassigns the initial order size to the current one and starts again for X consecutive trades. Minimum Value 2, Default 2.
• Change Entry & Exit conditions
- Rsi Turns Up/Down : Enable this option to change conditions for trade entries. For Long entries : It will start a Long trade when RSI turns up and the RSI was falling on the last X bar(s). For Short entries : It will start a Short trade when RSI turns down and the RSI was rising on the last X bar(s). Default not checked.
- After Falling/Rising Bars(s) : Choose the number of bars/candles since which the price was falling/rising. Default 5.
- Reverse Entries : Enable this option to reverse conditions for trade entries. When a Short signal appears, it will actually start a Long trade. When a Long signal appears, it will actually start a Short trade. Default not checked.
- Reverse Exits : Enable this option to reverse conditions for trade exits. Default not checked.
- Safety Stop Loss : Enable this option to quickly cut the trade when the price turns quickly. For a Long trade : if the price returns to the oversold zone, it ends the trade. For a Short trade : if the price returns to the overbought zone, it ends the trade. Mainly useful for basic strategy (overbought/oversold conditions). Default not checked.
• Settings To Optimize Performances and Risk Management
- Len RSI : The length of RSI . Default 14.
- Overbuy : You can change the limit value of the overbought zone of the RSI . Default 61.8.
- Oversell : You can change the limit value of the oversell zone of the RSI . Default 38.2.
- Use TP / Use SL : If you check these, the algorithm will trigger personalized trade exit signals when the price evolution has reached the amounts indicated since the trade entry. Default not Checked.
- % TP - SL : Indicate here the personalized amount in percentage that you want for your Take Profit and Stop Loss of each trade. Default 15-5.
• Settings For Appearances
- Small-size Data Table : If you check this, the data table will become smaller to free up more space on the chart to make it visually more pleasing. Default not checked.
Hide Table /
- Hide Labels / : You can check these to get a cleaner chart and focus only on what interests you in the indicator. Default not checked.
Hide Risk-Reward Areas
█ LIMITATIONS
• ⚠️ We repeat it once again, this strategy is not intended to be reproduced in real conditions, we have designed it for educational and analytical purposes only.
• Even if you see good performances when you backtest the strategy, you must take into account that these results are performed in the past and that in no case does this guarantee that these same performances will be repeated again in the future.
• When you run for real a trading strategy you must be aware of the fact that you are solely responsible for the results that you will be able to obtain and you must be aware of the possibility at all times of partial or even total losses of your invested capital.
• Keep in mind that generating profits in trading is difficult. A strategy can perform very well at one time in the past during a period that is favorable to it, then from one day to the next it can give really bad results for several months or years.
• When backtesting a trading strategy, there are many factors to consider, not just trade entries to which you add a Take Profit and sometimes a Stop Loss. You must at least take into account the size of the position in relation to the capital you want to invest, the trading fees, the slippages (which can be really important depending on the exchange on which you are trading and depending on the asset you are trading), trading frequency, risk management, momentum, volumes and even more.
The information published here on TradingView is not prohibited, doesn't constitute investment advice, and isn't created solely for qualified investors.
═════════════════════════════════════════════════════════════════════════
Important to note : our indicators with the same backtesting system are published in separate publications, because putting them together in a single script would considerably slow down the execution of the script. In addition each indicator, even when it is based on a simple technical indicator, has several options, parameters and entry/exit conditions specific to the underlying technical indicator. Finally, we want to keep the simplicity of use, configuration and understanding of our indicator by not mixing strategies that have nothing to do with each other.

TRENDsignalsindicator_MTF► DESCRIPTION
This indicator calculate works in 2 directions:
1) Calculate SMA & VWAP trends at a fixed value: so it values the price actions according the VWAP level to reach the perfect entrypoint
2) Set the value found at a different timeframe(4Hs if u use tradingview TF of 15 mins)
This combination is useful to identify the trend
To help the trader, I placed BUY/SELL signals on the second candle of the same color changed.
Furthermore, I placed:
- HH and LL of the day(green and red lines) and of the current Week(white lines): these lines help the traders to identify the relative supports and resistances
- line red and gray(with big arrows at the start of them): to identify others supports and resistance
► HOW TO USE IT:
1) Entry when a signal(buy/sell) appears or when candles change color: yellow is long, red is short
2) Evaluate where the candle is: for example, if you get a signal "buy", near the Weekly line LL, it's the perfect entry point. The same is if u get a "SELL" signal near the upper white line, it's the perfect moment to enter short.
3) Take profit: we suggest to take profit when RSI is overbought or oversold, that we've pointed thanks the following signals:
- colored circles
- small diamonds
- white circles
- Big white diamonds
► Legend:
BARCOLORS: Yellow is long and red is short moment
MINIARROW buy/sell alert u when the color of candls change
COLORED CIRCLES: indicates when Rsi is oversold or overbought. We identify them like good moment to take profit
BIG ARROW: Identify support and resistance level
SMALL DIAMOND: Use it Like TP. Possible small swing of price can happen
WHITE CIRCLE: Use it Like TP. Possible small swing of price can happen
BIG WHITE DIAMOND: Use it Like TP. Possible big swing of price can happen
So it's suggested to trade just near this supports and resistence using the right direction: when you have a reversal signal near one of the daily or weekly line, it's a good moment to entry
PLEASE COMMENT HERE BELOW ANY QUESTION ABOUT THIS STUDY

NDS RISK MANAGEMENT (V1.0)Here is a Risk Management Program that calculates stop loss and position sizing based on NDS analysis.
Inputs:
Entry: The First Symmetry Level T1.
Entry: The Second Symmetry Level T2.
Entry: The Node 1 Level
Entry: The Node 2 Level
Entry: The 86% Level
Target: The First Symmetry Level T1
Target: The Second Symmetry Level T2.
Target:
The Node 1 Level
Target: The Node 2 Level
Target: The 86% Level
Balance: Balance Amount
Risk Level: Percent that is risked of the Balance for one Trade
Output:
Risk Per Point
Stop Loss Price
Take Profit Price
Low Risk Entry Zone
Take Profit Zone
Disclaimer
The Following indicator/code IS NOT intended to be a formal investment advice or recommendation by the author, nor should be construed as such.
You declare to know the principles and risks of the financial markets. Therefore, you declare that you are aware of the financial risks involved in trading.
In this sense, the author can not be held responsible for errors, omissions, inappropriate investment, technical problems, events beyond his control, and, more generally, financial losses that you may realize, or results obtained in the practice of trading resulting from the markets.
Trading involves a high level of financial risk, and may not be appropriate because you may experience losses greater than your deposit. Leverage can be against you.
Do not trade with capital that you can not afford to lose. You must be aware and have a complete understanding of all the risks associated with the market and trading. We can not be held responsible for any loss you incur.
Trading also involves risks of gambling addiction.
سلب مسئولیت
این اندیکاتور /کد به منظور توصیه یا توصیه رسمی سرمایهگذاری توسط سازنده طراحی نشده است ، و همچنین نباید چنین تفسیر شود.
شما اعلام می کنید که از اصول و ریسک های بازارهای مالی مطلع هستید. بنابراین، شما اعلام میکنید که از ریسکهای مالی موجود در معاملات آگاه هستید.
در نتیجه، طراح در قبال اشتباهات، خطاها ، سرمایه گذاری نامناسب، مشکلات فنی، رویدادهای خارج از کنترل خود، و به طور کلی، خسارات مالی که ممکن است متحمل شوید هیچونگه مسیولیتی ندارد
معاملات دارای سطح بالایی از ریسک مالی است و ممکن است مناسب نباشد زیرا ممکن است زیان هایی بیشتر از سپرده خود داشته باشید. اهرم می تواند علیه شما باشد.
با سرمایه ای که نمی توانید از دست بدهید معامله نکنید. شما باید آگاه باشید و درک کاملی از تمام ریسک های مرتبط با بازار و معامله داشته باشید. ما نمی توانیم در قبال ضرر و زیان شما مسئولیتی داشته باشیم.
ترید یا معامله خطرات اعتیاد به قمار را نیز در بر دارد
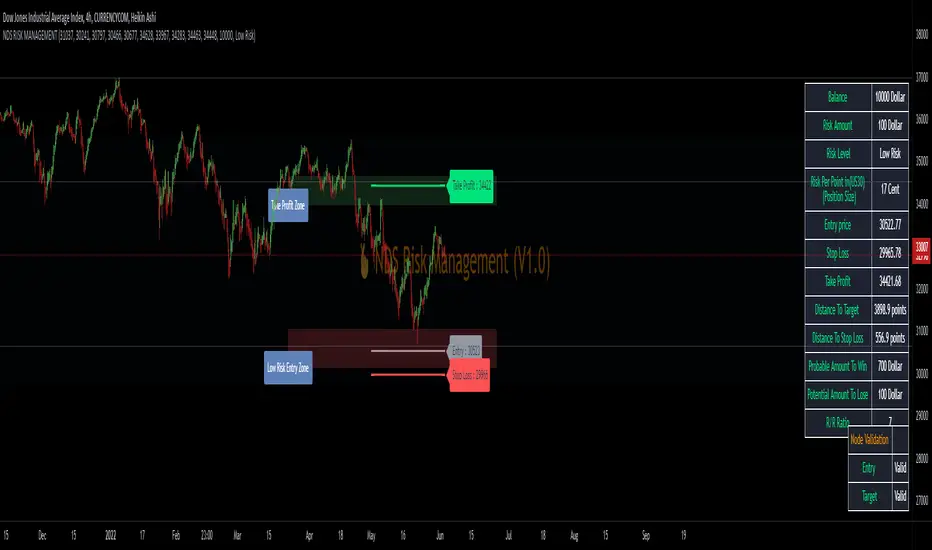
Rainbow Oscillator The Rainbow Oscillator is a technical indicator that shows prices in overbought or oversold areas. That allows you to catch the price reversal point.
---------------
FEATURES
---------------
.:: Dynamic levels ::.
The indicator levels are divided into several zones, which have a fibonacci ratio. Zones determine the overbought/oversold level. Blue and green level zones are better for buying, red and orange for selling. Dynamic levels are used as replacements for classic levels such as -100 and 100 for the CCI indicator or 30 and 70 for the RSI indicator. Dynamic levels work much better than static levels, as they are more adaptive to the current market situation.
.:: Composite oscillator (3 in 1) ::.
The main signal line of the indicator includes all three oscillators RSI, CCI, Stoch in different ratios. In the settings, you can change the proportions or completely remove one of the oscillators by setting its weight to 0
.:: CCI + RSI + Stoch ratio setting ::.
Each of the oscillators has its own weight in the calculation formula: w2 * cci ( + w1 * ( rsi - 50) + (1 - w2 - w1) * ( stoch - 50), this allows you to create the resulting oscillator from all indicators, depending on the weight of each of them. Each weight value must be between 0 and 1 so that the sum of all weights does not exceed 1.
.:: Smoothing levels and lines of the oscillator ::.
Smoothing the oscillator readings allows you to filter out the noise and get more accurate data. Level offset allows you to customize the support for inputs.
.:: Market Flat ::.
Dynamic creation of levels allows you to find in the price reversal zone, even when the price is in a flat
.:: Sources ::.
You can change the data source for the indicator to the number of longs and shorts for the selected asset. For example, BTCUSDLONGS / BTCUSDSHORTS is perfect for Bitcoin, then the oscillator will work on this data and will not use the quote price.
.:: Trend Detection ::.
The main line of the oscillator has 2 colors - green and red. Red means downtrend, green means uptrend. Trend reversal points are most often found in overbought and oversold zones.
.:: Alerts ::.
Alerts inside for next events: Buy (blue point) Sell (red point) and TrendReversal (change line color)
----------------
TRADING
—-------------
There are several possible entry points for the indicator, let's consider them all.
1) Trend reversal.
Long entry: The indicator line is in the green zone below 0 (oversold), while the line changes color from red (downward) to green (upward)
Short entry: The indicator line is in the red zone above the 0 (overbought) mark, while the line changes color from green to red.
2) Red and blue dots.
Long entry: Blue dot
Short Entry: Red Dot
I prefer to use the first trading method.
----------------
SETTINGS
----------------
.:: Trend Filter (checkbox) ::.
Use trend confirmation for red/blue dots. When enabled, the blue dot requires an uptrend, red dot requires downtrend confirmation before appearing.
.:: Use long/shorts (checkbox) ::.
Change formula to use longs and shorts positions as data source (instead of quote price)
.:: RSI weight / CCI weight / Stoch weight ::.
Weight control coefficients for RSI and CCI indicators, respectively. When you set RSI Weight = 0, equalize the combo of CCI and Stoch , when RSI Weight is zero and CCI Weight is equal to the oscillator value will be plotted
only from Stoch . Intermediate values have a high degree of measurement of each of the three oscillators in percentage terms from 0 to 100. The calculation uses the formula: w2 * cci ( + w1 * ( rsi - 50) + (1 - w2 - w1) * ( stoch - 50),
where w1 is RSI Weight and w2 is CCI Weight, Stoch weight is calculated on the fly as (1 - w2 - w1), so the sum of w1 + w2 should not exceed 1, in this case Stoch will work as opposed to CCI and RSI .
.:: Oscillograph fast and slow periods ::.
The fast period is the period for the moving average used to smooth CCI, RSI and Stoch. The slow period is the same. The fast period must always be less than the slow period.
.:: Oscillograph samples period::.
The period of smoothing the total values of indicators - creates a fast and slow main lines of the oscillator.
.:: Oscillograph samples count::.
How many times smoothing applied to source data.
.:: Oscillator samples type ::.
Smoothing line type e.g. EMA, SMA, RMA …
.:: Level period ::.
Periodically moving averages used to form the levels (zone) of the Rainbow Oscillator indicator
.:: Level offset ::.
Additional setting for shifting levels from zero points. Can be useful for absorbing levels and filtering input signals. The default is 0.
.:: Level redundant ::.
It characterizes the severity of the state at each iteration of the level of the disease. If set to 1 - the levels will not decrease when the oscillator values fall. If it has a value of 0.99 - the levels are reduced by 0.01
each has an oscillator in 1% of cases and is pressed to 0 by more aggressive ones.
.:: Level smooth samples ::.
setting allows you to set the number of strokes per level. Measuring the number of averages with the definition of the type of moving averages
.:: Level MA Type ::.
Type of moving average, average for the formation of a smoothing overbought and oversold zone
