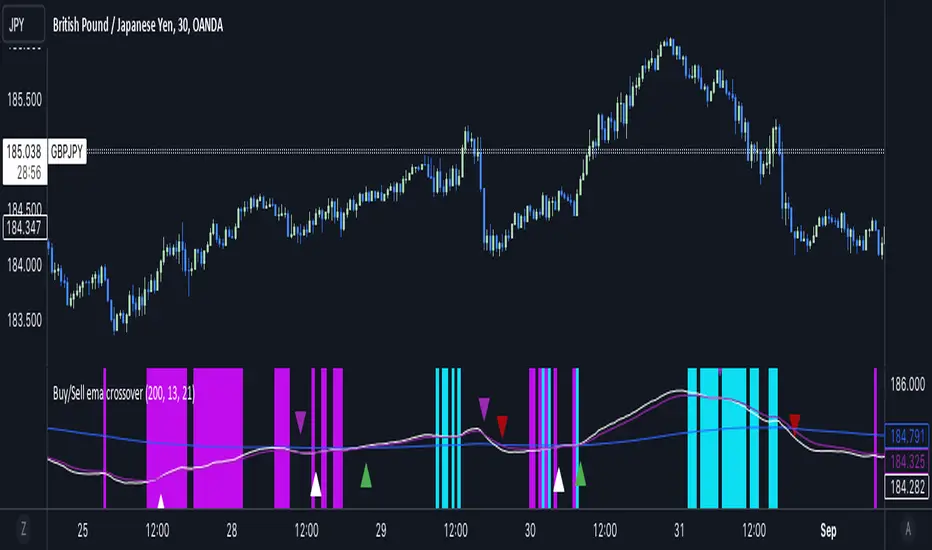
Buy/Sell EMA CrossoverThe indicator identifies potential trading opportunities within the market. It is entirely based on the combination of exponential moving averages by drawing triangles on the chart that identify buy or sell signals combined with vertical bars that create areas of interest.
Specifically, when a buy signal occurs, the indicator draws a vertical bar with an azure background, indicating a possible buy area. Similarly, a sell signal is represented by a vertical bar with a fuchsia background, indicating a possible sell area.
These areas represent the main point of the indicator which uses exponential moving averages which, based on the direction of prices, identify the trend and color the background of the graph in order to visually highlight the predominant trend.
The green triangles above the bars of the chart suggest possible upside opportunities (good bullish entry points) when the 21 ema crosses the 200 ema.
While on the contrary the red triangles, 21 ema lower than the 200 ema, can indicate possible bearish trends (good bearish entry points).
While the white and purple triangles reveal moments of potential indecision or market change.
We can think of them as situations of uncertain trend in which it is possible to place a long or short order near some conditions that we are going to see.
The white triangles below, which are created when the 13 ema is higher than the 21 ema, indicate a possible bullish zone while the purple triangles above (13 ema lower than the 21) could suggest a bearish reflex
Colored lines represent moving averages blue = 200, 21= fuchsia and 13 = white. If the price is above the 200 period line then it could be a bullish opportunity, otherwise it could be a bearish one.
An interesting strategy to adopt is to evaluate, for example, the inputs near the vertical bars (azure - long) (fuchsia - short) when a white or purple triangle appears.
The more prominent green triangle indicates that the trend is going in a long direction.
On the contrary, the red (short) triangles are the opposite of the green ones and have the same importance as input logic.
The white triangle instead present more often inside the indicator identifies interesting buying areas of short duration, it is important to consider that the closer the triangles are to the vertical blue bars the stronger the entry signal.
Finally, the purple triangles are the short-term bearish trends whose entry near the fuchsia vertical bars defines a short.
Cerca negli script per "entry"
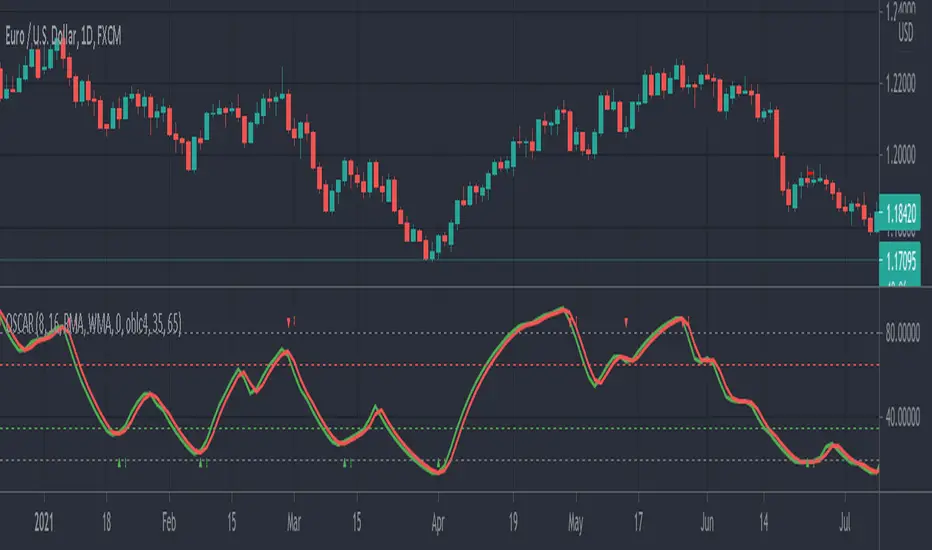
OSCAR Oscillator by GenZai - NNFXOSCAR Oscillator by GenZai
Green line is the Oscar Rough
Red line is the Oscar
By default based on the 8 last candles and smoothed using RMA
Purple line is the Slow Oscar
By default based on the 16 last candles and smoothed using WMA
HOW TO USE
Exit signaling
This indicator can be used as an exit indicator when line cross each other.
Entry signaling
When the green line crosses up, it indicates a long entry
When the red line crosses up, it indicates a short entry
Overbought/Oversold
When the indicator crosses the dashed grey lines it indicates Overbought Oversold
Slow Oscar Add-on
This is an Add-on to the orignal Oscar indicator
Can be hidden if you want the original experience of the Oscar indicator.
Can be used as a confirmation indicator by looking at the direction of the slope to verify is your are trending long or trending short.
Can be used as a baseline to confirm signals given by Oscar
Can be used to tweak your signals and test different settings.
Stock or Forex?
The program was originally written for stocks, but works equally well with the Forex market.
How this indicator is calculated ?
This is the formula we use to calculate the Oscar:
let A = the highest high of the last eight days (including today)
let B = the lowest low of the past eight days (including today)
let C = today's closing price
let X = yesterday's oscillator figure (Oscar)
Today's "rough" oscillator equals (C-B) divided by (A-B) times 100.
Next we "smooth" our rough number (let's call it Y) like this:
Final oscillator number = ((X divided by 3) times 2), plus (Y divided by 3).
SETTINGS:
You can choose between different smoothing options:
RMA: Moving average used in RSI. It is the Adjusted exponential moving averages (also known as Wilder's exponential moving average)
SMA : Simple moving average
EMA : Exponential moving average
WMA : Weighted moving average
Micro Pullback Entry SystemMicro Pullback Entry System - Quick Reference
The Pattern
▲ ENTRY (first green to break high)
│
┌──┴───┐
│ 1-3 │ ← PULLBACK (red candles)
│ red │ Stop = Low of this zone
└──────┘
│
┌──┴───┐
│ 3+ │ ← THE MOVE (green candles)
│green │ Strong momentum
└──────┘
Pattern Checklist
Requirement: Why It Matters
3+ green candlesConfirms momentum
1-3 red pullback Brief = momentum intact< 50% retracementShallow = buyers in controlVolume on entryConfirms breakout Above EMA Trend support
Status Flow
Scanning... → 📈 TRENDING → 👀 WATCHING → ⏳ FORMING → 🎯 ENTRY!
StatusMeaningActionScanningLooking for setupWait📈 TRENDINGGreen streak buildingMonitor👀 WATCHINGPullback startedPrepare⏳ FORMINGValid pullback readyGet ready!🎯 ENTRY!Signal triggeredExecute
Entry/Stop/Target
LevelLine ColorHow to SetEntryLime solidClose of signal candleStopRed dashedLow of pullbackTarget 1Aqua dottedEntry + (2 × Risk)Target 2Yellow dottedEntry + (3 × Risk)
Example
Entry: $5.00
Stop: $4.80
Risk: $0.20
Target 1 (2R): $5.00 + $0.40 = $5.40
Target 2 (3R): $5.00 + $0.60 = $5.60
Quality Grades
GradeScoreActionA+5/5 ✓Best setup - full sizeA4/5 ✓Good setup - standard sizeB3/5 ✓Average - reduced sizeC2/5 ✓Weak - skip or tiny size
Scoring Factors
✓ Green streak met minimum
✓ Pullback length valid (1-3)
✓ Retracement shallow (<50%)
✓ Volume confirmed
✓ Above EMA
Trade Execution
Entry
Wait for "⏳ FORMING" status
Watch for green candle forming
Entry triggers when green candle closes above pullback high
Enter at market or small limit above current price
Stop Loss
Set at pullback low (red dashed line)
Non-negotiable - this is your max risk
Trade Management
If no immediate follow-through → exit early
Take 50% off at Target 1 (aqua line)
Move stop to breakeven
Let remainder run to Target 2
Settings Guide
Default (Recommended)
Min Green Candles: 3
Min Pullback: 1
Max Pullback: 3
Max Retracement: 50%
Volume Multiplier: 1.2x
EMA Filter: ON (20)
Conservative (Fewer, Better)
Min Green Candles: 4
Min Pullback: 2
Max Pullback: 3
Max Retracement: 40%
Volume Multiplier: 1.5x
EMA Filter: ON (20)
Aggressive (More Signals)
Min Green Candles: 2
Min Pullback: 1
Max Pullback: 4
Max Retracement: 60%
Volume Multiplier: 1.0x
EMA Filter: OFF
Common Mistakes
❌ Entering before signal
Wait for green triangle
"FORMING" ≠ "ENTRY"
❌ Wide stop
Stop must be at pullback low
If too wide, skip the trade
❌ Ignoring volume
Low volume entries fail more often
Look for ✓ in volume row
❌ Fighting trend
Check EMA status
Should show "Above ✓"
❌ Chasing after entry
If you miss entry by 3+ candles, wait for next setup
Don't chase extended moves
Best Setups
A+ Quality Setup ✓
4-5 green candles (strong move)
2 candle pullback (brief)
25-35% retracement (shallow)
2x+ volume on entry
Well above EMA
Stock already up 5%+ on day
Avoid These ✗
Only 2 green candles
4+ candle pullback (losing momentum)
50%+ retracement (too deep)
Below average volume
Below or at EMA
Against market direction
Timeframe Guide
TFSignalsQualityBest For1mMostLowerScalping5mBalancedGoodDay trading15mFewestHigherSwing entries
Quick Decision Tree
1. Status showing "FORMING"?
NO → Wait
YES → Continue
2. Quality grade A or better?
NO → Skip or small size
YES → Continue
3. Volume confirmed (✓)?
NO → Caution, reduce size
YES → Continue
4. Above EMA (✓)?
NO → Skip
YES → Continue
5. Risk acceptable? (Stop not too wide)
NO → Skip
YES → TAKE THE TRADE
Alert Setup
Essential Alert
"Micro Pullback Entry" - Main signal
How to Set
Right-click chart → Add Alert
Condition: Micro Pullback Entry System
Select "Micro Pullback Entry"
Set notification preferences
Combining with Other Indicators
IndicatorHow to Use5 PillarsFind stocks meeting criteria firstGap & GoLook for micro pullbacks after gap breakoutsR2G TrackerConfirm stock is green before enteringFloat RotationHigh rotation + micro pullback = best setupsBull FlagMicro pullback is a "mini" bull flag
Example Trade
Stock: XYZ
Pre-market: Gapped up 15%
9:35 - 9:38: 4 green candles (move from $4.50 to $5.00)
9:39 - 9:40: 2 red candles (pullback to $4.85)
9:41: Green candle breaks $4.90 (pullback high)
ENTRY: $4.92
STOP: $4.82 (pullback low)
RISK: $0.10
TARGET 1: $5.12 (+$0.20 = 2R)
TARGET 2: $5.22 (+$0.30 = 3R)
Result: Hit Target 2 by 9:55 → +$0.30 per share
Key Takeaways
Micro = 1-3 candles - Brief pullback
Entry = First green to break high - Specific trigger
Stop = Pullback low - Tight risk
Quality matters - Focus on A/A+ setups
Breakout or bailout - Exit if no follow-through

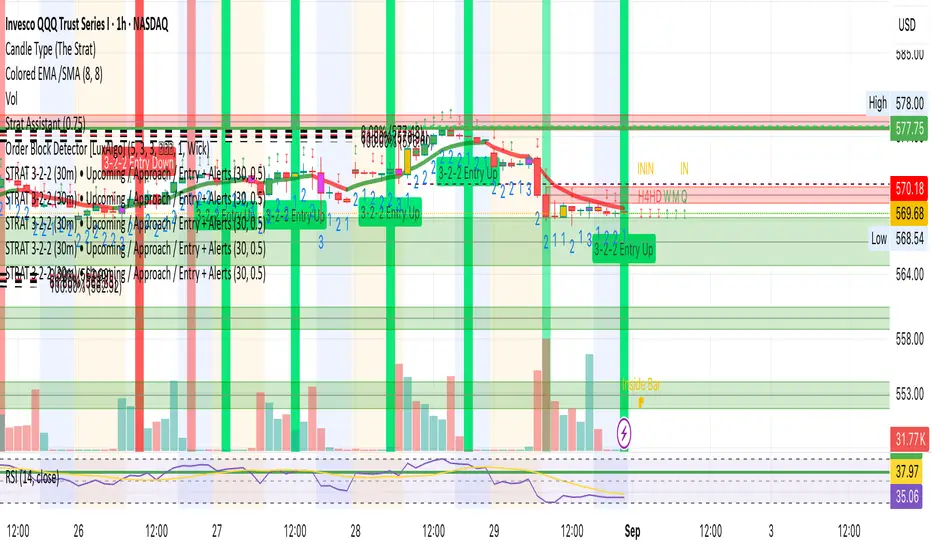
STRAT 3-2-2 (30m) • Upcoming / Approach / Entry + AlertsThis indicator is built for The STRAT trading method, specifically the 3-2-2 reversal pattern. It monitors price action on the 30-minute timeframe (HTF = 30m) and visually/alert-wise highlights where a 3-2-2 setup, approach, or entry trigger occurs.
---
⚙️ How it works
1. Detects bar types:
3 (Outside Bar) = range breaks both high & low of the previous bar
2u (Up bar) = higher high, not outside
2d (Down bar) = lower low, not outside
1 (Inside bar) = fully contained within prior bar
2. Looks for 3-2-2 setups:
Bullish 3-2-2 = 3 → 2d → 2u (expect reversal UP)
Bearish 3-2-2 = 3 → 2u → 2d (expect reversal DOWN)
3. Defines trigger levels:
Bullish trigger = high of the first “2d” bar
Bearish trigger = low of the first “2u” bar
4. Signals 3 phases:
Upcoming: pattern is forming, second “2” hasn’t triggered yet
Approach: price comes within 50% (adjustable) of the trigger level
Entry: price breaks the trigger (actual reversal confirmation)
5. Visualization:
Labels above/below candles show “Approach” and “Entry”
Background or bar colors (toggle in settings) highlight Setup / Approach / Entry
Optional dotted line marks the trigger level for clarity
---
🔔 Alerts
Two alert systems are built in:
1. Safe static conditions (for normal TradingView alert setup):
APPROACH: Bullish 3-2-2 (30m)
APPROACH: Bearish 3-2-2 (30m)
ENTRY: Bullish 3-2-2 (30m)
ENTRY: Bearish 3-2-2 (30m)
2. Dynamic messages (using alert() calls with price info):
If you create an alert with “Any alert() function call”, the pop-up will include the trigger price.
---
📋 Inputs (Settings)
Signal timeframe (HTF) → default 30m
Confirm signals at HTF bar close → waits for bar close (non-repainting)
Approach = % of first '2' bar range → default 50%
Show labels → On/Off
Color candles instead of background → toggle between candle color vs. chart background
EMA+ATR Band MTF Trend EntryThis is a Multi-Timeframe Trend Trading indicator strategy adapted from Sahil Rohmehtra’s Mentorship programme. The trading decision is made by first accessing the trend in higher timeframe (say Monthly) by using TWO EMAs. If the faster EMA (say 20 period) is above Slower EMA (say 50 period) and the price is above slower EMA then the trend is suitable for buyers. Similarly if faster EMA is below slow EMA and the price is below that then trend is suitable for sellers.
Once we access the trend in the higher timeframe we move to the lower timeframe (say Weekly) and access the 5-period RSI value. If RSI is below 30 then we can prepare for possible buy entry in lower (Daily) timeframe if entry conditions are met in daily timeframe. Similarly sell bias can be initiated when the higher timeframe EMA trend is down, daily RSI is above 70 and sell entry condition is met in daily timeframe. The RSI thresholds can be changed by the user.
Once we identified the RSI bias then wait for the confirmation candle in the lower timeframe (say 1 hour). In the entry timeframe we plot a band of 20 EMA of LOWs ± 1 ATR lines. Here,we wait for a candle to close above the 20 EMA of LOWs + 1 ATR for a buy signal with an increase in On Balance Volume (OBV) value. Similarly for sell signal we should get a candle close below the 20 EMA of LOWs - 1 ATR with corresponding change in OBV. This candle is the signal candle.
Once we get a Buy or Sell signal the corresponding stop loss is the nearest LOW - 1 ATR or HIGH + 1 ATR. The ATR scaling may be changed by the user. Now if another candle closes above the high of the buy signal candle then enter on buy. If the low of the buy signal candle is broken then it is a potential short-term sell entry. Similarly if another candle closes below the sell signal candle then enter short and if there is a close above high of the signal candle then it is a potential buy entry.

Bollinger Bands Entry/Exit ThresholdsBollinger Bands Entry/Exit Thresholds
Author of enhancements: chuckaschultz
Inspired and adapted from the original 'Bollinger Bands Breakout Oscillator' by LuxAlgo
Overview
Pairs nicely with Contrarian 100 MA
The Bollinger Bands Entry/Exit Thresholds is a powerful momentum-based indicator designed to help traders identify potential entry and exit points in trending or breakout markets. By leveraging Bollinger Bands, this indicator quantifies price deviations from the bands to generate bullish and bearish momentum signals, displayed as an oscillator. It includes customizable entry and exit signals based on user-defined thresholds, with visual cues plotted either on the oscillator panel or directly on the price chart.
This indicator is ideal for traders looking to capture breakout opportunities or confirm trend strength, with flexible settings to adapt to various markets and trading styles.
How It Works
The Bollinger Bands Entry/Exit Thresholds calculates two key metrics:
Bullish Momentum (Bull): Measures the extent to which the price exceeds the upper Bollinger Band, expressed as a percentage (0–100).
Bearish Momentum (Bear): Measures the extent to which the price falls below the lower Bollinger Band, also expressed as a percentage (0–100).
The indicator generates:
Long Entry Signals: Triggered when the bearish momentum (bear) crosses below a user-defined Long Threshold (default: 40). This suggests weakening bearish pressure, potentially indicating a reversal or breakout to the upside.
Exit Signals: Triggered when the bullish momentum (bull) crosses below a user-defined Sell Threshold (default: 80), indicating a potential reduction in bullish momentum and a signal to exit long positions.
Signals are visualized as tiny colored dots:
Long Entry: Blue dots, plotted either at the bottom of the oscillator or below the price bar (depending on user settings).
Exit Signal: White dots, plotted either at the top of the oscillator or above the price bar.
Calculation Methodology
Bollinger Bands:
A user-defined Length (default: 14) is used to calculate an Exponential Moving Average (EMA) of the source price (default: close).
Standard deviation is computed over the same length, multiplied by a user-defined Multiplier (default: 1.0).
Upper Band = EMA + (Standard Deviation × Multiplier)
Lower Band = EMA - (Standard Deviation × Multiplier)
Bull and Bear Momentum:
For each bar in the lookback period (length), the indicator calculates:
Bullish Momentum: The sum of positive deviations of the price above the upper band, normalized by the total absolute deviation from the upper band, scaled to a 0–100 range.
Bearish Momentum: The sum of positive deviations of the price below the lower band, normalized by the total absolute deviation from the lower band, scaled to a 0–100 range.
Formula:
bull = (sum of max(price - upper, 0) / sum of abs(price - upper)) * 100
bear = (sum of max(lower - price, 0) / sum of abs(lower - price)) * 100
Signal Generation:
Long Entry: Triggered when bear crosses below the Long Threshold.
Exit: Triggered when bull crosses below the Sell Threshold.
Settings
Length: Lookback period for EMA and standard deviation (default: 14).
Multiplier: Multiplier for standard deviation to adjust Bollinger Band width (default: 1.0).
Source: Input price data (default: close).
Long Threshold: Bearish momentum level below which a long entry signal is generated (default: 40).
Sell Threshold: Bullish momentum level below which an exit signal is generated (default: 80).
Plot Signals on Main Chart: Option to display entry/exit signals on the price chart instead of the oscillator panel (default: false).
Style:
Bullish Color: Color for bullish momentum plot (default: #f23645).
Bearish Color: Color for bearish momentum plot (default: #089981).
Visual Features
Bull and Bear Plots: Displayed as colored lines with gradient fills for visual clarity.
Midline: Horizontal line at 50 for reference.
Threshold Lines: Dashed green line for Long Threshold and dashed red line for Sell Threshold.
Signal Dots:
Long Entry: Tiny blue dots (below price bar or at oscillator bottom).
Exit: Tiny white dots (above price bar or at oscillator top).
How to Use
Add to Chart: Apply the indicator to your TradingView chart.
Adjust Settings: Customize the Length, Multiplier, Long Threshold, and Sell Threshold to suit your trading strategy.
Interpret Signals:
Enter a long position when a blue dot appears, indicating bearish momentum dropping below the Long Threshold.
Exit the long position when a white dot appears, indicating bullish momentum dropping below the Sell Threshold.
Toggle Plot Location: Enable Plot Signals on Main Chart to display signals on the price chart for easier integration with price action analysis.
Combine with Other Tools: Use alongside other indicators (e.g., trendlines, support/resistance) to confirm signals.
Notes
This indicator is inspired by LuxAlgo’s Bollinger Bands Breakout Oscillator but has been enhanced with customizable entry/exit thresholds and signal plotting options.
Best used in conjunction with other technical analysis tools to filter false signals, especially in choppy or range-bound markets.
Adjust the Multiplier to make the Bollinger Bands wider or narrower, affecting the sensitivity of the momentum calculations.
Disclaimer
This indicator is provided for educational and informational purposes only.

Dynamic Trading Strategy with Key Levels, Entry/Exit ManagementThis indicator provides a complete rule-based trading system, combining key levels, entry conditions, stop loss (SL), and take profit (TP) management. It’s designed to dynamically adapt to market conditions by identifying crucial support and resistance zones, determining entry points based on price action and volume, and calculating risk-based exit targets.
Key Features
Key Level Identification:
The indicator automatically identifies support and resistance levels based on recent price highs and lows within a customizable lookback period.
It adds a dynamic buffer around these levels using the Average True Range (ATR) to account for market volatility, ensuring the zones adjust to changing conditions.
Entry Conditions:
Bullish Entry: Triggers near the support zone when there’s upward price action, confirmed by volume spikes and bullish candlestick patterns (e.g., hammers, engulfing candles).
Bearish Entry: Triggers near the resistance zone when signs of rejection appear, confirmed by volume spikes and bearish candlestick patterns (e.g., shooting stars, bearish engulfing).
Entry zones are highlighted visually on the chart using green (bullish) and red (bearish) shaded boxes.
Stop Loss (SL) and Take Profit (TP):
Stop Loss: Calculated based on ATR multipliers, allowing you to set a volatility-adjusted risk level beyond the entry range.
Take Profit: Includes two profit-taking levels (TP1 and TP2), allowing for partial position exits. TP levels are calculated based on a reward-to-risk ratio, ensuring consistent profitability targets.
SL and TP levels are clearly marked with horizontal lines and labeled as SL, TP1, and TP2, helping you manage trade exits effectively.
Market Context Adaptability:
The indicator adapts to both trending and ranging market conditions. In trending markets, it favors trades that follow the trend, while in ranging markets, it focuses on reversals within the range boundaries.
Visual Aids:
Entry zones are highlighted with shaded boxes to indicate potential buy/sell regions.
SL, TP1, and TP2 levels are clearly drawn with labels, allowing for easy identification of exit points.
How to Use
Identify Key Levels: Look for support and resistance zones highlighted by the indicator on your chart.
Wait for Entry Conditions: When the price enters the entry range (marked by green or red boxes), wait for confirmation signals—such as volume spikes and candlestick patterns.
Manage Exits: Use the SL, TP1, and TP2 levels for structured trade management. Consider scaling out partially at TP1 and exiting fully at TP2.
Ideal For:
This indicator is suitable for traders who prefer a systematic approach to trading, with clear entry and exit rules. It is particularly helpful for those looking to balance risk and reward with well-defined take profit and stop loss levels.

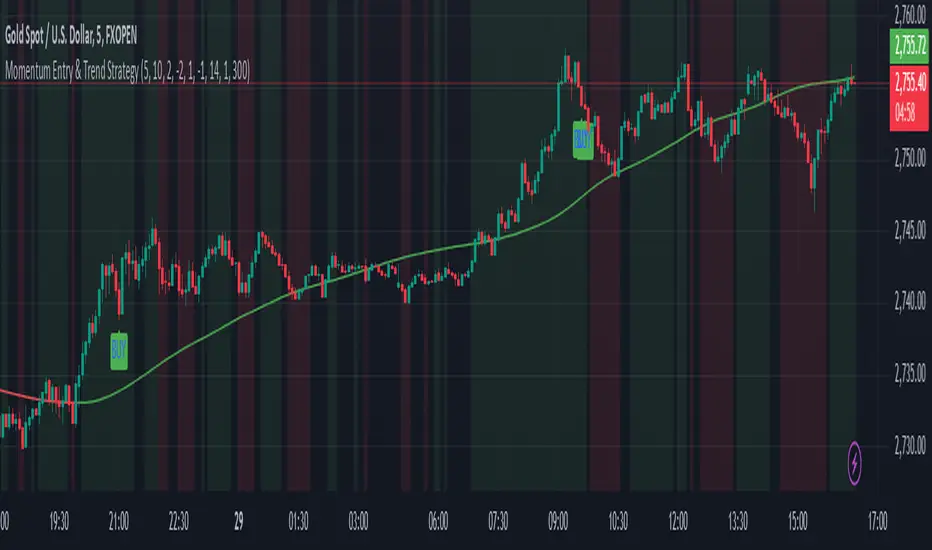
Momentum Entry & Trend Strategy M5Momentum Entry & Trend Strategy M5
Description:
The Momentum Entry & Trend Strategy M5 is an indicator script designed to assist traders in determining optimal buy and sell moments based on momentum and trend analysis. This script operates using two different momentum levels—Momentum Length for Entry (5) and Momentum Length for Trend (10)—along with the HMA (Hull Moving Average) indicator for trend confirmation.
Key Features:
Momentum Entry: Calculates momentum using the difference between the current price and the price from previous periods to determine the strength and direction of price movements.
Trend Identification: Utilizes two momentum levels (5 and 10) to identify bullish and bearish trend conditions.
HMA for Trend Confirmation: The HMA indicator is used to provide trend confirmation signals. When HMA indicates bullish, a buy signal is displayed; conversely, a bearish HMA results in a sell signal.
Signal Display: Displays buy (BUY) and sell (SELL) signals on the chart when the conditions for market entry are met, providing clear visualization for traders.
Background Color: Offers a green background for uptrends and a red background for downtrends, allowing traders to easily identify the overall market condition.
ATR (Average True Range): Calculates and plots a smoothed ATR to help traders measure market volatility.
Settings:
Momentum Length for Entry: 5 (to determine entry signals)
Momentum Length for Trend: 10 (to determine trend conditions)
HMA Length: 300 (period length for HMA to confirm trends)
ATR Length: 14 (period length for ATR to measure volatility)
Benefits:
This script is designed to provide visual and data-driven guidance for better trading decision-making. By combining momentum and trend analysis, traders can enhance the accuracy of their signals and reduce the risk of errors when identifying entry and exit points in the market.
Note:
This script is intended for use on the M5 time frame but can be adjusted for other time frames as needed. It is always recommended to conduct thorough testing before applying trading strategies on a live account.
ATR Range Pivot LinesDescription:
This Pine Script calculates and plots pivot lines based on ATR (Average True Range) value and closing price. It uses the previous trading day's ATR value to set static pivot levels for the current trading day. These pivot lines help traders identify potential support and resistance levels based on historical volatility. The script includes two main pivot lines—ATR High and ATR Low —and two midpoint lines between them for additional context. Labels are added to show the exact pivot values, with options to customize label positions.
Intended Use:
The script is designed to help traders forecast potential price ranges for the current trading day based on the previous day’s volatility. By adding and subtracting the previous day's ATR from the prior close, the script identifies key levels where price action may encounter support or resistance. It is useful for setting realistic price targets or entry/exit points. Since the ATR-based pivot lines are static for the entire day, they provide a reliable range for intraday trading strategies.
Disclosure:
This script was generated using AI. It is recommended to review and test the script thoroughly before applying it in live trading scenarios.

Risk:RewardThis Indicator displays Entry and Exits levels. The display is done under 3 modes:
- Risk/Reward mode (the one by default. It is set to a 1:1 ratio)
- Multiples TP Levels
- Custom Levels
Click to Set entry Price on chart
The displaying is static by default
to make it dynamic disable the "Use custom Entry ?" input.
Disclaimer: Scripts that I post publicly are experimental. They are not financial advices. Always backtest your ideas using your own methodologies.

TrapLightTrap Light is built off the stochastic RSI to provide convenience and make your entries while scalping either long/short more straightforward.
Notes/Disclaimer:
This indicator is not guaranteed to work every time. Use it at your own discretion and perform your own due diligence. None of this is financial advice.
The main idea behind this is that when the stochastic RSI reaches such extremes that it often moves in a favorable direction.
K = momentum or the blue line of the stochastic RSI indicator.
Perks:
Don't have to look away from candlesticks and measure stochastic RSI's K level.
Simple visual indication of what to do.
Don't have to stare at your chart all day waiting for things to get exciting.
How to Use:
(Above the current candlestick on any timeframe)
1. When K is greater than or equal to 99.5, it shows a sell signal. This is to indicate a short entry.
2. When K is less than or equal to 0.5, it shows a buy signal. This is to indicate a long entry.
3. If neither the conditions for a short/long entry are present, it shows a circle that is like a traffic light.
Red Light: When K is between 99.5 and 95, a red circle is shown to indicate that a short entry may be available soon.
Yellow Light: When K is between 95 and 5, a yellow circle is shown to indicate that neither a long nor short entry may be available soon.
Green Light: When K is between 5 and 0.5, a green circle is shown to indicate that a long entry may be available soon.
Alerts:
Set an alert on the ticker you trade to notify you when either the green or red light is present so that you have time to prepare to make an entry either long/short.
The Code:
The PineScript is open-source and annotated to explain different parts of the script for ease of understanding.
@Credit to Kingson1 for this strategy and his feedback on its creation/implementation.

Gain/StopLoss Percentage LinesGain/StopLoss Percentage Lines is a quick way to enter your Entry Price in to a stock and track the percentage of gain or loss at the 5% and 10% markers.
Click on the gear settings icon and type in your entry price. The percentage is defaulted to 5%. You can change this to a different percentage at this screen. Note that whatever number you enter will be doubled for the upper and lower lines. For instance, if you want to set your first red line stop loss and green gain line at 2.5%, your two other upper and lower green and red lines will be at 5%.
However, this will not change the text on the tab marker.
To change the tab text, go in to the Pine Editor and change the green text that says "5% Gain" and "5% Loss" to your new percentages.

Relative Volume Screener AlertsThis script will screen 12 different stocks and current chart (13 in total) for entry points from my relative volume indicator.
1. Enter in any ticker ID's from charts you wish to scan in the settings.
2. Go to desired timeframe.
3. Click add alert button at top toolbar.
4. Select RVOL Screener Alerts indicator, input alert notification settings and/or change alert name and click create.
The script will then scan the stocks and alert you of any entry points from the timeframe you set the alerts.
A new alert needs to be created for each timeframe you wish to screen.
You can find my relative volume indicator here:

SNAP BACK 2.0 Strategy
This strategy is designed to allow you to catch the bounce or "SNAP Back" of an equity that has been in a trend.
1) Once the moving averages are in the order of 200SMA > 50 SMA > 34EMA > 20SMA > 8EMA (or reverse for and uptrend), the strategy is setup.
2) Next you wait for a trigger of the closing price crossing the 8EMA, while there is a desired gap size between the 8EMA and the 20SMA (2-10% of stock value preferred).
3) Exit position based on target profit reached (conservative sell half at 34EMA and engage a trailing stop loss for remainder or set static limit) or price crosses 8EMA or stop loss%
*)This code also allows you to determine your desired backtesting date compliments of alanaster
This code is the product of many hours of hard work on the part of the greater tradingview community. The credit goes to everyone in the community who has put code out there for the greater good.
The idea for the coding came from a video I watched on YouTube presented by TradeStation called Snap Back - thank you guys for the inspiration.
UPDATE: I have coded the other side of the strategy to allow you to take advantage of the same set-up in an uptrend for Short plays. You can turn the up or downsides on, off, or both.
The main intent is to catch the bounces of a falling stock. However, I have found that you can do the inverse and catch the drops in a rising stock (the latter is not as reliable). This also tends to work better on less volatile stocks. I have included a large volume of user defined conditions and display entry and exit conditions on the chart to see how your choices are impacting the script.

Forex Scalp Triggersthe triggers only work to tell you go back 5 candles on 5 min, take either lowest or highest plus 3 pips and make entry and go 3 pip over under trigger for stop loss. can take half profit at 1x and move stop to break even and go 1x more for take rest profit, or create a trailing stop loss on Take Profit level 2 and ride the trend.
1 Hour chart has to be over under the emas that are faned out nicely to move to 5 min chart to look for the signals if 1hr chart isnt over under the emas nicely then NO TRADE
ForexSignalTV helped create this strategy, just my first script so learning, want to take it to next level but kind of stuck for now. More knowledge coming...
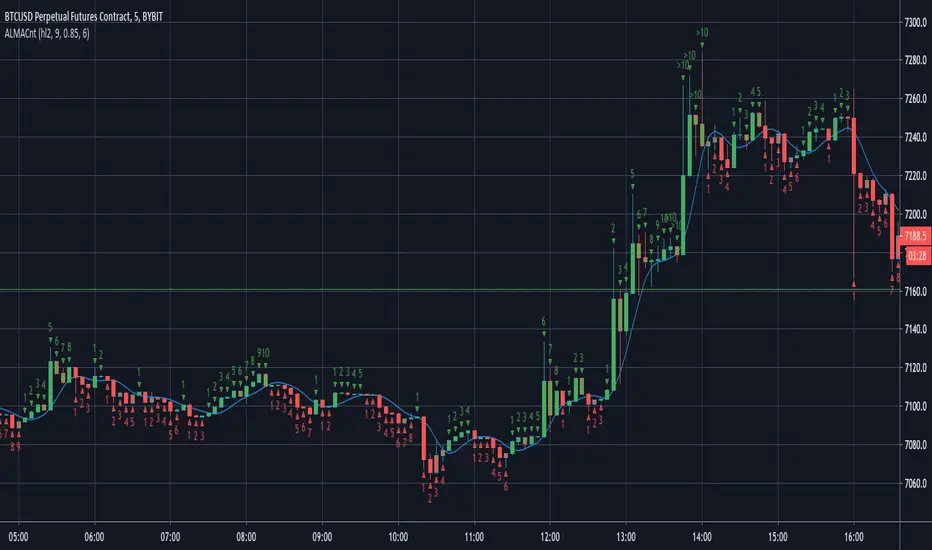
ALMA CounterIt counts how many candles are below or above the Arnaud Legoux Moving Average (ALMA).
It may be useful to found good entry points.
Double TRIX CrossoverTRIX is a great indicator to use on zero cross setups.... know what's even better? TRIX CROSS setups!!!
Faster in-and-out on trends, safer entry and exit signals in chop or consolidation. Base setup is 6 & 8 TRIX for longer time frames such as 4hr or 8hr; ideal or FX, Crypto, or volatile instruments. I haven't experimented with using this on lower time charts and adjusting the trix settings; if you do, drop a comment.
Breakout Reversal Entry on WMA - NG1! Overnight ver 1This script is for learning purposes only
This strategy will plot arrows when price breaks so far above/below WMA. The strategy will enter when the price breaks away from WMA. All entries are reversals. Users can set WMA length and source; also the distance of the price away from WMA to enter. Adjustable bracket orders are placed for exit, with trailing stop or market stop choice. Last, users can set the time of day they want to enter a trade.
My Preference: I am testing this strategy on NG1! over night on 1 minute candle. with .003 on price drop/climb, I get entries almost every night. Also 10 tick stop and 5 tick profit seems backward to most, but with a high win/loss ratio, it performs quite well. Trailing stops generally help out as well.
INPUTS:
Length - The is the WMA length
Source - WMA source (High, Low, Open, Close...)
When Price Drops - This is the distance in ticks when the price drops away from WMA, an arrow is plotted, and reversal entry order is placed
When Price Climbs - Same as price drop, just in the opposite direction
Trailing Stop check box - Check if you want to place a trailing stop so many tick away from entry. Unchecked is Market (hard) stop so many ticks from entry.
Stop - Number of ticks away from entry a the stop or trailing stop is set (for NG 1 tick = $0.001)
Limit Out - Number of ticks away from entry a limit order is placed to take profits
Limit Time of day check box - check to use the time of day to limit what time of day order entry will occur.
Start/Stop Trades (Est Time) - First box is when the strategy will be allowed to start buying and stop is when the strategy will stop being allowed to buy. Sell orders continue until a stop or limit triggers an exit. These times are Eastern time zone
PROPERTIES:
Pyramiding - This feature will allow multiple entries to occur. If set to 1, the strategy should only trade 1 contract at a time. If set to 2, the strategy will enter a second order if entry requirements are met. This allows you to be holding 2 contracts. Basically on a good day, it will multiply your earnings, on a bad day, you'll just lose more. For testing, I keep this on 1.
TIPS:
- If you want to go long only, set "When Price Climbs" to an impossible number, like 10,000. It's not possible for NG to move $10 is a matter of minutes so it will not enter the market with a short order. Also keep in mind you can set different requirements for going long vs going short. If you think there is more pull on the market in a particular direction.

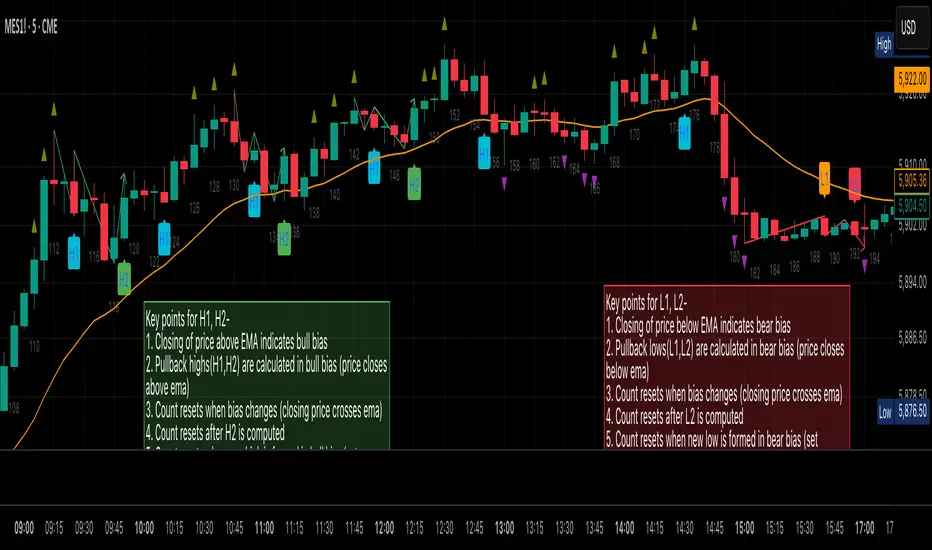
Al Brooks Second Entry**\ Al Brooks Second Entry Indicator\ **
This custom indicator helps identify second-entry setups based on Al Brooks' price action principles. The script marks key levels in trending markets, indicating potential long and short entries. It displays the first and second entry signals (H1, H2, L1, L2) as well as relevant pullback zones for added clarity.
\ Features:\
\
\ \ First Entry Signals\ : H1 (Long) and L1 (Short) are marked when a trend begins to form.
\ \ Second Entry Signals\ : H2 (Long) and L2 (Short) are plotted once the market pulls back and continues in the direction of the trend.
\ \ EMA Filter\ : An Exponential Moving Average (EMA) is included to filter trades in the direction of the trend (longs above EMA, shorts below EMA).
\ \ Pullback Zones\ : Highlighted areas to assist in identifying optimal zones for entry.
\ \ Adjustable Label Sizes\ : Customize the appearance of the entry labels (tiny or small).
\
\ Inputs:\
\
\ \ Show First/Second Entry\ : Control whether the first (H1, L1) and second (H2, L2) entry signals are displayed.
\ \ EMA Length\ : Set the length of the EMA to use for trend direction.
\ \ Label Size\ : Choose between tiny and small label sizes for clear chart visibility.
\ \ Pullback Zones\ : Toggle the highlighting of pullback zones.
\
\ How it Works:\
\
\ The indicator detects a trend direction using price action (new highs/lows, inside/outside bars).
\ Once a trend is identified, it waits for a pullback and marks the first and second entry points (H1, H2, L1, L2).
\ The indicator also plots the EMA to help confirm the overall market bias.
\ Pullback zones are drawn to help spot potential areas of support or resistance.
\
This script is ideal for traders looking to trade retracements in trending markets, providing clear entry signals and a visual representation of market structure.
Pullback Entry Zone FinderPullback Entry Zone Finder
Overview:
This indicator is designed to help traders identify potential buying opportunities during short-term pullbacks, particularly when faster-moving averages show signs of converging back towards slower ones. It visually flags potential zones where price might find support and resume its upward movement, based on moving average dynamics and price proximity.
How It Works:
The indicator utilizes four customizable moving averages (Trigger, Short-term, Intermediate, and Long-term) and Average True Range (ATR) to pinpoint specific conditions:
Pullback Detection: It identifies when the fast 'Trigger MA' is below the 'Short-term MA', indicating a potential short-term pullback or consolidation phase.
MA Convergence: Crucially, it looks for signs that the pullback might be weakening by detecting when the gap between the Short-term MA and the Trigger MA is narrowing (maConverging). This suggests the faster average is starting to catch up, potentially preceding a move back up.
Base Buy Zone (Orange Diamond): This signal appears when both the Pullback and Convergence conditions are met simultaneously. It indicates the general area where conditions are becoming favourable for a potential entry.
Refined Entry Zones:
Prime Entry Zone (Green Diamond): This appears within a Base Buy Zone if the bar's low comes within a specified percentage (Max Distance %) of the Short-term MA. It suggests price has pulled back close to the dynamic support of the Short MA.
ATR Entry Zone (Purple Diamond): This appears within a Base Buy Zone if the bar's low comes within the specified percentage (Max Distance %) of an ATR-based target level. This target level (Buy ATR Target Level, plotted as a purple line when active) is calculated by adding a multiple (ATR Multiplier %) of the ATR to the Short-term MA, providing a volatility-adjusted potential entry area.
Visual Elements:
Moving Averages: Four lines representing the Trigger, Short-term, Intermediate, and Long-term MAs (colors and opacity are customizable). Use the Intermediate and Long-term MAs to gauge the broader market trend.
Orange Diamond (Below Bar): Indicates a 'Base Buy Zone' where a pullback and MA convergence are detected.
Green Diamond (Below Bar): Indicates a 'Prime Entry Zone' where price is close to the Short-term MA during a Base Buy Zone.
Purple Diamond (Below Bar): Indicates an 'ATR Entry Zone' where price is close to the ATR-based target level during a Base Buy Zone.
Purple Line: Plots the calculated 'Buy ATR Target Level' only when the Base Buy Zone condition is active.
Input Parameters:
Moving Averages: Customize the Length and Type (EMA, SMA, WMA, VWMA) for all four moving averages.
ATR Settings: Adjust the ATR Length, the ATR Multiplier % (for calculating the target level), and the Max Distance % (for triggering the Prime and ATR Entry Zones).
Visualization: Set the colors for the four Moving Average lines.
How to Use:
Look for the Orange Diamond as the initial signal that pullback/convergence conditions are met.
The Green and Purple Diamonds suggest price has reached potentially more optimal entry levels within that zone, based on proximity to the Short MA or the ATR target, respectively.
Always consider the signals within the context of the broader trend, indicated by the Intermediate and Long-term MAs. This indicator is generally more effective when used to find entries during pullbacks within an established uptrend (e.g., Intermediate MA > Long MA).
Combine these signals with other forms of analysis, such as chart patterns, support/resistance levels, volume analysis, or other indicators for confirmation.
Disclaimer:
You should always use proper risk management techniques and conduct your own analysis before making any trading decisions. This indicator, or any other, will be of no use if you don't have good risk management.

Relative Risk MetricOVERVIEW
The Relative Risk Metric is designed to provide a relative measure of an asset's price, within a specified range, over a log scale.
PURPOSE
Relative Position Assessment: Visualizes where the current price stands within a user-defined range, adjusted for log scale.
Logarithmic Transformation: Utilizes the natural log to account for a log scale of prices, offering a more accurate representation of relative positions.
Calculation: The indicator calculates a normalized value via the function Relative Price = / log(UpperBound) − log(LowerBound) . The result is a value between 0 and 1, where 0 corresponds to the lower bound and 1 corresponds to the upper bound on a log scale.
VISUALIZATION
The indicator plots three series:
Risk Metric - a plot of the risk metric value that’s computed from an asset's relative price so that it lies within a logarithmic range between 0.0 & 1.0.
Smoothed Risk Metric - a plot of the risk metric that’s been smoothed.
Entry/Exit - a scatter plot for identified entry and exit. Values are expressed as percent and are coded as red being exit and green being entity. E.g., a red dot at 0.02 implies exit 2% of the held asset. A green dot at 0.01 implies use 1% of a designated capital reserve.
USAGE
Risk Metric
The risk metric transformation function has several parameters. These control aspects such as decay, sensitivity, bounds and time offset.
Decay - Acts as an exponent multiplier and controls how quickly dynamic bounds change as a function of the bar_index.
Time Offset - provides a centering effect of the exponential transformation relative to the current bar_index.
Sensitivity - controls how sensitive to time the dynamic bound adjustments should be.
Baseline control - Serves as an additive offset for dynamic bounds computation which ensures that bounds never become too small or negative.
UpperBound - provides headroom to accomodate growth an assets price from the baseline. For example, an upperbound of 3.5 accommodates a 3.5x growth from the baseline value (e.g., $100 -> $350).
LowerBound - provides log scale compression such that the overall metric provides meaningful insights for prices well below the average whilst avoiding extreme scaling. A lowerbound of 0.25 corresponds to a price that is approx one quarter of a normalised baseline in a log context.
Weighted Entry/Exit
This feature provides a weighted system for identifying DCA entry and exit. This weighting mechanism adjusts the metric's interpretation to highlight conditions based on dynamic thresholds and user-defined parameters to identify high-probability zones for entry/exit actions and provide risk-adjusted insights.
Weighting Parameters
The weighting function supports fine-tuning of the computed weighted entry/exit values
Base: determines the foundational multiplier for weighting the entry/exit value. A higher base amplifies the weighting effect, making the weighted values more pronounced. It acts as a scaling factor to control the overall magnitude of the weighting.
Exponent: adjusts the curve of the weighting function. Higher exponent values increase sensitivity, emphasizing differences between risk metric values near the entry or exit thresholds. This creates a steeper gradient for the computed entry/exit value making it more responsive to subtle shifts in risk levels.
Cut Off: specifies the maximum percentage (expressed as a fraction of 1.0) that the weighted entry/exit value can reach. This cap ensures the metric remains within a meaningful range and avoids skewing
Exit condition: Defines a threshold for exit. When the risk metric is below the exit threshold (but above the entry threshold) then entry/exit is neutral.
Entry condition: Defines a threshold for entry. When the risk metric is above the entry threshold (but below the exit threshold) then entry/exit is neutral.
Weighting Behaviour
For entry conditions - value is more heavily weighted as the metric approaches the entry threshold, emphasizing lower risk levels.
For exit conditions - value is more heavily weighted as the metric nears the exit threshold, emphasizing increased risk levels.
USE-CASES
Identifying potential overbought or oversold conditions within the specified logarithmic range.
Assisting in assessing how the current price compares to historical price levels on a logarithmic scale.
Guiding decision-making processes by providing insights into the relative positioning of prices within a log context
CONSIDERATIONS
Validation: It's recommended that backtesting over historical data be done before acting on any identified entry/exit values.
User Discretion: This indicator focus on price risk. Consider other risk factors and general market conditions as well.

Trade Entry Detector, Wick to Body Ratio Trade Entry Detector: Wick-to-Body Ratio Strategy with Bollinger Bands
Overview
The Trade Entry Detector is a custom strategy for TradingView that leverages the Bollinger Bands and a unique wick-to-body ratio approach to capture precise entry opportunities. This indicator is designed for traders who want to pinpoint high-probability reversal points when price interacts with Bollinger Bands, all while offering flexible entry fill options.
The strategy performs primary analysis on the daily time frame, regardless of your current chart setting, allowing you to view daily Bollinger Band levels and entry signals even on lower time frames. This approach is suitable for swing traders and short-term traders looking to align intraday moves with higher time frame signals.
How the Strategy Works
1. Bollinger Band Analysis on the Daily Time Frame
Bollinger Bands are calculated using a 20-period simple moving average (SMA) and a standard deviation multiplier (default is 2). These bands dynamically expand and contract based on market volatility, making them ideal for identifying overbought and oversold conditions:
* Upper Band: Indicates potential overbought levels.
* Lower Band: Indicates potential oversold levels.
2. Wick-to-Body Ratio Condition
This strategy places significant emphasis on candle wicks relative to the candle body. Here’s why:
* A large upper wick relative to the body signals potential selling pressure after testing the upper Bollinger Band.
* A large lower wick relative to the body indicates buying support after testing the lower Bollinger Band.
* Ratio Threshold: You can set a minimum wick-to-body ratio (default is 1.0), meaning that the wick must be at least equal in size to the body. This ensures only candles with significant reversals are considered for entry.
3. Flexible Entry Timing
To adapt to various trading styles, the indicator allows you to choose the entry fill timing:
* Daily Close: Enter at the close of the daily candle.
* Daily Open: Enter at the open of the following daily candle.
* HOD (High of Day): Set entry at the daily high, for those who want confirmation of upward momentum.
* LOD (Low of Day): Set entry at the daily low, ideal for confirming downward movement.
4. Position Sizing and Risk Management
The strategy calculates position size based on a fixed risk percentage of your account balance (default is 1%). This approach dynamically adjusts position sizes based on stop-loss distance:
* Stop Loss: Placed at the nearest swing high (for shorts) or swing low (for longs).
* Take Profit: Exits are triggered when the price reaches the opposite Bollinger Band.
5. Order Expiration
Each pending order (long or short) expires after two days if unfilled, allowing for new setups on subsequent candles if conditions are met again.
Using the Trade Entry Detector
Step-by-Step Guide
1. Set the Primary Time Frame
The core calculations run on the daily time frame, but the strategy can be applied to intraday charts (e.g., 65-minute or 15-minute) for deeper insights.
2. Adjust Bollinger Band Settings
* Length: Default is 20, which determines the period for calculating the moving average.
* Standard Deviation Multiplier: Default is 2.0, which sets the width of the bands. Adjusting this can help you capture broader or tighter volatility ranges.
3. Define the Wick-to-Body Ratio
Set the minimum ratio between wick and body (default 1.0). Higher values filter out candles with less wick-to-body contrast, focusing on stronger rejection moves.
4. Choose Entry Fill Timing
Select your preferred fill condition:
* Daily Close: Confirms the trade at the end of the daily session.
* Daily Open: Executes the entry at the open of the next day.
* HOD/LOD: Uses the daily high or low as an additional confirmation for upward or downward moves.
5. Position Sizing and Risk Management
* Set your account balance and risk percentage. The strategy automatically calculates position sizes based on the stop distance to manage risk efficiently.
* Stop Loss and Take Profit points are automatically set based on swing highs/lows and opposing Bollinger Bands, respectively.
Practical Example
Let’s say SPY (S&P 500 ETF) tests the lower Bollinger Band on the daily time frame, with a lower wick that is twice the size of the body (meeting the 1.0 ratio threshold). Here’s how the strategy might proceed:
1. Signal: The lower wick on SPY suggests buying interest at the lower Bollinger Band.
2. Entry Fill Timing: If you’ve selected "Daily Open," the entry order will be placed at the next day's open price.
3. Stop Loss: Positioned at the nearest daily swing low to minimize risk.
4. Take Profit: If SPY price moves up and reaches the upper Bollinger Band, the position is automatically closed.
Indicator Features and Benefits
* Multi-Time Frame Compatibility: Perform daily analysis while tracking signals on any intraday chart.
* Automatic Position Sizing: Tailor risk per trade based on account balance and desired risk percentage.
* Flexible Entry Options: Choose from close, open, HOD, or LOD for optimal timing.
* Effective Trend Reversal Identification: Uses wick-to-body ratio and Bollinger Band interaction to pinpoint potential reversals.
* Dynamic Visualization: Bollinger Bands are displayed on your chosen time frame, allowing seamless intraday tracking.
Summary
The Trade Entry Detector provides a unique, data-driven way to spot reversal points with customizable entry options. By combining Bollinger Bands with wick-to-body ratio conditions, it identifies potential trade setups where price has tested extremes and shown reversal signals. With its flexible entry timing, risk management features, and multi-time frame compatibility, this indicator is ideal for traders looking to blend daily market context with shorter-term execution.
Tips for Usage:
* For swing trading, consider the Daily Open or Close entry options.
* For momentum entries, HOD or LOD may offer better alignment with the direction of the wick.
* Backtest on different assets to find optimal Bollinger Band and wick-to-body settings for your market.
Use this indicator to enhance your understanding of price behavior at key levels and improve the precision of your entry points. Happy trading!

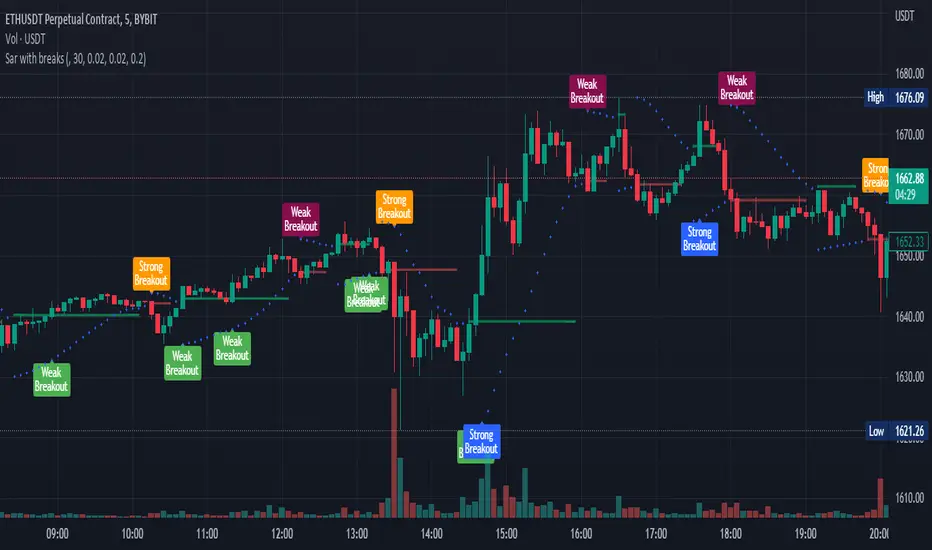
Parabolic sar with breaksThis plots a Parabolic sar and a break line on the previous sar point before the parabolic sar flips.
This is looking to be a very popular entry signal for lots of strats.
How to use:
In conjunction with other confirmation indicators;
Long : Enter long when the Parabolic sar is below the price and the price breaks above (and closes) the break line.
Short : Enter short when the Parabolic sar is above the price and the price breaks below (and closes) the break line.
A great indicator combination for this is to use a 200 ema for price trend and volume flow.