EMA 200 Monitor - Bybit CoinsEMA 200 Monitor - Bybit Coins
📊 OVERVIEW
The EMA 200 Monitor - Bybit Coins is an advanced indicator that automatically monitors 30 of the top cryptocurrencies traded on Bybit, alerting you when they are close to the 200-period Exponential Moving Average on the 4-hour timeframe.
This indicator was developed especially for traders who use the EMA 200 as a key support/resistance level in their swing trading and position trading strategies.
🎯 WHAT IT'S FOR
Multi-Asset Monitoring: Simultaneous monitoring of 30 cryptocurrencies without having to switch between charts
Opportunity Identification: Detects when coins are approaching the 200 EMA, a crucial technical level
Automated Alerts: Real-time notifications when a coin reaches the configured proximity
Time Efficiency: Eliminates the need to manually check chart collections
⚙️ HOW IT WORKS
Main Functionality
The indicator uses the request.security() function to fetch price data and calculate the 200 EMA of each monitored asset. With each new bar, the script:
Calculates the distance between the current price and the 200 EMA for each coin
Identifies proximity based on the configured percentage (default: 2%)
Displays results in a table organized on the chart
Generates automatic alerts when proximity is detected
Monitored Coins
Major : BTC, ETH, BNB, ADA, XRP, SOL, DOT, DOGE, AVAX
DeFi : UNI, LINK, ATOM, ICP, NEAR, OP, ARB, INJ
Memecoins : SHIB, PEPE, WIF, BONK, FLOKI
Emerging : SUI, TON, APT, POL (ex-MATIC)
📋 AVAILABLE SETTINGS
Adjustable Parameters
EMA Length (Default: 200): Exponential Moving Average Period
Proximity Percentage (Default: 2%): Distance in percentage to consider "close"
Show Table (Default: Active): Show/hide results table
Table Position: Position of the table on the chart (9 options available)
Color System
🔴 Red: Distance ≤ 1% (very close)
🟠 Orange: Distance ≤ 1.5% (close)
🟡 Yellow: Distance ≤ 2% (approaching)
🚀 HOW TO USE
Initial Configuration
Add the indicator to the 4-hour timeframe chart
Set the parameters according to your strategy
Position the table where there is no graphic preference
Setting Alerts
Click "Create Alert" in TradingView
Select the "EMA 200 Monitor" indicator
Set the notification frequency and method
Activate the alert to receive automatic notifications
Results Interpretation
The table shows:
Coin: Asset name (e.g. BTC, ETH)
Price: Current currency quote
EMA 200: Current value of the moving average
Distance: Percentage of proximity to the core code
💡 STRATEGIES TO USE
Reversal Trading
Entry: When price touches or approaches the EMA 200
Stop: Below/above the EMA with a safety margin
Target: Previous resistance/support levels
Breakout Trading
Monitoring: Watch for currencies consolidating near the EMA 200
Entry: When the media is finally broken
Confirmation: Volume and close above/below the EMA
Swing Trading
Identification: Use the monitor to detect setups in formation
Timing: Wait for the EMA 200 to approach for detailed analysis
Management: Use the EMA as a reference for stops dynamics
⚠️ IMPORTANT CONSIDERATIONS
Technical Limitations
Request Bybit data: Access to exchange symbols required
Specific timeframe: Optimized for 4-hour analysis
Minimum delay: Data updated with each new bar
Usage Recommendations
Combine with technical analysis: Use together with other indicators
Confirm the configuration: Check the graphic patterns before trading
Manage risk: Always use stop loss and adequate position sizing
Backtesting: Test your strategy before applying with real capital
Disclaimer
This indicator is a technical analysis tool and does not constitute investment advice. Always do your own analysis and manage detailed information about the risks of your operations.
🔧 TECHNICAL INFORMATION
Pine Script version: v6
Type: Indicator (overlay=true)
Compatibility: All TradingView plans
Resources used: request.security(), arrays, tables
Performance: Optimized for multiple simultaneous queries
📈 COMPETITIVE ADVANTAGES
✅ Simultaneous monitoring of 30 major assets ✅ Clear visual interface with intuitive core system ✅ Customizable alerts for different details ✅ Optimized code for maximum performance ✅ Flexible configuration adaptable to different strategies ✅ Real-time update without the need for manual refresh
Developed for traders who value efficiency and accuracy in identifying market opportunities based on the EMA 20
Cerca negli script per "entry"

System 0530 - Stoch RSI Strategy with ATR filterStrategy Description: System 0530 - Multi-Timeframe Stochastic RSI with ATR Filter
Overview:
This strategy, "System 0530," is designed to identify trading opportunities by leveraging the Stochastic RSI indicator across two different timeframes: a shorter timeframe for initial signal triggers (assumed to be the chart's current timeframe, e.g., 5-minute) and a longer timeframe (15-minute) for signal confirmation. It incorporates an ATR (Average True Range) filter to help ensure trades are taken during periods of adequate market volatility and includes a cooldown mechanism to prevent rapid, successive signals in the same direction. Trade exits are primarily handled by reversing signals.
How It Works:
1. Signal Initiation (e.g., 5-Minute Timeframe):
Long Signal Wait: A potential long entry is considered when the 5-minute Stochastic RSI %K line crosses above its %D line, AND the %K value at the time of the cross is at or below a user-defined oversold level (default: 30).
Short Signal Wait: A potential short entry is considered when the 5-minute Stochastic RSI %K line crosses below its %D line, AND the %K value at the time of the cross is at or above a user-defined overbought level (default: 70). When these conditions are met, the strategy enters a "waiting state" for confirmation from the 15-minute timeframe.
2. Signal Confirmation (15-Minute Timeframe):
Once in a waiting state, the strategy looks for confirmation on the 15-minute Stochastic RSI within a user-defined number of 5-minute bars (wait_window_5min_bars, default: 5 bars).
Long Confirmation:
The 15-minute Stochastic RSI %K must be greater than or equal to its %D line.
The 15-minute Stochastic RSI %K value must be below a user-defined threshold (stoch_15min_long_entry_level, default: 40).
Short Confirmation:
The 15-minute Stochastic RSI %K must be less than or equal to its %D line.
The 15-minute Stochastic RSI %K value must be above a user-defined threshold (stoch_15min_short_entry_level, default: 60).
3. Filters:
ATR Volatility Filter: If enabled, trades are only confirmed if the current ATR value (converted to ticks) is above a user-defined minimum threshold (min_atr_value_ticks). This helps to avoid taking signals during periods of very low market volatility. If the ATR condition is not met, the strategy continues to wait for the condition to be met within the confirmation window, provided other conditions still hold.
Signal Cooldown Filter: If enabled, after a signal is generated, the strategy will wait for a minimum number of bars (min_bars_between_signals) before allowing another signal in the same direction. This aims to reduce overtrading.
4. Entry and Exit Logic:
Entry: A strategy.entry() order is placed when all trigger, confirmation, and filter conditions are met.
Exit: This strategy primarily uses reversing signals for exits. For example, if a long position is open, a confirmed short signal will close the long position and open a new short position. There are no explicit take profit or stop loss orders programmed into this version of the script.
Key User-Adjustable Parameters:
Stochastic RSI Parameters: RSI Length, Stochastic RSI Length, %K Smoothing, %D Smoothing.
Signal Trigger & Confirmation:
5-minute %K trigger levels for long and short.
15-minute %K confirmation thresholds for long and short.
Wait window (in 5-minute bars) for 15-minute confirmation.
Filters:
Enable/disable and configure the Signal Cooldown filter (minimum bars between signals).
Enable/disable and configure the ATR Volatility filter (ATR period, minimum ATR value in ticks).
Strategy Parameters:
Leverage Multiplier (Note: This primarily affects theoretical position sizing for backtesting calculations in TradingView and does not simulate actual leveraged trading risks).
Recommendations for Users:
Thorough Backtesting: Test this strategy extensively on historical data for the instruments and timeframes you intend to trade.
Parameter Optimization: Experiment with different parameter settings to find what works best for your trading style and chosen markets. The default values are starting points and may not be optimal for all conditions.
Understand the Logic: Ensure you understand how each component (Stochastic RSI on different timeframes, ATR filter, cooldown) interacts to generate signals.
Risk Management: Since this version does not include explicit stop-loss orders, ensure you have a clear risk management plan in place if trading this strategy live. You might consider manually adding stop-loss orders through your broker or using TradingView's separate strategy order settings for stop-loss if applicable.
Disclaimer:
This strategy description is for informational purposes only and does not constitute financial advice. Past performance is not indicative of future results. Trading involves significant risk of loss. Always do your own research and understand the risks before trading.

atr stop loss for double SMA v6Strategy Name
atr stop loss for double SMA v6
Credit: This v6 update is based on Daveatt’s “BEST ATR Stop Multiple Strategy.”
Core Logic
Entry: Go long when the 15-period SMA crosses above the 45-period SMA; go short on the inverse cross.
Stop-Loss: On entry, compute ATR(14)×2.0 and set a fixed stop at entry ± that amount. Stop remains static until hit.
Trend Tracking: Uses barssince() to ensure only one active long or short position; stop is only active while that trend persists.
Visualization
Plots fast/slow SMA lines in teal/orange.
On each entry bar, displays a label showing “ATR value” and “ATR×multiple” positioned at the 30-bar low (long) or high (short).
Draws an “×” at the stop-price level in green (long) or red (short) while the position is open.
Execution Settings
Initial Capital: $100 000, Size = 100 shares per trade.
Commission: 0.075% per trade.
Pyramiding: 1.
Calculations: Only on bar close (no intra-bar ticks).
Usage Notes
Static ATR stop adapts to volatility but does not trail.
Ideal for trending, liquid markets (stocks, futures, FX).
Adjust SMA lengths or ATR multiple for faster/slower signals.

Arnaud Legoux Trend Aggregator | Lyro RSArnaud Legoux Trend Aggregator
Introduction
Arnaud Legoux Trend Aggregator is a custom-built trend analysis tool that blends classic market oscillators with advanced normalization, advanced math functions and Arnaud Legoux smoothing. Unlike conventional indicators, 𝓐𝓛𝓣𝓐 aggregates market momentum, volatility and trend strength.
Signal Insight
The 𝓐𝓛𝓣𝓐 line visually reflects the aggregated directional bias. A rise above the middle line threshold signals bullish strength, while a drop below the middle line indicates bearish momentum.
Another way to interpret the 𝓐𝓛𝓣𝓐 is through overbought and oversold conditions. When the 𝓐𝓛𝓣𝓐 rises above the +0.7 threshold, it suggests an overbought market and signals a strong uptrend. Conversely, a drop below the -0.7 level indicates an oversold condition and a strong downtrend.
When the oscillator hovers near the zero line, especially within the neutral ±0.3 band, it suggests that no single directional force is dominating—common during consolidation phases or pre-breakout compression.
Real-World Example
Usually 𝓐𝓛𝓣𝓐 is used by following the bar color for simple signals; however, like most indicators there are unique ways to use an indicator. Let’s dive deep into such ways.
The market begins with a green bar color, raising awareness for a potential long setup—but not a direct entry. In this methodology, bar coloring serves as an alert mechanism rather than a strict entry trigger.
The first long position was initiated when the 𝓐𝓛𝓣𝓐 signal line crossed above the +0.3 threshold, suggesting a shift in directional acceleration. This entry coincided with a rising price movement, validating the trade.
As price advanced, the position was exited into cash—not reversed into a short—because the short criteria for this use case are distinct. The exit was prompted by 𝓐𝓛𝓣𝓐 crossing back below the +0.3 level, signaling the potential weakening of the long trend.
Later, as 𝓐𝓛𝓣𝓐 crossed below 0, attention shifted toward short opportunities. A short entry was confirmed when 𝓐𝓛𝓣𝓐 dipped below -0.3, indicating growing downside momentum. The position was eventually closed when 𝓐𝓛𝓣𝓐 crossed back above the -0.3 boundary—signaling a possible deceleration of the bearish move.
This logic was consistently applied in subsequent setups, emphasizing the role of 𝓐𝓛𝓣𝓐’s thresholds in guiding both entries and exits.
Framework
The Arnaud Legoux Trend Aggregator (ALTA) combines multiple technical indicators into a single smoothed signal. It uses RSI, MACD, Bollinger Bands, Stochastic Momentum Index, and ATR.
Each indicator's output is normalized to a common scale to eliminate bias and ensure consistency. These normalized values are then transformed using a hyperbolic tangent function (Tanh).
The final score is refined with a custom Arnaud Legoux Moving Average (ALMA) function, which offers responsive smoothing that adapts quickly to price changes. This results in a clear signal that reacts efficiently to shifting market conditions.
⚠️ WARNING ⚠️: THIS INDICATOR, OR ANY OTHER WE (LYRO RS) PUBLISH, IS NOT FINANCIAL OR INVESTMENT ADVICE. EVERY INDICATOR SHOULD BE COMBINED WITH PRICE ACTION, FUNDAMENTALS, OTHER TECHNICAL ANALYSIS TOOLS & PROPER RISK. MANAGEMENT.

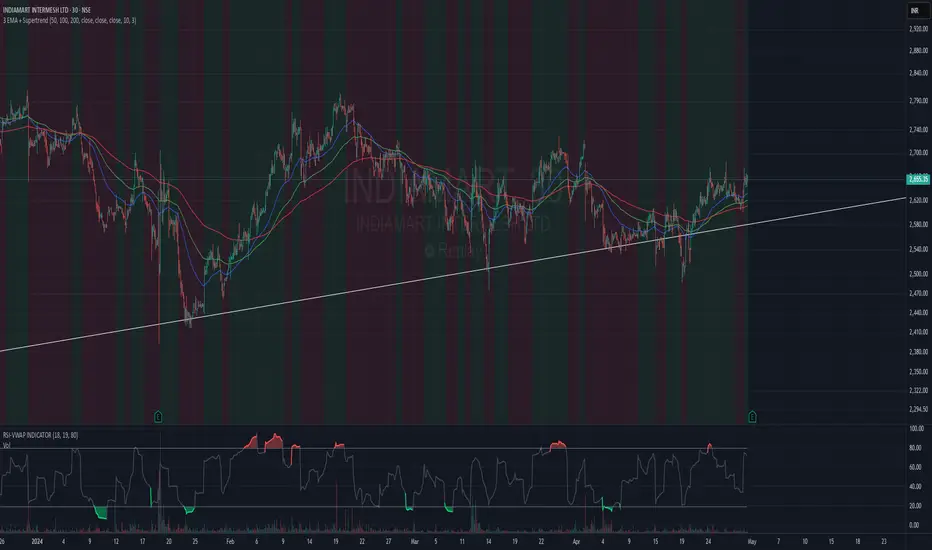
3 EMA + SupertrendThree EMAs: Helps you identify the general trend direction and potential crossovers.
When the Fast EMA crosses above the Medium or Slow EMAs, it may indicate a bullish trend, and vice versa for bearish trends.
Supertrend: Works as a trend filter. You can use it to identify overall market conditions:
When the Supertrend is green, it indicates an uptrend.
When the Supertrend is red, it indicates a downtrend.
Combination: The EMAs help you confirm the trend, and the Supertrend can act as a filter or confirmation tool for your entries and exits.
Potential Strategy Idea:
Long Entry: When the Fast EMA crosses above the Medium EMA, and the Supertrend is green.
Short Entry: When the Fast EMA crosses below the Medium EMA, and the Supertrend is red.
Exit: You can use either the Supertrend turning from green to red (for long exits) or vice versa.
Opening Range BreakoutOPENING RANGE BREAKOUT (ORB) INDICATOR
DESCRIPTION
The Opening Range Breakout indicator is a powerful technical analysis tool designed specifically for US equity markets. It identifies and visualizes the opening range established during the first configurable minutes of each trading day (starting at 9:30 AM EST), then provides clear signals when price breaks out of or rejects from these key levels.
This indicator combines multiple timeframe analysis capabilities with precise breakout detection to help traders identify high-probability trading opportunities based on opening range dynamics.
KEY FEATURES
Configurable Opening Range:
• Set opening range duration from 5 minutes to 4 hours
• Automatically adjusts calculations based on your chart timeframe
• Works on any timeframe (1m, 5m, 15m, 1h, etc.)
Multi-Day Range Display:
• Shows up to 50 days of historical opening ranges
• Each day's range properly contained within its trading session
• Range lines extend from market open (9:30 AM) to market close (4:00 PM EST)
Clear Signal System:
• Green arrows (⬆): Bullish breakouts and rejections
• Red arrows (⬇): Bearish breakouts and rejections
• Two signal types: Close breakouts (normal size) and wick rejections (small size)
Visual Range Highlighting:
• Opening range period highlighted with colored box
• Customizable colors for range fill, borders, and midline
• Clean, professional appearance with configurable line styles
SIGNAL TYPES
Bullish Signals (Green ⬆):
1. Close Breakout Above Range (Normal Size): 5-minute candle closes above the opening range high
2. Wick Rejection from Below (Small Size): Price wicks below the opening range low but closes back inside the range
Bearish Signals (Red ⬇):
1. Close Breakout Below Range (Normal Size): 5-minute candle closes below the opening range low
2. Wick Rejection from Above (Small Size): Price wicks above the opening range high but closes back inside the range
CONFIGURATION OPTIONS
Range Settings:
• Opening Range Minutes: Duration of opening range (default: 30 minutes)
• Lookback Days: Number of historical days to display (default: 20 days)
Visual Customization:
• Range Color: Fill color for the opening range area
• Border Color: Color for range high/low lines
• Midline Color: Color for the range midpoint line
• Opening Range Highlight Color: Color for the opening period box
• Line Style: Solid, Dashed, or Dotted lines
• Line Width: 1-4 pixel width options
Display Options:
• Show Midline: Toggle midpoint line display
• Show Range Labels: Toggle price level labels
• Arrow Distance: Adjust arrow positioning (0.1-2.0%)
USAGE GUIDE
Basic Setup:
1. Add the indicator to your chart (works best on 5-minute timeframe)
2. Configure your preferred opening range duration (15m, 30m, or 60m are popular choices)
3. Adjust lookback days based on your analysis needs
4. Customize colors and line styles to match your chart theme
Trading Applications:
Breakout Trading:
• Long Entry: Green arrow (close breakout above range) + confirmation
• Short Entry: Red arrow (close breakout below range) + confirmation
• Stop Loss: Opposite side of the opening range
• Target: 1-2x the range size or key support/resistance levels
Range Rejection Trading:
• Reversal Setups: Small arrows indicate failed breakouts
• Mean Reversion: Trade back toward range midline
• Support/Resistance: Use range levels as key price zones
Multi-Day Analysis:
• Identify recurring support/resistance levels
• Analyze range expansion/contraction patterns
• Compare current day's activity to recent history
BEST PRACTICES
1. Timeframe Selection: 5-minute charts provide optimal signal clarity
2. Range Duration: 30-minute opening range is most commonly used, but adjust based on:
- Market volatility
- Stock characteristics
- Trading style preference
3. Confirmation: Use additional indicators or price action for trade confirmation
4. Risk Management: Always use appropriate position sizing and stop losses
MARKET SESSIONS
The indicator is specifically designed for US equity markets:
• Market Open: 9:30 AM EST
• Market Close: 4:00 PM EST
• Opening Range: Calculated from market open
• Range Lines: Extend throughout the trading day only
PERFORMANCE NOTES
• Optimized for real-time trading with minimal lag
• Automatically manages memory by cleaning old ranges
• Efficiently handles multiple timeframes and range calculations
KNOWN ISSUES & WORKAROUNDS
Historical Buffer Error:
Issue: Occasionally, you may encounter an error: "The requested historical offset (XXX) is beyond the historical buffer's limit (770)"
Workaround:
1. Switch to a different timeframe temporarily
2. Switch back to your original timeframe
3. The indicator will reload and function normally
This is a Pine Script limitation related to historical data access and doesn't affect the indicator's core functionality.
COMPATIBILITY
• Pine Script Version: v6
• Chart Types: All chart types supported
• Timeframes: All timeframes (optimized for 1m-1h)
• Markets: Designed for US equity markets during regular trading hours
TIPS FOR MAXIMUM EFFECTIVENESS
1. Combine with Volume: High volume on breakouts increases reliability
2. Market Context: Consider overall market direction and volatility
3. News Awareness: Be cautious around earnings and major announcements
4. Range Quality: Wider ranges often provide better breakout opportunities
5. Time of Day: Early breakouts (first 1-2 hours) often have higher follow-through
This indicator is provided for educational and informational purposes. Always conduct your own analysis and manage risk appropriately.

REVELATIONS (VoVix - PoC) REVELATIONS (VoVix - POC): True Regime Detection Before the Move
Let’s not sugarcoat it: Most strategies on TradingView are recycled—RSI, MACD, OBV, CCI, Stochastics. They all lag. No matter how many overlays you stack, every one of these “standard” indicators fires after the move is underway. The retail crowd almost always gets in late. That’s never been enough for my team, for DAFE, or for anyone who’s traded enough to know the real edge vanishes by the time the masses react.
How is this different?
REVELATIONS (VoVix - POC) was engineered from raw principle, structured to detect pre-move regime change—before standard technicals even light up. We built, tested, and refined VoVix to answer one hard question:
What if you could see the spike before the trend?
Here’s what sets this system apart, line-by-line:
o True volatility-of-volatility mathematics: It’s not just "ATR of ATR" or noise smoothing. VoVix uses normalized, multi-timeframe v-vol spikes, instantly detecting orderbook stress and "outlier" market events—before the chart shows them as trends.
o Purist regime clustering: Every trade is enabled only during coordinated, multi-filter regime stress. No more signals in meaningless chop.
o Nonlinear entry logic: No trade is ever sent just for a “good enough” condition. Every entry fires only if every requirement is aligned—local extremes, super-spike threshold, regime index, higher timeframe, all must trigger in sync.
o Adaptive position size: Your contracts scale up with event strength. Tiny size during nominal moves, max leverage during true regime breaks—never guesswork, never static exposure.
o All exits governed by regime decay logic: Trades are closed not just on price targets but at the precise moment the market regime exhausts—the hardest part of systemic trading, now solved.
How this destroys the lag:
Standard indicators (RSI, MACD, OBV, CCI, and even most “momentum” overlays) simply tell you what already happened. VoVix triggers as price structure transitions—anyone running these generic scripts will trade behind the move while VoVix gets in as stress emerges. Real alpha comes from anticipation, not confirmation.
The visuals only show what matters:
Top right, you get a live, live quant dashboard—regime index, current position size, real-time performance (Sharpe, Sortino, win rate, and wins). Bottom right: a VoVix "engine bar" that adapts live with regime stress. Everything you see is a direct function of logic driving this edge—no cosmetics, no fake momentum.
Inputs/Signals—explained carefully for clarity:
o ATR Fast Length & ATR Slow Length:
These are the heart of VoVix’s regime sensing. Fast ATR reacts to sharp volatility; Slow ATR is stability baseline. Lower Fast = reacts to every twitch; higher Slow = requires more persistent, “real” regime shifts.
Tip: If you want more signals or faster markets, lower ATR Fast. To eliminate noise, raise ATR Slow.
o ATR StdDev Window: Smoothing for volatility-of-volatility normalization. Lower = more jumpy, higher = only the cleanest spikes trigger.
Tip: Shorten for “jumpy” assets, raise for indices/futures.
o Base Spike Threshold: Think of this as your “minimum event strength.” If the current move isn’t volatile enough (normalized), no signal.
Tip: Higher = only biggest moves matter. Lower for more signals but more potential noise.
o Super Spike Multiplier: The “are you sure?” test—entry only when the current spike is this multiple above local average.
Tip: Raise for ultra-selective/swing-trading; lower for more active style.
Regime & MultiTF:
o Regime Window (Bars):
How many bars to scan for regime cluster “events.” Short for turbo markets, long for big swings/trends only.
o Regime Event Count: Only trade when this many spikes occur within the Regime Window—filters for real stress, not isolated ticks.
Tip: Raise to only ever trade during true breakouts/crashes.
o Local Window for Extremes:
How many bars to check that a spike is a local max.
Tip: Raise to demand only true, “clearest” local regime events; lower for early triggers.
o HTF Confirm:
Higher timeframe regime confirmation (like 45m on an intraday chart). Ensures any event you act on is visible in the broader context.
Tip: Use higher timeframes for only major moves; lower for scalping or fast regimes.
Adaptive Sizing:
o Max Contracts (Adaptive): The largest size your system will ever scale to, even on extreme event.
Tip: Lower for small accounts/conservative risk; raise on big accounts or when you're willing to go big only on outlier events.
o Min Contracts (Adaptive): The “toe-in-the-water.” Smallest possible trade.
Tip: Set as low as your broker/exchange allows for safety, or higher if you want to always have meaningful skin in the game.
Trade Management:
o Stop %: Tightness of your stop-loss relative to entry. Lower for tighter/safer, higher for more breathing room at cost of greater drawdown.
o Take Profit %: How much you'll hold out for on a win. Lower = more scalps. Higher = only run with the best.
o Decay Exit Sensitivity Buffer: Regime index must dip this far below the trading threshold before you exit for “regime decay.”
Tip: 0 = exit as soon as stress fails, higher = exits only on stronger confirmation regime is over.
o Bars Decay Must Persist to Exit: How long must decay be present before system closes—set higher to avoid quick fades and whipsaws.
Backtest Settings
Initial capital: $10,000
Commission: Conservative, realistic roundtrip cost:
15–20 per contract (including slippage per side) I set this to $25
Slippage: 3 ticks per trade
Symbol: CME_MINI:NQ1!
Timeframe: 1 min (but works on all timeframes)
Order size: Adaptive, 1–3 contracts
No pyramiding, no hidden DCA
Why these settings?
These settings are intentionally strict and realistic, reflecting the true costs and risks of live trading. The 10,000 account size is accessible for most retail traders. 25/contract including 3 ticks of slippage are on the high side for NQ, ensuring the strategy is not curve-fit to perfect fills. If it works here, it will work in real conditions.
Tip: Set to 1 for instant regime exit; raise for extra confirmation (less whipsaw risk, exits held longer).
________________________________________
Bottom line: Tune the sensitivity, selectivity, and risk of REVELATIONS by these inputs. Raise thresholds and windows for only the best, most powerful signals (institutional style); lower for activity (scalpers, fast cryptos, signals in constant motion). Sizing is always adaptive—never static or martingale. Exits are always based on both price and regime health. Every input is there for your control, not to sell “complexity.” Use with discipline, and make it your own.
This strategy is not just a technical achievement: It’s a statement about trading smarter, not just more.
* I went back through the code to make sure no the strategy would not suffer from repainting, forward looking, or any frowned upon loopholes.
Disclaimer:
Trading is risky and carries the risk of substantial loss. Do not use funds you aren’t prepared to lose. This is for research and informational purposes only, not financial advice. Backtest, paper trade, and know your risk before going live. Past performance is not a guarantee of future results.
Expect more: We’ll keep pushing the standard, keep evolving the bar until “quant” actually means something in the public code space.
Use with clarity, use with discipline, and always trade your edge.
— Dskyz , for DAFE Trading Systems

TCP | Money Management indicator | Crypto Version📌 TCP | Money Management Indicator | Crypto Version
A robust, multi-target risk and capital management indicator tailored for crypto traders. Whether you're trading spot, perpetual futures, or leverage tokens, this tool empowers you with precise control over risk, reward, and position sizing—directly on your chart. Eliminate guesswork and trade with confidence.
🔰 Introduction: Master Your Capital, Master Your Trades
Poor money management is the number one reason traders lose their accounts, even with solid strategies. The TCP Money Management Indicator, built by Trade City Pro (TCP), solves this problem by providing a structured, rule-based approach to capital allocation.
Want to dive deeper into the concept of money management? Check out our comprehensive tutorial on TradingView, " TradeCityPro Academy: Money Management ", to understand the principles that power this indicator and transform your trading mindset.
This indicator equips you to:
• Calculate optimal position sizes based on your capital, risk percentage, and leverage
• Set up to 5 customizable take-profit targets with partial close percentages
• Access real-time metrics like Risk-to-Reward (R/R), USD profit, and margin usage
• Trade with discipline, avoiding emotional or inconsistent decisions
💸 Money Management Formula
The indicator uses a professional capital allocation model:
Position Size = (Capital × Risk %) ÷ (Stop Loss % × Leverage)
From this, it calculates:
• Total risk amount in USD
• Optimal position size for your trade
• Margin required for each take-profit target
• Adjusted R/R for each target, accounting for partial position closures
🛠 How to Use
Enter Trade Parameters: Input your capital, risk %, leverage, entry price, and stop-loss price.
Set Take-Profit Targets: Enable 1 to 5 take-profit levels and specify the percentage of the position to close at each.
Real-Time Calculations: The indicator automatically computes:
• R/R ratio for each target
• Profit in USD for each partial close
• Margin used per target (in % and USD)
Visualize Your Trade:
• Price levels for entry, stop-loss, and take-profits are plotted on the chart.
• A dynamic info panel on the left side displays all key metrics.
🔄 Dynamic Adjustments: As each take-profit target is hit and a portion of the position is closed, the indicator recalculates the remaining position size, expected profit, R/R, and margin for subsequent targets. This ensures accuracy and reflects real-world trade behavior.
📊 Table Overview
The left-side panel provides a clear snapshot:
• Trade Setup: Capital, entry price, stop-loss, risk amount, and position size
• Per Target: Percentage closed, R/R, profit in USD, and margin used
• Summary: Total expected profit across all targets
⚙️ Settings Panel
• Total Capital ($): Your account size for the trade
• Risk per Trade (%): The percentage of capital you’re willing to risk
• Leverage: The leverage applied to the trade
• Entry/Stop-Loss Prices: Define your trade’s risk zone
• Take-Profit Targets (1–5): Set price levels and percentage to close at each
🔍 Use Case Example
Imagine you have $1,000 capital, risking 1%, using 10x leverage:
• Entry: $100 | Stop-Loss: $95
• TP1: $110 (close 50%) | TP2: $115 (close 50%)
The indicator calculates the exact position size, profit at each target, and margin allocation in real time, with all metrics displayed on the chart.
✅ Why Traders Love It
• Precision: No more manual calculations or guesswork
• Versatility: Works on all crypto pairs (BTC, ETH, altcoins, etc.)
• Flexibility: Perfect for scalping, swing trading, or futures strategies
• Universal: Compatible with all timeframes
• Transparency: Fully manual, with clear and reliable outputs
🧩 Built by Trade City Pro (TCP)
Developed by TCP, a trusted name in trading tools, used by over 150,000 traders worldwide. This indicator is coded in Pine Script v5, ensuring compatibility with TradingView’s platform.
🧾 Final Notes
• No Auto-Trading: This is a manual tool for disciplined traders
• No Repainting: All calculations are accurate and non-repainting
• Tested: Rigorously validated across major crypto pairs
• Publish-Ready: Built for seamless use on TradingView
🔗 Resources
• Money Management Tutorial: Learn the fundamentals of capital management with our detailed guide: TradeCityPro Academy: Money Management
• TradingView Profile: Explore more tools by TCP on TradingView

Stochastic RSI with MTF TableShort Description of the Script
The provided Pine Script indicator, titled "Stochastic RSI with MTF Table," calculates and displays the Stochastic RSI for the current timeframe and multiple other timeframes (5m, 15m, 30m, 60m, 240m, and daily). The Stochastic RSI is a momentum indicator that blends the Relative Strength Index (RSI) and Stochastic Oscillator to identify overbought and oversold conditions, as well as potential trend reversals via K and D line crossovers.
Key features of the script include:
Inputs: Customizable parameters such as K smoothing (default 3), D smoothing (default 3), RSI length (default 14), Stochastic length (default 14), source price (default close), and overbought/oversold levels (default 80/20).
MTF Table: A table displays the Stochastic RSI status for each timeframe:
"OB" (overbought) if K > 80, "OS" (oversold) if K < 20, or "N" (neutral) otherwise.
Crossovers: "K↑D" for bullish (K crosses above D) and "K↓D" for bearish (K crosses below D).
Visualization: Plots the K and D lines for the current timeframe, with horizontal lines at 80 (overbought), 50 (middle), and 20 (oversold), plus a background fill for clarity.
Table Position: Configurable to appear in one of four chart corners (default: top-right).
This indicator helps traders assess momentum across multiple timeframes simultaneously, aiding in the identification of trend strength and potential entry/exit points.
Trading Strategy with 50EMA and 200EMA for Highest Winning Rate
To create a strategy with the best probability of a high winning rate using the Stochastic RSI MTF indicator alongside the 50-period Exponential Moving Average (50EMA) and 200-period Exponential Moving Average (200EMA), we can combine trend identification with momentum-based entry timing. The 50EMA and 200EMA are widely used to determine medium- and long-term trends, while the Stochastic RSI MTF table provides multi-timeframe momentum signals. Here’s the strategy:
1. Determine the Overall Trend
Bullish Trend: The 50EMA is above the 200EMA on the current timeframe (e.g., daily or 60m chart). This suggests an uptrend, often associated with a "Golden Cross."
Bearish Trend: The 50EMA is below the 200EMA on the current timeframe. This indicates a downtrend, often linked to a "Death Cross."
Implementation: Plot the 50EMA and 200EMA on your chart and visually confirm their relative positions.
2. Identify Entry Signals Using the Stochastic RSI MTF Table
In a Bullish Trend (50EMA > 200EMA):
Look for timeframes in the MTF table showing:
Oversold (OS): K < 20, indicating a potential pullback in the uptrend where price may rebound.
Bullish Crossover (K↑D): K crosses above D, signaling rising momentum and a potential entry point.
Example: If the 60m and 240m timeframes show "OS" or "K↑D," this could be a buy signal.
In a Bearish Trend (50EMA < 200EMA):
Look for timeframes in the MTF table showing:
Overbought (OB): K > 80, suggesting a rally in the downtrend where price may reverse downward.
Bearish Crossover (K↓D): K crosses below D, indicating declining momentum and a potential short entry.
Example: If the 30m and daily timeframes show "OB" or "K↓D," this could be a sell/short signal.
Current Timeframe Check: Use the plotted K and D lines on your trading timeframe for precise entry timing (e.g., confirm a K↑D crossover on a 60m chart for a long trade).
3. Confirm Signals Across Multiple Timeframes
Strengthen the Signal: A higher winning rate is more likely when multiple timeframes align with the trend and signal. For instance:
Bullish trend + "OS" or "K↑D" on 60m, 240m, and daily = strong buy signal.
Bearish trend + "OB" or "K↓D" on 15m, 60m, and 240m = strong sell signal.
Prioritize Higher Timeframes: Signals from the 240m or daily timeframe carry more weight due to their indication of broader trends, increasing reliability.
4. Set Stop-Loss and Take-Profit Levels
Long Trades (Bullish):
Stop-Loss: Place below the most recent swing low or below the 50EMA, whichever is closer, to protect against trend reversals.
Take-Profit: Target a key resistance level or use a risk-reward ratio (e.g., 2:1 or 3:1) based on the stop-loss distance.
Short Trades (Bearish):
Stop-Loss: Place above the most recent swing high or above the 50EMA, whichever is closer.
Take-Profit: Target a key support level or apply a similar risk-reward ratio.
Trailing Stop Option: As the trend progresses, trail the stop below the 50EMA (for longs) or above it (for shorts) to lock in profits.
5. Risk Management
Position Sizing: Risk no more than 1-2% of your trading capital per trade to minimize losses from false signals.
Volatility Consideration: Adjust stop-loss distances and position sizes based on the asset’s volatility (e.g., wider stops for volatile stocks or crypto).
Avoid Overtrading: Wait for clear alignment between the EMA trend and MTF signals to avoid low-probability setups.
Example Scenario
Chart: 60-minute timeframe.
Trend: 50EMA > 200EMA (bullish).
MTF Table: 60m shows "OS," 240m shows "K↑D," and daily is "N."
Action: Enter a long position when the 60m K line crosses above D, confirming the table signal.
Stop-Loss: Below the recent 60m swing low (e.g., 2% below entry).
Take-Profit: At the next resistance level or a 3:1 reward-to-risk ratio.
Outcome: High probability of success due to trend alignment and multi-timeframe confirmation.
Why This Strategy Works
Trend Following: Trading in the direction of the 50EMA/200EMA trend reduces the risk of fighting the market’s momentum.
Momentum Timing: The Stochastic RSI MTF table pinpoints pullbacks or reversals within the trend, improving entry timing.
Multi-Timeframe Confirmation: Alignment across timeframes filters out noise, increasing the win rate.
Risk Control: Defined stop-loss and position sizing protect against inevitable losses.
Caveats
No strategy guarantees a 100% win rate; false signals can occur, especially in choppy markets.
Test this strategy on historical data or a demo account to verify its effectiveness for your asset and timeframe.
This approach leverages the strengths of both trend-following (EMA) and momentum (Stochastic RSI) tools, aiming for a high-probability, disciplined trading system.

Triangle Breakout Strategy with TP/SL, EMA Filter📌 Triangle Breakout Strategy with TP/SL, EMA Filters, and Backtest – Explained.
✅ 1. Pattern Detection – Triangle Breakout
The script scans for triangle patterns by detecting local pivot highs and pivot lows.
It uses two recent highs and two recent lows to draw converging trendlines (upper and lower boundaries of the triangle).
If the price breaks above the upper trendline, a bullish breakout signal is generated.
🎯 2. TP (Take Profit) & SL (Stop Loss)
When a bullish breakout is detected:
A buy order is placed using strategy.entry.
TP and SL levels are calculated relative to the current close price:
TP = 3% above the entry price
SL = 1.5% below the entry price
These are defined using strategy.exit.
📊 3. EMA Filter
An optional filter checks if:
Price is above both EMA 20 and EMA 50
Only if this condition is met, the strategy allows a long entry.
You can toggle the filter on or off with useEMAFilter.
📈 4. Backtesting with Strategy Tester
This script uses strategy() instead of indicator() to enable TradingView’s built-in backtest engine.
Every buy entry and exit (based on TP or SL) is recorded.
📌 5. Visuals
EMA 20 and EMA 50 lines are plotted on the chart.
A label is shown when a breakout is detected: "Breakout Up"
Results (profit, win rate, drawdown, etc.) can be viewed in the Strategy Tester panel.

DDDDD: SMI Quad Sync📄DDDDD: SMI Quad Sync
A multi-timeframe momentum synchronization indicator using 4 Stochastic Oscillators with different lengths (9, 14, 40, 60) to detect collective oversold and overbought zones.
✅ Key Features:
Plots 4 stochastic lines with vertical offsets for better visual separation.
Generates a Long Signal (green square) when all 4 stochastics are below the oversold level.
Generates a Short Signal (red square) when all 4 stochastics are above the overbought level.
Use signals to confirm multi-timeframe momentum alignment or exhaustion.
🎯 How to Use:
Look for green square → potential LONG entry: signals multi-timeframe oversold condition.
Look for red square → potential SHORT entry: signals multi-timeframe overbought condition.
Combine with trend analysis, price action, or other confirmation for optimal entries.
📝 Notes:
The plotted stochastic lines are visually shifted (offset) for clarity; signals are computed from raw, unshifted values.
Designed for traders who prefer confluence across different stochastic lookback periods to improve confidence.
👉 Ideal for scalping, swing trading, or as a momentum filter in broader strategies.
ICT Macro Zone Boxes w/ Individual H/L Tracking v3.1ICT Macro Zones (Grey Box Version
This indicator dynamically highlights key intraday time-based macro sessions using a clean, minimalistic grey box overlay, helping traders align with institutional trading cycles. Inspired by ICT (Inner Circle Trader) concepts, it tracks real-time highs and lows for each session and optionally extends the zone box after the session ends — making it a precision tool for intraday setups, order flow analysis, and macro-level liquidity sweeps.
### 🔍 **What It Does**
- Plots **six predefined macro sessions** used in Smart Money Concepts:
- AM Macro (09:50–10:10)
- London Close (10:50–11:10)
- Lunch Macro (11:30–13:30)
- PM Macro (14:50–15:10)
- London SB (03:00–04:00)
- PM SB (15:00–16:00)
- Each zone:
- **Tracks high and low dynamically** throughout the session.
- **Draws a consistent grey shaded box** to visualize price boundaries.
- **Displays a label** at the first bar of the session (optional).
- **Optionally extends** the box to the right after the session closes.
### 🧠 **How It Works**
- Uses Pine Script arrays to define each session’s time window, label, and color.
- Detects session entry using `time()` within a New York timezone context.
- High/Low values are updated per bar inside the session window.
- Once a session ends, the box is optionally closed and fixed in place.
- All visual zones use a standardized grey tone for clarity and consistency across charts.
### 🛠️ **Settings**
- **Shade Zone High→Low:** Enable/disable the grey macro box.
- **Extend Box After Session:** Keep the zone visible after it ends.
- **Show Entry Label:** Display a label at the start of each session.
### 🎯 **Why This Script is Unique**
Unlike basic session markers or colored backgrounds, this tool:
- Focuses on **macro moments of liquidity and reversal**, not just open/close times.
- Uses **per-session logic** to individually track price behavior inside key time windows.
- Supports **real-time high/low tracking and clean zone drawing**, ideal for Smart Money and ICT-style strategies.
Perfect — based on your list, here's a **bundle-style description** that not only explains the function of each script but also shows how they **work together** in a Smart Money/ICT workflow. This kind of cross-script explanation is exactly what TradingView wants to see to justify closed-source mashups or interdependent tools.
---
📚 ICT SMC Toolkit — Script Integration Guide
This set of advanced Smart Money Concept (SMC) tools is designed for traders who follow ICT-based methodologies, combining liquidity theory, time-based precision, and engineered confluences for high-probability trades. Each indicator is optimized to work both independently and synergistically, forming a comprehensive trading framework.
---
First FVG Custom Time Range
**Purpose:**
Plots the **first Fair Value Gap (FVG)** that appears within a defined session (e.g., NY Kill Zone, Custom range). Includes optional retest alerts.
**Best Used With:**
- Use with **ICT Macro Zones (Grey Box Version)** to isolate FVGs during high-probability times like AM Macro or PM SB.
- Combine with **Liquidity Levels** to assess whether FVGs form near swing points or liquidity voids.
---
ICT SMC Liquidity Grabs and OB s
**Purpose:**
Detects **liquidity grabs** (stop hunts above/below swing highs/lows) and **bullish/bearish order blocks**. Includes optional Fibonacci OTE levels for sniper entries.
**Best Used With:**
- Use with **ICT Turtle Soup (Reversal)** for confirmation after a liquidity grab.
- Combine with **Macro Zones** to catch order blocks forming inside timed macro windows.
- Match with **Smart Swing Levels** to confirm structure breaks before entry.
ICT SMC Liquidity Levels (Smart Swing Lows)
**Purpose:**
Automatically marks swing highs/lows based on user-defined lookbacks. Tracks whether those levels have been breached or respected.
**Best Used With:**
- Combine with **Turtle Soup** to detect if a swing level was swept, then reversed.
- Use with **Liquidity Grabs** to confirm a grab occurred at a meaningful structural point.
- Align with **Macro Zones** to understand when liquidity events occur within macro session timing.
ICT Turtle Soup (Liquidity Reversal)
**Purpose:**
Implements the classic ICT Turtle Soup model. Looks for swing failure and quick reversals after a liquidity sweep — ideal for catching traps.
Best Used With:
- Confirm with **Liquidity Grabs + OBs** to identify institutional activity at the reversal point.
- Use **Liquidity Levels** to ensure the reversal is happening at valid previous swing highs/lows.
- Amplify probability when pattern appears during **Macro Zones** or near the **First FVG**.
ICT Turtle Soup Ultimate V2
**Purpose:**
An enhanced, multi-layer version of the Turtle Soup setup that includes built-in liquidity checks, OTE levels, structure validation, and customizable visual output.
**Best Used With:**
- Use as an **entry signal generator** when other indicators (e.g., OBs, liquidity grabs) are aligned.
- Pair with **Macro Zones** for high-precision timing.
- Combine with **First FVG** to anticipate price rebalancing before explosive moves.
---
## 🧠 Workflow Example:
1. **Start with Macro Zones** to focus only on institutional trading windows.
2. Look for **Liquidity Grabs or Swing Sweeps** around key highs/lows.
3. Check for a **Turtle Soup Reversal** or **Order Block Reaction** near that level.
4. Confirm confluence with a **Fair Value Gap**.
5. Execute using the **OTE level** from the Liquidity Grabs + OB script.
---
Let me know which script you want to publish first — I’ll tailor its **individual TradingView description** and flag its ideal **“Best Used With” partners** to help users see the value in your ecosystem.

Dskyz (DAFE) Adaptive Regime - Quant Machine ProDskyz (DAFE) Adaptive Regime - Quant Machine Pro:
Buckle up for the Dskyz (DAFE) Adaptive Regime - Quant Machine Pro, is a strategy that’s your ultimate edge for conquering futures markets like ES, MES, NQ, and MNQ. This isn’t just another script—it’s a quant-grade powerhouse, crafted with precision to adapt to market regimes, deliver multi-factor signals, and protect your capital with futures-tuned risk management. With its shimmering DAFE visuals, dual dashboards, and glowing watermark, it turns your charts into a cyberpunk command center, making trading as thrilling as it is profitable.
Unlike generic scripts clogging up the space, the Adaptive Regime is a DAFE original, built from the ground up to tackle the chaos of futures trading. It identifies market regimes (Trending, Range, Volatile, Quiet) using ADX, Bollinger Bands, and HTF indicators, then fires trades based on a weighted scoring system that blends candlestick patterns, RSI, MACD, and more. Add in dynamic stops, trailing exits, and a 5% drawdown circuit breaker, and you’ve got a system that’s as safe as it is aggressive. Whether you’re a newbie or a prop desk pro, this strat’s your ticket to outsmarting the markets. Let’s break down every detail and see why it’s a must-have.
Why Traders Need This Strategy
Futures markets are a gauntlet—fast moves, volatility spikes (like the April 28, 2025 NQ 1k-point drop), and institutional traps that punish the unprepared. Meanwhile, platforms are flooded with low-effort scripts that recycle old ideas with zero innovation. The Adaptive Regime stands tall, offering:
Adaptive Intelligence: Detects market regimes (Trending, Range, Volatile, Quiet) to optimize signals, unlike one-size-fits-all scripts.
Multi-Factor Precision: Combines candlestick patterns, MA trends, RSI, MACD, volume, and HTF confirmation for high-probability trades.
Futures-Optimized Risk: Calculates position sizes based on $ risk (default: $300), with ATR or fixed stops/TPs tailored for ES/MES.
Bulletproof Safety: 5% daily drawdown circuit breaker and trailing stops keep your account intact, even in chaos.
DAFE Visual Mastery: Pulsing Bollinger Band fills, dynamic SL/TP lines, and dual dashboards (metrics + position) make signals crystal-clear and charts a work of art.
Original Craftsmanship: A DAFE creation, built with community passion, not a rehashed clone of generic code.
Traders need this because it’s a complete, adaptive system that blends quant smarts, user-friendly design, and DAFE flair. It’s your edge to trade with confidence, cut through market noise, and leave the copycats in the dust.
Strategy Components
1. Market Regime Detection
The strategy’s brain is its ability to classify market conditions into five regimes, ensuring signals match the environment.
How It Works:
Trending (Regime 1): ADX > 20, fast/slow EMA spread > 0.3x ATR, HTF RSI > 50 or MACD bullish (htf_trend_bull/bear).
Range (Regime 2): ADX < 25, price range < 3% of close, no HTF trend.
Volatile (Regime 3): BB width > 1.5x avg, ATR > 1.2x avg, HTF RSI overbought/oversold.
Quiet (Regime 4): BB width < 0.8x avg, ATR < 0.9x avg.
Other (Regime 5): Default for unclear conditions.
Indicators: ADX (14), BB width (20), ATR (14, 50-bar SMA), HTF RSI (14, daily default), HTF MACD (12,26,9).
Why It’s Brilliant:
Regime detection adapts signals to market context, boosting win rates in trending or volatile conditions.
HTF RSI/MACD add a big-picture filter, rare in basic scripts.
Visualized via gradient background (green for Trending, orange for Range, red for Volatile, gray for Quiet, navy for Other).
2. Multi-Factor Signal Scoring
Entries are driven by a weighted scoring system that combines candlestick patterns, trend, momentum, and volume for robust signals.
Candlestick Patterns:
Bullish: Engulfing (0.5), hammer (0.4 in Range, 0.2 else), morning star (0.2), piercing (0.2), double bottom (0.3 in Volatile, 0.15 else). Must be near support (low ≤ 1.01x 20-bar low) with volume spike (>1.5x 20-bar avg).
Bearish: Engulfing (0.5), shooting star (0.4 in Range, 0.2 else), evening star (0.2), dark cloud (0.2), double top (0.3 in Volatile, 0.15 else). Must be near resistance (high ≥ 0.99x 20-bar high) with volume spike.
Logic: Patterns are weighted higher in specific regimes (e.g., hammer in Range, double bottom in Volatile).
Additional Factors:
Trend: Fast EMA (20) > slow EMA (50) + 0.5x ATR (trend_bull, +0.2); opposite for trend_bear.
RSI: RSI (14) < 30 (rsi_bull, +0.15); > 70 (rsi_bear, +0.15).
MACD: MACD line > signal (12,26,9, macd_bull, +0.15); opposite for macd_bear.
Volume: ATR > 1.2x 50-bar avg (vol_expansion, +0.1).
HTF Confirmation: HTF RSI < 70 and MACD bullish (htf_bull_confirm, +0.2); RSI > 30 and MACD bearish (htf_bear_confirm, +0.2).
Scoring:
bull_score = sum of bullish factors; bear_score = sum of bearish. Entry requires score ≥ 1.0.
Example: Bullish engulfing (0.5) + trend_bull (0.2) + rsi_bull (0.15) + htf_bull_confirm (0.2) = 1.05, triggers long.
Why It’s Brilliant:
Multi-factor scoring ensures signals are confirmed by multiple market dynamics, reducing false positives.
Regime-specific weights make patterns more relevant (e.g., hammers shine in Range markets).
HTF confirmation aligns with the big picture, a quant edge over simplistic scripts.
3. Futures-Tuned Risk Management
The risk system is built for futures, calculating position sizes based on $ risk and offering flexible stops/TPs.
Position Sizing:
Logic: Risk per trade (default: $300) ÷ (stop distance in points * point value) = contracts, capped at max_contracts (default: 5). Point value = tick value (e.g., $12.5 for ES) * ticks per point (4) * contract multiplier (1 for ES, 0.1 for MES).
Example: $300 risk, 8-point stop, ES ($50/point) → 0.75 contracts, rounded to 1.
Impact: Precise sizing prevents over-leverage, critical for micro contracts like MES.
Stops and Take-Profits:
Fixed: Default stop = 8 points, TP = 16 points (2:1 reward/risk).
ATR-Based: Stop = 1.5x ATR (default), TP = 3x ATR, enabled via use_atr_for_stops.
Logic: Stops set at swing low/high ± stop distance; TPs at 2x stop distance from entry.
Impact: ATR stops adapt to volatility, while fixed stops suit stable markets.
Trailing Stops:
Logic: Activates at 50% of TP distance. Trails at close ± 1.5x ATR (atr_multiplier). Longs: max(trail_stop_long, close - ATR * 1.5); shorts: min(trail_stop_short, close + ATR * 1.5).
Impact: Locks in profits during trends, a game-changer in volatile sessions.
Circuit Breaker:
Logic: Pauses trading if daily drawdown > 5% (daily_drawdown = (max_equity - equity) / max_equity).
Impact: Protects capital during black swan events (e.g., April 27, 2025 ES slippage).
Why It’s Brilliant:
Futures-specific inputs (tick value, multiplier) make it plug-and-play for ES/MES.
Trailing stops and circuit breaker add pro-level safety, rare in off-the-shelf scripts.
Flexible stops (ATR or fixed) suit different trading styles.
4. Trade Entry and Exit Logic
Entries and exits are precise, driven by bull_score/bear_score and protected by drawdown checks.
Entry Conditions:
Long: bull_score ≥ 1.0, no position (position_size <= 0), drawdown < 5% (not pause_trading). Calculates contracts, sets stop at swing low - stop points, TP at 2x stop distance.
Short: bear_score ≥ 1.0, position_size >= 0, drawdown < 5%. Stop at swing high + stop points, TP at 2x stop distance.
Logic: Tracks entry_regime for PNL arrays. Closes opposite positions before entering.
Exit Conditions:
Stop-Loss/Take-Profit: Hits stop or TP (strategy.exit).
Trailing Stop: Activates at 50% TP, trails by ATR * 1.5.
Emergency Exit: Closes if price breaches stop (close < long_stop_price or close > short_stop_price).
Reset: Clears stop/TP prices when flat (position_size = 0).
Why It’s Brilliant:
Score-based entries ensure multi-factor confirmation, filtering out weak signals.
Trailing stops maximize profits in trends, unlike static exits in basic scripts.
Emergency exits add an extra safety layer, critical for futures volatility.
5. DAFE Visuals
The visuals are pure DAFE magic, blending function with cyberpunk flair to make signals intuitive and charts stunning.
Shimmering Bollinger Band Fill:
Display: BB basis (20, white), upper/lower (green/red, 45% transparent). Fill pulses (30–50 alpha) by regime, with glow (60–95 alpha) near bands (close ≥ 0.995x upper or ≤ 1.005x lower).
Purpose: Highlights volatility and key levels with a futuristic glow.
Visuals make complex regimes and signals instantly clear, even for newbies.
Pulsing effects and regime-specific colors add a DAFE signature, setting it apart from generic scripts.
BB glow emphasizes tradeable levels, enhancing decision-making.
Chart Background (Regime Heatmap):
Green — Trending Market: Strong, sustained price movement in one direction. The market is in a trend phase—momentum follows through.
Orange — Range-Bound: Market is consolidating or moving sideways, with no clear up/down trend. Great for mean reversion setups.
Red — Volatile Regime: High volatility, heightened risk, and larger/faster price swings—trade with caution.
Gray — Quiet/Low Volatility: Market is calm and inactive, with small moves—often poor conditions for most strategies.
Navy — Other/Neutral: Regime is uncertain or mixed; signals may be less reliable.
Bollinger Bands Glow (Dynamic Fill):
Neon Red Glow — Warning!: Price is near or breaking above the upper band; momentum is overstretched, watch for overbought conditions or reversals.
Bright Green Glow — Opportunity!: Price is near or breaking below the lower band; market could be oversold, prime for bounce or reversal.
Trend Green Fill — Trending Regime: Fills between bands with green when the market is trending, showing clear momentum.
Gold/Yellow Fill — Range Regime: Fills with gold/aqua in range conditions, showing the market is sideways/oscillating.
Magenta/Red Fill — Volatility Spike: Fills with vivid magenta/red during highly volatile regimes.
Blue Fill — Neutral/Quiet: A soft blue glow for other or uncertain market states.
Moving Averages:
Display: Blue fast EMA (20), red slow EMA (50), 2px.
Purpose: Shows trend direction, with trend_dir requiring ATR-scaled spread.
Dynamic SL/TP Lines:
Display: Pulsing colors (red SL, green TP for Trending; yellow/orange for Range, etc.), 3px, with pulse_alpha for shimmer.
Purpose: Tracks stops/TPs in real-time, color-coded by regime.
6. Dual Dashboards
Two dashboards deliver real-time insights, making the strat a quant command center.
Bottom-Left Metrics Dashboard (2x13):
Metrics: Mode (Active/Paused), trend (Bullish/Bearish/Neutral), ATR, ATR avg, volume spike (YES/NO), RSI (value + Oversold/Overbought/Neutral), HTF RSI, HTF trend, last signal (Buy/Sell/None), regime, bull score.
Display: Black (29% transparent), purple title, color-coded (green for bullish, red for bearish).
Purpose: Consolidates market context and signal strength.
Top-Right Position Dashboard (2x7):
Metrics: Regime, position side (Long/Short/None), position PNL ($), SL, TP, daily PNL ($).
Display: Black (29% transparent), purple title, color-coded (lime for Long, red for Short).
Purpose: Tracks live trades and profitability.
Why It’s Brilliant:
Dual dashboards cover market context and trade status, a rare feature.
Color-coding and concise metrics guide beginners (e.g., green “Buy” = go).
Real-time PNL and SL/TP visibility empower disciplined trading.
7. Performance Tracking
Logic: Arrays (regime_pnl_long/short, regime_win/loss_long/short) track PNL and win/loss by regime (1–5). Updated on trade close (barstate.isconfirmed).
Purpose: Prepares for future adaptive thresholds (e.g., adjust bull_score min based on regime performance).
Why It’s Brilliant: Lays the groundwork for self-optimizing logic, a quant edge over static scripts.
Key Features
Regime-Adaptive: Optimizes signals for Trending, Range, Volatile, Quiet markets.
Futures-Optimized: Precise sizing for ES/MES with tick-based risk inputs.
Multi-Factor Signals: Candlestick patterns, RSI, MACD, and HTF confirmation for robust entries.
Dynamic Exits: ATR/fixed stops, 2:1 TPs, and trailing stops maximize profits.
Safe and Smart: 5% drawdown breaker and emergency exits protect capital.
DAFE Visuals: Shimmering BB fill, pulsing SL/TP, and dual dashboards.
Backtest-Ready: Fixed qty and tick calc for accurate historical testing.
How to Use
Add to Chart: Load on a 5min ES/MES chart in TradingView.
Configure Inputs: Set instrument (ES/MES), tick value ($12.5/$1.25), multiplier (1/0.1), risk ($300 default). Enable ATR stops for volatility.
Monitor Dashboards: Bottom-left for regime/signals, top-right for position/PNL.
Backtest: Run in strategy tester to compare regimes.
Live Trade: Connect to Tradovate or similar. Watch for slippage (e.g., April 27, 2025 ES issues).
Replay Test: Try April 28, 2025 NQ drop to see regime shifts and stops.
Disclaimer
Trading futures involves significant risk of loss and is not suitable for all investors. Past performance does not guarantee future results. Backtest results may differ from live trading due to slippage, fees, or market conditions. Use this strategy at your own risk, and consult a financial advisor before trading. Dskyz (DAFE) Trading Systems is not responsible for any losses incurred.
Backtesting:
Frame: 2023-09-20 - 2025-04-29
Slippage: 3
Fee Typical Range (per side, per contract)
CME Exchange $1.14 – $1.20
Clearing $0.10 – $0.30
NFA Regulatory $0.02
Firm/Broker Commis. $0.25 – $0.80 (retail prop)
TOTAL $1.60 – $2.30 per side
Round Turn: (enter+exit) = $3.20 – $4.60 per contract
Final Notes
The Dskyz (DAFE) Adaptive Regime - Quant Machine Pro is more than a strategy—it’s a revolution. Crafted with DAFE’s signature precision, it rises above generic scripts with adaptive regimes, quant-grade signals, and visuals that make trading a thrill. Whether you’re scalping MES or swinging ES, this system empowers you to navigate markets with confidence and style. Join the DAFE crew, light up your charts, and let’s dominate the futures game!
(This publishing will most likely be taken down do to some miscellaneous rule about properly displaying charting symbols, or whatever. Once I've identified what part of the publishing they want to pick on, I'll adjust and repost.)
Use it with discipline. Use it with clarity. Trade smarter.
**I will continue to release incredible strategies and indicators until I turn this into a brand or until someone offers me a contract.
Created by Dskyz, powered by DAFE Trading Systems. Trade smart, trade bold.

Supertrend X2 + CalcSize Calculator:
Size Calculator is a risk management tool that helps traders position themselves intelligently by calculating optimal position size, stop loss, and take profit levels based on account capital, ATR volatility, and personal risk tolerance. It takes the guesswork out of sizing so you can focus on execution.
Features:
✅ Risk-based position sizing
✅ ATR-based stop loss & take profit levels
✅ Dynamic leverage estimation
✅ Support for long and short positions
✅ Visual display of key levels and metrics via table
✅ Works across any timeframe with locked timeframe support
How It Works:
This tool computes the ideal position size as a % of account capital based on how much you're willing to risk per trade and how far your stop loss is (in ATR units). It calculates corresponding stop loss and take profit prices, and visually plots them along with a floating table of metrics. You can lock the timeframe used for ATR and price, keeping your risk logic stable even when changing chart views.
Customizable Inputs:
Account capital and risk tolerance
ATR-based stop loss & take profit multiples
Trade direction (Long or Short)
ATR period and locked timeframe
Optional detailed metrics display
Dual SuperTrend:
The Dual Supertrend indicator enhances the classic Supertrend strategy by layering two customizable Supertrend signals with independent ATR settings. This setup gives you a deeper, more nuanced read on trend strength and potential entry zones.
Features:
✅ Two Supertrend lines (each with adjustable ATR periods and multipliers)
✅ Optional Heikin Ashi candle smoothing for noise reduction
✅ Color-coded trend background for fast visual analysis
✅ Multi-timeframe trend table overlay (customizable)
✅ Built-in signal logic to identify "Long", "Short", or "N/A" zones
✅ Built-in alerts from Long and Short Entry Zones
How It Works:
The script calculates two Supertrend levels using separate ATR settings. Trend direction is derived from the relationship between price and each band. When the larger (slower) Supertrend flips and the smaller (faster) confirms, it signals a potential entry. The multi-timeframe table helps you align trades across different timeframes.
Customizable Inputs:
ATR Periods & Multipliers for both Supertrends
Timeframes for entry zone detection (up to 4)
Enable/disable Heikin Ashi candles for smoother trend detection

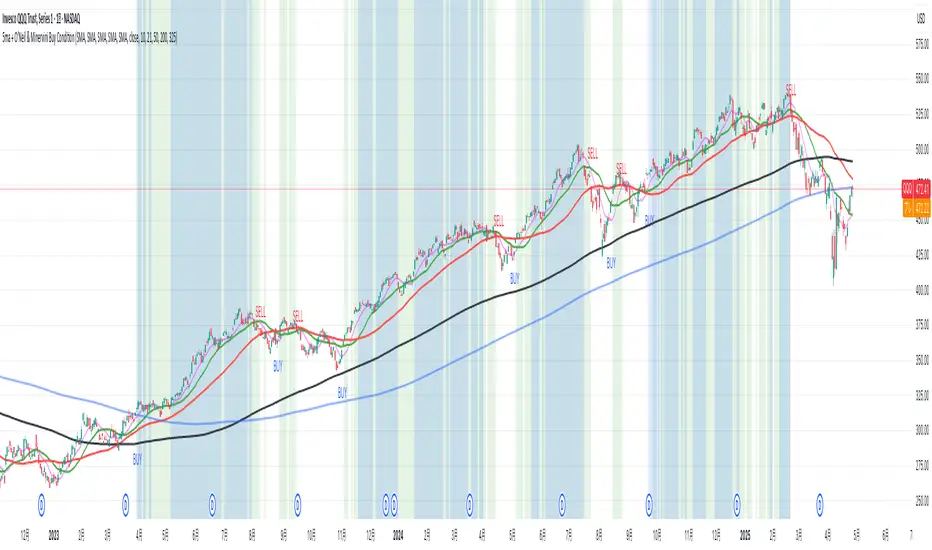
5ma + O’Neil & Minervini Buy ConditionIndicator Overview
5ma + O’Neil & Minervini Buy Condition is an original TradingView indicator that extends beyond a simple collection of standard moving averages by offering:
- Five Fully Independent Lines : Each of MA1–MA5 can be configured as SMA, EMA, WMA, or VWMA with its own period and data source. This level of customization unlocks unique combinations no existing script provides.
- Synergy of Multiple Timeframes : Default settings (10, 21, 50, 200, 325) reflect ultra‑short, short, medium, long, and volume‑weighted long‑term perspectives. The layered structure functions as a multi‑filter, sharpening entry signals and trend confirmation beyond any single MA.
- Integrated Buy Conditions : Built‑in O’Neil and Minervini buy filters use fixed SMA‑based rules (50 & 200 SMA rising within 15% of 52‑week high; 10 > 21 > 50 SMA rising within high/low thresholds), plus a combined condition highlighting when both methods align.
- Clean Visualization & Style Controls : Background coloring for each buy condition appears only in the Style tab under clearly named parameters (O’Neil Buy Condition, Minervini Buy Condition, Both Conditions). MA lines support transparent default colors and customizable line width for optimal readability without clutter.
Calculation & Logic
SMA: (P₁ + P₂ + … + Pₙ) ÷ N
EMA: α = 2 ÷ (N + 1)
EMA_today = (Price_today – EMA_yesterday) × α + EMA_yesterday
WMA: (P₁×N + P₂×(N–1) + … + Pₙ×1) ÷
VWMA: Σ(Pᵢ×Vᵢ) ÷ Σ(Vᵢ) for i = 1…N
```
Buy Condition Logic
- O’Neil: Price > 50 SMA & 200 SMA (both rising) **and** within 15% of the 52‑week high.
- Minervini : 10 SMA > 21 SMA > 50 SMA (both short‑term SMAs rising) **and** within 25% of the 52‑week high **and** at least 25% above the 52‑week low.
- Combined : Both O’Neil and Minervini conditions true.
Usage Examples
1. Short‑Mid Cross : Observe MA1/MA2 crossover while MA3/MA4 confirm trend strength.
2. Volume‑Weighted Long‑Term : Use VWMA as MA5 to filter institutional‑strength pullbacks.
3. Multi‑Filter Entry : Look for purple background (Both Conditions) on daily chart as high‑confidence entry.
Why It’s Unique
- Not a Mash‑Up : Though built on standard MA formulas, the customizable layering and built‑in buy filters create a novel multi‑dimensional analysis tool.
- Trader‑Friendly : Detailed comments in the code explain parameter choices, calculation methods, and practical entry scenarios so that even Pine novices can understand the underlying mechanics.
- Publication‑Ready : Description and code demonstrate originality, add clear value, and comply with house‑rule requirements by explaining why and how components interact, not just listing features.
- Combined Custom MA & Buy Conditions : By integrating customizable moving averages with built-in buy filters, users can easily recognize O’Neil and Minervini recommended setups.
ICT SMC Liquidity Grabs and OBsICT SMC Liquidity Grabs + OB + Fibonacci OTE Levels
Smart Money Concepts Trading Assistant
This script is built for traders who follow ICT (Inner Circle Trader) and Smart Money Concepts. It intelligently combines three critical components of SMC trading: Liquidity Grabs, Order Blocks, and Fibonacci-based Optimal Trade Entry (OTE) zones — giving traders visual cues for potential high-probability reversals and entry points.
🔍 What This Script Does:
Detects Liquidity Grabs
Identifies swing highs/lows where price sweeps liquidity, then immediately reverses.
Labels them with orange markers when price takes out previous highs/lows but closes back inside.
Draws Order Blocks
After a liquidity grab, the script looks for strong bullish or bearish candles and automatically highlights the OB zone.
These OB zones are visualized with transparent colored boxes extending several bars forward.
Plots Fibonacci OTE Levels
Uses recent swing high/low pivots to dynamically draw customizable OTE retracement levels (e.g., 62% and 75%) for both long and short setups.
Highlights Optimal Entry Zones
Marks valid OTE-based buy/sell opportunities only when:
Liquidity has been taken,
Price enters the OTE zone,
And a strong confirming candle appears.
Adds visual zones, trade labels, and optional alerts for each qualified entry.
Includes Take Profit Targets
Automatically calculates take-profit levels based on previous structure and risk-reward ratios.
TP1 is the previous swing, and TP2 is an extended R-multiple (customizable by user).
⚙️ Customization Options:
Toggle each feature (Liquidity Grabs, OBs, Fibonacci Levels)
Adjust Fibonacci levels (default: 62% and 75%)
Set lookback period for liquidity checks
Customize the R-multiple for TP2 levels
💡 How to Use:
Enable desired features from the input panel.
Watch for Buy/Sell OTE zones highlighted in green/red.
Confirm with liquidity sweep and OB support for stronger signals.
Use the automatically generated TP levels to manage risk.
🚀 What Makes It Unique:
Unlike other open-source mashups, this script synchronizes multiple SMC concepts into a single tool that:
Waits for high-confidence conditions (not just blind fib or OB detection)
Validates entries using multiple confluences
Visually marks actionable setups
Automates trade management zones
Whether you're trend-trading, scalping, or swing trading ICT-style, this tool offers a streamlined, smart-money-aligned workflow directly on your chart.

Heiken Ashi Supertrend ADXHeiken Ashi Supertrend ADX Indicator
Overview
This indicator combines the power of Heiken Ashi candles, Supertrend indicator, and ADX filter to identify strong trend movements across multiple timeframes. Designed primarily for the cryptocurrency market but adaptable to any tradable asset, this system focuses on capturing momentum in established trends while employing a sophisticated triple-layer stop loss mechanism to protect capital and secure profits.
Strategy Mechanics
Entry Signals
The strategy uses a unique blend of technical signals to identify high-probability trade entries:
Heiken Ashi Candles: Looks specifically for Heiken Ashi candles with minimal or no wicks, which signal strong momentum and trend continuation. These "full-bodied" candles represent periods where price moved decisively in one direction with minimal retracement. These are overlayed onto normal candes for more accuarte signalling and plotting
Supertrend Filter: Confirms the underlying trend direction using the Supertrend indicator (default factor: 3.0, ATR period: 10). Entries are aligned with the prevailing Supertrend direction.
ADX Filter (Optional) : Can be enabled to focus only on stronger trending conditions, filtering out choppy or ranging markets. When enabled, trades only trigger when ADX is above the specified threshold (default: 25).
Exit Signals
Positions are closed when either:
An opposing signal appears (Heiken Ashi candle with no wick in the opposite direction)
Any of the three stop loss mechanisms are triggered
Triple-Layer Stop Loss System
The strategy employs a sophisticated three-tier stop loss approach:
ATR Trailing Stop: Adapts to market volatility and locks in profits as the trend extends. This stop moves in the direction of the trade, capturing profit without exiting too early during normal price fluctuations.
Swing Point Stop: Uses natural market structure (recent highs/lows over a lookback period) to place stops at logical support/resistance levels, honoring the market's own rhythm.
Insurance Stop: A percentage-based safety net that protects against sudden adverse moves immediately after entry. This is particularly valuable when the swing point stop might be positioned too far from entry, providing immediate capital protection.
Optimization Features
Customizable Filters : All components (Supertrend, ADX) can be enabled/disabled to adapt to different market conditions
Adjustable Parameters : Fine-tune ATR periods, Supertrend factors, and ADX thresholds
Flexible Stop Loss Settings : Each of the three stop loss mechanisms can be individually enabled/disabled with customizable parameters
Best Practices for Implementation
[Recommended Timeframes : Works best on 4-hour charts and above, where trends develop more reliably
Market Conditions: Performs well across various market conditions due to the ADX filter's ability to identify meaningful trends
Performance Characteristics
When properly optimized, this has demonstrated profit factors exceeding 3 in backtesting. The approach typically produces generous winners while limiting losses through its multi-layered stop loss system. The ATR trailing stop is particularly effective at capturing extended trends, while the insurance stop provides immediate protection against adverse moves.
The visual components on the chart make it easy to follow the strategy's logic, with position status, entry prices, and current stop levels clearly displayed.
This indicator represents a complete trading system with clearly defined entry and exit rules, adaptive stop loss mechanisms, and built-in risk management through position sizing.

Heiken Ashi Supertrend ADX - StrategyHeiken Ashi Supertrend ADX Strategy
Overview
This strategy combines the power of Heiken Ashi candles, Supertrend indicator, and ADX filter to identify strong trend movements across multiple timeframes. Designed primarily for the cryptocurrency market but adaptable to any tradable asset, this system focuses on capturing momentum in established trends while employing a sophisticated triple-layer stop loss mechanism to protect capital and secure profits.
Strategy Mechanics
Entry Signals
The strategy uses a unique blend of technical signals to identify high-probability trade entries:
Heiken Ashi Candles: Looks specifically for Heiken Ashi candles with minimal or no wicks, which signal strong momentum and trend continuation. These "full-bodied" candles represent periods where price moved decisively in one direction with minimal retracement.
Supertrend Filter : Confirms the underlying trend direction using the Supertrend indicator (default factor: 3.0, ATR period: 10). Entries are aligned with the prevailing Supertrend direction.
ADX Filter (Optional) : Can be enabled to focus only on stronger trending conditions, filtering out choppy or ranging markets. When enabled, trades only trigger when ADX is above the specified threshold (default: 25).
Exit Signals
Positions are closed when either:
An opposing signal appears (Heiken Ashi candle with no wick in the opposite direction)
Any of the three stop loss mechanisms are triggered
Triple-Layer Stop Loss System
The strategy employs a sophisticated three-tier stop loss approach:
ATR Trailing Stop: Adapts to market volatility and locks in profits as the trend extends. This stop moves in the direction of the trade, capturing profit without exiting too early during normal price fluctuations.
Swing Point Stop : Uses natural market structure (recent highs/lows over a lookback period) to place stops at logical support/resistance levels, honoring the market's own rhythm.
Insurance Stop: A percentage-based safety net that protects against sudden adverse moves immediately after entry. This is particularly valuable when the swing point stop might be positioned too far from entry, providing immediate capital protection.
Optimization Features
Customizable Filters: All components (Supertrend, ADX) can be enabled/disabled to adapt to different market conditions
Adjustable Parameters: Fine-tune ATR periods, Supertrend factors, and ADX thresholds
Flexible Stop Loss Settings: Each of the three stop loss mechanisms can be individually enabled/disabled with customizable parameters
Best Practices for Implementation
Recommended Timeframes: Works best on 4-hour charts and above, where trends develop more reliably
Market Conditions: Performs well across various market conditions due to the ADX filter's ability to identify meaningful trends
Position Sizing: The strategy uses a percentage of equity approach (default: 3%) for position sizing
Performance Characteristics
When properly optimized, this strategy has demonstrated profit factors exceeding 3 in backtesting. The approach typically produces generous winners while limiting losses through its multi-layered stop loss system. The ATR trailing stop is particularly effective at capturing extended trends, while the insurance stop provides immediate protection against adverse moves.
The visual components on the chart make it easy to follow the strategy's logic, with position status, entry prices, and current stop levels clearly displayed.
This strategy represents a complete trading system with clearly defined entry and exit rules, adaptive stop loss mechanisms, and built-in risk management through position sizing.

Wick Sweep EntriesWick Sweep Entry designed by Finweal Finance (Indicator Originator : Prajyot Mahajan) :
This Indicator is specially designed for Nifty, Sensex and Banknifty Options Buying. This works well on Expiry Days.
Setup Timeframe : 5m and 1m.
Entry Criteria :
For Long/CE :
Wait for Sweep of 5m Candle Low with next 5m Candle but you do not wait for the next 5 minute candle to close, you enter directly whenever any 1 minute candle of next 5minute candle to close above the low of previous 5m Candle.
For Short/PE :
Wait for Sweep of 5m Candle High with next 5m Candle but you do not wait for the next 5 minute candle to close, you enter directly whenever any 1 minute candle of next 5minute candle to close below the High of previous 5m Candle.
Key notes :
1. As this is the Scalping High Frequency Strategy, it is to be used for scalping purpose only. You might have losses too so to avoid the noise in the market, i suggest you to use this strategy in the first 45 minutes to 1 hour of Indian Markets as this is a volatility Strategy.
2. Although Nifty and Banknifty are independent indices, they still show some reactions with each other, so if you spot a long entry on BNF and Short Entry on nifty then you will avoid taking the trade, you will take the trade only if there is a tandem activity or At least the other index is not showing opposite signal.
3. If target is not hit and you spot another entry, you will avoid taking the new entry.
The Indicator will automatically spot/plot the entry signal, all you need to do is enter as soon as 1minute candle closes either below prior 5 minute candle High for Short/PE or closes above 5minute low for Long/CE.
For Targets :
You Can Target recent minor pull back, FVG, or Order blocks.
Remember : This is a scalping strategy so don't hold trade for more than 4/5 1minute Candles

EMA 34 Crossover with Break Even Stop LossEMA 34 Crossover with Break Even Stop Loss Strategy
This trading strategy is based on the 34-period Exponential Moving Average (EMA) and aims to enter long positions when the price crosses above the EMA 34. The strategy is designed to manage risk effectively with a dynamic stop loss and take-profit mechanism.
Key Features:
EMA 34 Crossover:
The strategy generates a long entry signal when the closing price of the current bar crosses above the 34-period EMA, with the condition that the previous closing price was below the EMA. This crossover indicates a potential upward trend.
Risk Management:
Upon entering a trade, the strategy sets a stop loss at the low of the previous bar. This helps in controlling the downside risk.
A take profit level is set at a 10:1 risk-to-reward ratio, meaning the potential profit is ten times the amount risked on the trade.
Break-even Stop Loss:
As the price moves in favor of the trade and reaches a 3:1 risk-to-reward ratio, the strategy moves the stop loss to the entry price (break-even). This ensures that no loss will be incurred if the market reverses, effectively protecting profits.
Exit Conditions:
The strategy exits the trade when either the stop loss is hit (if the price drops below the stop loss level) or the take profit target is reached (if the price rises to the take profit level).
If the price reaches the break-even level (entry price), the stop loss is adjusted to lock in profits and prevent any loss.
Visualization:
The stop loss and take profit levels are plotted on the chart for easy visualization, helping traders track the status of their trade.
Trade Management Summary:
Long Entry: When price crosses above the 34-period EMA.
Stop Loss: Set to the low of the previous candle.
Take Profit: Set to a 10:1 risk-to-reward ratio.
Break-even: Stop loss is moved to entry price when a 3:1 risk-to-reward ratio is reached.
Exit: The trade is closed either when the stop loss or take profit levels are hit.
This strategy is designed to minimize losses by employing a dynamic stop loss and to maximize gains by setting a favorable risk-to-reward ratio, making it suitable for traders who prefer a structured, automated approach to risk management and trend-following.

VWAP StrategyVWAP and volatility filters for structured intraday trades.
How the Strategy Works
1. VWAP Anchored to Session
VWAP is calculated from the start of each trading day.
Standard deviations are used to create bands above/below the VWAP.
2. Entry Triggers: Al Brooks H1/H2 and L1/L2
H1/H2 (Long Entry): Opens below 2nd lower deviation, closes above it.
L1/L2 (Short Entry): Opens above 2nd upper deviation, closes below it.
3. Volatility Filter (ATR)
Skips trades when deviation bands are too tight (< 3 ATRs).
4. Stop Loss
Based on the signal bar’s high/low ± stop buffer.
Longs: signalBarLow - stopBuffer
Shorts: signalBarHigh + stopBuffer
5. Take Profit / Exit Target
Exit logic is customizable per side:
VWAP, Deviation Band, or None
6. Safety Exit
Exits early if X consecutive bars go against the trade.
Longs: X red bars
Shorts: X green bars
Explanation of Strategy Inputs
- Stop Buffer: Distance from signal bar for stop-loss.
- Long/Short Exit Rule: VWAP, Deviation Band, or None
- Long/Short Target Deviation: Standard deviation for target exit.
- Enable Safety Exit: Toggle emergency exit.
- Opposing Bars: Number of opposing candles before safety exit.
- Allow Long/Short Trades: Enable or disable entry side.
- Show VWAP/Entry Bands: Toggle visual aids.
- Highlight Low Vol Zones: Orange shading for low volatility skips.
Tuning Tips
- Stop buffer: Use 1–5 points.
- Target deviation: Start with VWAP. In strong trends use 2nd deviation and turn off the counter-trend entry.
- Safety exit: 3 bars recommended.
- Disable short/long side to focus on one type of reversal.
Backtest Setup Suggestions
- initial_capital = 2000
- default_qty_value = 1 (fixed contracts or percent-of-equity)

RSI Pro+ (Bear market, financial crisis and so on EditionIn markets defined by volatility, fear, and uncertainty – the battlegrounds of bear markets and financial crises – you need tools forged in resilience. Introducing RSI Pro+, a strategy built upon a legendary indicator born in 1978, yet engineered with modern visual clarity to remain devastatingly effective even in the chaotic financial landscapes of 3078.
This isn't about complex algorithms predicting the unpredictable. It's about harnessing the raw, time-tested power of the Relative Strength Index (RSI) to identify potential exhaustion points and capitalize on oversold conditions. RSI Pro+ cuts through the noise, providing clear, actionable signals when markets might be poised for a relief bounce or reversal.
Core Technology (The 1978 Engine):
RSI Crossover Entry: The strategy initiates a LONG position when the RSI (default period 11) crosses above a user-defined low threshold (default 30). This classic technique aims to enter when selling pressure may be waning, offering potential entry points during sharp downturns or periods of consolidation after a fall.
Modern Enhancements (The 3078 Cockpit):
RSI Pro+ isn't just about the signal; it's about providing a professional-grade visual experience directly on your chart:
Entry Bar Highlight: A subtle background flash on the chart signals the exact bar where the RSI crossover condition is met, alerting you to potential entry opportunities.
Trade Bar Coloring: Once a trade is active, the price bars are subtly colored, giving you immediate visual confirmation that the strategy is live in the market.
Entry Price Line: A clear, persistent line marks your exact average entry price for the duration of the trade, serving as a crucial visual anchor.
Take Profit Line: Your calculated Take Profit target is plotted as a distinct line, keeping your objective clearly in sight.
Custom Entry Marker: A precise shape (▲) appears below the bar where the trade entry was actually executed, pinpointing the start of the position.
On-Chart Info Table (HUD): A clean, customizable Heads-Up Display appears when a trade is active, showing vital information at a glance:
Entry Price: Your position's average cost basis.
TP Target: The calculated price level for your Take Profit exit.
Current PnL%: Real-time Profit/Loss percentage for the open trade.
Full Customization: Nearly every aspect is configurable via the settings menu:
RSI Period & Crossover Level
Take Profit Percentage
Toggle ALL visual enhancements on/off individually
Position the Info Table wherever you prefer on the chart.
How to Use RSI Pro+:
Add to Chart: Apply the "RSI Pro+ (Bear market...)" strategy to your TradingView chart. Ensure any previous versions are removed.
Access Settings: Click the cogwheel icon (⚙️) next to the strategy name on your chart.
Configure Inputs (Crucial Step):
RSI Crossover Level: This is key. The default (30) targets standard oversold conditions. In severe downturns, you might experiment with lower levels (e.g., 25, 20) or higher ones (e.g., 40) depending on the asset and timeframe. Observe where RSI(11) typically bottoms out on your chart.
Take Profit Percentage (%): Define your desired profit target per trade (e.g., enter 0.5 for 0.5%, 1.0 for 1%). The default is a very small 0.11%.
RSI Period: While default is 11, you can adjust this (e.g., the standard 14).
Visual Enhancements: Enable or disable the visual features (background highlights, bar coloring, lines, markers, table) according to your preference using the checkboxes. Adjust table position.
Observe & Backtest: Watch how the strategy behaves on your chosen asset and timeframe. Use TradingView's Strategy Tester to analyze historical performance based on your settings. No strategy works perfectly everywhere; testing is essential.
Important Considerations:
Risk Management: This specific script version focuses on a Take Profit exit. It does not include an explicit Stop Loss. You MUST manage risk through appropriate position sizing, potentially adding a Stop Loss manually, or by modifying the script.
Oversold ≠ Reversal: An RSI crossover is an indicator of potential exhaustion, not a guarantee of a price reversal.
Fixed TP: A fixed percentage TP ensures small wins but may exit before larger potential moves.
Backtesting Limitations: Past performance does not guarantee future results.
RSI Pro+ strips away complexity to focus on a robust, time-honored principle, enhanced with modern visuals for the discerning trader navigating today's (and tomorrow's) challenging markets
