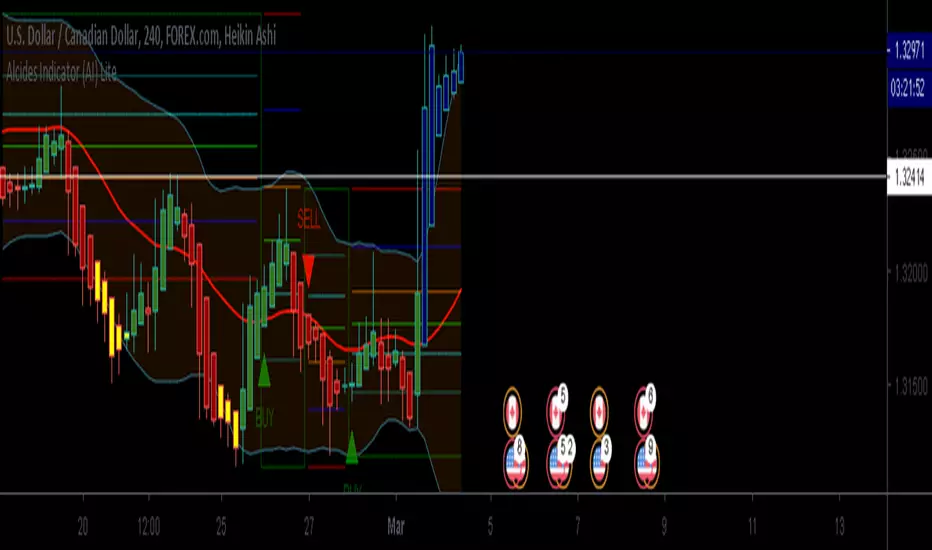
Alcides Indicator(AI) LiteAlcides Indicator (AI) Lite is a simple to use indicator that can be used with any type of asset, trading in any market including FOREX, Stocks, Commodities, Cryptocurrencies etc. The Lite version uses levels from either 1 hr or 4 hr time frame based on user input to indicate entry (BUY) into or exit (SELL) from an asset. The indicator also plots support for BUYs and Resistance for SELLs which can be used as a reference while setting your Stop Loss. BUY, SELL and TAKE GAINS alerts can be set on trading view to help monitor the asset as well.
Even though the indicator signals BUYs and SELLs based on chosen Time Frame levels, the user must always use their discretion based on their TA and FA. Also, indicator repainting can occur based on time of signal/chart used (ex. 5m chart on 1 hr timeframe levels can repaint a BUY/SELL after 1 hr closes).
Works best with Heikin Ashi candles and lower timeframes like 5m, 15m, 30m.
The full version has more time frame levels to choose from, a few extra useful features and also recommends sell and buy levels based on the chosen time from.
Contact me for access and more information.
Cerca negli script per "entry"
Dream Indicator v 1.0UNDER DEVELOPMENT - PRIVATE RELEASE ONLY
Dream Indicator v 1.0
A trend following indicator optimized for use with heikin ashi charts.
Keeps you in a trade, and provides entry/exit points.
Effective across all time frames (higher is better, as with all indicators). MTF capable to provide either long-term trend following (higher time frame), or quicker entry/exit signals (lower time frame).
Requires a trade bias (e.g. divergence, support/resistance, 200 period MA).
This is a private release only, so I can grant access to specific users for feedback. A public release MAY follow in the future. Register your interest in the comments or PM me.

MM-Burj Khalifa IndicatorThis indicator uses several signals to visualize a "perfect candle" to enter a trade.
It colors the background to identify the zones of interest (multiple configurable high or low RSI zones). Underlying is a trendbar with the current MACD direction.
The indicator is using signals of:
--MACD
--RSI
--PVT
--ATR
--AD and DMI+/DMI-
When all 7 criterias are met it highlights the candle.
It also creates different colums with different height and width, so that you can see which signal is OK and which is maybe missing. When all signals are on GO you'll see a Burj-Khalifa-like figure. If not all signals are on GO you'see crippled versions.
To be clear:
it's not intended to detect trends or supertrends or reversals. It's purpose it's just to decide if this current candle is really going in the right direction.
The Burj-Khalifa indicator could help to confirm the entry point of an trade which was already planned.

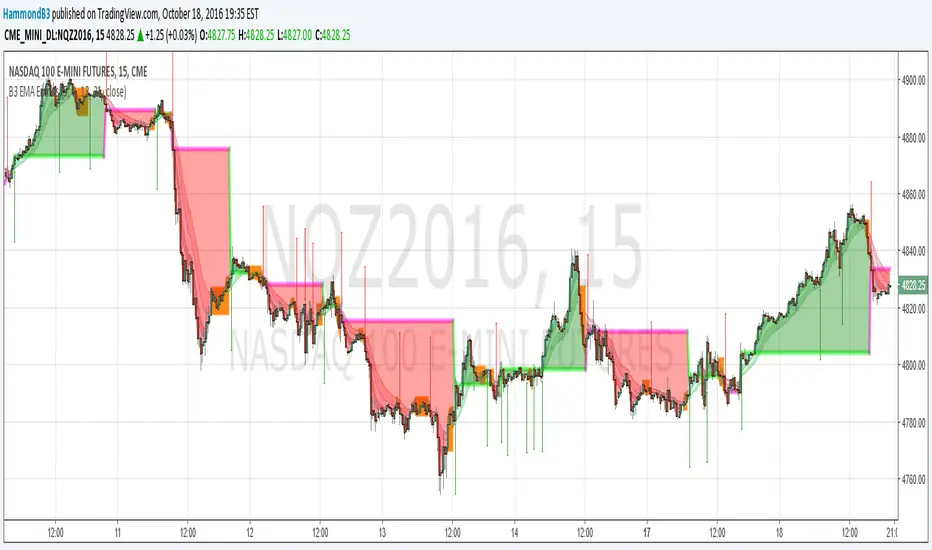
B3 EMA EntriesB3 EMA Entries = B3 EMA Ribbon "Trader"
This study takes the B3 EMA Ribbon and builds trade entries from it. The clouds represent the deviation from entry points; orange equals weakening or undetermined trend. Manage your own exits, and if you have a large deviation cloud in comparison to prior clouds.... take them profits!
Here also is a glimpse into my proprietary scripting that I will likely offer for a subscription at some point. Many simpler freebies like this share to come first of course! I will give away most simple indicators, but there are a few sub-chassis things I use, which I developed myself. One of which is indicator back testing, where I see all of the strategy's history information from the indicator on the chart. Sans trade-ticket automation, this voids the need for a strategy file or A.P.I. or backtesting devices (however, I plan to adapt things to TradingView's strategy system if I can, so that automation can take place). As well as this algorithmic trading system chassis, I also have a specialized statistical output chassis and another few graphical depiction sets.
For this share, you should manage your own exits, (you could simply use the orange clouds as an exit.) This is my most simple of the "indicator traders" I call them. The more intricate algorithmic trading indicators I make have the full trading package down to the risk to reward, entry, target, stop, and trail. The statistical systems are pretty unique, and I haven't seen many doing what I do on that front yet, so I am excited to get those out to more people. Look for these subscriptions in the near future, but as a token of introduction enjoy my next several free shares too.
Cheers, and good trades to you. ~B3
Micro Pullback Entry SystemMicro Pullback Entry System - Quick Reference
The Pattern
▲ ENTRY (first green to break high)
│
┌──┴───┐
│ 1-3 │ ← PULLBACK (red candles)
│ red │ Stop = Low of this zone
└──────┘
│
┌──┴───┐
│ 3+ │ ← THE MOVE (green candles)
│green │ Strong momentum
└──────┘
Pattern Checklist
Requirement: Why It Matters
3+ green candlesConfirms momentum
1-3 red pullback Brief = momentum intact< 50% retracementShallow = buyers in controlVolume on entryConfirms breakout Above EMA Trend support
Status Flow
Scanning... → 📈 TRENDING → 👀 WATCHING → ⏳ FORMING → 🎯 ENTRY!
StatusMeaningActionScanningLooking for setupWait📈 TRENDINGGreen streak buildingMonitor👀 WATCHINGPullback startedPrepare⏳ FORMINGValid pullback readyGet ready!🎯 ENTRY!Signal triggeredExecute
Entry/Stop/Target
LevelLine ColorHow to SetEntryLime solidClose of signal candleStopRed dashedLow of pullbackTarget 1Aqua dottedEntry + (2 × Risk)Target 2Yellow dottedEntry + (3 × Risk)
Example
Entry: $5.00
Stop: $4.80
Risk: $0.20
Target 1 (2R): $5.00 + $0.40 = $5.40
Target 2 (3R): $5.00 + $0.60 = $5.60
Quality Grades
GradeScoreActionA+5/5 ✓Best setup - full sizeA4/5 ✓Good setup - standard sizeB3/5 ✓Average - reduced sizeC2/5 ✓Weak - skip or tiny size
Scoring Factors
✓ Green streak met minimum
✓ Pullback length valid (1-3)
✓ Retracement shallow (<50%)
✓ Volume confirmed
✓ Above EMA
Trade Execution
Entry
Wait for "⏳ FORMING" status
Watch for green candle forming
Entry triggers when green candle closes above pullback high
Enter at market or small limit above current price
Stop Loss
Set at pullback low (red dashed line)
Non-negotiable - this is your max risk
Trade Management
If no immediate follow-through → exit early
Take 50% off at Target 1 (aqua line)
Move stop to breakeven
Let remainder run to Target 2
Settings Guide
Default (Recommended)
Min Green Candles: 3
Min Pullback: 1
Max Pullback: 3
Max Retracement: 50%
Volume Multiplier: 1.2x
EMA Filter: ON (20)
Conservative (Fewer, Better)
Min Green Candles: 4
Min Pullback: 2
Max Pullback: 3
Max Retracement: 40%
Volume Multiplier: 1.5x
EMA Filter: ON (20)
Aggressive (More Signals)
Min Green Candles: 2
Min Pullback: 1
Max Pullback: 4
Max Retracement: 60%
Volume Multiplier: 1.0x
EMA Filter: OFF
Common Mistakes
❌ Entering before signal
Wait for green triangle
"FORMING" ≠ "ENTRY"
❌ Wide stop
Stop must be at pullback low
If too wide, skip the trade
❌ Ignoring volume
Low volume entries fail more often
Look for ✓ in volume row
❌ Fighting trend
Check EMA status
Should show "Above ✓"
❌ Chasing after entry
If you miss entry by 3+ candles, wait for next setup
Don't chase extended moves
Best Setups
A+ Quality Setup ✓
4-5 green candles (strong move)
2 candle pullback (brief)
25-35% retracement (shallow)
2x+ volume on entry
Well above EMA
Stock already up 5%+ on day
Avoid These ✗
Only 2 green candles
4+ candle pullback (losing momentum)
50%+ retracement (too deep)
Below average volume
Below or at EMA
Against market direction
Timeframe Guide
TFSignalsQualityBest For1mMostLowerScalping5mBalancedGoodDay trading15mFewestHigherSwing entries
Quick Decision Tree
1. Status showing "FORMING"?
NO → Wait
YES → Continue
2. Quality grade A or better?
NO → Skip or small size
YES → Continue
3. Volume confirmed (✓)?
NO → Caution, reduce size
YES → Continue
4. Above EMA (✓)?
NO → Skip
YES → Continue
5. Risk acceptable? (Stop not too wide)
NO → Skip
YES → TAKE THE TRADE
Alert Setup
Essential Alert
"Micro Pullback Entry" - Main signal
How to Set
Right-click chart → Add Alert
Condition: Micro Pullback Entry System
Select "Micro Pullback Entry"
Set notification preferences
Combining with Other Indicators
IndicatorHow to Use5 PillarsFind stocks meeting criteria firstGap & GoLook for micro pullbacks after gap breakoutsR2G TrackerConfirm stock is green before enteringFloat RotationHigh rotation + micro pullback = best setupsBull FlagMicro pullback is a "mini" bull flag
Example Trade
Stock: XYZ
Pre-market: Gapped up 15%
9:35 - 9:38: 4 green candles (move from $4.50 to $5.00)
9:39 - 9:40: 2 red candles (pullback to $4.85)
9:41: Green candle breaks $4.90 (pullback high)
ENTRY: $4.92
STOP: $4.82 (pullback low)
RISK: $0.10
TARGET 1: $5.12 (+$0.20 = 2R)
TARGET 2: $5.22 (+$0.30 = 3R)
Result: Hit Target 2 by 9:55 → +$0.30 per share
Key Takeaways
Micro = 1-3 candles - Brief pullback
Entry = First green to break high - Specific trigger
Stop = Pullback low - Tight risk
Quality matters - Focus on A/A+ setups
Breakout or bailout - Exit if no follow-through

FVG Snper PRO🎯 FVG Sniper — Fair Value Gap Signal Engine
FVG Sniper is a professional imbalance-based entry tool built around the Nasdaq futures (NQ/MNQ) — but the signal logic is general enough to apply to many liquid instruments (indices, FX, crypto, metals).
It automatically detects Fair Value Gaps (FVGs), tracks their lifecycle, and fires rule-based long/short signals only when price shows decisive intent away from those imbalances.
🔍 What FVG Sniper Does
Detects FVGs automatically (no pivots)
Uses a strict 3-candle pattern to locate bullish and bearish imbalances directly from price action.
Tracks each FVG over time
For every FVG, FVG Sniper tracks:
When it was created
Whether it has ever been tapped
Whether it has been tapped since the last trade
Whether it has been invalidated (“inversion close”)
Session-gated execution
FVGs can be formed and tapped any time.
Only bars inside a defined signal session (e.g. 09:30–12:00 New York time) are allowed to trigger entries.
FVGs are only eligible if they were created on the same trading day as the signal and after a specific time cutoff (e.g. 08:30 ET).
Tap-aware, breakout-based entries
The indicator looks for:
An FVG that has been tapped at least once since the last signal (if tap is required).
A decisive breakout of the previous bar’s high or low coming off that FVG.
Multi-strategy overlay (for advanced use)
On top of the core engine, FVG Sniper offers several optional “Sniper profiles” (strategies) tuned around:
Session timing (e.g. morning / midday windows)
Volatility regimes
Lane cleanliness / opposite-side structure behavior
Range context (distance from session extremes)
You can toggle these profiles on/off to restrict signals to specific conditions — but the exact internal filters and thresholds are not disclosed.
If at least one profile is enabled, a signal prints when any enabled profile likes the setup.
If no profiles are enabled, FVG Sniper shows the raw base FVG breakout signals from the core engine.
🧠 How to Use It
Primary use case: intraday futures (NQ/MNQ) on 1M timeframe.
FVG Sniper works best as:
A signal engine feeding your execution plans, or
A confirmation layer on top of your own context (HTF bias, news, higher-timeframe levels, etc.).
🎨 Visuals & Controls
Bullish and bearish FVG zones are drawn directly on the chart.
Optional mid-lines through each FVG.
Automatic delete or “fade” behavior when FVGs are invalidated.
Clear long/short markers at the signal bar.
Optional debug label to inspect which FVG produced the signal and key reference times.
⚠️ Disclaimer
This script is for educational and research purposes only and is not financial advice.
Past performance does not guarantee future results. Always validate any signal logic in a simulator and adapt it to your own risk management, instrument, and timeframe.

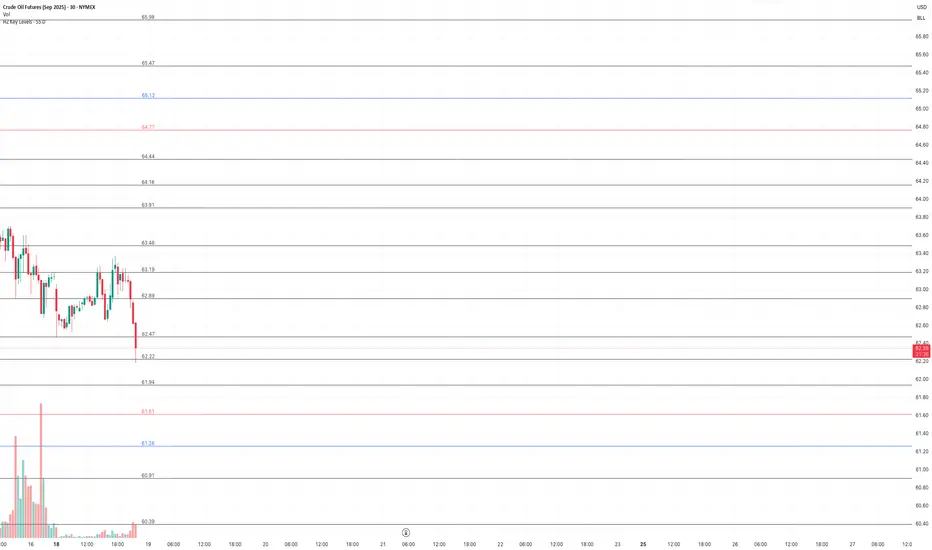
HZ Key LevelsThe HZ Key Levels script is a powerful tool designed to help traders identify sharp and precise entry and take profit levels on their charts. Utilizing a unique proprietary formula, this indicator provides a clear visual guide for strategic trading decisions. The levels are plotted as solid lines with corresponding price values, ensuring they remain relevant across different timeframes. Ideal for traders seeking reliable reference points to enhance their market analysis and execution precision.
EMA+ATR Band MTF Trend EntryThis is a Multi-Timeframe Trend Trading indicator strategy adapted from Sahil Rohmehtra’s Mentorship programme. The trading decision is made by first accessing the trend in higher timeframe (say Monthly) by using TWO EMAs. If the faster EMA (say 20 period) is above Slower EMA (say 50 period) and the price is above slower EMA then the trend is suitable for buyers. Similarly if faster EMA is below slow EMA and the price is below that then trend is suitable for sellers.
Once we access the trend in the higher timeframe we move to the lower timeframe (say Weekly) and access the 5-period RSI value. If RSI is below 30 then we can prepare for possible buy entry in lower (Daily) timeframe if entry conditions are met in daily timeframe. Similarly sell bias can be initiated when the higher timeframe EMA trend is down, daily RSI is above 70 and sell entry condition is met in daily timeframe. The RSI thresholds can be changed by the user.
Once we identified the RSI bias then wait for the confirmation candle in the lower timeframe (say 1 hour). In the entry timeframe we plot a band of 20 EMA of LOWs ± 1 ATR lines. Here,we wait for a candle to close above the 20 EMA of LOWs + 1 ATR for a buy signal with an increase in On Balance Volume (OBV) value. Similarly for sell signal we should get a candle close below the 20 EMA of LOWs - 1 ATR with corresponding change in OBV. This candle is the signal candle.
Once we get a Buy or Sell signal the corresponding stop loss is the nearest LOW - 1 ATR or HIGH + 1 ATR. The ATR scaling may be changed by the user. Now if another candle closes above the high of the buy signal candle then enter on buy. If the low of the buy signal candle is broken then it is a potential short-term sell entry. Similarly if another candle closes below the sell signal candle then enter short and if there is a close above high of the signal candle then it is a potential buy entry.

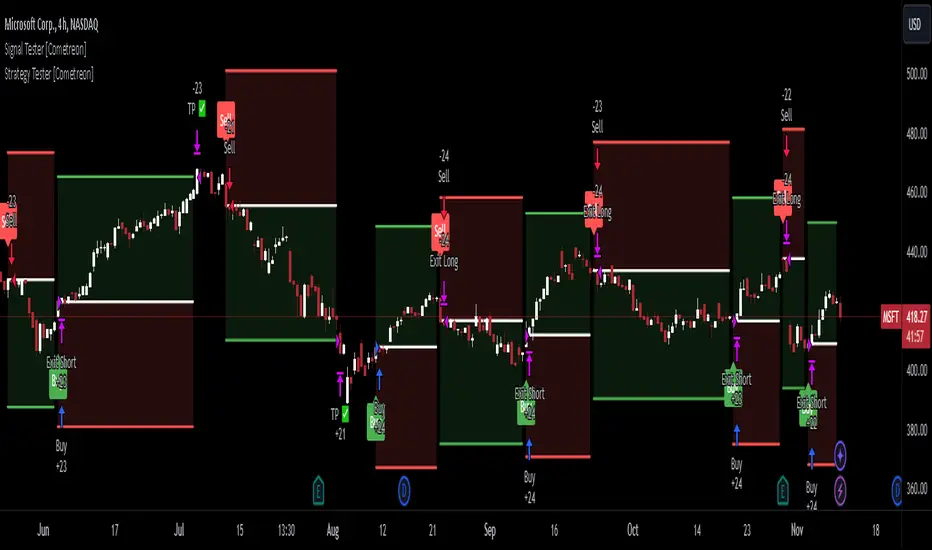
Signal Tester [Cometreon]Signal Tester is a fast and intuitive tool designed to help you visualize and analyze up to 100 past trading signals directly on the TradingView chart. Whether your signals come from bots, communities, or your own strategies, this indicator is perfect for quick validation and real-time feedback.
🔷 Key Features
🟩 Visual Signal Mapping
Display long and short entries directly on your chart for clear, immediate analysis of signal behavior.
🟩 Multi-Timeframe Compatibility
Analyze how signals behave across different timeframes to identify strengths, weaknesses, and timing.
🟩 Universal Signal Input
Test signals coming from trading bots, private groups, external alerts, or manually built strategies.
🔷 Technical Details and Customizable Inputs
1️⃣ Position Selection - Choose up to 100 recent positions—both long and short—and plot them directly on your chart.
2️⃣ Data Entry - Easily define the date and type (Long or Short) for each position directly from the settings panel.
🔍 How to Use Signal Tester Pro
📥 Input Your Signals
Add your entries and exits manually in the indicator settings.
📊 Analyze on the Chart
Visualize each trade's placement in real historical context to evaluate timing and performance.
🔁 Connect with Strategy Tester
Use the generated signals as input for Strategy Tester Pro to backtest your trading logic with full control.
☄️ Start testing your trading signals now with TradeLab Beta's Signal Tester access this powerful tool and take your market analysis to the next level!
Don't waste any more time and visit the link to get access to all Cometreon indicators.
Dynamic Trading Strategy with Key Levels, Entry/Exit ManagementThis indicator provides a complete rule-based trading system, combining key levels, entry conditions, stop loss (SL), and take profit (TP) management. It’s designed to dynamically adapt to market conditions by identifying crucial support and resistance zones, determining entry points based on price action and volume, and calculating risk-based exit targets.
Key Features
Key Level Identification:
The indicator automatically identifies support and resistance levels based on recent price highs and lows within a customizable lookback period.
It adds a dynamic buffer around these levels using the Average True Range (ATR) to account for market volatility, ensuring the zones adjust to changing conditions.
Entry Conditions:
Bullish Entry: Triggers near the support zone when there’s upward price action, confirmed by volume spikes and bullish candlestick patterns (e.g., hammers, engulfing candles).
Bearish Entry: Triggers near the resistance zone when signs of rejection appear, confirmed by volume spikes and bearish candlestick patterns (e.g., shooting stars, bearish engulfing).
Entry zones are highlighted visually on the chart using green (bullish) and red (bearish) shaded boxes.
Stop Loss (SL) and Take Profit (TP):
Stop Loss: Calculated based on ATR multipliers, allowing you to set a volatility-adjusted risk level beyond the entry range.
Take Profit: Includes two profit-taking levels (TP1 and TP2), allowing for partial position exits. TP levels are calculated based on a reward-to-risk ratio, ensuring consistent profitability targets.
SL and TP levels are clearly marked with horizontal lines and labeled as SL, TP1, and TP2, helping you manage trade exits effectively.
Market Context Adaptability:
The indicator adapts to both trending and ranging market conditions. In trending markets, it favors trades that follow the trend, while in ranging markets, it focuses on reversals within the range boundaries.
Visual Aids:
Entry zones are highlighted with shaded boxes to indicate potential buy/sell regions.
SL, TP1, and TP2 levels are clearly drawn with labels, allowing for easy identification of exit points.
How to Use
Identify Key Levels: Look for support and resistance zones highlighted by the indicator on your chart.
Wait for Entry Conditions: When the price enters the entry range (marked by green or red boxes), wait for confirmation signals—such as volume spikes and candlestick patterns.
Manage Exits: Use the SL, TP1, and TP2 levels for structured trade management. Consider scaling out partially at TP1 and exiting fully at TP2.
Ideal For:
This indicator is suitable for traders who prefer a systematic approach to trading, with clear entry and exit rules. It is particularly helpful for those looking to balance risk and reward with well-defined take profit and stop loss levels.

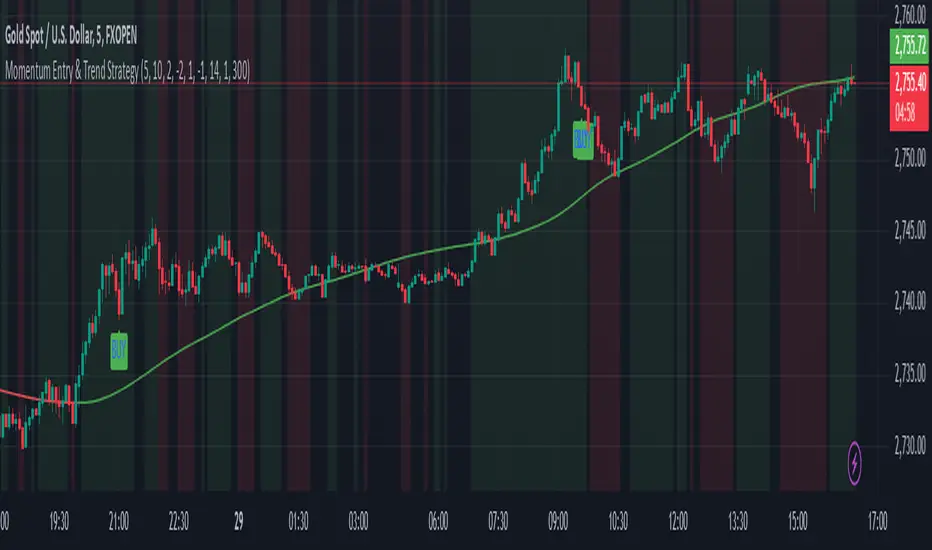
Momentum Entry & Trend Strategy M5Momentum Entry & Trend Strategy M5
Description:
The Momentum Entry & Trend Strategy M5 is an indicator script designed to assist traders in determining optimal buy and sell moments based on momentum and trend analysis. This script operates using two different momentum levels—Momentum Length for Entry (5) and Momentum Length for Trend (10)—along with the HMA (Hull Moving Average) indicator for trend confirmation.
Key Features:
Momentum Entry: Calculates momentum using the difference between the current price and the price from previous periods to determine the strength and direction of price movements.
Trend Identification: Utilizes two momentum levels (5 and 10) to identify bullish and bearish trend conditions.
HMA for Trend Confirmation: The HMA indicator is used to provide trend confirmation signals. When HMA indicates bullish, a buy signal is displayed; conversely, a bearish HMA results in a sell signal.
Signal Display: Displays buy (BUY) and sell (SELL) signals on the chart when the conditions for market entry are met, providing clear visualization for traders.
Background Color: Offers a green background for uptrends and a red background for downtrends, allowing traders to easily identify the overall market condition.
ATR (Average True Range): Calculates and plots a smoothed ATR to help traders measure market volatility.
Settings:
Momentum Length for Entry: 5 (to determine entry signals)
Momentum Length for Trend: 10 (to determine trend conditions)
HMA Length: 300 (period length for HMA to confirm trends)
ATR Length: 14 (period length for ATR to measure volatility)
Benefits:
This script is designed to provide visual and data-driven guidance for better trading decision-making. By combining momentum and trend analysis, traders can enhance the accuracy of their signals and reduce the risk of errors when identifying entry and exit points in the market.
Note:
This script is intended for use on the M5 time frame but can be adjusted for other time frames as needed. It is always recommended to conduct thorough testing before applying trading strategies on a live account.
ATR Range Pivot LinesDescription:
This Pine Script calculates and plots pivot lines based on ATR (Average True Range) value and closing price. It uses the previous trading day's ATR value to set static pivot levels for the current trading day. These pivot lines help traders identify potential support and resistance levels based on historical volatility. The script includes two main pivot lines—ATR High and ATR Low —and two midpoint lines between them for additional context. Labels are added to show the exact pivot values, with options to customize label positions.
Intended Use:
The script is designed to help traders forecast potential price ranges for the current trading day based on the previous day’s volatility. By adding and subtracting the previous day's ATR from the prior close, the script identifies key levels where price action may encounter support or resistance. It is useful for setting realistic price targets or entry/exit points. Since the ATR-based pivot lines are static for the entire day, they provide a reliable range for intraday trading strategies.
Disclosure:
This script was generated using AI. It is recommended to review and test the script thoroughly before applying it in live trading scenarios.

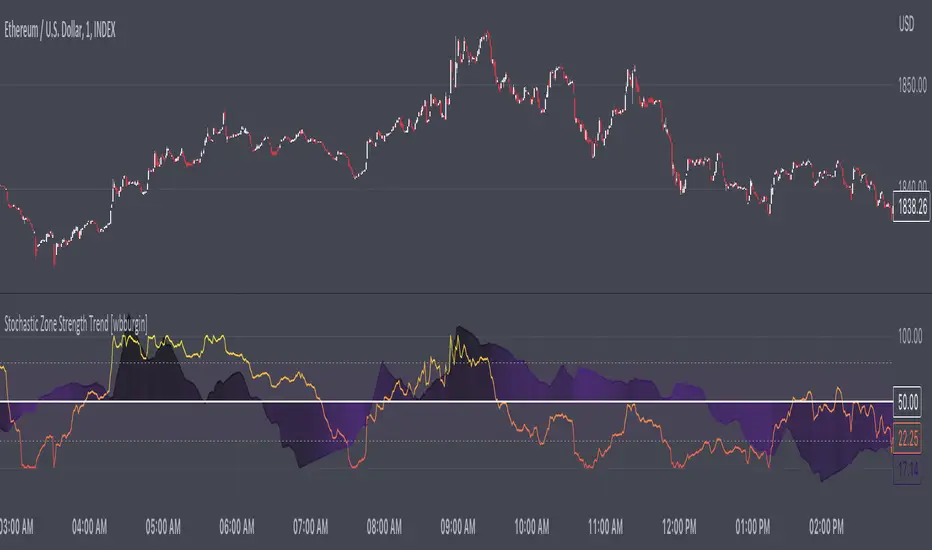
Stochastic Zone Strength Trend [wbburgin]The Stochastic Zone Strength Trend indicator is a very powerful momentum and trend indicator that 1) identifies trend direction and strength, 2) determines pullbacks and reversals (including possible entry/exit conditions), 3) works on every instrument, and 4) can filter out ranges. I have some examples below on how to use it to its full effectiveness. It is composed of two components: Stochastic Zone Strength and Stochastic Trend Strength .
Stochastic Zone Strength
At its most basic level, the stochastic Zone Strength plots the momentum of the price action of the instrument, and identifies bearish and bullish changes with a high degree of accuracy. Think of the stochastic Zone Strength as a much more robust version of the RSI. Momentum-change thresholds are demonstrated by the "20" and "80" levels on the indicator (see below image).
Stochastic Trend Strength
The stochastic Trend Strength component of the script uses resistance in each candlestick to calculate the trend strength of the instrument. I will go more into detail about the settings after my description of how to use the indicator, but there are two forms of the stochastic Trend Strength:
Anchored at 50 (directional stochastic Trend Strength:
The directional stochastic Trend Strength can be used similarly to the MACD difference or other histogram-like indicators : a rising plot indicates an upward trend, while a falling plot indicates a downward trend.
Anchored at 0 (nondirectional stochastic Trend Strength:
The nondirectional stochastic Trend Strength can be used similarly to the ADX or other non-directional indicators : a rising plot indicates increasing trend strength, and look at the stochastic Zone Strength component and your instrument to determine if this indicates increasing bullish strength or increasing bearish strength (see photo below):
(In the above photo, a bearish divergence indicated that the high Trend Strength predicted a strong downwards move, which was confirmed shortly after. Later, a bullish move upward by the Zone Strength while the Trend Strength was elevated predicated a strong upwards move, which was also confirmed. Note the period where the Trend Strength never reached above 80, which indicated a ranging period (and thus unprofitable to enter or exit)).
How to Use the Indicator
The above image is a good example on how to use the indicator to determine divergences and possible pivot points (lines and circles, respectively). I recommend using both the stochastic Zone Strength and the stochastic Trend Strength at the same time, as it can give you a robust picture of where momentum is in relation to the price action and its trajectory. Every color is changeable in the settings.
Settings
The Amplitude of the indicator is essentially the high-low lookback for both components.
The Wavelength of the indicator is how stretched-out you want the indicator to be: how many amplitudes do you want the indicator to process in one given bar.
A useful analogy that I use (and that I derived the names from) is from traditional physics. In wave motion, the Amplitude is the up-down sensitivity of the wave, and the Wavelength is the side-side stretch of the wave.
The Smoothing Factor of the settings is simply how smoothed you want the stochastic to be. It's not that important in most circumstances.
Trend Anchor was covered above (see my description of Trend Strength). The "Trend Transform MA Length" is the EMA length of the Trend Strength that you use to transform it into the directional oscillator. Think of the EMA being transformed onto the 50 line and then the Trend Strength being dragged relative to that.
Finally, the colors are changeable on the bottom.
Final Notes
As with previous and future invite-only scripts, I only restrict access to 1) maintain effectiveness of scripts, 2) because I use these scripts myself heavily, and/or 3) to support myself. Additionally, I will never make an restricted indicator that is not completely original in idea, scope, and execution.
Yours,
wbburgin
TrapLightTrap Light is built off the stochastic RSI to provide convenience and make your entries while scalping either long/short more straightforward.
Notes/Disclaimer:
This indicator is not guaranteed to work every time. Use it at your own discretion and perform your own due diligence. None of this is financial advice.
The main idea behind this is that when the stochastic RSI reaches such extremes that it often moves in a favorable direction.
K = momentum or the blue line of the stochastic RSI indicator.
Perks:
Don't have to look away from candlesticks and measure stochastic RSI's K level.
Simple visual indication of what to do.
Don't have to stare at your chart all day waiting for things to get exciting.
How to Use:
(Above the current candlestick on any timeframe)
1. When K is greater than or equal to 99.5, it shows a sell signal. This is to indicate a short entry.
2. When K is less than or equal to 0.5, it shows a buy signal. This is to indicate a long entry.
3. If neither the conditions for a short/long entry are present, it shows a circle that is like a traffic light.
Red Light: When K is between 99.5 and 95, a red circle is shown to indicate that a short entry may be available soon.
Yellow Light: When K is between 95 and 5, a yellow circle is shown to indicate that neither a long nor short entry may be available soon.
Green Light: When K is between 5 and 0.5, a green circle is shown to indicate that a long entry may be available soon.
Alerts:
Set an alert on the ticker you trade to notify you when either the green or red light is present so that you have time to prepare to make an entry either long/short.
The Code:
The PineScript is open-source and annotated to explain different parts of the script for ease of understanding.
@Credit to Kingson1 for this strategy and his feedback on its creation/implementation.

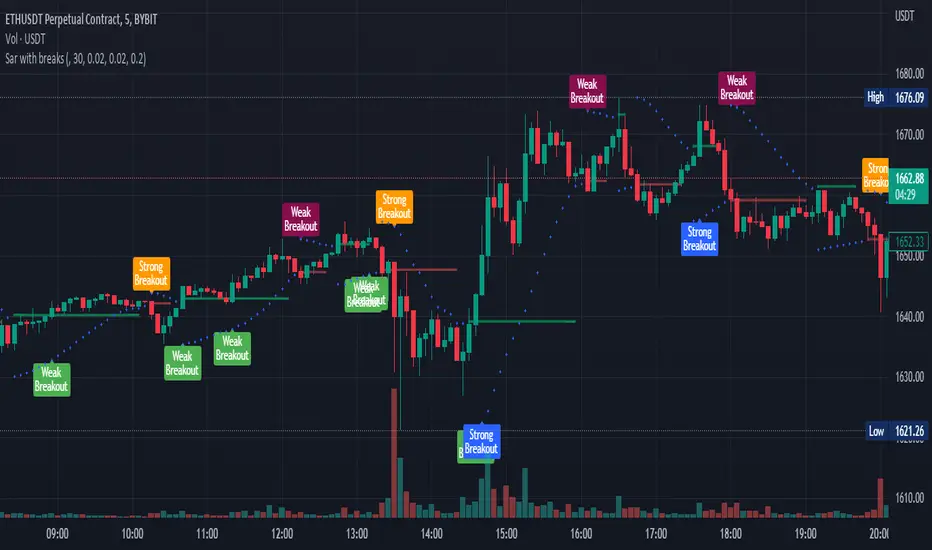
Parabolic sar with breaksThis plots a Parabolic sar and a break line on the previous sar point before the parabolic sar flips.
This is looking to be a very popular entry signal for lots of strats.
How to use:
In conjunction with other confirmation indicators;
Long : Enter long when the Parabolic sar is below the price and the price breaks above (and closes) the break line.
Short : Enter short when the Parabolic sar is above the price and the price breaks below (and closes) the break line.
A great indicator combination for this is to use a 200 ema for price trend and volume flow.
TOTC - Trade outside the Channel (aka "Chaos Coaster") [Free]To make the strategy known as the "Chaos Coaster" (published by "Perfect Entry" group) easy to use, simplify backtesting, and increase awareness, I combined three indicators into one. The result is this standalone indicator, which provides clear signals based on the original rules of the strategy.
Let's look at the rules and components of the strategy to explain how the indicator works and signals:
As a baseline we use a "Pivot (Fractal) Chaos Channel" or also known as "Fractal Chaos Band".
Essentially, the "Fractal Chaos Channel" shows an overall panorama of price action. As they filter out the insignificant price fluctuations. The upper level is created by drawing price highs and the lower level is created by drawing price lows.
As our first confirmation and to identify the direction of the trend, we use the momentum technical oscillator “TSI – True Strength Indicator”.
As a second confirmation, we use my indicator "PaP - Procul ad Pretium", which is not yet public. It helps to identify a trend at an early stage or to serve as confirmation. In short, as the name implies, the indicator tries to identify the trend based on the distance of prices to trending averages, smoothed with moving averages of your choice.
(In the original version of the strategy, "Piphunter lmi" by the_w15rdx is used. PaP provides comparable results.)
The rules for "long" or "short" signals
The basic rule is: "Trade outside the channel" when PaP and TSI point in the same direction.
Rule 1 of the Strategy:
A candle breaks and closes outside the "Pivot (Fractal) Chaos Channel". For "long" positions, the price must break the upper level. For "short" positions, the price must break the lower level.
Rule 2 of the Strategy:
The direction of the TSI must match the break direction of the "Pivot (Fractal) Chaos Channel". For long positions, TSI must be above its signal line. Vice versa for "short" positions.
Rule 3 of the Strategy:
The direction of "PaP - Procul ad Pretium" must match the break direction of the "Pivot (Fractal) Chaos Channel".
Outputs and Filters
The output is the "Pivot (Fractal) Chaos Channel" whose background corresponds to the direction of "PaP - Procul ad Pretium" and whose lines reflect the direction of "TSI - True Strength Indicator".
"long" or "short" signals are indicated by colored candlesticks and arrows. If there are several signals per level of "Pivot (Fractal) Chaos Channel", they are also numbered consecutively.
In addition, the signals can be filtered by defining the maximum number of signals per pivot (fractal) level.
How can this indicator be used?
As mentioned, this indicator provides the signals for the strategy that has become known as the "Chaos Coaster". Details and even videos of this strategy can be found online. I can also provide a list of links upon request.
Limitations of this free version
The default settings of the indicator reflect the original version of the strategy. Some parameters cannot be changed or can only be changed to a limited extent in this free version. To get full access to all parameters, send me a private message here on TradingView.
Setting up alerts and what needs to be considered
Alerts take into account the settings of the indicator at the time of creating an alert. I therefore recommend setting up the alert again after making changes to the settings. To receive alerts: "Add Alert to TOTC" and select "Any alert() function call".
What do I need to consider?
It may be advisable to add further indicators and an analysis of the market structure in order to confirm the signals issued by the indicator. Please note that when you make adjustments to any strategy, you always carry out particularly detailed tests.
You would like to use this strategy, but you have adjustment requests, you want to have additional filters or features implemented, ...?
I am happy to create individual indicators based on "TOTC - Trade outside the Channel ". Write me a PM and we will discuss the details and conditions.
Will this indicator be further developed and will I receive free updates?
All my indicators are of course constantly updated and, if possible and with the aim of the indicator justifiable, supplemented by user requests. If you like this indicator and follow me here on TradingView, you will be informed about updates and also new indicators.

Bollinger Band Gradient (BBG)The Bollinger Band Gradient Indicator uses plenty of Bollinger Bands to create a gradient-looking indicator to help with layered entries . It is similar to a Ribbon but better. This indicator is best used with any volume-related indicator so you can recede from entering into any position with too much momentum to rebound off of any line. Note that this indicator is best used with another strategy like pair trading. It is not recommended to trade based on this indicator only . Please stay aware of any news about the stock you are trading because some events may have a big impact and force the market to go bullish/bearish by a lot. This indicator can be used with all chart types and works well with many other indicators. It allows for complete customization and offers easy-to-understand settings which can be designated to a certain individual. You can modify all settings for the BBs which allows for an even more personalized and adapted Indicator that reflects your trading/ investing needs. You also have the option to choose which type of MAs will be used to create the Bollinger Bands , a few of which include: SMA, EMA, WMA, HMA, RMA, DMA, LSMA, VAMA, TMA, MF.
Bollinger Bands are a way to measure and visualize volatility . As volatility increases, the wider the bands become, and the more they deviate from the basis. Likewise, when volatility decreases, the gap between the bands and basis decreases. Yet a big advantage for not only this but many other indicators is created due to the ample count of different settings that are widely used, it is difficult to view the market through the eyes of all types of investors/traders . This indicator manages to counter exactly this issue, you will be able to see all of these settings on one chart and at one time and enter/exit positions accordingly.
Using this indicator will allow you to visualize entry and exit points with ease and make order layering (buying/selling in layers) much more simple. You can choose a certain amount of Bollinger Bands you would like displayed and customize all technical and style-related settings related to the BBs .
A few of the technical settings you can change for the Bollinger Bands are:
Bollinger Band count (Select how many BBs you want to be displayed.)
MA type used to make the Bollinger Bands ( EMA, SMA, WMA, etc.)
Source (close, open, high, low.)
BB length separately (The length of each Bollinger Band, its lookback. How many previous candles should it be based on? Choose each Bollinger Band's lookback length.)
BB deviator separately(The standard Deviator applied for the BB for both the upper and lower line.)
A few of the style settings you can change for each Bollinger Band are:
Fill (the color used to fill from the upper to the lower band)
Fill opacity % (the opacity used when filling the upper line to the lower line)
This indicator is unique because it can be used for all strategies and all trading styles , for example, day trading or long-term investing, really anything if used correctly. The reason it can be used in so many instances is a result of the detailed and in-depth settings tab that allows for complete customization. This allows the indicator to be used and to be useful in various situations and allows you to dominate the market. Integrated alerts also enhance your efficiency while using this indicator because you can choose to be notified at the crossing of any of the Bollinger Bands.
The technical part of this indicator plots the selected amount of Bollinger Bands using custom-built specified Bollinger Bands accordingly. Then it uses the style settings and styles it as you selected.
[DS]Bitcoin BTC ETH and others cryptos==DESCRIPTION - English version
The purpose of this script is to show information on graph that can help your decision to buy and sell cryptos.
The script is indicated for Position Trade (Long Term - Holder) and Swing Trade (Medium term).
Position Trade it is recommended to use the Weekly (W) and Daily (D) charts, Swing trade to use the 4H and 2H charts.
It is not advisable to use this indicator with graphic time frame less than 2 hours because the noise levels of information are very high.
An alert function has been inserted in the indicator and to activate this function you will need configure it in the Tradingview.
This alert will indicate the likely points of entry and exit of the asset.
**DESCRIÇÃO - Versão em Português
A proposta deste script é mostrar no gráfico informações que possam auxiliar a sua decisão de compra e venda de cryptos.
Este script é indicado para negociação Position Trade (Longo Prazo - Holders) e Swing Trade (Médio prazo).
Para Position Trade (Holders) é indicado utilizar os gráficos Semanal (W) e Diário (D), para Swing trade utilizar os gráficos 4H e 2H.
Não é aconselhável utilizar este indicador com tempos gráficos menores que 2hs pois os níveis de ruídos nas informação são muito altos.
Foi inserido no indicador uma função de alerta e para ativar esta função, você precisará configurá-la no seu Tradingview.
Este alerta irá indicar os provaveis pontos de entrada e saída do ativo.
====================================================================================================
** English Version
====================================================================================================
█ SETUP applied to Indicator
The setup is based on the average 8, 21 and 56 of the weekly chart (taught on youtube channel: Augusto Backes)
Price above the average 8 on the weekly, indicates that the market is UP trend, below the average 8 on the weekly that the market is DOWN trend
RSI greater than 60% the market is UP trend
RSI greater than 40% and lower 60% the market is in ACCUMULATION
RSI less than 40% the market DOWN trend
The weekly average 8 is represented in GREEN (Upward Trend) and RED (Downward Trend).
The weekly average 21 is represented in LIGHT ORANGE
The weekly average 56 is represented in LIGHT PURPLE
The crossing of weekly averages 8 and 21 is represented with a GREEN (HIGH trend) and RED (LOW trend) cross - this signal is disabled on the graph but you can enable it by clicking on the graph setup
█ FUNCTION USE
(1) Average 8, 21 and 56 on Weekly - show the average 8, 21, 56 weekly on graphic (Average 8 in color red and green, 21 - light orange, 56 light purple)
(2) Crossing of averages 8 and 21 Weekly - is not active but you can activate
(3) Calculation of RSI
(4) barcolor() - mark the candles with the green color (High market) and red color (Dow market)
(5) alertcondition() - you can active this alert on Tadingview
█ BUY AND SELL POINTS - likely points
The indication of the BUY position is shown by a green arrow pointing upwards and the sell position by a red arrow pointing downwards. Buy and sell indications are obtained from the divergence in the market trend.
█ THANK TO
PineCoders for everything they do, all the tools and help they provide, and their involvement in making a better community. All PineCoders, Pine Pros and Pine Wizards, people who share their work and knowledge because of it and helping others, I am so happy and so grateful.
█ NOTE
This indicator is not a buy and sell recommendation, it indicates the most likely buy and sell points. Every purchase and sale decision is your responsibility
*****************************************************************************************************
** Versão em Português
*****************************************************************************************************
█ SETUP aplicado no Indicador
O setup está baseado na média 8, 21, e 56 do gráfico semanal
Preço acima da média 8 no semanal indica que o mercado esta em tendência de ALTA, abaixo da média 8 no semanal que o mercado está em tendência de BAIXA
RSI maior que 60% o mercado está em ALTA
RSI maior que 40% e menor 60% o mercado está em ACUMULAÇÃO
RSI menor que 40% o mercado está em BAIXA
A média 8 semanal está representadas nas cores VERDE (Tendência de Alta) e VERMELHA (Tendência de Baixa).
A média 21 semanal está representada na cor laranja claro
A média 56 semanal está representada na cor roxa claro
O cruzamento das médias 8 e 21 semanal esta representado com uma cruz VERDE (Tendência de ALTA) e VERMELHA (Tendência de BAIXA) - este sinal esta desativado no gráfico mas você pode ativá-lo clicando no setup do gráfico
█ FUNÇÕES UTILIZADAS
(1) Média 8, 21 e 56 no Semanal - mostra a média 8, 21, e 56 no gráfico
(2) Cruzamento das médias 8 e 21 Semanal - não está ativo mas você pode ativá-lo
(3) Cálculo do RSI
(4) barcolor() - marca a vela (Candle) com a cor verde (Mercado em Alta) e a cor vermelha (Mercado em Baixa)
(5) alertcondition () - você pode ativar o alerta no Tradingview
█ PONTOS DE COMPRA E VENDA - prováveis pontos
A indicação da posição de COMPRA é apresentada por uma seta na cor verde apontada para cima e a posição de VENDA por uma seta na cor vermelha apontada para baixo. As indicações de compra e venda são obtidas a partir da divergência na tendência do mercado.
█ OBRIGADO PARA
PineCoders por tudo o que fazem, todas as ferramentas e ajuda que fornecem, e seu envolvimento em fazer uma comunidade melhor. Todos os PineCoders, Pine Pros e Pine Wizards, pessoas que compartilham seu trabalho e conhecimento por causa dele e ajudando os outros, estou muito feliz e muito grato.
█ NOTA
Este indicador não é uma recomendação de compra e venda ele indica os pontos mais prováveis de compra e venda. Toda decisão de compra e venda é de sua responsabilidade

Supertrend with Chop SuppressionA Standard Supertrend indicator with Chop Suppression added to minimize bad entries when the market goes sideways. Chop Suppression will hide alerts/entry signals that otherwise would have been generated during sideway price action.
Recommend using this indicator with a secondary long-term trend indicator such as VWAP or 200 EMA . Trade with the long-term trend for higher success rates.
You can use either traditional fixed stop loss and profit taking or adjust the stop loss with the rising Supertrend line and exit when color of Supertrend changes.
Good luck!

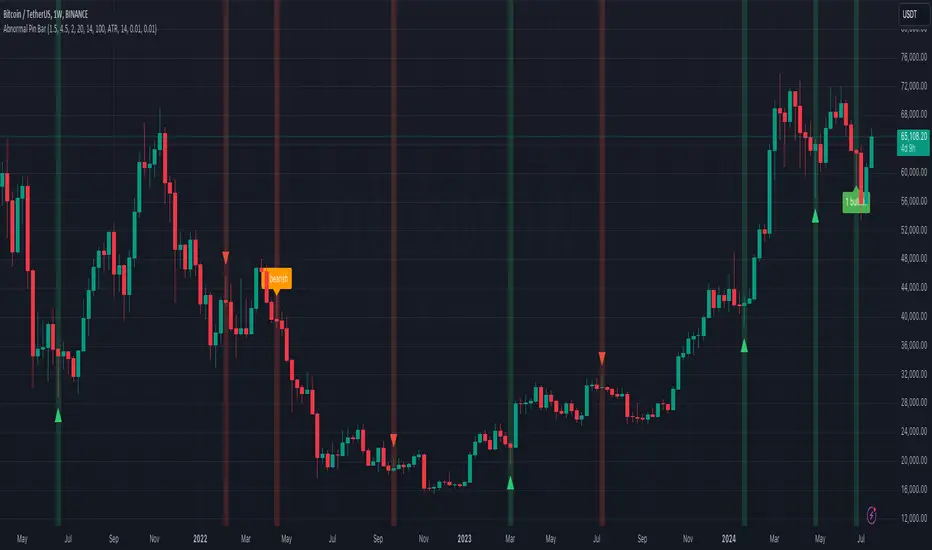
Abnormal Pin BarPin Bar is one of the most important candlestick patterns. Almost every time you see a pin bar, you can expect the price to turn in the opposite direction.
You should pay more attention to the abnormal ones among the pin bars. What I mean by abnormal pin bar is that the long leg is at least 3 times larger than the body.
With this indicator, you can set your own abnormal pin bar settings. The indicator will highlight abnormal pin bars according to the settings you specified.
The indicator uses the following three factors to indicate abnormal pin bar:
- Minimum body ratio in the pattern in percent
- Minimum ratio of the long shadow to the body
- Minimum ratio of the long shadow to the short shadow
Also, there is a volume strength check to confirm the pin bar. If the volume where the pin bar is formed is greater than the 20 volume average, it indicates that the pin bar is more important. Of course, confirming the pin bar with the volume is optional and you can disable it in settings if you wish.
You can use the highlights of this indicator as an entry signal if the pin bar appears at the trend key levels or in support or resistance zones.
Buy Dip Sell High by BahagHariThis indicator help to buy the Dip. But not just simply buy the dip and catch the falling knife.
We look for the break out of inside candle before we execute a trade.
Inside candles are those candles who did not break the previous high and previous low.
Instruction given is for buying the dip, kindly reverse the idea in selling high.
Rule #1: We do not buy the dip, instead we put a buy stop onto the high of the most recent red outside candle.
Rule #2: If a new downward outside candle appears, we move the buy stop to that new candle high.
Rule #3: If an inside candle appears, we move the buy stop back to the previous outside candle high.
A line keeps following the price action, it was drawn to easily spot the inside candles and set stop buy above(Long)/below(Short) the line.
Useful for more precise entry but should not be used solely. Need to be combined with other indicator.
Ultimate Buy/Sell IndicatorAn Indicator based on the William Alligator, helping to find suitable entry and exit points.

Forex Scalp Triggersthe triggers only work to tell you go back 5 candles on 5 min, take either lowest or highest plus 3 pips and make entry and go 3 pip over under trigger for stop loss. can take half profit at 1x and move stop to break even and go 1x more for take rest profit, or create a trailing stop loss on Take Profit level 2 and ride the trend.
1 Hour chart has to be over under the emas that are faned out nicely to move to 5 min chart to look for the signals if 1hr chart isnt over under the emas nicely then NO TRADE
ForexSignalTV helped create this strategy, just my first script so learning, want to take it to next level but kind of stuck for now. More knowledge coming...