Trade Time & Position Duration Monitor (Multi-Entry)Overview
Active Position Hold Timer is a specialized risk management tool designed to track the "psychological time cost" of your trades. Beyond just monitoring price, it focuses on the precise duration your position stays in profit or loss.
Key Features:
Real-time Duration Tracking: Automatically calculates total time in profit vs. loss.
Max Loss Streak: Records the longest continuous time in a losing state.
Multi-Entry Cost Averaging: Supports initial entry plus 2 scale-ins.
Dual Language Interface: Switch between English and Traditional Chinese.
Time-Based Alerts: Set custom alerts for total or consecutive duration.
Calculation Logic:
Baseline Calculation: Starts accumulating once entry time is reached.
Profit/Loss Detection: Compares Close Price to Average Cost on every bar.
Live Update: Uses timenow for second-by-second dashboard updates.
中文說明
本指標專為管理「心理時間成本」而設計。它不僅監控價格,更專注於記錄倉位處於盈虧狀態的精確時間,幫助交易者克服持倉時的心理壓力。
主要功能:
即時時長統計:自動計算總浮盈/浮虧時間,以及當前連續狀態的持續時間。
歷史最大浮虧時長:記錄該筆交易中,最長一次連續虧損的時間壓力。
多筆進場計算:支援初始進場加上兩次加倉,自動繪製動態成本線。
雙語切換:表格界面支援中/英文切換。
多維度警報:可針對總時間或連續時間設定警報,提醒您交易是否持有過久。
計算邏輯:
基準計時:當時間超過進場點後,根據圖表週期累加時長。
盈虧判定:每根 K 棒收盤時,自動比較收盤價與平均成本。
即時秒級更新:加入 **Live Timer** 邏輯,計算當前 K 棒已跳動的時間,確保儀表板數據每秒更新。
壓力追蹤:持續追蹤並記錄最長的連續虧損時長。
Cerca negli script per "entry"

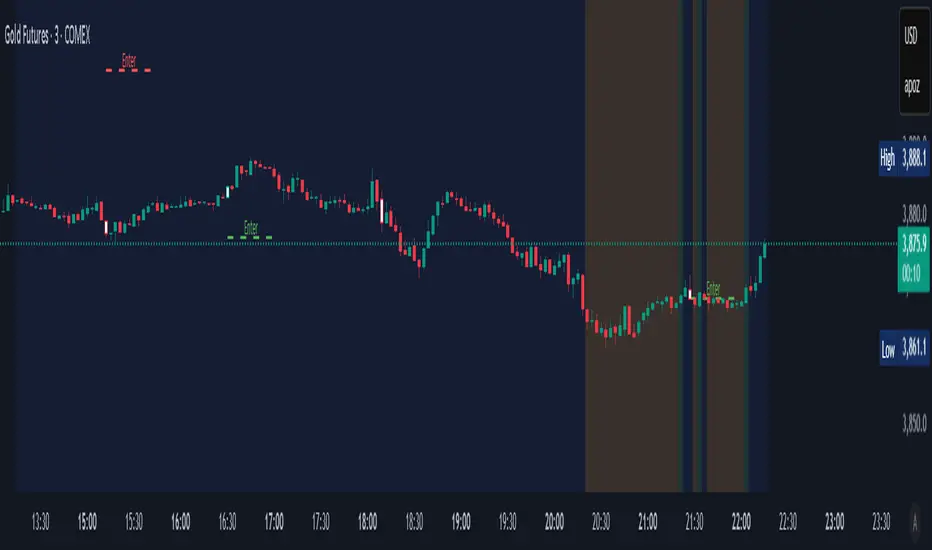
Liquidity Entry Triggers (4-Model System) | WarRoomXYZLiquidity Entry Triggers is an open-source, price-action-based analytical framework designed to highlight recurring institutional liquidity behaviors that appear across all liquid markets.
The script focuses on how and where liquidity is taken, rather than attempting to predict direction using oscillators or lagging indicators.
It is optimized for XAUUSD, FX pairs, indices, and crypto , particularly on 1m–15m timeframes where session behavior and liquidity reactions are most visible.
This tool is not a buy/sell signal generator .
It provides contextual entry zones based on structural liquidity logic, allowing traders to apply their own execution rules.
Core Philosophy
Markets move because of:
•Trapped traders
•Forced liquidations
•Session-based liquidity cycles
•Reactions at prior institutional participation zones
This script visualizes four repeatable entry triggers that emerge from those mechanisms.
🔹 1. Failed Breakout / Trapped Trader Model
When price breaks a clearly defined range high or low, breakout traders often enter expecting continuation.
If price fails to hold outside the range and closes back inside, those traders become trapped.
The script detects:
•Breaks beyond recent highs/lows
•Immediate rejection back into the range
•Structural failure of momentum
These conditions frequently lead to mean reversion or reversal moves as trapped traders exit and fuel movement in the opposite direction.
Markers are plotted at the point of failure to highlight potential trap zones.
🔹 2. Liquidation Flush Detection
Sharp impulsive candles with abnormally large wicks often represent liquidation cascades rather than healthy trend continuation.
The script identifies liquidation behavior by measuring:
•Wick-to-body imbalance
•Sudden expansion followed by rejection
•Temporary price inefficiencies
These flushes commonly occur near:
•Session highs/lows
•Range extremes
•Trend exhaustion points
Such events often lead to rebalance moves , where price partially or fully fills the wick.
🔹 3. Orderblock Reaction Zones
Orderblocks represent areas where heavy participation occurred before a strong displacement move.
The script highlights:
•Clean bullish and bearish orderblock structures
•Zones formed during consolidation prior to expansion
•Areas likely to be defended when revisited
Orderblocks with minimal noise and clean departure are prioritized, as they often reflect institutional positioning rather than retail activity.
These zones are intended as reaction areas , not automatic entry signals.
🔹 4. London Session Liquidity Sweep Model
The London session frequently establishes the initial daily high or low.
Later in the session or during New York, price often:
•Sweeps internal liquidity around that level
•Rejects after the sweep
•Continues with the higher-timeframe bias
The script monitors London session behavior and marks:
•Liquidity runs above/below London highs and lows
•Rejections back inside the prior structure
This model is especially effective when combined with broader daily context.
🔹4. How the Components Work Together
The framework is designed as a context stack , not a checklist of signals:
Liquidity Event → Location → Timing → Trader Execution
Each model reinforces the others:
•Failed breakouts often occur after liquidity sweeps
•Liquidation wicks frequently form near orderblocks
•London sweeps often trigger failed momentum moves
•Confluence increases probability, not certainty
🔹 Practical Usage Guide
✔ Identify context
Determine whether price is approaching a range extreme, session level, or prior participation zone.
✔ Wait for a liquidity event
Look for a sweep, failed breakout, or liquidation wick.
✔ Observe reaction
Rejection, displacement, or reclaim behavior provides confirmation.
✔ Execute manually
Stops are commonly placed beyond the liquidity extreme.
Targets are typically internal liquidity, prior highs/lows, or imbalance zones.
The indicator does not manage trades or enforce rules.
Execution and risk management remain the trader’s responsibility.
🔹 5. Originality & Design Notes
This script does not replicate or bundle existing indicators.
It introduces:
•A multi-model liquidity entry framework
•Structural failed breakout detection
•Wick-based liquidation imbalance logic
•Session-aware liquidity sweep visualization
•A unified, minimal, non-lagging design
All concepts are based on observable market behavior and integrated into a single analytical tool.
🔹 6. Suitable Markets & Timeframes
Works best on:
•XAUUSD
•Major FX pairs
•Indices
•Liquid crypto markets
Recommended timeframes:
•1m
•5m
•15m
•30m
🔹7. Limitations & Notes
•This is an analytical framework , not a trading system
•All markings are confirmed at candle close (non-repainting)
•No open interest or order flow data is used
•Results depend on user interpretation and execution
•Best used alongside session bias and higher-timeframe structure
Disclaimer
This script is provided for educational and informational purposes only.
It does not constitute financial advice, investment advice, or a recommendation to buy or sell any instrument.
Trading involves risk, and losses can exceed initial deposits.
The author assumes no responsibility for trading decisions made using this tool.
Users are strongly encouraged to test this script in demo or simulation environments and to apply proper risk management, position sizing, and personal discretion at all times.
By using this script, you acknowledge and accept all associated risks.

Bassi MA Entry Helper MTF EMA , VWMA Swing , ADX , SMA200 , TPBassi MA Entry Helper is an advanced multi-timeframe confluence system designed to identify high-probability entries using trend, volume, market structure, and volatility filters.
It is built for traders who want cleaner signals, fewer false entries, and strong multi-confirmation setups.
Key Features
Multi-Timeframe EMA Crossovers – HTF signal engine
SMA200 Trend Filter – prevents counter-trend trades
VWMA Swing Confirmation – volume-validated micro-swings
ADX Filter – only trade when the trend has strength
Fractal Structure Mapping – identifies swing highs/lows
Retracement Filter – confirms pullbacks before entries
TP/SL Automation – ATR or percentage based
Clean Entry Labels – main & additional entry signals
Highly Customizable – mode, timeframe, filters, visuals
This script is ideal for:
Scalping • Intraday • Swing • Trend continuation • Volume-based setups • Multi-timeframe alignment
How It Works
Main Buy/Sell Signals
Triggered when:
✔ Fast EMA crosses Slow EMA (HTF)
✔ Price aligned with trend
✔ SMA200 filter valid
✔ VWMA confirmation (optional)
✔ ADX strong
✔ Retracement valid (optional)
Additional Buy/Sell Signals
Triggered when VWMA crosses Slow EMA during trend continuation.
TP/SL System
You can choose between:
%-based take-profit & stop-loss
ATR-based dynamic levels
Automatically projects clean visual levels on your chart.
Notes
This indicator does not repaint and is suitable for both real-time and historical analysis.
Always combine signals with proper risk management.
Initial Release – v1.0
Added multi-timeframe EMA engine
Added SMA200 trend filter
Added VWMA swing entries
Added ADX strength filter
Added retracement filter
Added fractal swing detection
Added TP/SL auto plotting
Added main & additional entry labels
Performance optimized

Dual MTF Confirmed Trend Strategy (5m Entry / 15m MACD & RSI) v1That is a detailed Dual Multi-Timeframe (MTF) Confirmed Trend Strategy written in Pine Script for TradingView. The core idea of this strategy is to only take entry signals on a faster timeframe (5-minute) when the trend is strongly confirmed on a slower, higher timeframe (15-minute). This aims to reduce false signals and trade in the direction of the dominant trend. Here is an explanation of how the strategy works, broken down by section:
1. 5-Minute Entry Filters 🚀This section calculates several indicators on the current 5-minute chart to identify potential trade setups. A position is only considered if all 5-minute conditions align.
Supertrend: A trend-following indicator based on Average True Range (ATR).
Long Condition: The closing price must be above the Supertrend line.
Short Condition: The closing price must be below the Supertrend line.
Gann Hi-Lo (GHL): A trend indicator using Simple Moving Averages (SMA) of the high and low prices. GHL Line: Switches between the SMA of the Highs and the SMA of the Lows based on price action.
Long Condition: The closing price must be above the GHL line.
Short Condition: The closing price must be below the GHL line.
Exponential Moving Averages (EMAs): It uses a 50-period EMA and a 100-period EMA to confirm the short-term trend direction.
Long Condition: The closing price must be above both the 50 EMA and the 100 EMA.
Short Condition: The closing price must be below both the 50 EMA and the 100 EMA.
2. 15-Minute MTF Confirmation Filters ⏳This is the crucial step where the strategy verifies the trend on the slower, 15-minute timeframe using the request security function. This step acts as a gatekeeper to ensure the 5-minute trade aligns with the larger trend.
MACD Histogram (12, 26, 9): The difference between the MACD Line and the Signal Line.
Long Confirmation: The 15m MACD Histogram must be greater than 0 (MACD line is above the Signal line, indicating bullish momentum).
Short Confirmation: The 15m MACD Histogram must be less than 0 (MACD line is below the Signal line, indicating bearish momentum).
RSI (Relative Strength Index) (14): A momentum oscillator. The 50 level is often used to determine the general market trend.
Long Confirmation: The 15m RSI must be greater than 50 (indicating stronger bullish momentum).
Short Confirmation: The 15m RSI must be less than 50 (indicating stronger bearish momentum).
The Total 15m Confirmation is only true if both the MACD and the RSI confirmation signals align.
3. Trade Orders (Entry Logic) ⚖️
The strategy only executes a trade when the 5-minute entry conditions are met AND the 15-minute confirmation conditions are met.
Final Long Condition:
5m Conditions (Supertrend, GHL, EMA alignment) AND
15m Confirmation (MACD Hist > 0 AND RSI > 50)
Final Short Condition:
5m Conditions (Supertrend, GHL, EMA alignment) AND
15m Confirmation (MACD Hist < 0 AND RSI < 50)
When a trade signal is generated, the strategy:
Closes any opposite position (e.g., closes a "Short" trade if a "Long" signal appears).
Enters the new position (e.g., enters a "Long" trade).
This is designed as a reversal strategy where a new entry automatically closes the previous opposing trade.
In Summary
The strategy operates on a principle of Trend Alignment:
5-Minute Chart: Is used for Signal Timing (when exactly to enter the market).
15-Minute Chart: Is used for Trend Validation (is the overall market momentum supporting the signal?).
It's an attempt to capture short-term moves (5m signals) that are backed by strong medium-term momentum (15m confirmation), thereby aiming for higher probability trades.
This is not investment advice; it is recommended to perform optimization and backtesting for the assets intended for implementation.

PLANBXPRESS PSYCHOLOGICAL LEVEL ENTRY MODELThis Indicator merges multiple professional trading concepts into one visual tool — helping traders identify momentum shifts, entry zones, and daily trading plans with volume confirmation.
It automatically detects trend direction, generates dynamic take-profit & stop-loss levels, and overlays key daily reference points such as VWAP, pivot, support, and resistance zones based on ATR and trend context.
⚙️ Main Components
1️⃣ Signal System
Detects trend bias using SMA-based logic.
Generates entry price, TP1–TP3, and SL dynamically from recent impulse ranges.
Updates signals automatically when trend bias changes or previous targets are hit.
Visual levels are drawn directly on the chart.
2️⃣ Volume Analysis
Compares current volume against a moving average (SMA).
Classifies volume as:
🟢 Strong (above 1.5× average)
🟡 Average
🔴 Weak (below 0.8× average)
Displays the current volume strength and trend bias in an on-chart table.
3️⃣ Auto Day Plan
Uses multi-timeframe ATR calculations to define:
Support / Resistance zones
Pivot & Balance areas
Daily VWAP
Auto Targets (ATR-based expansion levels)
Adapts automatically to selected base timeframe (1H, 4H, or Daily).
4️⃣ Trend Context
Dual EMA system (50 & 200) to confirm bullish/bearish structure.
Aligns expected direction with VWAP & pivot location for context-aware bias.
🎯 What You Get on Chart
📈 Automatic LONG/SHORT signals
🎯 TP1, TP2, TP3, and SL levels
📊 Volume strength meter
🧭 VWAP, pivot, support/resistance & balance zones
🎨 Clean visual layout for intraday and swing traders
🧩 Inputs
Parameter Description
lenImpulse Impulse range length
smaLen SMA length for trend bias
levelRatio SL/TP ratio multiplier
volLen Volume SMA length
baseTF Base timeframe for zones/VWAP
atrMult1 / atrMult2 ATR multipliers for target levels
fwdBars Extension range for future projection
💡 How to Use
Add the script to your chart and choose your preferred timeframe.
Observe signal direction (📈 LONG / 📉 SHORT) and TP/SL levels.
Confirm entries when:
Trend aligns with VWAP direction, and
Volume category shows Strong or Average.
Use Auto Day Plan levels (pivot, balance, VWAP) as intraday reaction zones.

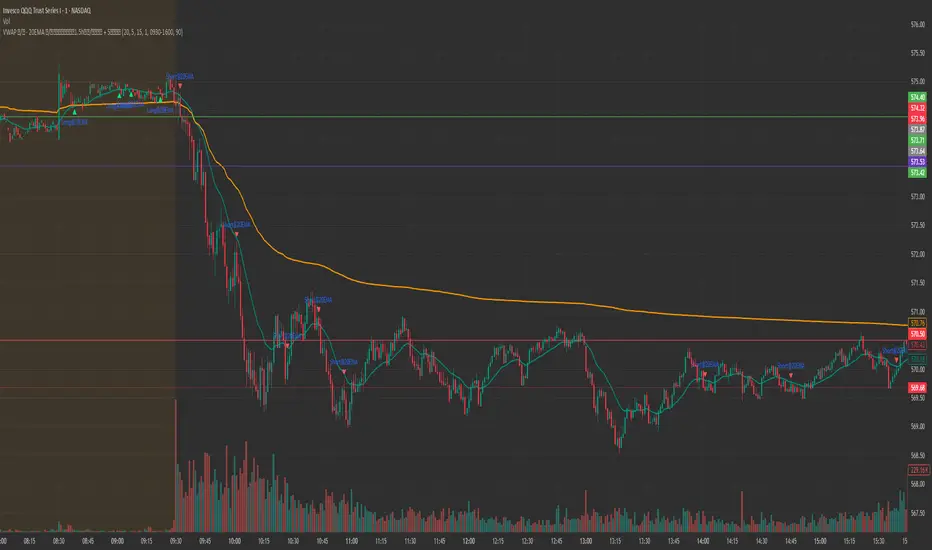
PLANBXPRESS ENTRYThe Combined Signal + Auto Day Plan + Volume indicator merges multiple professional trading concepts into one visual tool — helping traders identify momentum shifts, entry zones, and daily trading plans with volume confirmation.
It automatically detects trend direction, generates dynamic take-profit & stop-loss levels, and overlays key daily reference points such as VWAP, pivot, support, and resistance zones based on ATR and trend context.
⚙️ Main Components
1️⃣ Signal System
Detects trend bias using SMA-based logic.
Generates entry price, TP1–TP3, and SL dynamically from recent impulse ranges.
Updates signals automatically when trend bias changes or previous targets are hit.
Visual levels are drawn directly on the chart.
2️⃣ Volume Analysis
Compares current volume against a moving average (SMA).
Classifies volume as:
🟢 Strong (above 1.5× average)
🟡 Average
🔴 Weak (below 0.8× average)
Displays the current volume strength and trend bias in an on-chart table.
3️⃣ Auto Day Plan
Uses multi-timeframe ATR calculations to define:
Support / Resistance zones
Pivot & Balance areas
Daily VWAP
Auto Targets (ATR-based expansion levels)
Adapts automatically to selected base timeframe (1H, 4H, or Daily).
4️⃣ Trend Context
Dual EMA system (50 & 200) to confirm bullish/bearish structure.
Aligns expected direction with VWAP & pivot location for context-aware bias.
🎯 What You Get on Chart
📈 Automatic LONG/SHORT signals
🎯 TP1, TP2, TP3, and SL levels
📊 Volume strength meter
🧭 VWAP, pivot, support/resistance & balance zones
🎨 Clean visual layout for intraday and swing traders
🧩 Inputs
Parameter Description
lenImpulse Impulse range length
smaLen SMA length for trend bias
levelRatio SL/TP ratio multiplier
volLen Volume SMA length
baseTF Base timeframe for zones/VWAP
atrMult1 / atrMult2 ATR multipliers for target levels
fwdBars Extension range for future projection
💡 How to Use
Add the script to your chart and choose your preferred timeframe.
Observe signal direction (📈 LONG / 📉 SHORT) and TP/SL levels.
Confirm entries when:
Trend aligns with VWAP direction, and
Volume category shows Strong or Average.
Use Auto Day Plan levels (pivot, balance, VWAP) as intraday reaction zones.

FDF — EMAs+VWAP with setup & entry (stable scale) - Final 9
21
vwap
entry system
90% candle
tend
This will help you find the perfect entry off the 9 and 21 using the vwap for confluence. We have a strick 90% candle or wick off the 21
We have wick on the entry side more than 30% of the candle

MACD with Smart Entry Signals & Trend Filter
This advanced MACD indicator combines traditional MACD analysis with intelligent entry signal detection and an optional EMA trend filter. It identifies high-probability entry points by analyzing histogram patterns, consolidation phases, and trend continuation setups.
### Key Features
**🎯 Smart Entry Detection**
- **Consolidation Breakouts**: Identifies exits from consolidation zones (weak bars) with strong momentum
- **Trend Reversals**: Detects potential trend changes after extended weak phases
- **Correction/Continuation Patterns**: Recognizes brief corrections within strong trends that offer continuation opportunities
**📊 Enhanced MACD Visualization**
- Color-coded histogram showing four distinct states:
- Strong Bullish (dark green): Rising histogram above zero
- Weak Bullish (light green): Falling histogram above zero
- Weak Bearish (light red): Rising histogram below zero
- Strong Bearish (dark red): Falling histogram below zero
**🔍 Multi-Layer Filtering System**
- **Candle Size Filter**: Eliminates signals during high volatility/large candle ranges
- **EMA Trend Filter**: Optional filter ensuring entries align with the dominant trend direction
- Visual markers for rejected signals (orange X for candle size, blue E for EMA trend)
**⚙️ Customizable Parameters**
- Adjustable MACD periods (default: 34/144/9)
- Configurable consolidation bar requirements
- Flexible correction pattern detection
- EMA trend filter with adjustable sensitivity
- Multiple alert types for all signal conditions
### How to Use
1. **Enable/disable filters** based on your trading style and market conditions
2. **Green triangles (L)**: Long entry signals when all conditions are met
3. **Red triangles (S)**: Short entry signals when all conditions are met
4. **Rejected signal markers**: Help you understand why certain setups were filtered out
5. **Background coloring**: Provides visual confirmation of signal zones and correction patterns
### Alert System
Comprehensive alerts for:
- Long and short entry signals
- Specific pattern types (consolidation, reversal, continuation)
- Rejected signals (helps refine strategy)
- Traditional MACD histogram crossovers
### Best Practices
- Use the EMA trend filter in trending markets to avoid counter-trend trades
- Adjust candle size filter based on your instrument's typical volatility
- Consider combining with support/resistance levels for confirmation
- Test different consolidation bar settings for your timeframe
### Parameters Summary
- Fast/Slow Length: MACD calculation periods
- Signal Smoothing: Signal line period
- Consolidation Bars: Minimum weak bars before breakout
- Max Candle Range: Filter for oversized candles
- EMA Period & Sensitivity: Trend filter configuration
---
*This indicator is designed for traders who want a systematic approach to identifying MACD-based entry opportunities with built-in risk management through filtering.*

FEI: Futures Entry Identifier📘 FEI: Futures Entry Identifier
FEI is a modular, futures-grade entry engine designed for precision trading across GC1!, MNQ1!, ES1!, and related contracts. It combines manual SVP structure, CHoCH detection, and Colby-style candle strength filters to identify high-probability long and short entries.
🔧 Features
• Manual SVP inputs (VAH, VAL, POC)
• Symbol-aware filters for micro vs standard contracts
• Multi-timeframe signal logic (3m, 5m, 10m, 15m, 30m)
• CHoCH detection with optional engulfing filter (default off)
• FRVP entry zone plotting after CHoCH confirmation
• Candle coloring on CHoCH trigger
• Session-aware logic (ETH default, optional RTH-only)
• Narratable visuals and audit-safe alerts
🧭 How to Use
1. Input VAH, VAL, and POC manually
2. Select signal timeframe (e.g. 3m or 5m)
3. Watch for CHoCH (white candle = structural shift)
4. Entry line plots at top/bottom of recent range
5. Long/short markers appear when SVP + candle strength align
6. Toggle RTH-only mode if needed
🌟 Why It’s Unique
FEI is built for traders who demand clarity, structure, and precision. Every signal is narratable, audit-safe, and resolution-aware—ideal for futures overlays and sniper-grade entries.
Ultimate Sniper Entry - Pivot PerfectionT2R📌 Description
The Ultimate Sniper Entry – Pivot Perfection is a precision trading tool designed to identify high-probability pivot points and generate early buy/sell entries with strong confirmation. By combining pivot detection, volume spikes, momentum filters (RSI), candle patterns, and EMA trend alignment, this system helps traders capture market reversals and trend continuation setups with improved accuracy.
It offers:
Smart Pivot Detection with adjustable sensitivity.
Multi-layer Confirmation: volume, momentum, candle structure, and EMA trend filter.
Non-Repainting Signals: arrows plotted only after pivot confirmation.
Visual Aids: buy/sell arrows, optional pivot markers, background trend shading.
Alerts: instant notifications for sniper buy/sell entries.
Info Panel: quick reference guide directly on chart.
Ideal for traders who want structured, rules-based entries while avoiding false signals, the Ultimate Sniper Entry system adapts to multiple markets and timeframes.

Multipower Entry SecretMultipower Entry Secret indicator is designed to be the ultimate trading companion for traders of all skill levels—especially those who struggle with decision-making due to unclear or overwhelming signals. Unlike conventional trading systems cluttered with too many lines and confusing alerts, this indicator provides a clear, adaptive, and actionable guide for market entries and exits.
Key Points:
Clear Buy/Sell/Wait Signals:
The script dynamically analyzes price action, candle patterns, volume, trend strength, and higher time frame context. This means it gives you “Buy,” “Sell,” or “Wait” signals based on real, meaningful market information—filtering out the noise and weak trades.
Multi-Timeframe Adaptive Analysis:
It synchronizes signals between higher and current timeframes, ensuring you get the most reliable direction—reducing the risk of getting caught in fake moves or sudden reversals.
Automatic Support, Resistance & Liquidity Zones:
Key levels like support, resistance, and liquidity zones are auto-detected and displayed directly on the chart, helping you make precise decisions without manual drawing.
Real-Time Dashboard:
All relevant information, such as trend strength, market intent, volume sentiment, and the reason behind each signal, is neatly summarized in a dashboard—making monitoring effortless and intuitive.
Customizable & Beginner-Friendly:
Whether you’re a newcomer wanting straightforward guidance or a professional needing advanced customization, the indicator offers flexible options to adjust analysis depth, timeframes, sensitivity, and more.
Visual & Clutter-Free:
The design ensures that your chart remains clean and readable, showing only the most important information. This minimizes mental overload and allows for instant decision-making.
Who Will Benefit?
Beginners who want to learn trading logic, avoid common traps, and see the exact reason behind every signal.
Advanced traders who require adaptive multi-timeframe analytics, fast execution, and stress-free monitoring.
Anyone who wants to save screen time, reduce analysis paralysis, and have more confidence in every trade they take.
1. No Indicator Clutter
Intent:
Many traders get confused by charts filled with too many indicators and signals. This often leads to hesitation, missed trades, or taking random, risky trades.
In this Indicator:
You get a clean and clutter-free chart. Only the most important buy/sell/wait signals and relevant support/resistance/liquidity levels are shown. These update automatically, removing the “overload” and keeping your focus sharp, so your decision-making is faster and stress-free.
2. Exact Entry Guide
Intent:
Traders often struggle with entry timing, leading to FOMO (fear of missing out) or getting trapped in sudden market reversals.
In this Indicator:
The system uses powerful adaptive logic to filter out weak signals and only highlight the strongest market moves. This not only prevents you from entering late or on noise, but also helps avoid losses from false breakouts or whipsaws. You get actionable suggestions—when to enter, when to hold back—so your entries are high-conviction and disciplined.
3. HTF+LTF Logic: Multitimeframe Sync Analysis
Intent:
Most losing trades happen when you act only on the short-term chart, ignoring the bigger market trend.
In this Indicator:
Signals are based on both the current chart timeframe (LTF) and a higher (HTF, like hourly/daily) timeframe. The indicator synchronizes trend direction, momentum, and structure across both levels, quickly adapting to show you when both are aligned. This filtering results in “only trade with the bigger trend”—dramatically increasing your win rate and market confidence.
4. Auto Support/Resistance & Liquidity Zones
Intent:
Drawing support/resistance and liquidity zones manually is time-consuming and error-prone, especially for beginners.
In this Indicator:
The system automatically identifies and plots the most crucial support/resistance levels and liquidity zones on your chart. This is based on adaptive, real-time price and volume analysis. These zones highlight where major institutional activity, trap setups, or real breakouts/reversals are most likely, removing guesswork and giving you a clear reference for entries, exits, and stop placements.
5. Clear Action/Direction
Intent:
Traders need certainty—what does the market want right now? Most indicators are vague.
In this Indicator:
Your dashboard always displays in plain words (like “BUY”, “SELL”, or “WAIT”) what action makes sense in the current market phase. Whether it’s a bull trap, volume spike, wick reversal, or exhaustion—it’s interpreted and explained clearly. No more confusion—just direct, real-time advice.
6. For Everyone (Beginner to Pro)
Intent:
Most advanced indicators are overwhelming for new traders; simple ones lack depth for professionals.
In this Indicator:
It is simple enough for a beginner—just add it to the chart and instantly see what action to consider. At the same time, it includes advanced adaptive analysis, multi-timeframe logic, and customizable settings so professional traders can fine-tune it for their strategies.
7. Ideal Usage and User Benefits
Instant Decision Support:
Whenever you’re unsure about a trade, just look at the indicator’s suggestion for clarity.
Entry Learning:
Beginners get real-time “practice” by not only seeing signals, but also the reason behind them—improving your chart reading and market understanding.
Screen Time & Stress Reduction:
Clear, relevant information only; no noise, less fatigue, faster decisions.
Makes Trading Confident & Simple:
The smart dashboard splits actionable levels (HTF, LTF, action) so you never miss a move, avoid traps, and stay aligned with high-probability trades.
8. Advanced Input Settings (Smart Customization)
Explained with Examples:
Enable Wick Analysis:
Finds candles with strong upper/lower wicks (signs of rejection/buying/selling force), alerting you to hidden reversals and protecting from FOMO entries.
Enable Absorption:
Detects when heavy order flow from one side is “absorbed” by the other (shows where institutional buyers/sellers are likely active, helps spot fake breakouts).
Enable Unusual Breakout:
Highlights real breakouts—large volatility plus high volume—so you catch genuine moves and avoid random spikes.
Enable Range/Expansion:
Smartly flags sudden range expansions—when the market goes from quiet to volatile—so you can act at the start of real trends.
Trend Bar Lookback:
Adjusts how many bars/candles are used in trend calculations. Short (fast trades, more signals), long (more reliability, fewer whipsaws).
Bull/Bear Bars for Strong Trend Min:
Sets how many candles in a row must support a trend before calling it “strong”—prevents flipping signals, keeps you disciplined.
Volume MA Length:
Lets you adjust how many bars back volume is averaged—fine-tune for your asset and trading style for best volume signals.
Swing Lookback Bars:
Set how many bars to use for swing high/low detection—short (quick swing levels), long (stronger support/resistance).
HTF (Bias Window):
Decide which higher timeframe the indicator should use for big-picture market mood. Adjustable for any style (scalp, swing, position).
Adaptive Lookback (HTF):
Choose how much HTF history is used for detecting major extremes/zones. Quick adjust for more/less sensitivity.
Show Support/Resistance, Liquidity Zones, Trendlines:
Toggle them on/off instantly per your needs—keeps your chart relevant and tailored.
9. Live Dashboard Sections Explained
Intent HTF:
Shows if the bigger timeframe currently has a Bullish, Bearish, or Neutral (“Chop”) intent, based on strict volume/price body calculations. Instant clarity—no more guessing on trend bias.
HTF Bias:
Clear message about which side (buy/sell/sideways) controls the market on the higher timeframe, so you always trade with the “big money.”
Chart Action:
The central action for the current bar—Whether to Buy, Sell, or Wait—calculated from all indicator logic, not just one rule.
TrendScore Long/Short:
See how many candles in your chosen window were bullish or bearish, at a glance. Instantly gauge market momentum.
Reason (WHY):
Every time a signal appears, the “reason” cell tells you the primary logic (breakout, wick, strong trend, etc.) behind it. Full transparency and learning—never trade blindly.
Strong Trend:
Shows if the market is currently in a powerful trend or not—helping you avoid choppy, risky entries.
HTF Vol/Body:
Displays current higher timeframe volume and candle body %—helping spot when big players are active for higher probability trades.
Volume Sentiment:
A real-time analysis of market psychology (strong bullish/bearish, neutral)—making your decision-making much more confident.
10. Smart and User-Friendly Design
Multi-timeframe Adaptive:
All calculations can now be drawn from your choice of higher or current timeframe, ensuring signals are filtered by larger market context.
Flexible Table Position:
You can set the live dashboard/summary anywhere on the chart for best visibility.
Refined Zone Visualization:
Liquidity and order blocks are visually highlighted, auto-tuning for your settings and always cleaning up to stay clutter-free.
Multi-Lingual & Beginner Accessible:
With Hindi and simple English support, descriptions and settings are accessible for a wide audience—anyone can start using powerful trading logic with zero language barrier.
Efficient Labels & Clear Reasoning:
Signal labels and reasons are shown/removed dynamically so your chart stays informative, not messy.
Every detail of this indicator is designed to make trading both simpler and smarter—helping you avoid the common pitfalls, learn real price action, stay in sync with the market’s true mood, and act with discipline for higher consistency and confidence.
This indicator makes professional-grade market analysis accessible to everyone. It’s your trusted assistant for making smarter, faster, and more profitable trading decisions—providing not just signals, but also the “why” behind every action. With auto-adaptive logic, clear visuals, and strong focus on real trading needs, it lets you focus on capturing the moves that matter—every single time.

ICT Sweep + FVG Entry (v6) • Antoine📌 ICT Sweep + FVG Entry (Antoine)
This indicator is designed for price action traders who follow ICT concepts and want a mechanical tool to spot liquidity sweeps, fair value gaps (FVGs), and precise entry signals.
🔎 Key Features
Liquidity Pools (HTF)
• Automatically plots recent swing highs/lows from a higher timeframe (5m/15m).
• These act as Buy Side Liquidity (BSL) and Sell Side Liquidity (SSL) levels where stop orders accumulate.
Sweep Detection
• Identifies when price breaks a pool (BSL/SSL) but closes back inside → a classic liquidity grab.
• Plots a triangle on the chart when a sweep is confirmed.
Fair Value Gap (FVG) Highlighting
• Detects bullish and bearish FVGs on the execution timeframe (ideal for 1m).
• Option to display active FVG zones with shaded boxes.
Entry Signals
• A signal (cross) appears when:
A liquidity sweep occurs.
An FVG forms in the direction of the rejection.
Price retests the FVG (entry at the 50% mid-level or edge).
Alerts Ready
• Get alerted for sweeps (bullish/bearish) and for entry confirmations (long/short FVG retests).
🎯 How to Use
Choose your HTF (5m or 15m) → The indicator maps major liquidity pools.
Drop to LTF (1m) → Wait for a sweep signal at one of the pools.
Confirm with FVG → If an FVG appears in the sweep’s direction, the indicator waits for a retest.
Entry → Enter on the retest of the FVG (edge or 50%).
Risk Management
Stop loss: just beyond the sweep’s wick.
Target: opposite liquidity pool.
Minimum recommended R:R: 1:2.
✅ Why this helps
This tool makes it easier to trade ICT-style setups without missing opportunities:
No need to manually draw every swing high/low.
Automatic FVG detection saves time.
Clear sweep + FVG + retest logic keeps your entries mechanical and disciplined.
⚠️ Disclaimer: This script is for educational purposes only. It does not guarantee profits. Always use proper risk management.

EMA20 Entry with Lei Teacher Strategy_Trend_Follow_RuleEMA20 Entry with Lei Teacher Strategy Trend Follow Entry Alert
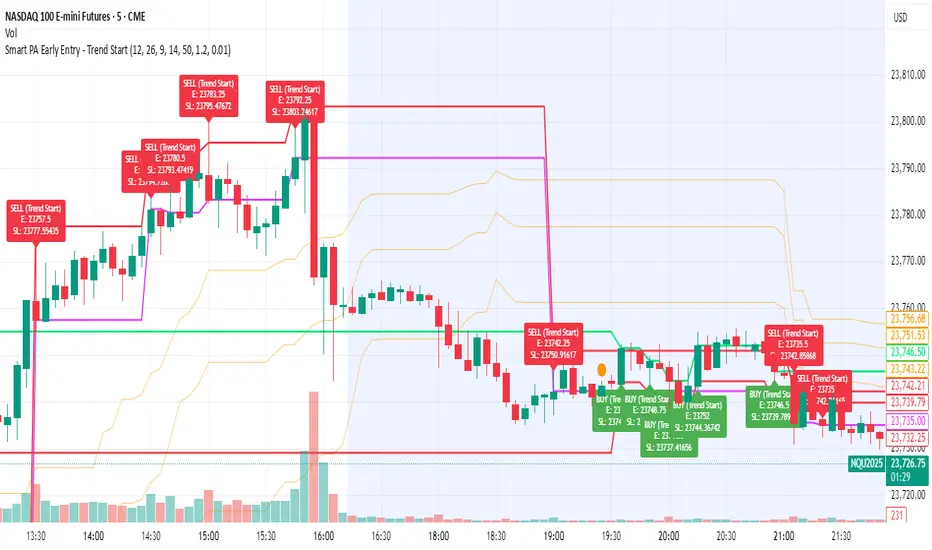
Smart PA Early Entry - Trend StartSmart PA Early Entry Indicator (MACD + FVG + Fibonacci)
This TradingView indicator helps traders spot potential trend reversals early by combining multiple technical tools:
MACD Momentum – Identifies the direction of the trend.
Volume Filter – Confirms strong market participation for reliable signals.
Fair Value Gaps (FVG) – Highlights areas where price may reverse or continue strongly.
Fibonacci Retracement Levels – Pinpoints key support/resistance zones for early entries.
ATR-based Stop Loss – Automatically calculates a dynamic stop-loss based on market volatility.
Trend Start Signals – Alerts only appear on the first candle of a potential trend change to avoid repeated signals.
Visual Labels & Plots – Shows entry price, stop-loss, FVG zones, and Fibonacci levels for easy chart reading.
Ideal for: Intraday and swing traders looking for high-probability entries near trend reversals with clear risk management.
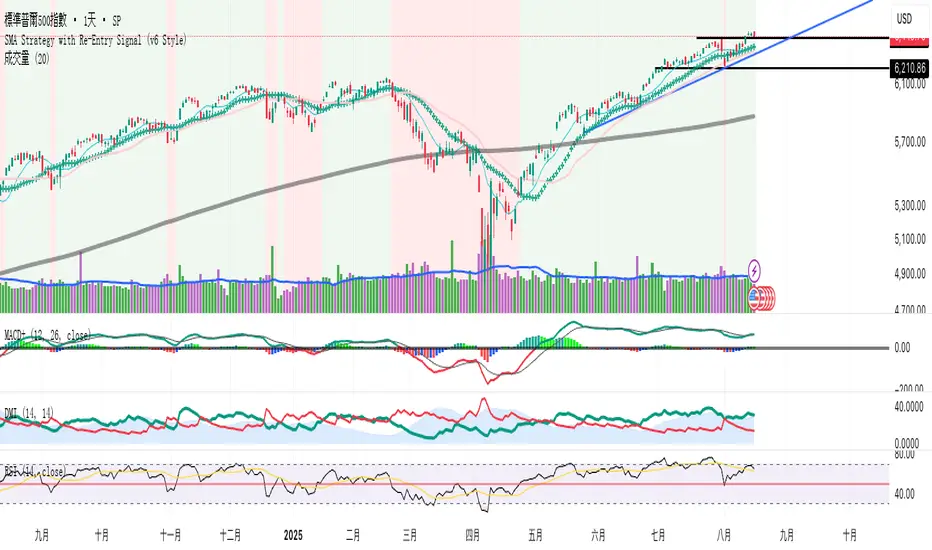
SMA Strategy with Re-Entry Signal (v6 Style)*SMA Trend Strategy with Re-Entry Signal (v6 Edition)*
This indicator is based on a classic moving average trend-following system, enhanced with re-entry signals designed for medium to short-term traders.
---
### 📈 Key Features:
1. *Trend Detection Logic:*
- The 30-period SMA (SMA30) is used as the trend filter.
- When the closing price is above the SMA30, the market is considered to be in an uptrend.
2. *Re-Entry Signal:*
- While in an uptrend, if the closing price crosses above the SMA20, a re-entry (add position) signal is triggered.
- These signals are shown with green upward arrows below the bars.
3. *Background Highlighting:*
- Green background: indicates an uptrend.
- Red background: indicates a break below SMA30, suggesting weakening momentum.
4. *Multi-SMA Visualization:*
- Five SMAs are displayed: SMA10, SMA20, SMA30, SMA60, and SMA250.
- This helps visualize both short-term and long-term trend structures.
---
### 🔍 Usage Tips:
- Use this script directly on your main chart to monitor trend direction and wait for re-entry signals during pullbacks.
- Combine with other tools like volume, price action, or candlestick patterns to confirm entries.
---
### ⚠️ Disclaimer:
- This indicator is for educational and informational purposes only. It does not constitute financial advice or a buy/sell signal.
- Avoid relying solely on this script for trading decisions. Always manage your own risk.
---
👨💻 *Developer’s Note:*
This script is 100% manually developed, not copied or auto-generated. It is an original implementation based on my personal trading logic. Suggestions and feedback are welcome!
Scalper SMA-RSI-MACD – Entry/Exit Signals v2Scalper SMA–RSI–MACD Strategy (Intraday) – Indicator Version
This is an intraday scalping and short-term trading tool designed for manual trading. It provides entry and exit signals based on a combination of trend, momentum, and volatility-based risk management.
Core Components
Trend Filter (Optional)
Uses an EMA (default 200) and an SMA ribbon (5/8/13) to identify the primary trend direction.
Only allows long trades in uptrend and short trades in downtrend (can be turned off for more signals).
Entry Conditions
RSI Pullback: Detects oversold (for long) or overbought (for short) conditions based on a short RSI (default length = 4).
MACD Momentum Turn: Detects bullish or bearish MACD crossovers or momentum shifts.
Both conditions must occur within a specified lookback period (default = last 3 bars).
Stop Loss (SL) Placement
SL is placed at a fixed multiple of the ATR (Average True Range) from the entry price (default = 1.5 × ATR).
Adjusting the multiplier changes how far the SL is placed.
Take Profit (TP) Levels
Two targets: TP1 and TP2, each based on R-multiples of the SL distance.
Default: TP1 = 1 × risk (1:1 R/R), TP2 = 2 × risk (1:2 R/R).
Exit Modes (Selectable)
TP1 or SL
TP2 or SL
Opposite signal (exit when the opposite entry condition appears)
Session Filter (Optional)
Can restrict trading signals to specific market hours (default off for more signals).
Signals and Alerts
Displays LONG and SHORT arrows for entries.
Plots SL and TP levels on the chart.
Marks exits as TP, SL, or opposite signal.
Built-in alertcondition() allows creating TradingView alerts for all entry and exit events.
Typical Usage
Works best on 1-minute to 5-minute charts for scalping; can be adapted to higher timeframes for swing trading.
Ideal for manual execution — the trader sees the signal, checks market conditions, and decides whether to enter.
Can be tuned for more or fewer signals by adjusting RSI thresholds, MACD lookback, and trend filter settings.

Multi-Signal Entry V1Multi‑Signal Entry v1 – (clean, versioned for tracking changes)
SQQQ Entry Scanner – (specific to your use case)
TQQQ/SQQQ Buy Alert – (clear that it’s for both sides if you add short logic later)
VWAP RSI ATR Vol Spike – (great if you want a technical name showing what’s used)
Fast Entry Signal Bot – (if you want a simple, trading-friendly name)

Liquidity Grab Entry Signals [Daily Enhanced]Liquidity Grab Entry Signals is a powerful tool designed to detect intraday reversal opportunities around daily high/low liquidity zones.
Core features: – Plots current daily high/low levels
– Identifies price interaction with these key zones
– Confirms rejection via strong engulfing candles
– Plots real-time long/short entry signals directly on chart
– Includes alerts for both long and short setups
This script is ideal for scalpers and intraday traders looking to exploit stop hunts, liquidity sweeps, and false breakouts.
Optimized for instruments like US30, NAS100, Gold, BTC and more.
Customize the sensitivity buffer to suit your asset and timeframe.
Use this in combination with VWAP, FVG or Smart Money concepts for enhanced confirmation.
---
Built for: 1s–15m charts
Includes: Alerts + Custom Settings
Type: Non-repainting
Trade with clarity around the most manipulated price levels of the day.

Ayman Entry Signal – Ultimate PRO (Scalping Gold Settings)1. Overview
This indicator is a professional gold scalping tool built for TradingView using Pine Script v6.
It combines multiple price action and technical filters to generate high-probability Buy/Sell signals with built-in trade management features (TP1, TP2, SL, Break Even, Partial Close, Stats tracking).
It is optimized for XAUUSD but can be applied to other assets with proper setting adjustments.
2. Key Features
Multi-Condition Trade Signals – EMA trend, Break of Structure, Order Blocks, FVG, Liquidity Sweeps, Pin Bars, Higher Timeframe confirmation, Trend Cloud, SMA Cross, and ADX.
Full Trade Management – Auto-calculates lot size, SL, TP1, TP2, Break Even, Partial Close.
Dynamic Chart Drawing – Entry lines, SL/TP lines, trade boxes, and real-time PnL.
Statistics Panel – Tracks wins, losses, breakeven trades, and total PnL over selected dates.
Customizable Filters – All filters can be turned ON/OFF to match your strategy.
3. Main Inputs & Settings
Account Settings
Capital ($) – Total trading capital.
Risk Percentage (%) – Risk per trade.
TP to SL Ratio – Risk-to-reward ratio.
Value Per Point ($) – Value per pip/point for lot size calculation.
SL Buffer – Extra points added to SL to avoid stop hunts.
Take Profit Settings
TP1 % of Full Target – Fraction of TP1 compared to TP2.
Move SL to Entry after TP1? – Activates Break Even after TP1.
Break Even Buffer – Extra points when moving SL to BE.
Take Partial Close at TP1 – Option to close half at TP1.
Signal Filters
ATR Period – For SL/TP calculation buffer.
EMA Trend – Uses EMA 9/21 crossover for trend.
Break of Structure (BoS) – Requires structure break confirmation.
Order Block (OB) – Validates trades within OB zones.
Fair Value Gap (FVG) – Confirms trades inside FVGs.
Liquidity Sweep – Checks if liquidity zones are swept.
Pin Bar Confirmation – Uses candlestick patterns for extra confirmation.
Pin Bar Body Ratio – Controls strictness of Pin Bar filter.
Higher Timeframe Filters (HTF)
HTF EMA Confirmation – Confirms lower timeframe trades with higher timeframe trend.
HTF BoS – Confirms with higher timeframe structure break.
HTF Timeframe – Selects higher timeframe.
Advanced Filters
SuperTrend Filter – Confirms trades based on SuperTrend.
ADX Filter – Filters out low volatility periods.
SMA Cross Filter – Uses SMA 8/9 cross as filter.
Trend Cloud Filter – Uses EMA 50/200 as a cloud trend filter.
4. How It Works
Buy Signal Conditions
EMA 9 > EMA 21 (trend bullish)
Optional filters (BoS, OB, FVG, Liquidity Sweep, Pin Bar, HTF confirmations, ADX, SMA Cross, Trend Cloud) must pass if enabled.
When all active filters pass → Buy signal triggers.
Sell Signal Conditions
EMA 9 < EMA 21 (trend bearish)
Same filtering process but for bearish conditions.
When all active filters pass → Sell signal triggers.
5. Trade Execution & Management
When a signal triggers:
Lot size is auto-calculated based on risk % and SL distance.
SL is placed beyond recent swing high/low + ATR buffer.
TP1 and TP2 are calculated from the SL using the reward-to-risk ratio.
Break Even: If enabled, SL moves to entry price after TP1 is hit.
Partial Close: If enabled, half of the position closes at TP1.
Trade Exit: Full exit at TP2, SL hit, or partial close at TP1.
6. Chart Display
Entry Line – Shows entry price.
SL Line – Red dashed line at stop loss level.
TP1 Line – Lime dashed line for TP1.
TP2 Line – Green dashed line for TP2.
PnL Labels – Displays real-time profit/loss in $.
Trade Box – Visual area showing trade range.
Pin Bar Shapes – Optional, marks Pin Bars.
7. Statistics Panel
Stats Header – Shows “Stats”.
Total Trades
Wins
Losses
Breakeven Trades
Total PnL
Can be reset or filtered by date.
8. How to Use
Load the Indicator in TradingView.
Select Gold (XAUUSD) on your preferred scalping timeframe (1m, 5m, 15m).
Adjust settings:
Use default gold scalping settings for quick start.
Enable/disable filters according to your style.
Wait for a Buy/Sell alert.
Confirm visually that all desired conditions align.
Place trade with calculated lot size, SL, and TP levels shown on chart.
Let trade run – the indicator manages Break Even & Partial Close if enabled.
9. Recommended Timeframes
Scalping: 1m, 5m, 15m
Day Trading: 15m, 30m, 1H
Swing: 4H, Daily (adjust settings accordingly)

AymaN Entry Signal – With HTF + Pin Bar + Multi TP + BE + V1Ayman Entry Signal – Indicator Description
Overview
Ayman Entry Signal – With HTF + Pin Bar + Multi TP + BE + Stats Panel (V1)
This is a professional-grade Pine Script indicator designed for scalping and intraday trading, with full trade management, multi-confirmation logic, and advanced visualization. The tool is ideal for traders focused on XAUUSD (Gold), Forex, and other volatile instruments who seek both precision entries and structured exits with dynamic risk control.
Main Features
Advanced Entry Logic:
- EMA fast/slow crossovers (configurable)
- Optional conditions: Break of Structure (BoS), Order Block (OB), Fair Value Gap (FVG), Liquidity sweeps, Pin Bars
- HTF confirmation using EMA or BoS
- Real-time entry condition display
Trade Management:
- Dynamic calculation of Entry, SL (with ATR buffer), TP1, TP2
- Supports Partial Close and Break Even logic after TP1
- Visual PnL label (dynamic and color-coded)
Statistics Panel:
- Shows total trades, win/loss/breakeven count, cumulative PnL
- Filter by custom date or session
- Fully customizable panel appearance
Trade Visualization:
- Trade box includes all trade levels (Entry, SL, TP1, TP2)
- Visual display of trade conditions and PnL result
- Option to keep previous trades on chart
Alert System:
- Alerts for Buy and Sell entries
- Compatible with webhook automation systems like MT5/MT4
Customization & Inputs
- Capital & risk per trade
- Value per pip/point
- SL buffer (ATR-based)
- Manual EMA override
- Enable/disable: EMA, BoS, OB, FVG, Liquidity, Pin Bars
- HTF: timeframe + confirmation logic
- Trade box/labels visibility
- Full color customization
- PnL label position: top, center, or bottom
Recommended Use
- Ideal for Gold scalping (XAUUSD), also effective for Forex
- Best on 1m–15m charts; use HTF confirmation from 15m–4H
- Pairs well with semi-automated systems using alerts and webhooks
Disclaimer
Note: This is a non-executing indicator. It does not place trades but provides visual and statistical guidance for professional manual or semi-automated trading.

Futures Trade Entry Indicator (MTF)Work in Progress with the help of Claude. Not ready for active trading. Public for help improving. This will be a multi-timeframe futures trading indicator with supply/demand zones, Fair Value Gaps (FVGs), and sophisticated entry/exit logic.I've created a comprehensive Pine Script v6 indicator that matches all your specifications! Here's what the script includes:
## **Key Features Implemented:**
### **🔄 Multi-Timeframe Logic**
- **1H Chart Data**: Detects Supply Zones, Demand Zones, and Fair Value Gaps
- **Current Timeframe**: Monitors for re-entry and confirmation signals
### **📊 Zone Detection**
- **Supply Zones**: Identified using pivot highs with configurable strength
- **Demand Zones**: Identified using pivot lows with touch validation
- **Fair Value Gaps**: Both bullish and bearish FVGs detected automatically
- **Auto-Expiry**: Zones expire after 24 hours (configurable)
### **⚡ Entry Logic**
- **Dual Confirmation Required**:
- ✅ Engulfing candle pattern (bullish/bearish)
- ✅ Market structure shift (HH→LL or LL→HH)
- **Zone Re-entry**: Price must be within identified zones/FVGs
### **🎯 Probability System**
- **Smart Scoring**: Based on zone age, strength, and risk/reward ratio
- **Color-Coded**: Green (High), Yellow (Medium), Red (Low)
- **Real-time Calculation**: Updates with each potential entry
### **🎨 Visual Elements**
- **Colored Zones**: Supply (red), Demand (green), FVGs (blue/orange)
- **Entry Labels**: 🟩 LONG / 🟥 SHORT markers
- **Probability Labels**: Display confidence levels
- **Confirmation Shapes**: Triangle indicators for pattern completion
### **⚙️ Manual Controls**
All the requested toggles are available in the settings panel:
- Show/Hide Supply Zones
- Show/Hide Demand Zones
- Show/Hide FVGs
- Show/Hide Labels
- Show/Hide Probability
- Zone strength and expiry settings
- Custom colors for all elements
### **🔔 Alert System**
- Entry opportunity alerts
- Includes probability assessment
- Ticker symbol identification
## **Usage Instructions:**
1. **Apply to 15m chart** for active trading signals
2. **Configure settings** based on your preferences
3. **Set up alerts** for automated notifications
4. **Monitor probability levels** for trade quality assessment
The script automatically handles the complex multi-timeframe analysis while keeping the interface clean and user-friendly. All zones update dynamically and expire appropriately to avoid clutter.
Would you like me to adjust any specific parameters or add additional features?

Universal ATR Grid from Entry Price with AlertsUniversal ATR Grid from Entry Price with Alerts
This Pine Script v6 indicator creates a dynamic price grid based on a user-defined entry price and ATR for selected instruments (SOLUSDT, XRPUSDT, DOGEUSDT, PEPEUSDT, WIFUSDT).
Users can customize the entry price, ATR, number of levels (up to 5), and step multiplier per instrument.
The grid shows long (green) and short (red) levels around the entry price (gray), with labels offset right.
Lines extend from labels to the current bar, updating dynamically.
Alerts trigger on breakouts of long, short, and entry levels. Instrument names can be modified in the script.

5DMA Optional HMA Entry📈 5DMA Optional HMA Entry Signal – Precision-Based Momentum Trigger
Category: Trend-Following / Reversal Timing / Entry Optimization
🔍 Overview:
The 5DMA Optional HMA Entry indicator is a refined price-action entry tool built for traders who rely on clean trend alignment and precise timing. This script identifies breakout-style entry points when price gains upward momentum relative to short-term moving averages — specifically the 5-day Simple Moving Average (5DMA) and an optional Hull Moving Average (HMA).
Whether you're swing trading stocks, scalping ETFs like UVXY or VXX, or looking for pullback recovery entries, this tool helps time your long entries with clarity and flexibility.
⚙️ Core Logic:
Primary Condition (Always On):
🔹 Close must be above the 5DMA – ensuring upward short-term momentum is confirmed.
Optional Condition (Toggled by User):
🔹 Close above the HMA – adds slope-responsive trend filtering for smoother setups. Enable or disable via checkbox.
Bonus Entry Filter (Optional):
🔹 Green Candle Wick Breakout – optional pattern logic that detects bullish momentum when the high pierces above both MAs, with a green body.
Reset Mechanism:
🔁 Signal resets only after price closes back below all active MAs (5DMA and HMA if enabled), reducing noise and avoiding repeated signals during chop.
🧠 Why This Works:
This indicator captures the kind of setups that professional traders look for:
Momentum crossovers without chasing late.
Mean reversion snapbacks that align with fresh bullish moves.
Avoids premature entries by requiring clear structure above moving averages.
Optional HMA filter allows adaptability: turn it off during choppy markets or range conditions, and on during trending environments.
🔔 Features:
✅ Adjustable HMA Length
✅ Enable/Disable HMA Filter
✅ Optional Green Wick Breakout Detection
✅ Visual “Buy” label plotted below qualifying bars
✅ Real-time Alert Conditions for automated trading or manual alerts
🎯 Use Cases:
VIX-based ETFs (e.g., UVXY, VXX): Catch early breakouts aligned with volatility spikes.
Growth Stocks: Time pullback entries during bullish runs.
Futures/Indices: Combine with macro levels for intraday scalps or swing setups.
Overlay on Trend Filters: Combine with RSI, MACD, or VWAP for confirmation.
🛠️ Recommended Settings:
For smooth setups in volatile names, use:
HMA Length: 20
Keep green wick filter ON
For fast momentum trades, disable the HMA filter to act on 5DMA alone.
⭐ Final Thoughts:
This script is built to serve both systematic traders and discretionary scalpers who want actionable signals without noise or lag. The toggleable HMA feature lets you adjust sensitivity depending on market conditions — a key edge in adapting to volatility cycles.
Perfect for those who value clean, non-repainting entries rooted in logical structure.
