Boom HunterEvery "boom" begins with a pullback... This indicator will help traders find bottoms and perfect entries into a pump. It combines two indicators, Dr. John Ehlers Early Onset Trend (EOT) and the infamous Stochastic RSI. The indicator features a built in dump and dip detector which usually picks up signals a few candles before it happens. The blue wave (EOT) shows trend, when waves travel up so does the price. Likewise for the opposite. Low points are revealed when EOT bottoms out and flat lines. Traders can then use the Stochastic RSI crossover to enter a trade. As the EOT lines get closer together there is more movement in price action, so as they get wider traders can expect sideways action. This indicator works on all timeframes but has had excellent results on hourly chart.
Entry zones are marked with a green dot at top of indicator. This signals a bottom is being formed and traders should look for an entry.
Exit points are marked with a red dot at top of indicator. This signals a peak and great time to exit.
Dips and dumps are indicated in red at bottom of indicator.
Cerca negli script per "entry"

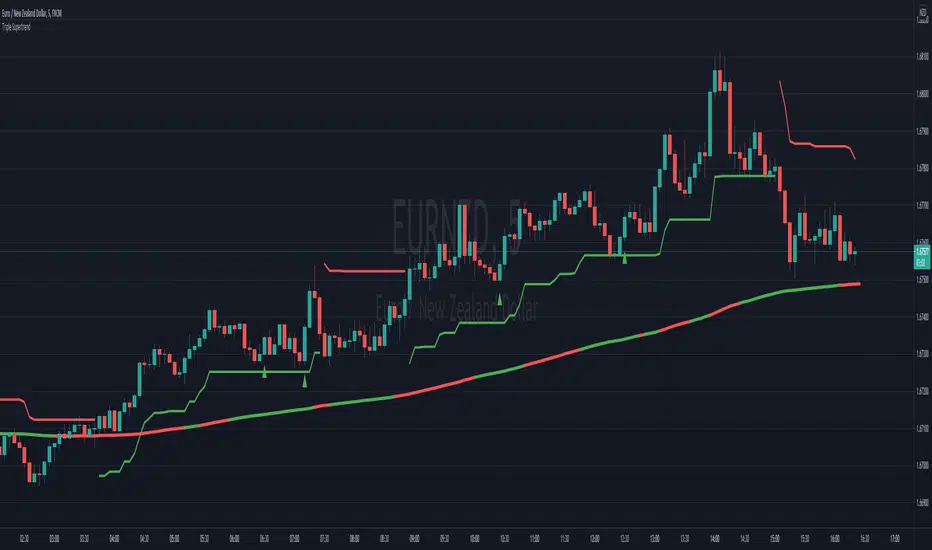
Triple Supertrend Entry SignalsThis indicator combines 3 supertrend indicators (a fast, medium and slow) with stochastic RSI and 200 EMA. It only gives short signals if price is under the 200 EMA and long signals if price is over the 200 EMA. Secondly it will only show you a short entry if the stochastic RSI is in the overbought territory and a long signal if the stochastic RSI is in the oversold territory. Finally, 2 of the supertrend lines must be over the candles for a sell and two of the supertrend lines under the candles for a buy. By default the script only displays the slow supertrend line which can be used as a guide for stop loss but the medium and fast lines can be revealed via the settings. Typically you can target 1.5 x risk for TP if using the slow supertrend line as a stop loss. Use the alerts to ensure you don't miss a potential entry.
Spread Entry StrengthThis is an overlay indicator showing a strong potential for entry into an option spread trade.
2 background shadings will occur:
The background will shade blue if the ticker is prime for a Bullish Call spread.
The background will shade purple if the the ticker is prime for a Bearish Put spread.
In theory, if the SE Strength is at one of the extremes of the Bear or Bull side, then a spread is prime for entry.
To calculate this, 8 conditions receive a 1 or zero dependent on whether the condition is true (1) or false (0), and then all of those are summed. The primary gist of the strength comes from Nishant's book, or my interpretation thereof, with some additives that limits what I need to review (such as condition 8 below.)
The 8 Bull Conditions are:
1) Bollinger Bands are outside of the Keltner Channels
2) ADX is trending up
3) RSI is trending up
4) -DI is trending down
5) RSI is under 30
6) Price is below the lower Keltner Channel
7) Price is between the lower Bollinger Band and the Bollinger basis.
8) Price at one point within the last 5 bars was below the lower Bollinger Band
The 8 Bear Conditions are the inverse conditions (except the first):
1) Bollinger Bands are outside of the Keltner Channels
2) ADX is trending down
3) RSI is trending down
4) +DI is trending up
5) RSI is over 70
6) Price is above the upper Keltner Channel
7) Price is between the upper Bollinger Band and the Bollinger basis.
8) Price at one point within the last 5 bars was above the upper Bollinger Band
There is a "market noise" filter that will filter out shading when another market move is considered, i.e. if you don't want to see the potential trade when QQQ moves more than 1% then do the following in the settings:
Check "Market Filter"
Enter QQQ in the "Market Ticker To Use"
Enter 1 in the "Market Too Hot Level"
Press Ok
Obviously, the same holds true for the "Market Too Cool Filter."

Spread Entry Balance of PowerThis is a bar chart showing the strength of a potential option spread entry using 8 conditions for each side of a trade, bull or bear.
In theory, if the SE Strength (Spread Entry Strength) is at one of the extremes of the Bear or Bull side, then a spread is prime for entry.
To calculate this, the 8 conditions receive a 1 or zero dependent on whether the condition is true (1) or false (0), and then all of those are summed. The primary gist of the strength comes from Nishant's book, or my interpretation thereof, with some additives that limits what I need to review (such as condition 8 below.)
The 8 Bull Conditions are:
1) Bollinger Bands are outside of the Keltner Channels
2) ADX is trending up
3) RSI is trending up
4) -DI is trending down
5) RSI is under 30
6) Price is below the lower Keltner Channel
7) Price is between the lower Bollinger Band and the Bollinger basis.
8) Price at one point within the last 5 bars was below the lower Bollinger Band
The 8 Bear Conditions are the inverse conditions (except the first), and the conditions are given a negative disposition (meaning they sum to -8 :)):
1) Bollinger Bands are outside of the Keltner Channels
2) ADX is trending down
3) RSI is trending down
4) +DI is trending up
5) RSI is over 70
6) Price is above the upper Keltner Channel
7) Price is between the upper Bollinger Band and the Bollinger basis.
8) Price at one point within the last 5 bars was above the upper Bollinger Band

Buy and Sell PERFECT ENTRY V2"Buy and Sell PERFECT ENTRY V2" Product Description:
The indicator quickly identifies market trends with visual buy/sell alerts on the chart.
The "Buy and Sell Perfect Entry" Indicator combines various exponential moving averages and RSI in order to deliver an early entry to a buy or sell trend. The indicator also has red and green areas for overbought (red) and oversold (green) in order to identify better the entry. The different color range of the candles make you also visualize better the trend. The dark red candles, for example, can announce an early reversal bullish signal.
The indicator has swing lines for better understanding of the trends so you can easily draw Elliott waves on the chart.
The LL means Lower Low and HH means Higher High.
The indicator is useful on any timeframe available on TradingView, even for 5 minute scalping. I like best the 5,6 and 7 hours timeframes, but also 2 or 3 days charts!
The indicator can be used for every type of market: indices, stocks, cryptocurrencies, currencies and others.
This study is not a guarantee profit. You should backtest or trade virtual money before using this study on your real portfolio, as it is intended to be a tool and not a fortune teller.
Disclaimer: Trading and investing in the stock market and cryptocurrencies involves substantial risk of loss and is not suitable for every investor. The content covered in this videos is NOT to be considered as investment advice. I’m NOT a financial adviser. All trading strategies are used at your own risk.
Please send me a private message on TradingView to gain access to the script.

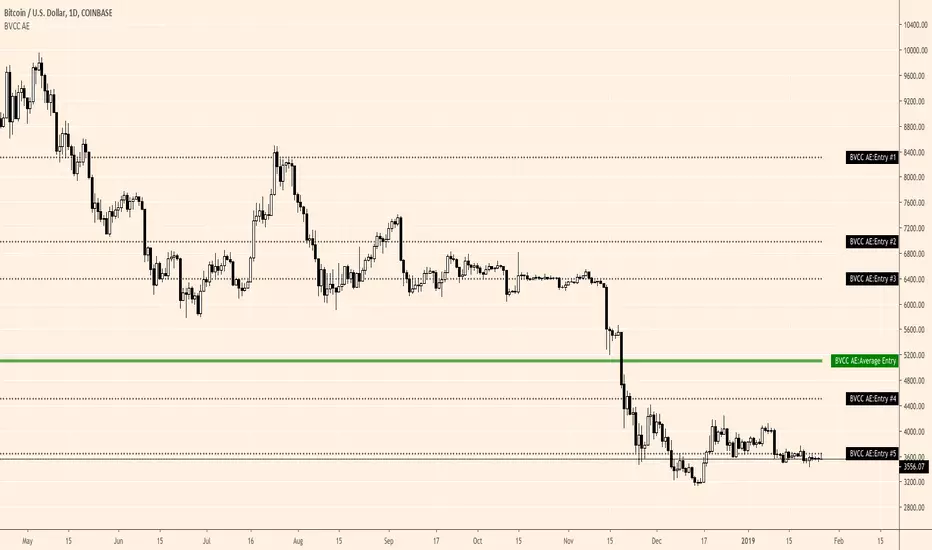
Average Entry [BVCC]Allow for input of up to 5 different entry prices and will calculate and print your average entry.
Choose 'auto calculate sat value' to input whole numbers for btc entries (e.g. input 292 instead of .00000292)
Simply deselect this option if working with a different base pair (ETH, USD, BNB and so on)
You will also need to manually select the number of entries that you are tracking from the selection box at the top of the dialogue.
It will show your entries as dotted black lines and will plot your average entry as a large green line.
If you partially exit a position, I believe you can manually subtract the number of coins sold from the lowest entry, once it is at 0, you can then move to the next lowest to continue subtracting coins. I am not 100% sure on this, so please let me know in the comments or otherwise contact me for suggestions or improvements you would like to see. This is just a proof of concept so that I can get something working in the real world and tweak it from there.
Guardian Entry Signal - FreeYou’ll instantly see big green triangles under the candles when all conditions line up. That’s your entry.
Set an alert and it will ping your phone the second one fires.

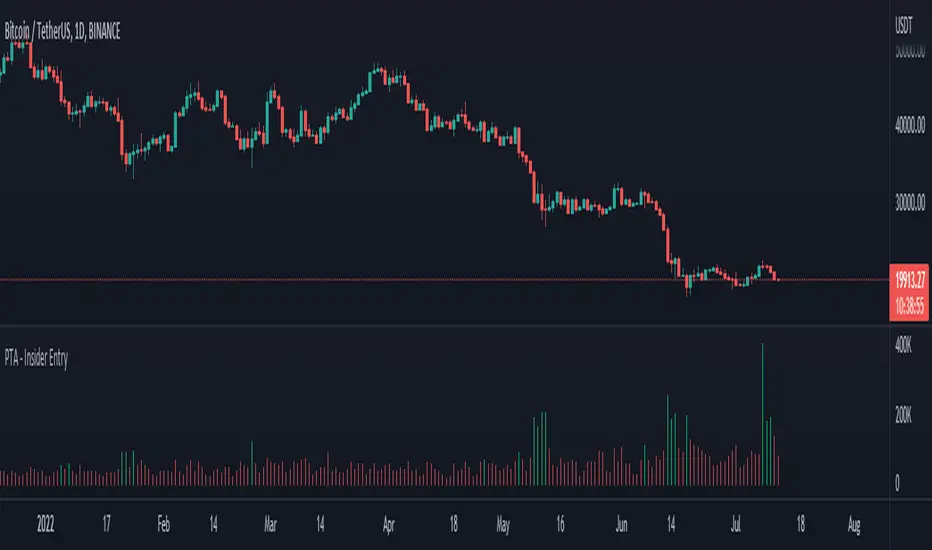
Pro Trading Art - Insider Entry with alertThis indicator is based on volume and ma. This will help you to detect higher volume on chart. You can create alert to stay updated. I am using Fibonacci golden ratio to multiply the current volume. My logic is if volume comes greater than factor of Fibonacci number and current volume then consider it as a insider entry.
Boom Hunter ProBoom Hunter Pro is the ultimate indicator for targeting perfect long entries and epic shorts. Boom Hunter comes with a super fast oscillator that uses Ehlers Early Onset Trend (EOT). This is the Center Of Gravity Oscillator (COG) with a super smoothing filter and a roofing filter. This indicator is tuned for 1 hour charts but can be used on any time frame.
Colored bars can be turned on to assist in finding an entry. Purple signifies a drag and potential dump.
Fibonacci lines can be turned on to track price action and find entries/exit.
This indicator follows the same rules as COG. For more information please see my COG HOWTO here:

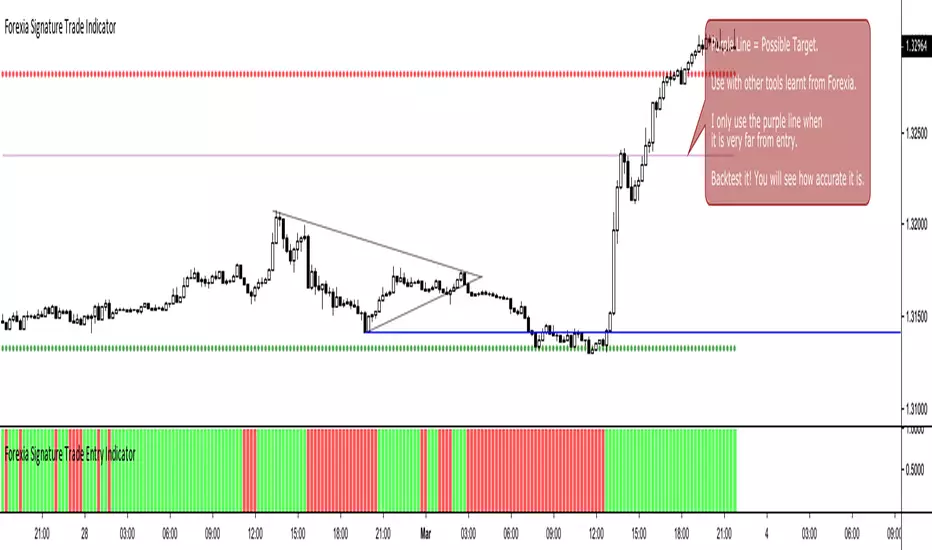
Forexia Signature Trade Entry IndicatorThis was coded by me, a fan of Forexia. This is not the official indicator.
Good confluence for entry.
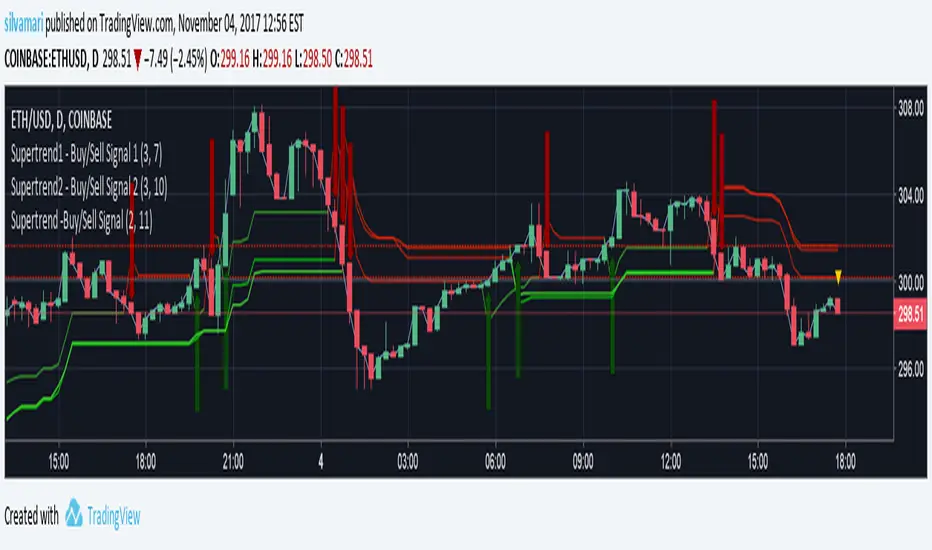
Supertrend - 3 signal settings - (Long/Short entry tool)Using SuperTrend lines to indicate a good time for entering on long or short; 3 supertrend settings together. All 3 lines must agree in order to confirm entry. Works like magic!
Feel free to combine with any other of your trusted tools in making decisions.
--------------
Disclaimer:
Above stated is only my personal method, and should not be seen or used as trading advise. Be sure to do further analysis in order to make your decisions in trading. Your trading decisions and methods of are at your own risk.
Liquidity Entry Triggers (4-Model System) | WarRoomXYZLiquidity Entry Triggers is an open-source, price-action-based analytical framework designed to highlight recurring institutional liquidity behaviors that appear across all liquid markets.
The script focuses on how and where liquidity is taken, rather than attempting to predict direction using oscillators or lagging indicators.
It is optimized for XAUUSD, FX pairs, indices, and crypto , particularly on 1m–15m timeframes where session behavior and liquidity reactions are most visible.
This tool is not a buy/sell signal generator .
It provides contextual entry zones based on structural liquidity logic, allowing traders to apply their own execution rules.
Core Philosophy
Markets move because of:
•Trapped traders
•Forced liquidations
•Session-based liquidity cycles
•Reactions at prior institutional participation zones
This script visualizes four repeatable entry triggers that emerge from those mechanisms.
🔹 1. Failed Breakout / Trapped Trader Model
When price breaks a clearly defined range high or low, breakout traders often enter expecting continuation.
If price fails to hold outside the range and closes back inside, those traders become trapped.
The script detects:
•Breaks beyond recent highs/lows
•Immediate rejection back into the range
•Structural failure of momentum
These conditions frequently lead to mean reversion or reversal moves as trapped traders exit and fuel movement in the opposite direction.
Markers are plotted at the point of failure to highlight potential trap zones.
🔹 2. Liquidation Flush Detection
Sharp impulsive candles with abnormally large wicks often represent liquidation cascades rather than healthy trend continuation.
The script identifies liquidation behavior by measuring:
•Wick-to-body imbalance
•Sudden expansion followed by rejection
•Temporary price inefficiencies
These flushes commonly occur near:
•Session highs/lows
•Range extremes
•Trend exhaustion points
Such events often lead to rebalance moves , where price partially or fully fills the wick.
🔹 3. Orderblock Reaction Zones
Orderblocks represent areas where heavy participation occurred before a strong displacement move.
The script highlights:
•Clean bullish and bearish orderblock structures
•Zones formed during consolidation prior to expansion
•Areas likely to be defended when revisited
Orderblocks with minimal noise and clean departure are prioritized, as they often reflect institutional positioning rather than retail activity.
These zones are intended as reaction areas , not automatic entry signals.
🔹 4. London Session Liquidity Sweep Model
The London session frequently establishes the initial daily high or low.
Later in the session or during New York, price often:
•Sweeps internal liquidity around that level
•Rejects after the sweep
•Continues with the higher-timeframe bias
The script monitors London session behavior and marks:
•Liquidity runs above/below London highs and lows
•Rejections back inside the prior structure
This model is especially effective when combined with broader daily context.
🔹4. How the Components Work Together
The framework is designed as a context stack , not a checklist of signals:
Liquidity Event → Location → Timing → Trader Execution
Each model reinforces the others:
•Failed breakouts often occur after liquidity sweeps
•Liquidation wicks frequently form near orderblocks
•London sweeps often trigger failed momentum moves
•Confluence increases probability, not certainty
🔹 Practical Usage Guide
✔ Identify context
Determine whether price is approaching a range extreme, session level, or prior participation zone.
✔ Wait for a liquidity event
Look for a sweep, failed breakout, or liquidation wick.
✔ Observe reaction
Rejection, displacement, or reclaim behavior provides confirmation.
✔ Execute manually
Stops are commonly placed beyond the liquidity extreme.
Targets are typically internal liquidity, prior highs/lows, or imbalance zones.
The indicator does not manage trades or enforce rules.
Execution and risk management remain the trader’s responsibility.
🔹 5. Originality & Design Notes
This script does not replicate or bundle existing indicators.
It introduces:
•A multi-model liquidity entry framework
•Structural failed breakout detection
•Wick-based liquidation imbalance logic
•Session-aware liquidity sweep visualization
•A unified, minimal, non-lagging design
All concepts are based on observable market behavior and integrated into a single analytical tool.
🔹 6. Suitable Markets & Timeframes
Works best on:
•XAUUSD
•Major FX pairs
•Indices
•Liquid crypto markets
Recommended timeframes:
•1m
•5m
•15m
•30m
🔹7. Limitations & Notes
•This is an analytical framework , not a trading system
•All markings are confirmed at candle close (non-repainting)
•No open interest or order flow data is used
•Results depend on user interpretation and execution
•Best used alongside session bias and higher-timeframe structure
Disclaimer
This script is provided for educational and informational purposes only.
It does not constitute financial advice, investment advice, or a recommendation to buy or sell any instrument.
Trading involves risk, and losses can exceed initial deposits.
The author assumes no responsibility for trading decisions made using this tool.
Users are strongly encouraged to test this script in demo or simulation environments and to apply proper risk management, position sizing, and personal discretion at all times.
By using this script, you acknowledge and accept all associated risks.

Adaptive Risk Management [sgbpulse]1. Introduction:
Adaptive Risk Management is an advanced indicator designed to provide traders with a comprehensive risk management tool directly on the chart. Instead of relying on complex manual calculations, the indicator automates all critical steps of trade planning. It dynamically calculates the estimated Entry Price , the Stop Loss location, the required Position Size (Quantity) based on your capital and risk limits, and the three Take Profit targets based on your defined Reward/Risk ratios. The indicator displays all these essential data points clearly and visually on the chart, ensuring you always know the potential risk-reward profile of every trade.
ARM : The A daptive R isk M anagement every trader needs to ARM themselves with.
2. The Critical Importance of Risk Management
Proper risk management is the cornerstone of successful trading. Consistent profitability in the market is impossible without rigorously defining risk limits.
Risk Control: This starts by setting the maximum risk amount you are willing to lose in a single trade (Risk per Trade), and limiting the total capital allocated to the position (Max Capital per Trade).
Defining Boundaries (Stop Loss & Take Profit): It is mandatory to define a technical Stop Loss and a Take Profit target. A fundamental rule of risk management is that the Reward/Risk Ratio (R/R) must be a minimum of 1:1.
3. Core Features, Adaptivity, and Customization
The Adaptive Risk Management indicator is engineered for use across all major trading styles, including Swing Trading, Intraday Trading, and Scalping, providing consistent risk control regardless of the chosen timeframe.
Real-Time Dynamic Adaptivity: The indicator calculates all risk management parameters (Entry, Stop Loss, Quantity) dynamically with every new bar, thus adapting instantly to changing market conditions.
Trend Direction Adjustment: Define the analysis direction (Long/Uptrend or Short/Downtrend).
Intraday Session Data Control: Full control over whether lookback calculations will include data from Extended Trading Hours (ETH), or if the daily calculations will start actively only from the first bar of Regular Trading Hours (RTH).
Status Validation: The indicator performs critical status checks and displays clear Warning Messages if risk conditions are not met.
4. Intuitive Visualization and Real-Time Data
Dynamic Tracking Lines: The Entry Price and Stop Loss lines are updated with every new bar. Crucially, the length of these lines dynamically reflects the calculation's lookback range (e.g., the extent of Lookback Bars or the location of the confirmed Pivot Point), providing a visual anchor for the calculated price.
Risk and Reward Zones: The indicator creates a graphical background fill between Entry and Stop Loss (marked with the risk color) and between Entry and the Reward Targets (marked with the reward color).
Essential Information Labels: Labels are placed at the end of each line, providing critical data: Estimated Entry Price, Stock/Contract Quantity (Quantity), Total Entry Amount, Estimated Stop Loss, Risk per Share, Total Financial Risk (Risk Amount), Exit Amount, Estimated Take Profit 1/2/3, Reward/Risk Ratio 1/2/3, Total Reward 1/2/3, TP Exit Amount 1/2/3.
4.1. Data Window Metrics (16 Full Series)
The indicator displays 16 full data series in the TradingView Data Window, allowing precise tracking of every calculation parameter:
Entry Data: Estimated Entry, Quantity, Entry Amount.
Risk Data (Stop Loss): Estimated Stop Loss, Risk per Share, Risk Amount, Exit Amount.
Reward Data (Take Profit): Estimated Take Profit 1/2/3, Reward/Risk Ratio 1/2/3, Total Reward 1/2/3, TP Exit Amount 1/2/3.
4.2. Instant Tracking in the Status Line
The indicator displays 6 critical parameters continuously in the indicator's Status Line: Estimated Entry, Quantity, Estimated Stop Loss, Estimated Take Profit 1/2/3.
5. Detailed Indicator Inputs
5.1 General
Focused Trend: Defines the analysis direction (Uptrend / Downtrend).
Max Capital per Trade: The maximum amount allocated to purchasing stocks/contracts (in account currency).
Risk per Trade: The maximum amount the user is willing to risk in this single trade (in account currency).
ATR Length: The lookback period for the Average True Range (ATR) calculation.
5.2 Intraday Session Data Control
Regular Hours Limitation : If enabled, all daily lookback calculations (for Entry/Stop Loss anchor points) will begin strictly from the first Regular Trading Hours (RTH) bar. This limits the lookback range to the current RTH session, excluding preceding Extended Trading Hours (ETH) data. Only relevant for Intraday charts. Default: False (Off)
5.3 Entry Inputs
Entry Method: Selects the entry price calculation method:
Current Price: Uses the closing price of the current bar as the estimated entry point (Market Entry).
ATR Real Bodies Margin :
- Uptrend: Calculates the Maximum Real Body over the lookback period + the calculated safety margin.
- Downtrend: Calculates the Minimum Real Body over the lookback period - the calculated safety margin.
ATR Bars Margin :
- Uptrend: Calculates the Maximum High price over the lookback period + the calculated safety margin.
- Downtrend: Calculates the Minimum Low price over the lookback period - the calculated safety margin.
Lookback Bars: The number of bars used to calculate the extremes in the ATR-based entry methods (Relevant only for ATR Real Bodies Margin and ATR Bars Margin methods).
ATR Multiplier (Entry): The multiplier applied to the ATR value. The result of the multiplication is the calculated safety margin used to determine the estimated Entry Price.
5.4 Risk Inputs (Stop Loss)
Risk Method: Selects the Stop Loss price calculation method.
ATR Current Price Margin :
- Uptrend: Entry Price - the calculated safety margin.
- Downtrend: Entry Price + the calculated safety margin.
ATR Current Bar Margin :
- Uptrend: Current Bar's Low price - the calculated safety margin.
- Downtrend: Current Bar's High price + the calculated safety margin.
ATR Bars Margin :
- Uptrend: Lowest Low over lookback period - the calculated safety margin.
- Downtrend: Highest High over lookback period + the calculated safety margin.
ATR Pivot Margin :
- Uptrend: The first confirmed Pivot Low point - the calculated safety margin.
- Downtrend: The first confirmed Pivot High point + the calculated safety margin.
Lookback Bars: The lookback period for finding the extreme price used in the 'ATR Bars Margin' calculation.
ATR Multiplier (Risk): The multiplier applied to the ATR value. The result of the multiplication is the calculated safety margin used to place the estimated Stop Loss. Note: If set to 0, the Stop Loss will be placed exactly at the technical anchor point, provided the Minimum Margin Value is also 0.
Minimum Margin Value: The minimum price value (e.g., $0.01) the Stop Loss margin buffer must be.
Pivot (Left / Right): The number of bars required on either side of the pivot bar for confirmation (relevant only for the ATR Pivot Margin method).
5.5 Reward Inputs (Take Profit)
Show Take Profit 1/2/3: ON/OFF switch to control the visibility of each Take Profit target.
Reward/Risk Ratio 1/ 2/ 3: Defines the R/R ratio for the profit target. Must be ≥1.0.
6. Indicator Status/Warning Messages
In situations where the Stop Loss location cannot be calculated logically and validly, often caused by a mismatch between the configured Focused Trend (Uptrend/Downtrend) and the actual price action, the indicator will display a warning message, explaining the reason and suggesting corrective action.
Status Message 1: Pivot reference unavailable
Condition: The Stop Loss is set to the "ATR Pivot Margin" method, but the anchor point (Pivot) is missing or inaccessible.
Message Displayed: "Pivot reference unavailable. Wait for valid price action, or adjust the Regular Hours Limitation setting or Pivot Left/Right inputs."
Status Message 2: Calculated Stop Loss is unsafe
Condition: The calculated Stop Loss is placed illogically or unsafely relative to the trend direction and the Entry price.
Message Displayed: "Calculated Stop Loss is unsafe for current trend. Wait for valid price action or adjust SL Lookback/Multiplier."
7. Summary
The Adaptive Risk Management (ARM) indicator provides a seamless and systematic approach to trade execution and risk control. By dynamically automating all critical trade parameters—from Entry Price and Stop Loss placement to Position Sizing and Take Profit targets—ARM removes emotional bias and ensures every trade adheres strictly to your predefined risk profile.
Key Benefits:
Systematic Risk Control: Strict enforcement of maximum capital allocation and risk per trade limits.
Adaptivity: Dynamic calculation of prices and quantities based on real-time market data (ATR and Lookback).
Clarity and Trust: Clear on-chart visualization, precise data metrics (16 series), and unambiguous Status/Warning Messages ensure transparency and reliability.
ARM allows traders to focus on strategy and analysis, confident that their execution complies with the core principles of professional risk management.
Important Note: Trading Risk
This indicator is intended for educational and informational purposes only and does not constitute investment advice or a recommendation for trading in any form whatsoever.
Trading in financial markets involves significant risk of capital loss. It is important to remember that past performance is not indicative of future results. All trading decisions are your sole responsibility. Never trade with money you cannot afford to lose.

Momentum Permission + Pivot Entry + Exit (v1.4)//@version=5
indicator("Momentum Permission + Pivot Entry + Exit (v1.4)", overlay=true)
// ──────────────────────────────────────────────
// Inputs
// ──────────────────────────────────────────────
smaLength = input.int(50, "SMA Length")
relVolThresh = input.float(1.3, "Relative Volume Threshold")
pivotLookback = input.int(3, "Pivot Break Lookback")
// ──────────────────────────────────────────────
// Core Calculations
// ──────────────────────────────────────────────
sma50 = ta.sma(close, smaLength)
vwap = ta.vwap(close)
relVol = volume / ta.sma(volume, 10)
crossUp = ta.crossover(close, sma50)
aboveSMA = close > sma50
aboveVWAP = close > vwap
relStrong = relVol > relVolThresh
greenCandle = close > open
// ──────────────────────────────────────────────
// One-Time Daily Trend Permission
// ──────────────────────────────────────────────
var bool permission = false
if ta.change(time("D"))
permission := false
trendStart = crossUp and aboveVWAP and relStrong and not permission
if trendStart
permission := true
// ──────────────────────────────────────────────
// Pullback Pivot Breakout Entry (Continuation Long)
// ──────────────────────────────────────────────
pivotHighBreak = close > ta.highest(high , pivotLookback)
entryTrigger = (
permission and
aboveSMA and
aboveVWAP and
relStrong and
greenCandle and
pivotHighBreak
)
// ──────────────────────────────────────────────
// EXIT Signal (Trend Exhaustion)
// ──────────────────────────────────────────────
smaChange = sma50 - sma50
exitSignal = (
permission and // only after trend started
close < vwap and // VWAP breakdown
close < open and // red candle body
relVol > relVolThresh and // volume spike on selling
smaChange < 0 // SMA turning down / flattening
)
// ──────────────────────────────────────────────
// Plots
// ──────────────────────────────────────────────
plot(sma50, title="SMA50", color=color.orange, linewidth=2)
plot(vwap, title="VWAP", color=color.new(color.blue, 0), linewidth=2)
// Permission marker (1 per day)
plotshape(
trendStart,
title="Trend Permission",
style=shape.triangleup,
location=location.belowbar,
color=color.new(color.green, 0),
size=size.large,
text="PERMIT"
)
// Entry trigger markers
plotshape(
entryTrigger,
title="Entry Trigger",
style=shape.triangleup,
location=location.abovebar,
color=color.new(color.aqua, 0),
size=size.normal,
text="ENTRY"
)
// EXIT marker (trend exhaustion)
plotshape(
exitSignal,
title="Exit Signal",
style=shape.triangledown,
location=location.abovebar,
color=color.new(color.red, 0),
size=size.large,
text="EXIT"
)

Multi-Entry Fibonacci CalculatorMulti-Entry Fibonacci Calculator
This tool is a comprehensive trade calculator designed for discretionary traders who plan to scale into positions. It automates the complex task of position sizing across up to three separate entries while ensuring your total risk exposure remains fixed. By inputting your desired entry, stop loss, and initial profit target levels, the script calculates the precise quantity for each entry and provides a dynamic, real-time view of your trade's vitals.
The primary goal of this script is to allow for disciplined risk management in multi-entry trade plans. Whether you are averaging into a position or adding on pullbacks, this tool ensures your total predefined risk is never exceeded, even if all entries are filled.
Key Features
Multi-Entry Position Sizing: Automatically calculates the share/contract size for up to three entries based on their distance from the stop loss and user-defined weights.
Fixed Risk Management: Define your total risk as a percentage of your account. The script ensures that a full stop-out across all filled entries will result in a loss equal to this predefined amount.
Dynamic Take Profit: The take-profit level automatically adjusts based on your current average entry price to preserve the original target profit amount in dollars.
Real-Time Info Panel: A customizable on-chart panel displays all critical trade data, including current quantity, average price, projected P&L, and trade status.
Visual Trade Plan: Plots all your defined price levels (entries, stop loss, take profit) directly on the chart with informative labels.
Trade State Tracking & Alerts: The script monitors the price and will trigger alerts when entries are hit, or when the stop loss or take profit levels are reached.
How to Use
Configure Account & Risk: In the settings, enter your "Account Size" and the "Risk per Trade (%)" you are willing to take on the entire position.
Set Trade Direction: Choose either "LONG" or "SHORT".
Input Price Levels: Manually enter the prices for your entries (Entry 1, 2, 3), your "Stop Loss Price," and an "Initial TP Reference." The initial TP is used to calculate the target profit in dollars.
Distribute Position Weight: Assign weights to each entry (e.g., 50% for Entry 1, 30% for Entry 2, 20% for Entry 3). The total should sum to 100.
Monitor the Trade: Use the info panel and on-chart visuals to track the trade's progress. The script will show your average price as entries are filled and update the dynamic take-profit level accordingly.
Understanding the Calculations
Weighted Position Sizing: The script calculates sizes for each entry so that if all entries are filled and the stop loss is hit, your total loss will equal your predefined risk amount. It intelligently allocates size based on the distance of each entry from the stop loss and the weight you assign to it.
Dynamic Take Profit: The "Initial TP Reference" is used only to calculate a target profit in dollars based on your first entry's size. The script then calculates a dynamic TP line on your chart. This line adjusts based on your average entry price as positions are filled, ensuring that if price reaches this level, you will realize your original target dollar profit, regardless of how many entries were filled.
On-Chart Elements
Price Lines: Blue lines for entries, a red line for the stop loss, and a green line for the dynamic take profit.
Labels: Display the calculated quantity for each entry, the total risk amount at the stop loss, and the target profit amount at the take profit.
Average Price: Yellow circles plot your live average entry price as the position is built.
Info Panel: A comprehensive table showing live trade status, current quantity, average price, and projected profit/loss. The panel changes color to green on a TP hit and red on an SL hit.

Elliott Wave - Wave 3 Entry EngineThis indicator is a Wave 3 entry engine built on top of an Elliott Wave–style 1-2-3 structure. It automatically finds potential Wave 3 trades, manages a simple R-multiple target/stop model, and marks outcomes directly on the chart.
What the indicator does
At a high level, the script:
Detects swing points on three “degrees”
Small (S) – fast, local swings
Medium (M) – broader swings
Large (L) – higher-timeframe context only
Looks for a 3-pivot pattern (W0 → W1 → W2)
Bullish setup: Low → High → Higher Low (L-H-L)
Bearish setup: High → Low → Lower High (H-L-H)
Checks whether that pattern is a valid Wave 1–2 structure
Using multiple rules:
Wave 2 retraces Wave 1 by a configurable fraction
Wave 1 is strong enough (percentage move + slope)
Wave 2 doesn’t overshoot Wave 0 too far
Trend direction and swing “consensus” across S/M/L degrees line up
Scores the setup (Pre-W3 Score)
The script calculates a 0–1 score based on:
How “nice” the Wave 2 retracement is vs the ideal level
How much stronger Wave 1’s slope is vs Wave 2’s pullback
How much consensus there is across the swing engine (S/M/L)
Only setups above your chosen minimum Pre-W3 score and that pass alignment checks become Wave 3 candidates.
Waits for breakout → creates a Wave 3 “entry”
For longs: price breaks above the Wave 1 high (plus an optional tick buffer)
For shorts: price breaks below the Wave 1 low (minus buffer)
When triggered, the indicator:
Stores entry price (close at breakout)
Sets a stop beyond Wave 2 (with optional extra ticks)
Calculates a target based on a fixed R multiple (e.g., 2R)
Tracks the trade until exit or timeout
For each open W3 trade, it monitors:
Target hit → marks “W3 ✅”
Stop hit → marks “W3 ❌”
Bar where both could have hit → conservative loss “W3 ?/❌”
Time-based expiry (too many bars in trade) → “W3 ⏰”
Candidates that never get a breakout within your chosen max bars from W2 can also be marked as timeout (⏰).
Visual elements on the chart
The script can plot several helpful visuals:
Swing connector lines (Small/Medium/Large)
Small = blue
Medium = purple
Large = orange
These show the detected swings at each degree
Pre-W3 labels at Wave 2 (optional)
Signals :
"Pre-W3 Long XX%" or"Pre-W3 Short XX%"
Placed at the Wave 2 pivot
Colored yellow, with the % score rounded to an integer
W3 Entry labels (optional)
"W3 Long Entry" below the bar for longs (green)
"W3 Short Entry" above the bar for shorts (red)
Outcome labels (optional)
W3 ✅ – target hit
W3 ❌ – stop hit
W3 ?/❌ – both hit on same bar, treated as loss
W3 ⏰ – candidate or trade timed out
All these can be toggled in the “Wave 3 Engine (Pre-W3 + Entries + Outcomes)” group.
Input groups & how to use them
Swing Detection (Small / Medium / Large)
These groups control how the script finds swing highs/lows using a multi-parameter pivot scan:
Left Min / Left Max / Right Min / Right Max
Define the pivot “strength” ranges (how many bars to the left/right the high/low must dominate).
Minimum swing % (post-aggregation)
Ensures that, once swings are merged and cleaned up, each swing is at least this % move from the prior opposite swing.
Loop Filters (Small/Medium/Large loop min % change)
Extra gating inside the pivot-search loop, so small noise pivots can be ignored even before final swing construction.
Practical use:
Tighten % thresholds or increase left/right bars to reduce noise.
Loosen them to get more swings and more potential W3 setups.
Wave 3 Logic
Wave 2 depth
W2 min / max retracement of W1 (fraction)
Example: 0.30–0.80 means W2 must retrace 30–80% of W1.
Ideal W2 retracement (for scoring)
Often set around 0.618 (classic fib). The closer W2 is to this, the higher the retracement part of the score.
Max W2 beyond W0 (%)
How far W2 may push past W0 (in %) before the setup is invalid. Set to 0 to disable this filter.
Wave 1 strength
Min W1 move (%)
Ensures Wave 1 itself is meaningful.
Min |W1 slope| / |W2 slope|
Wave 1 must be “steeper” than Wave 2’s correction.
Slope ratio for max score
Above this, extra slope advantage doesn’t improve the score further.
Scoring & Trend Alignment
Min Pre-W3 score (0..1)
Hard gate: anything below this won’t become a W3 candidate.
Trend alignment (S/M/L)
Options:
None – ignore swing directions, purely pattern/score based
Majority – at least 2 of S/M/L must point in the W3 direction
AllThree, S+M, S+L, M+L – stricter alignment variants
Alignment uses the latest swing direction (up or down) for each degree.
Max W3 candidates to track
Limits how many candidates + trades are stored. Old, already-closed items are pruned first; open trades are never pruned.
This is an indicator, not an order engine**:** it doesn’t place trades; it only marks hypothetical Wave 3 entries and outcomes based on your settings. Always validate on historical data and combine with your own analysis and risk management before using it in live trading.

DTR Trend EntryDTR Trend Entry is a trend-based entry tool designed to highlight market conditions and generate clear long and short signals based on price behavior around a moving average. It helps traders quickly identify bullish trends, bearish trends, consolidation zones, and potential breakout entries.
The indicator uses a simple moving average (SMA) of user-defined length to determine trend direction. A bullish trend is confirmed when the price stays above the moving average for consecutive bars, while a bearish trend is confirmed when the price stays below it. ATR (Average True Range) is also calculated, and price proximity to the moving average is used to detect consolidation, marking periods where the market is likely ranging and preparing for a move.
The chart background is shaded green during bullish trends, red during bearish trends, and yellow during consolidation to make market conditions easy to see at a glance. Entry signals appear when price crosses the moving average in the direction of the established trend: a crossover above the moving average triggers a long entry signal in a bullish zone, and a crossunder triggers a short entry signal in a bearish zone. These signals are marked on the chart with labels and can also be sent as alerts.
DTR Trend Entry is useful for traders who prefer trend-following approaches, breakout strategies, or structure-based entries. It works well on most timeframes and helps avoid late or low-quality trades by filtering entries through trend confirmation and volatility conditions.

HTF Entry Model+ [#] by @shulktradesHTF Entry Model+ by @shulktrades
Overview
The HTF Entry Model+ is a multi-timeframe trading indicator that identifies algorithmic signatures in price action and automatically displays complete entry setups with risk-to-reward projections. When specific order flow patterns are detected on a higher timeframe, the indicator calculates and displays entry zones, stop loss placement, and multiple profit targets - giving traders a complete trade plan before price reaches the entry level.
What This Indicator Does
Identifies Algorithmic Price Patterns
The indicator monitors a higher timeframe to detect specific signatures in price action that signal potential reversals or continuations. These patterns represent moments when institutional order flow creates measurable shifts in market dynamics.
Key Points:
- Analyzes higher timeframe price structure continuously
- Detects order flow signatures that precede directional moves
- Confirms patterns only when specific conditions are met
- Filters out low-quality signals automatically
Projects Complete Entry Models
When a valid pattern is detected, the indicator immediately calculates and displays a full trade setup with all necessary levels clearly marked on your chart.
What Gets Displayed:
- Entry zone (optimal price area to enter the trade)
- Stop loss level (where to exit if wrong)
- Multiple profit targets (1:1, 1:2, 1:3, 1:4, 1:5, 1:6, 1:7)
- OTE levels (Optimal Trade Entry zone & OTE + take profit model)
- Risk-reward ratios for each target
Adapts to Your Timeframe
The indicator intelligently selects an appropriate higher timeframe based on your current chart, or you can manually choose which timeframe to analyze.
Timeframe Relationships:
- 1-5 minute charts → analyzes 15-60 minute structure
- 15-30 minute charts → analyzes 4-hour structure
- 1 hour charts → analyzes daily structure
- 4 hour charts → analyzes weekly structure
- Daily charts → analyzes monthly structure
How Traders Use This Indicator
Step 1: Wait for Setup Detection
The indicator runs in the background, continuously scanning the higher timeframe for algorithmic signatures. When detected, a horizontal marker appears at the pattern formation level.
Step 2: Review the Entry Model
Once confirmed, the complete risk-reward projection displays instantly:
- All entry and exit levels are clearly labeled
- Stop loss shows exactly where the setup invalidates
- Multiple targets allow for systematic profit-taking
- Color coding shows bullish (green) or bearish (red) direction
Step 3: Plan Your Trade
Before price retraces to the entry zone, you have complete information:
- Know your exact entry price levels
- Know your exact stop loss placement
- Know multiple profit target levels
- Calculate position size based on the risk shown
Step 4: Execute When Price Returns
Wait for price to retrace back into the entry zone (OTE levels), then execute your trade with predefined parameters.
Step 5: Manage According to the Model
Use the displayed targets to manage your position:
- Scale out partial profits at each target level
- Move stops to breakeven after first or second target
- Let remaining position run toward extended targets
Key Features
Smart Pattern Recognition
- Detects specific algorithmic signatures that precede high-probability moves
- Validates patterns using proprietary order flow analysis
- Filters signals based on market structure quality
- Reduces false signals in choppy or ranging conditions
Complete Risk-Reward Framework
- Entry zones marked with "OTE" labels at optimal prices
- Stop loss clearly labeled at pattern invalidation point
- Seven profit targets (1:1 through 1:7 risk-reward)
- Additional reference levels for advanced trade management
Liquidity-Based Validation
- Monitors higher timeframe liquidity dynamics
- Identifies when stops are likely being hunted
- Confirms setups that follow liquidity sweeps
- Distinguishes high-quality from lower-quality signals
Session Time Filtering
- Optional time-based filtering for entry model display
- Set specific trading hours when setups should appear
- Useful for focusing on active market sessions
- Can be disabled for swing trading or higher timeframes
Clean Visual Presentation
- Color-coded setups (green for bullish, red for bearish)
- Clearly labeled levels (Entry, Stop Loss, OTE, 1:1, 1:2, etc.)
- Minimal chart clutter - only active setups display
- All historical setups remain visible for backtesting
Configuration Options
Higher Timeframe Settings
- Auto Mode: Automatically selects optimal higher timeframe for your chart
- Fixed Mode: Manually choose any specific timeframe to analyze
- Provides flexibility for different trading strategies and preferences
Visual Customization
- Bullish Color: Choose color for long setups (default: green)
- Bearish Color: Choose color for short setups (default: red)
- Display Length: Adjust how far forward the levels project
- Clean, professional appearance on any chart theme
Time Filter Options
- Enable/Disable Toggle: Turn session filtering on or off
- Entry Timeframe: Specify exact trading hours for setup display
- Recommended Usage: Enable for day trading, disable for swing trading
- Timezone adjustable to match your market hours
Who This Indicator Is For
Day Traders & Scalpers
- Get precise entry timing on intraday timeframes
- Clear stop placement for tight risk management
- Multiple targets for scaling out positions
- Session filtering helps focus on active market hours
Seconds Timeframe
5m Timeframe
Swing Traders
- Higher timeframe analysis for multi-day positions
- Structured entry and exit planning
- Extended targets for longer-term moves
- Can disable time filtering for 24-hour analysis
Multi-Timeframe Traders
- Aligns entries across different timeframes
- Provides higher timeframe context automatically
- Helps identify confluence between timeframes
- Works on any liquid market (stocks, futures, forex, crypto)
Systematic Traders
- Pre-defined entry and exit levels before execution
- Consistent risk-reward framework on every setup
- Historical setups remain visible for backtesting
- Removes emotional decision-making from entries
Market Compatibility
Best Performance On:
- Futures contracts (ES, NQ, YM, CL, GC, etc.)
- Major forex pairs (EUR/USD, GBP/USD, USD/JPY, etc.)
- Liquid stocks and ETFs
- Major cryptocurrency pairs
Optimal Timeframes:
- 1-minute to 1-hour: Intraday trading and scalping
- 4-hour to Daily: Swing trading and position entries
- Works on higher timeframes but signals become less frequent
Market Conditions:
- Most effective in trending or impulsive markets
- Automatically filters lower-quality ranging setups
- Adapts to different volatility environments
- Functions across all market sessions
Important Information
What This Indicator Does NOT Do
- Does not predict future price movement
- Does not guarantee profitable trades
- Does not show internal calculation methods or specific detection criteria
- Does not display the pattern scanning process (only confirmed setups)
What Traders Should Understand
- This tool identifies potential setups based on candlestick order flow analysis
- All trading involves risk - use appropriate position sizing
- Combine with your own analysis and market understanding
- Proper risk management is essential regardless of signal quality
- Past setup performance does not guarantee future results
Standard Risk Management Guidelines
Position Sizing
- Risk only 1-2% of account capital per trade
- Use the displayed stop loss distance to calculate position size
- Adjust size smaller for lower-confidence setups
- Never risk more than you can afford to lose
Stop Loss Placement
- Always honor the displayed stop loss level
- Place stops at or slightly beyond the marked level
- Do not move stops further away if trade moves against you
- Accept the loss if stop is hit and wait for next setup
Profit Taking Strategy
- Consider scaling out at multiple target levels
- Take some profit at 1:1 to reduce risk to zero
- Let remaining position run toward extended targets
- Move stops to breakeven after first target is hit
Additional Considerations
- Be aware of overall market trend direction
- Reduce position size during uncertain market conditions
- Keep detailed records of trades taken from indicator setups
Important Trading Considerations
Price Action Variability
It is important to note that market conditions vary and price does not always retrace into the displayed entry zones. In certain market environments, particularly during strong impulsive moves or high-impact news events, price may move directly toward the projected targets without providing an opportunity to enter at the optimal entry levels. Traders should be prepared to either wait for proper entry conditions or adjust their strategy accordingly based on their risk tolerance and trading plan.
Disclaimer
Educational Purpose Only
This indicator is provided solely for educational and informational purposes. It is designed to assist traders in analyzing market structure and identifying potential trading opportunities based on technical analysis principles. The indicator does not constitute financial advice, investment advice, trading advice, or any other type of professional advice.
No Guarantee of Results
Past performance of signals and setups identified by this indicator does not guarantee future results. All trading and investing involves substantial risk of loss, and you may lose some or all of your invested capital. No representation is being made that any account will or is likely to achieve profits or losses similar to those shown or discussed.
Personal Responsibility
Users of this indicator are solely responsible for their own trading decisions and any resulting outcomes. You should conduct your own research, analysis, and due diligence before making any trading or investment decisions. Always consult with a qualified financial advisor before making investment decisions if you are uncertain about your financial situation.
Risk Warning
Trading futures, forex, stocks, and cryptocurrencies carries a high level of risk and may not be suitable for all investors. The high degree of leverage can work against you as well as for you. Before deciding to trade, you should carefully consider your investment objectives, level of experience, and risk appetite. Only trade with money you can afford to lose.
No Warranty
This indicator is provided "as is" without warranty of any kind, either expressed or implied. The developer makes no guarantees about the accuracy, reliability, completeness, or timeliness of the information, signals, or projections provided by this indicator.
---
This indicator represents proprietary research into algorithmic price behavior and order flow dynamics. The methodology is protected to preserve the effectiveness of the approach and maintain the integrity of the analysis framework.

Volatility Meter & Entry LineIndicator Name: Volatility Meter & Entry Line
Created by: Texas Trading Strategies
Overview
The "Volatility Meter & Entry Line" is a comprehensive, multi-factor technical analysis tool designed to help traders assess current market conditions and identify potential trading opportunities. It synthesizes three key market dimensions—momentum (RSI), market noise (Choppiness Index), and volatility (ATR)—into a single, easy-to-understand composite score. This score visually informs you whether the market is in a favorable state for trading or if it's better to avoid choppy, low-opportunity environments. Additionally, it plots a dynamic support/resistance line based on recent price wicks to aid in entry and exit planning.
⚠️ IMPORTANT: FINANCIAL RISK & LEGAL DISCLAIMER
PLEASE READ THIS CAREFULLY BEFORE USING THIS INDICATOR.
1. No Financial Advice: I am NOT a licensed financial advisor, broker, or certified financial planner. The indicator I have created and any accompanying descriptions are provided for EDUCATIONAL AND INFORMATIONAL PURPOSES ONLY. This is NOT financial advice. You should not construe any information provided here as a recommendation to buy, sell, or hold any financial instrument or asset class.
2. High Risk of Loss: Trading in financial markets (including stocks, forex, cryptocurrencies, futures, and CFDs) carries a HIGH LEVEL OF RISK and may not be suitable for all investors. There is a possibility you could sustain a loss of some, all, or in some cases (e.g., leveraged products), more than your initial investment. You should be aware of all the risks associated with trading and seek advice from an independent, qualified financial advisor if you have any doubts.
3. No Guarantee of Profit or Accuracy: Past performance is NOT indicative of future results. No representation is being made that any account will or is likely to achieve profits or losses similar to those discussed. The signals and metrics generated by this indicator are based on historical data and mathematical formulas. They are NOT guarantees of future market behavior and are inherently lagging. The indicator can and will produce losing signals.
4. Your Responsibility: You are solely responsible for your own trading decisions and for evaluating the merits and risks associated with the use of any information from this indicator. It is your responsibility to backtest and forward-test any strategy, understand its limitations, and only trade with capital you can afford to lose.
By using this indicator, you acknowledge that you have read, understood, and agree to this disclaimer and accept full responsibility for your own trading actions.
Detailed Indicator Description & Components
1. The Core Components (Inputs & Calculations)
RSI (Relative Strength Index): Measures the speed and change of price movements. It identifies overbought (typically above 70) and oversold (typically below 30) conditions. Your indicator allows you to adjust these thresholds.
Choppiness Index (CI): A volatility indicator designed to determine if a market is trending (low CI values) or ranging/choppy (high CI values). A value below 38.2 often suggests a trend, while a value above 61.8 suggests a choppy market. Your Choppy Market Threshold input allows for customization.
ATR-based Volatility Score: The Average True Range (ATR) is normalized as a percentage of the current price (atrPercent). This value is then compared to your High Volatility Threshold to create a VolatilityScore from 0 to 100. Higher scores indicate more volatility, which can be favorable for certain trading strategies.
2. The Composite Trading Signal (The "Meter")
This is the heart of the indicator. It combines the three components above into a single tradeScore (0-100) and categorizes the market condition.
GOOD TO TRADE (Lime Color): Triggered when tradeScore >= 70.
What it means: The market is likely exhibiting a favorable combination of high volatility (opportunity), extreme RSI readings (potential momentum exhaustion for reversals or breakouts), and low choppiness (a trending or clean-moving market).
MODERATE (Yellow Color): Triggered when 40 <= tradeScore < 70.
What it means: Market conditions are mixed. There may be some opportunity, but it's not as clear. This could be a period of consolidation or a weakening trend. Caution is advised.
CHOPPY / AVOID (Red Color): Triggered when tradeScore < 40.
What it means: The market is likely in a low-volatility, highly choppy, or directionless state. Trading in these conditions often leads to whipsaws and small, frustrating losses. The indicator suggests it's best to avoid entering new positions or to be extremely selective.
3. The Wick Line (For Entries & Exits)
What it is: A dynamic line that connects recent swing highs (the tops of candle wicks), effectively acting as a moving resistance line.
How to use it:
In an uptrend, a break above this line can confirm bullish strength.
In a downtrend or during a pullback, this line can act as resistance. A price rejection (e.g., a long wick touching the line) in a "GOOD TO TRADE" market could signal a short entry or a point to exit a long position.
The concept can be mirrored to plot a support line from swing lows (ta.pivotlow) for a more complete picture (this would require additional code).
How to Use This Indicator in Your Trading
Context First: Use the "Meter" for market context. Do not take trades when the meter is red ("CHOPPY/AVOID") unless you have a very high-conviction, proven strategy for such environments.
Signal Confirmation: Wait for the meter to turn green or yellow BEFORE looking for specific entry setups. This filters out low-quality market noise.
Entry Trigger: Use the "Wick Line" (resistance/support) or your own preferred entry method (e.g., candlestick patterns, break of structure) to time your entry, but only when the overall marketCondition is favorable.
Risk Management is Paramount: ALWAYS use a stop-loss. The indicator does not provide stop-loss levels. You must determine your risk management based on the ATR, the Wick Line, or support/resistance levels.
Remember: This indicator is a FILTER, not a crystal ball. Its purpose is to improve the odds of your trades by ensuring you are only trading when market conditions align with the strategy's logic. It should be one component of a complete trading plan that includes rigorous risk management.

TSO PRO v2 Entry – Hybrid Flow Engine
TSO PRO v2 Entry – Hybrid Flow Engine
is an invite-only entry system created by a Korean trader and system developer,
specialized in structural momentum flow and transition timing.
This indicator is built on a dual-engine architecture:
✔ Lite Flow — Confirmed Entry Engine
Lite Flow uses TSO’s proprietary Flow Dynamics and zero-line structural shifts
—not moving averages or conventional indicators—
to detect the moment momentum actually turns in one direction.
It displays green (long) / red (short) triangular entry markers
only when internal flow confirms a real directional transition.
Traders may apply their own trend framework
(market structure, regime logic, price action, etc.),
and use Lite Flow entries as clean visual timing hints within that framework.
✔ PRO Flow — Hidden Leading Filter
PRO Flow analyzes internal momentum before Lite Flow triggers.
It does not show signals on the chart.
Instead, it filters out weak/false entries,
refines internal flow conditions, and adjusts background zones.
Only high-quality Lite Flow entries remain visible.
This Hybrid structure significantly reduces false breakouts
and provides confidence during live trading.
🔼 New in v2 — Long/Short Entry Arrows
Green triangle → Long timing hint during upward flow conditions
Red triangle → Short timing hint during downward flow conditions
TSO does not force a trend definition.
Each trader uses their own method,
and Lite Flow simply reveals the moment internal momentum supports that direction.
🔧 Features
Dual-engine Hybrid system (Lite Flow + PRO Flow)
Leading momentum filter (hidden PRO Flow)
High-precision non-repainting entry arrows
Background zones that reflect internal flow strength
Automation-ready structure (Webhook compatible)
PRO Flow logic fully protected (security locked)
⚠ Important
This indicator does not repaint.
PRO Flow formulas remain private for licensing and security.
Access is granted manually (invite-only).
🔑 TSO PRO Subscription
• Monthly: tradesmith6.gumroad.com
• Yearly: tradesmith6.gumroad.com
For access activation, send a DM to the developer (Korean trader).
🇰🇷 한국어 설명
TSO PRO v2 Entry – Hybrid Flow Engine은
한국 트레이더이자 시스템 개발자가 제작한
듀얼 엔진 기반의 고정밀 진입 시스템입니다.
시장 내부의 흐름(Flow Dynamics)과
구조적 모멘텀 전환에 초점을 두어 설계되었습니다.
✔ Lite Flow — 확정 진입 신호 엔진
Lite Flow는 이동평균이나 기존 지표가 아닌
TSO 고유의 Flow Dynamics + 0선 구조 전환을 기반으로
모멘텀이 실제로 특정 방향으로 전환되는 순간을 포착합니다.
이때 차트에 녹색(롱) / 빨강(숏) 삼각형이 표시됩니다.
사용자는 자신의 추세 판단 방식
(시장 구조, 레짐 분석, 캔들 패턴 등)에 맞춰
Lite Flow 신호를 직관적인 진입 타이밍 힌트로 활용할 수 있습니다.
✔ PRO Flow — 선행 필터(비공개 엔진)
Lite Flow보다 먼저 내부 흐름을 분석하여
약한 신호·거짓 돌파를 자동으로 제거합니다.
PRO Flow는 차트에 신호를 표시하지 않으며,
배경 흐름·필터링·구조적 조건을 조절하는
선행 보정 엔진입니다.
Hybrid 구조로 인해
Lite Flow에서 실제 가치 있는 진입만 남아
정확성과 안정성이 크게 향상됩니다.
🔼 v2 신규 기능 — 상승/하락 삼각형 진입 신호 강화
녹색 삼각형 → 상승 흐름 조건에서의 롱 진입 힌트
빨강 삼각형 → 하락 흐름 조건에서의 숏 진입 힌트
TSO는 특정 추세 기준을 강제하지 않습니다.
Lite Flow는 단지 내부 모멘텀이 해당 방향을 지지하는 순간을
시각적으로 알려줍니다.
🎯 주요 기능
Lite Flow + PRO Flow 듀얼 엔진
PRO Flow 기반 선행 모멘텀 필터
고정밀·비리페인트 진입 신호
배경 조건으로 흐름 강도 표시
Webhook 기반 자동매매 구조 지원
PRO Flow 공식 로직 완전 보호(비공개)
⚠ 주의사항
이 지표는 리페인트되지 않습니다.
PRO Flow 로직은 보안·라이선스 사유로 비공개입니다.
접근 권한은 수동 승인 방식입니다.
🔑 TSO PRO 구독 안내
• 월간: tradesmith6.gumroad.com
• 연간: tradesmith6.gumroad.com
접근 및 승인 요청은 DM으로 메시지를 보내주세요.
(한국 트레이더가 직접 승인 처리합니다.)

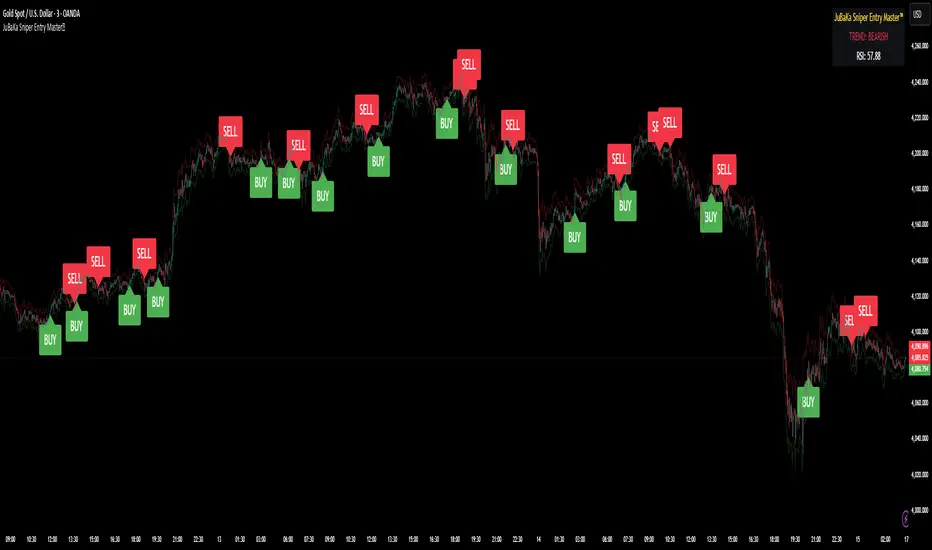
JuBaKa Sniper Entry Master™JuBaKa Sniper Entry Master™ — Premium High-Precision Scalping System
JuBaKa Sniper Entry Master™ is a professional-grade scalping indicator engineered specifically for XAUUSD, NAS100, US30, GER30, and BTC.
It combines trend structure, momentum pressure, RSI confirmation, and non-repainting crossover logic to produce extremely precise sniper entries.
Designed with fixed internal parameters, this invite-only indicator provides a clean, simplified, black-box experience with no inputs — just powerful entries and dynamic stop guidance.
🔥 KEY FEATURES
✓ Sniper Entry Engine
Signals only appear when all conditions align:
• Trend direction
• Momentum pressure
• RSI confirmation
• Non-repainting cross structure
✓ Ultra-Clean Scalping Signals
Perfect for 1m, 3m, 5m, and 15m timeframes.
✓ Fixed Internal Settings (Locked Version)
No inputs to tweak — removes confusion and keeps behavior consistent.
✓ ATR Adaptive Stoploss Line
Automatically adjusts to volatility; perfect for scalpers.
✓ Trend Ribbon
Green = Bullish
Red = Bearish
✓ Alert Ready
BUY and SELL alerts for automation, webhook bots, and mobile trading.
⭐ BEST FOR
✔ Gold (XAUUSD) Scalping
✔ NAS100 / US30 Fast Indices
✔ High-volatility markets
✔ Traders who want early entries
✔ Traders who prefer simple, execution-ready signals
✔ Anyone needing a non-repainting scalping tool
🚀 ACCESS INSTRUCTIONS
This is a premium invite-only indicator.
To gain access:
Complete payment on the official page
Send your TradingView username via Mail
Access will be granted within minutes
The indicator will appear under:
Indicators → Invite-Only Scripts → JuBaKa Sniper Entry Master™
Support (Payments / Access):
Mail: jubaka.com@gmail.com
🏆 JuBaKa Sniper Entry Master™
Precision. Speed. Profitable Entries.
MACD with Smart Entry Signals & Trend Filter
This advanced MACD indicator combines traditional MACD analysis with intelligent entry signal detection and an optional EMA trend filter. It identifies high-probability entry points by analyzing histogram patterns, consolidation phases, and trend continuation setups.
### Key Features
**🎯 Smart Entry Detection**
- **Consolidation Breakouts**: Identifies exits from consolidation zones (weak bars) with strong momentum
- **Trend Reversals**: Detects potential trend changes after extended weak phases
- **Correction/Continuation Patterns**: Recognizes brief corrections within strong trends that offer continuation opportunities
**📊 Enhanced MACD Visualization**
- Color-coded histogram showing four distinct states:
- Strong Bullish (dark green): Rising histogram above zero
- Weak Bullish (light green): Falling histogram above zero
- Weak Bearish (light red): Rising histogram below zero
- Strong Bearish (dark red): Falling histogram below zero
**🔍 Multi-Layer Filtering System**
- **Candle Size Filter**: Eliminates signals during high volatility/large candle ranges
- **EMA Trend Filter**: Optional filter ensuring entries align with the dominant trend direction
- Visual markers for rejected signals (orange X for candle size, blue E for EMA trend)
**⚙️ Customizable Parameters**
- Adjustable MACD periods (default: 34/144/9)
- Configurable consolidation bar requirements
- Flexible correction pattern detection
- EMA trend filter with adjustable sensitivity
- Multiple alert types for all signal conditions
### How to Use
1. **Enable/disable filters** based on your trading style and market conditions
2. **Green triangles (L)**: Long entry signals when all conditions are met
3. **Red triangles (S)**: Short entry signals when all conditions are met
4. **Rejected signal markers**: Help you understand why certain setups were filtered out
5. **Background coloring**: Provides visual confirmation of signal zones and correction patterns
### Alert System
Comprehensive alerts for:
- Long and short entry signals
- Specific pattern types (consolidation, reversal, continuation)
- Rejected signals (helps refine strategy)
- Traditional MACD histogram crossovers
### Best Practices
- Use the EMA trend filter in trending markets to avoid counter-trend trades
- Adjust candle size filter based on your instrument's typical volatility
- Consider combining with support/resistance levels for confirmation
- Test different consolidation bar settings for your timeframe
### Parameters Summary
- Fast/Slow Length: MACD calculation periods
- Signal Smoothing: Signal line period
- Consolidation Bars: Minimum weak bars before breakout
- Max Candle Range: Filter for oversized candles
- EMA Period & Sensitivity: Trend filter configuration
---
*This indicator is designed for traders who want a systematic approach to identifying MACD-based entry opportunities with built-in risk management through filtering.*

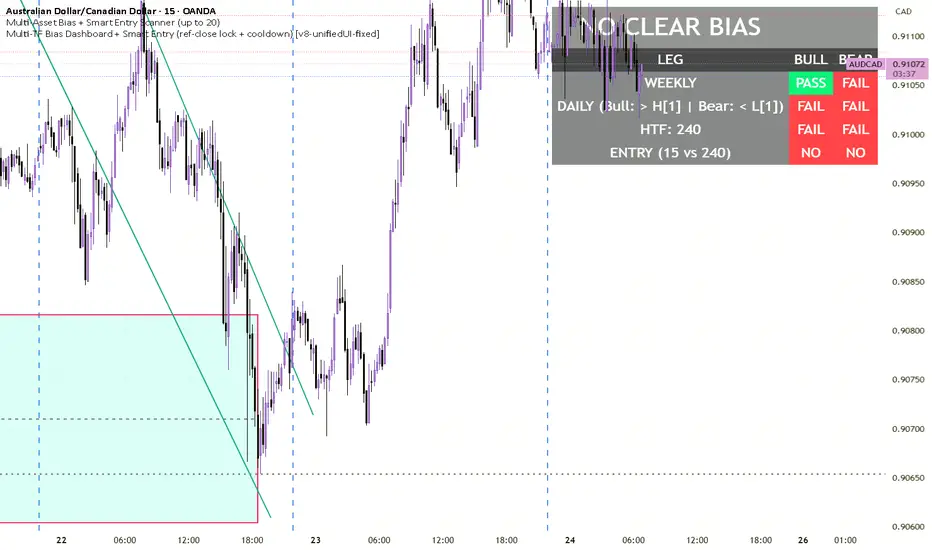
Multi-TF Bias Dashboard + Smart Entry V8Multi-TF Bias Dashboard + Smart Entry provides a complete top-down bias and entry confirmation system for professional traders.
It evaluates Weekly, Daily, and Custom HTF (e.g. 4H) candle structures to define directional bias, then synchronizes entry triggers from a lower timeframe using a reference–entry lock and optional cooldown filter to prevent overtrading.
A unified dashboard panel displays:
✅ Weekly / Daily / HTF leg PASS-FAIL logic
✅ Auto-locked entries only after reference bar close
✅ Bias banner (Bullish / Bearish / Neutral)
✅ Cooldown timer (Bars or Minutes) to space entries
✅ Real-time alerts + on-chart entry markers