Mean Reversion with Incremental Entry by HedgerLabsThe "Mean Reversion with Incremental Entry" strategy, designed by HedgerLabs, is an advanced TradingView strategy script focusing on the mean reversion technique in financial markets. This strategy is engineered for traders who prefer a systematic approach with an emphasis on incremental entries based on price movements relative to a moving average.
Key Features:
Moving Average Based Strategy: Central to this strategy is the simple moving average (SMA), around which all trade entries and exits revolve. Traders can customize the MA length, making it flexible for various trading styles and timeframes.
Incremental Entry Mechanism: Unique to this strategy is the incremental entry system. The strategy initiates an initial trade when the price deviates from the MA by a specified percentage. Subsequent entries are made at incremental steps, defined by the trader, as the price moves further away from the MA. This method can potentially capitalize on increasing market volatility.
Dynamic Position Management: The strategy intelligently manages positions by entering long when the price is below the MA and short when above, allowing for adaptive positioning in different market conditions.
Automated Exit Logic: Exit points are determined when the price touches the MA, aiming to close positions at potential reversal points for optimized trade outcomes.
Continuous Market Analysis: With 'calc_on_every_tick' enabled, the strategy constantly evaluates market conditions, ensuring prompt reaction to price movements.
Usage Scenario:
This strategy is particularly beneficial in markets exhibiting mean-reverting behavior. It is suitable for traders focusing on swing trading or those who prefer to scale into positions during periods of high volatility.
Disclaimer:
Please remember that this strategy is for informational and educational purposes only and is not intended as financial or investment advice. Trading in financial markets carries risks, including the potential loss of capital. We advise doing your own research and consulting with a financial expert before making any investment decisions.
Cerca negli script per "entry"

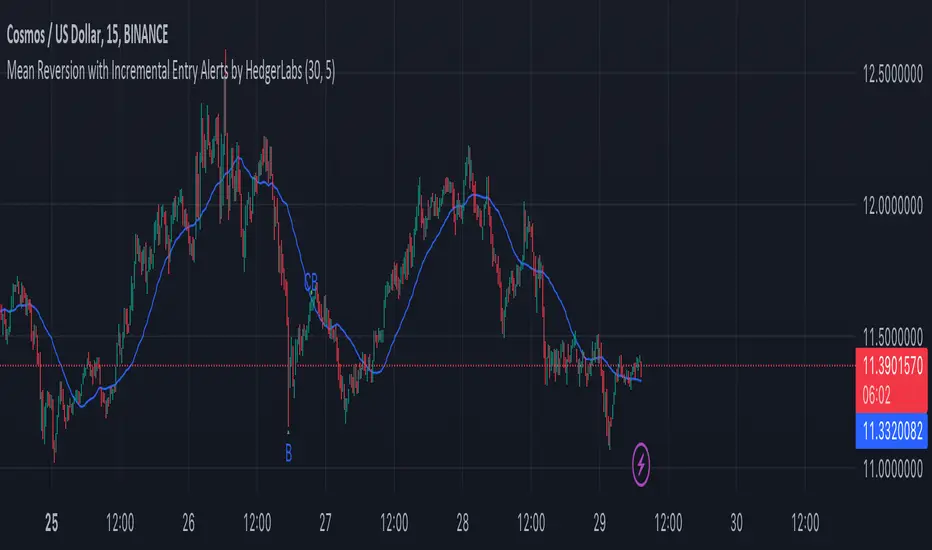
Mean Reversion with Incremental Entry Alerts by HedgerLabsThe "Mean Reversion with Incremental Entry Alerts" is a sophisticated TradingView indicator designed by HedgerLabs. It's built on the concept of mean reversion, a fundamental trading strategy in financial markets. This indicator is tailored for traders seeking systematic and disciplined entry points in volatile markets.
Key Features:
Moving Average (MA) Based: At its core, the indicator utilizes a simple moving average (SMA) as the baseline for mean reversion. You can customize the length of the MA according to your trading style.
Initial Entry Conditions: The script generates initial buy and sell alerts based on a defined percentage deviation from the moving average. This approach allows traders to enter trades at points where the price significantly deviates from its mean, potentially signaling a reversion opportunity.
Buy and Sell Signals: Clear visual cues are provided for buy and sell positions, making it easy to interpret and act upon the signals.
Close Conditions: In addition to entry signals, the indicator also plots closing signals (green and red crosses) when the price touches the moving average. This feature assists in timely exits from positions, aiming to optimize trade outcomes.
Alert System: Integrated alert conditions notify you when a new buy or sell order condition is met, as well as when to close existing positions. This ensures you never miss an opportunity or an exit point.
Usage Scenario:
This indicator is particularly useful in markets where prices tend to revert to a mean value over time. It's ideal for day traders who focus on asset price volatility.
Disclaimer:
Please note that this tool is for informational and educational purposes only and should not be considered as financial or investment advice. Trading involves substantial risk, including the potential loss of principal. We recommend conducting your research and consulting with a financial expert before making any investment decisions.
Contrarian DC Strategy - w Entry SL Pause and TrailingStopDonchian Channel Setup:
The strategy uses a tool called the Donchian Channel. Imagine this as two lines (bands) on a chart that show the highest and lowest prices over a certain number of past trading days (default is 20 days).
There's also a centerline, which is the average of these two bands.
Entry Conditions for Trades:
Buying (Going Long): The strategy considers buying when the price touches or falls below the lower band of the Donchian Channel. However, this only happens if there has been a pause after a previous losing trade. This pause is a number of candles where no new trades are taken.
Selling (Going Short): Similarly, the strategy considers selling when price reaches or exceeds the upper band of the Donchian Channel. Again, this is subject to a pause after a losing trade.
Stop Loss and Take Profit:
Each trade has a "Stop Loss" and "Take Profit" set. The Stop Loss is a preset price level where the trade will close to prevent further losses if the market moves against your position. The Take Profit does the same but locks in profit if the market moves in your favor.
The Stop Loss is set based on a percentage of the price at which you entered the trade.
The Take Profit is determined by the Risk/Reward Ratio. This ratio helps balance how much you're willing to risk versus the potential reward.
Trailing Stop Loss:
When a trade is profitable, the strategy should involve a "Trailing Stop Loss." This means the Stop Loss level moves (or trails) the price movement to lock in profits as the market moves in your favor.
For a buy trade, if the price moves above the centerline of the Donchian Channel, the Trailing Stop Loss should be adjusted in the middle between the entry price and the centerline. Viceversa for a sell trade, it should be adjusted in the same way if the price goes below the centerline.
IMPORTANT: There's no allert for the trailing stop at the moment.
Post-Stop Loss Pause:
If a trade hits the Stop Loss (i.e., it's a losing trade), the strategy takes a break before opening another trade in the same direction. This pause helps to avoid entering another trade immediately in a potentially unfavorable market.
In summary, this strategy is designed to make trades based on the Donchian Channel, with specific rules for when to enter and exit trades, and mechanisms to manage risk and protect profits. It's contrarian because it tends to buy when the price is low and sell when the price is high, which is opposite to what many traders might do.


Extreme Entry with Mean Reversion and Trend FilterThis non-repainting indicator is an improved version of my previous work, a more versatile tool designed to provide traders with dynamic and adaptive entry signals while incorporating a mean reversion and trend filtering mechanism. By combining RSI overbought/oversold, regular divergence and confirmatory momentum oscillator such as CCI or MOM, this indicator generates more precise and timely signals for entering trades.
The indicator offers a comprehensive set of entry conditions for both Buy and Sell entries:
• For Buy entries, it checks for oversold conditions based on RSI levels, and detects bullish divergence patterns while oversold and it identifies upward crossovers in the selected entry signal source (CCI or Momentum).
• Similarly, for Sell entries, it identifies downward crossovers of the CCI or Mom, after the recent overbought conditions, and bearish divergence patterns inside the overbought RSI.
To refine the entry signals even further, the indicator utilizes a mean reversion filter. Traders can choose to display signals that occur inside or outside the upper and lower mean reversion bands:
• Range Entries are indicating potential buying opportunities near the lower band and selling opportunities near the upper band. This is based on the concept of mean reversion, which suggests that prices tend to return to the average when they reach the upper or lower bands. By focusing on these signals, traders can take advantage of price movements that have a higher probability of reversing towards the mean.
• Extreme Entries, on the other hand, represent signals that occur outside of the bands, signaling potential pullbacks during strong trends. By entering positions only at extreme highs or lows, traders can avoid getting caught in the middle of the trend. This approach helps traders capitalize more favorable trading opportunities which have a high reward-risk ratio.
Trend Filter acts as a directional bias for the entry signals. When enabled, long and short entry conditions are filtered based on the relationship between the closing price and the EMA.
Traders have the flexibility to customize, tweak the indicator filter and values in the settings according to their preferences strategies and traded assets, tailoring the signals to their specific needs. The script sets alert conditions to trigger alerts for buy, sell, or both entry signals. This indicator can be used in conjunction with price action or other technical analysis tools for confirmation and better trading decisions.
I created this indicator for my own use, and I share this for informational purposes only. It does not constitute financial advice so use at your own risk and consider your financial situation before making any trading decisions. The indicator's accuracy is not guaranteed, and past performance is not indicative of future results.
I appreciate your feedback on this indicator. As I am new to script development, I am open to comments and suggestions to improve it. If you encounter any issues while using this indicator, please let me know in the comments section. If you find it helpful, I kindly ask for your support in boosting it. Thank you for your cooperation.

Double Supertrend Entry with ADX Filter and ATR Exits/EntriesThe Double Supertrend Entry with ADX Filter and ATR Exits/Entries indicator is a custom trading strategy designed to help traders identify potential buy and sell signals in trending markets. This indicator combines the strengths of multiple technical analysis tools, enhancing the effectiveness of the overall strategy.
Key features:
Two Supertrend Indicators - The indicator includes two Supertrend indicators with customizable parameters. These trend-following indicators calculate upper and lower trendlines based on the ATR and price. Buy signals are generated when the price crosses above both trendlines, and sell signals are generated when the price crosses below both trendlines.
ADX Filter - The Average Directional Index (ADX) is used to filter out weak trends and only generate buy/sell signals when the market exhibits a strong trend. The ADX measures the strength of the trend, and a customizable threshold level ensures that trades are only entered during strong trends.
ATR-based Exits and Entries - The indicator uses the Average True Range (ATR) to set profit target and stop-loss levels. ATR is a measure of market volatility, and these levels help traders determine when to exit a trade to secure profit or minimize loss.
Performance Statistics Table - A table is displayed on the chart, recording and showing the total number of winning trades, losing trades, percentage of profitable trades, average profit, and average loss. This information helps traders evaluate the performance of the strategy over time.
The Double Supertrend Entry with ADX Filter and ATR Exits/Entries indicator is a powerful trend-following strategy that can assist traders in making more informed decisions in the financial markets. By combining multiple technical analysis tools and providing performance statistics, this indicator helps traders improve their trading strategy and evaluate its success.

Negroni MA & RSI Strategy, plus trade entry and SL/TP optionsI will start with the context, and some things to think about when using a strategy tool to back-test ideas.
CONTEXT
FIRST: This is derived from other people's work, but I honestly hadn't found a mixed indicator MA strategy tool that does what this now does. If it is out there, apologies!!
This tool can help back-test various MA trends (SMA, EMA, HMA, VWMA); as well as factoring in RSI levels (or not); and can factor in a fixed HTF MA (or not). You can apply a 'retest entry' or a 'breakout entry', and you can also apply various risk mgt for SL/TP orders: 1) No SL/TP; or 2) a fixed %, or 3) dynamic ATR multipliers.
Find below, some details explaining what this tool is attempting to do.
Thank you, tack, salute!
THINGS TO REVIEW (it is not just about 'profitability'!!)
Whilst discretion is always highly encouraged as a trader, and a 100% indicator-driven strategy is VERY unlikely to yield sustainable results going forward, at the very least back-testing your strategies can help provide some guidance, not just on win rate Vs profit factor, but other things including:
a) Trade frequency: if a strategy has an 75% win rate and profit factor of 4, with all your parameters and confluence checks, but only triggers 3 trades every 5 years, is that realistically implementable to your trading situation if you have a $10,000 account?
b) Trade entry type: is it consistently better to wait for a retest of an 'MA zone', or is it better to market buy/sell on breakout of the 'MA zone'?
c) Risk management (SL/TP): is it consistently better to have a fixed static % for SL/TP ("I always place my stops 2% away, whether it is EURUSD or BTCUSDT"), or would you be better placed to try using an ATR multiplier of the respective assets?
d) Moving average type: is your old faithful 100 EMA really serving you well, or is the classic SMA more reliable, or how about the HMA, or the VWMA? Is the 100/200 cross holding up, or do you need something more sensitive? Is there any significant difference between a 10 EMA/20 EMA trend zone compared to a 13 EMA /25 EMA zone?
e) Confluence: Do added confluence checks (RSI, higher timeframe MA) actually improve profitability? But even if they do, is at the cost of cutting too many trades?
INPUTS AND PARAMETERS
Choice 1) Entry Strategy: Retest or Breakout - You can select both!
[ ]:
a) RETEST entry strat: price crosses UNDER FastMA INTO the 'MA trend zone'.
b) BREAKOUT entry strat: price crosses OVER FastMA OUT the 'MA trend zone'.
Choice 2) Risk Management (SL and TP) - You can select more than 1 strategy!
a) No SL/TP: Long trades are closed when the LOW crosses back UNDER the fastMA again, and shorts are closed when the HIGH crosses back OVER the fastMA again.
b) Static % SL/TP: Your SL/TP will be a fixed % away from avg. position price... WARNING: You should change this for various asset classes; FX vol is not the same as crypto altcoin vol!
c) Dynamic ATR SL/TP: Your SL/TP is a multiple of your selected ATR range (default is 50, see 'info' when you select ATR range). ATR accounts for the change in vol of different asset classes somewhat, HOWEVER... you should probably still not have the same multiplier trading S&P500 as you would trading crypto altcoins!
Then select your preferred parameters: EMA, SMA, HMA, VWMA, etc. You can mix and match, and most options have a info/tooltip guide.
RSI note: If you don't care for RSI levels, then set buy signal at 1... i.e always buys! Similarly set sell signal at 99.
ATR note: standard ATR length is usually 14, however... your SL/TP will move POST entry, and can tighten or widen your initial SL/TP... for better AND usually for worse! Go find a trade (strat 3) on the chart, look at the SL/TP lines, now change the number to 5, you'll see.
Fixed HTF MA note: If you don't care for HTF MA confluence, just change the timeframe/options to match the 'Slow MA' options you've chosen.

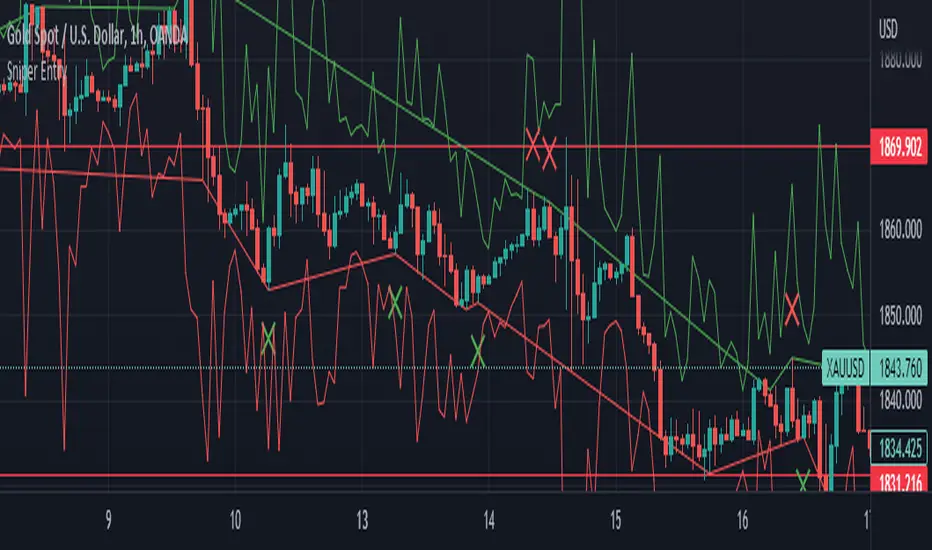
Sniper EntryThis source code is an implementation of a TradingView indicator called "Sniper Entry". The purpose of this indicator is to identify potential entry points for trades based on certain candlestick patterns and the Stochastic oscillator.
The indicator calculates the Stochastic oscillator based on the close, high, and low prices of the asset over a period of 14 bars. It then uses this oscillator to generate buy and sell signals.
For a buy signal to be generated, the Stochastic oscillator must cross above the oversold level of 20, and the current candle must either be a bullish pin bar or a bullish engulfing pattern. For a sell signal to be generated, the Stochastic oscillator must cross below the overbought level of 80, and the current candle must either be a bearish pin bar or a bearish engulfing pattern.
The indicator also calculates the stop loss and target levels for both buy and sell trades. The stop loss is calculated based on the low or high of the candle that generated the signal, depending on whether it's a buy or sell signal. The target is calculated based on the risk/reward ratio, which is set to 3 in this implementation. The lot size is also set to 0.01, and the starting capital is set to 100.
The indicator then plots the buy and sell signals, the stop loss and target levels, and the Stochastic oscillator on the chart.
It's important to note that this is just one example of a trading indicator, and its effectiveness may vary depending on market conditions and the asset being traded. It's also important to perform your own analysis and use proper risk management techniques when making trades based on any indicator or strategy.
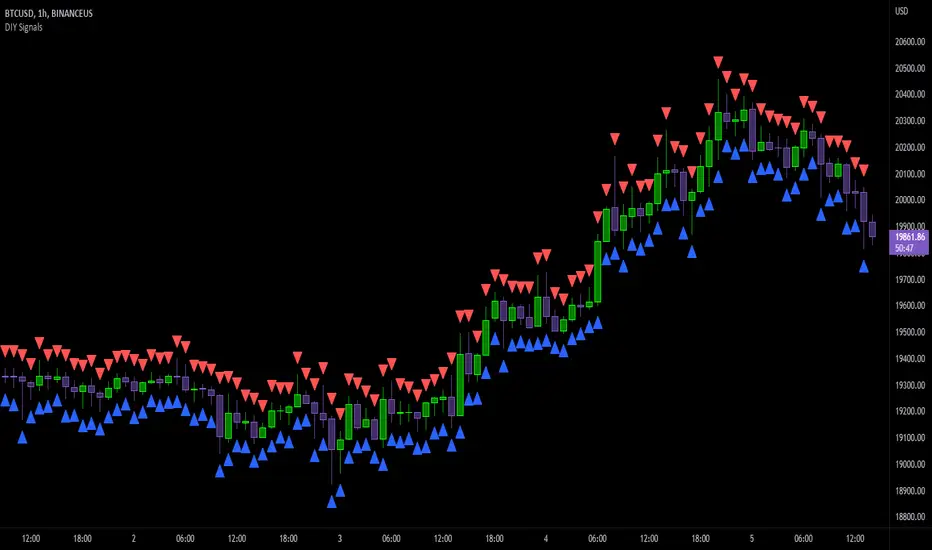
DIY Entry SignalsThis indicator allows you to set up entry signals based on your own conditions.
Note that this indicator DOES NOT give any information about exits. It is not intended to be a signal indicator that someone could blindly follow. It is intended for use in backtesting to help spot entry points more easily.
Also note that this indicator DOES NOT plot anything other than moving averages and entry signals. The other indicators referenced will need to be added on their own to be visible on the chart.
Credit to The_Caretaker for both BBWP and PMARP indicators. For more information on how those work, see their descriptions. Big thanks to him for making them open source, as well.
Instructions for use:
Signal Types:
This section allows you to choose whether you want long, short, or both types of signals.
Moving Averages:
Configure up to 4 moving averages to be plotted on the chart. Options include show/hide, color, length, and type.
RSI:
Choose the period and source used for the Relative Strength Index indicator, a very commonly used momentum oscillator.
Stochastic:
Choose the K, D, smoothing, and source for the Stochastic indicator, a very commonly used momentum oscillator.
BBWP:
Choose settings for the Bollinger Band Width Percentile indicator. This measures volatility based on Bollinger Bands and was created by The_Caretaker. The indicator is free and open source, so definitely check it out.
This section allows the user to choose the price source, basis type ( SMA , EMA , or VWMA ), length, and lookback. It also includes a threshold setting to determine the BBWP requirement used for entry signals.
PMARP:
Choose settings for the Price Moving Average Ratio & Percentile. This calculates the ratio between a source price and moving average over a lookback period. This was also created by The_Caretaker, and it is a free and open source indicator.
This section allows the user to choose price source, lookback, PMAR length, and moving average type.
DMI/ADX:
Choose settings for the Directional Movement Index and the Average Directional Index. This shows which direction the price is moving by comparing prior highs and lows and calculating a positive directional movement and a negative directional movement. The average of the positive and negative movements is used to plot the ADX line.
Long/Short Conditions:
Choose which indicators will be used to determine entry signals, as well as some options for each indicator that is included.
Note: A signal will only be plotted if ALL selected conditions are met.
Options in these sections include:
Faster moving averages above or below slower moving averages (implying a trend direction)
RSI thresholds (separate for long and short)
Stochastic thresholds (separate for long and short)
Whether K should be above or below D (implying trend direction of the Stochastic indicator)
Whether a signal should only be generated on the bar when the Stochastic first crosses the threshold.
BBWP on/off (The threshold for this is determined in the BBWP section of the settings)
PMARP thresholds (separate for long and short)
SuperTrend Entry(My goal creating this indicator) : Provide a way to enter the market systematically, automatically create Stop Loss Levels and Take Profit Levels, and provide the position size of each entry based on a fix Percentage of the traders account.
The Underlying Concept :
What is Momentum?
The Momentum shown is derived from a Mathematical Formula, SUPERTREND. When price closes above Supertrend Its bullish Momentum when its below Supertrend its Bearish Momentum. This indicator scans for candle closes on the current chart and when there is a shift in momentum (price closes below or above SUPERTREND) it notifies the trader with a Bar Color change.
Technical Inputs
- If you want to optimize the rate of signals to better fit your trading plan you would change the Factor input and ATR Length input. Increase factor and ATR Length to decrease the frequency of signals and decrease the Factor and ATR Length to increase the frequency of signals.
Quick TIP! : You can Sync all VFX SuperTrend Indicators together! All VFX SuperTrend indicators display unique information but its all derived from that same Momentum Formula. Keep the Factor input and ATR Length the same on other VFX SuperTrend indicators to have them operating on the same data.
Display Inputs
- The indicator has a candle overlay option you can toggle ON or OFF. If toggled ON the candles color will represent the momentum of your current chart ( bullish or bearish Momentum)
your able to change the colors that represent bullish or bearish to your preference
- You can toggle on which shows the exact candle momentum switched sides
your able to change the colors that represent a bullish switch or bearish switch to your preference
- The trader can specify which point you would like your stop loss to reference. (Low and High) Which uses the Low of the Momentum signal as the reference for your Stop Loss during buy signals and the High as the reference during sell signals. Or (Lowest Close and Highest Close) which uses the Lowest Close of the Momentum signal as the reference for your Stop Loss during buys and the Highest Close as the reference during sells.
- The colors that represent your Stop Loses and Take Profits can also be changed
Risk Management Inputs
- Your Risk MANAGMENT section is used to set up how your Stop Loss and Take Profit are calculated
- You have the option to take in account Volatility when calculating your Stop Loss. A adjusted ATR formula is used to achieve this. Increase Stop Loss Multiplier from 0 to widen stops.
- Increase Take Profit Multiplier from 0 to access visual Take Profit Levels based on your Stop Loss. This will be important for traders that Prefer trading using risk rewards. For Example: If the the Take Profit Multiplier is 3 a Take Profit level 3 times the size or your stop loss from your entry will be shown and a price number corresponding to that Take Profit Level becomes available.
- Enter your current Account size, Bet Percentage and Fixed Spread to get your Position Size for each trade
-Toggle on the Current Trade Chart and easily get the size of your Position and the exact price of your Take Profit and Stop Loss.
You can increase the Size of the Current Trade Chart= Tiny, Small, Normal, Large, Huge and change the Position of the Current
trade Chart to your preference, (Top- Right, Center, Left) (Middle- Right, Center, Left) (Bottom- Right, Center, Left).
How it can be used ?
- Enter Trades and always know where your stop is going to be
- Eliminate the need to manual calculate Position Size
- Get a consistent view of the current charts momentum
- Systematical enter trades
- Reduce information overload

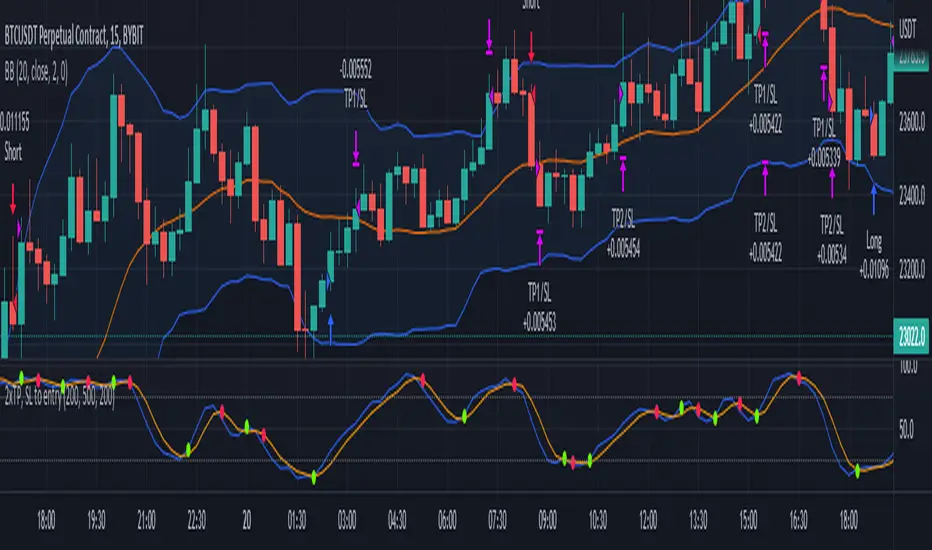
2x take profit, move stop loss to entryTwo take profit targets moving stop loss to entry after first take profit hit
This strategy shows a method to achieve the following trade management:
1) Open a position with two take profit targets
2) When first take profit is hit, move the stop loss to entry price
3) Position is closed when either second take profit is hit or position is stopped out at entry
Trading Conditions
The trading conditions used in this script are for illustrative purposes only and are not meant to be profitable.
Bollinger Bands
Used to show areas where price is moving outside of the normal range
Stochastic
Used to show overbought and oversold conditions.
Green dots are plotted when the K line crosses over its SMA. Red dots are plotted when the K line crosses under its SMA.
The option to use overbought/oversold thresholds is again illustrative.
Fractal Potential EntryFractal Potential Entry combine 3 ema and fractal and follow the strategy from Trade Pro on YouTube:
www.youtube.com
with good performance on the 1 minute chart
Feature:
Alert Sell and buy Potential Entry
Happy Trading

Bogdan Ciocoiu - Sniper EntryWhat is Sniper Entry
Sniper Entry is a set indicator that encapsulates a collection of pre-configured scripts using specific variables that enable users to extract signals by interpreting market behaviour quickly, suitable for 1-3min scalping. This instrument is a tool that acts as a confluence for traders to make decisions concerning current market conditions. This indicator does not apply solely to an asset.
What Sniper Entry is not
Sniper Entry is not interpreting fundamental analysis and will also not be providing out of box market signals. Instead, it will provide a collection of integrated and significantly improved open-source subscripts designed to help traders speculate on market trends. Traders must apply their strategies and configure Sniper Entry accordingly to maximise the script's output.
Originality and usefulness
The collection of subscripts encapsulated in this tool makes it unique in the Trading View ecosystem. This indicator enables traders to consider entry positions or exit positions by comparing similar algorithms at once.
Its usefulness also emerges from the unique configurations embedded in the indicator's settings, which are different from those of the original scripts.
This indicator's originality is also reflected in how its modules are integrated, including the integration of the settings.
Open-source reuse
I used the following open-source resources, which I simplified significantly and pre-configured for short term scalping. The source codes for the below are already in the public domain, including the following links listed below.
www.tradingview.com (open source)
(open source and generic algorithm)
www.tradingview.com (open source)
(open source)
(open source)
www.tradingview.com (generic MA algorithm and open source)
(generic VWAP algorithm and open source)

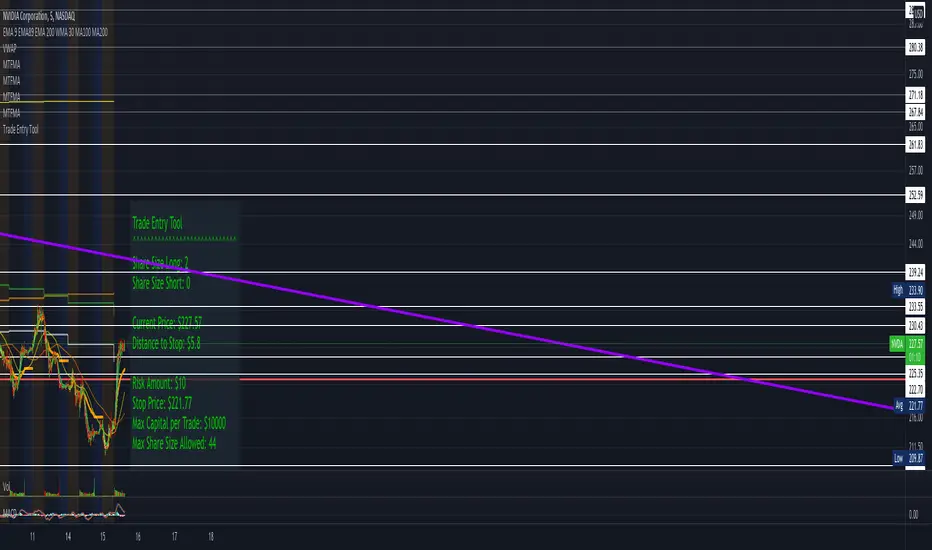
LCDT Trade Entry ToolLCDT Trade Entry Tool
Enter the Offset for the X Axis for the Entry Tool.
Enter the Offset for the Y Axis for the Entry Tool.
Enter the Price for your Stop Loss in $.
Enter your desired Risk Amount in $.
Enter the max amount of of Capital per Trade in $.
There are toggle buttons in the setup to reveal/remove more data in the label that pops up, as well as a toggle to make the text larger.
Bjorgum MTF MAScope:
Up to 3 MA's can be applied at the users discretion
Choose between 10 different average types including favorites from the Bjorgum series from HEMA to Reversal T3's
Each MA can be independently set
Go Multi-timeframe! Any MA can be set to any timeframe of reference you choose (ex. using 3 different timeframes of higher resolution to your chart reference to establish a multi-time frame trend)
RSI HEATMAP. Use the bar color or the MA color selection toggle to set your color to reference RSI on a gradient. This helps to establish clear visual reference to momentum on top of trend analysis
Assigning RSI bar color to an MA of a higher time frame can allow you to see visual reference of momentum of the greater trend that may be at play.
Example: trying to get short on a 15min while your 1hr and 4hr RSI Heatmap burns deep in oversold.
RSI color can be assigned to the bar color, the MA (1,2 or 3), or both. Alternatively, bar color can be assigned to a more simple rising/ falling MA color and price above/ below the MA for bar color.
ALL MTF FUNCTIONS ARE NON_REPAINTING.
The Idea
The original inspiration behind the script came from an observation of a constant struggle of Pinecoders of both youth or experience to find accurate multi-timeframe indicators that do not repaint, and appear as should on historical bars, while performing reliably in real time. I encourage you to scroll the Pinecoders FAQ on a recent piece explaining the difficulties and caveats of different approaches, but I would like to reference the elimination of the historical bar offset for THIS purpose. MA's are based on closing prices, that is to say they are confirmed and will not change once the bar has closed. There is no need to offset these for historical reference. The purpose of the historical offset is best exemplified, for example, with an intraday strategy involving daily breakouts. Let's entertain going long on a break to a new daily high. We would not know that in real time so we need to reference the previous bars close for BACKTESTING purposes, otherwise we get "lookahead bias". There is no shortage of strategies unintentionally employing this bias out there (I'm sure you have come across them with their unrealistic results).
There is no worry of repainting with the MTF security function included within this script, nor will it offset for something involving lookahead bias. I encourage those that are playing with the code or perhaps writing strategies of their own to borrow the functions within. There is also a function that will return the 10 MA variable selection - yours to keep.
With all that in mind, I wanted a practical script that is easily deployable in everyday trading for the average trader that gives the user a firm grip on their trading steering wheel equipped with the feel of the road. Incorporating several MA's of differing times with the RSI heatmap gives a good visual reference and feel to your trading environment, while offering a level of customization that will fit an individuals personal trading style. The RSI heatmap gradient is per percentage between 30 and 70 and your 2 colors - anything outside of those levels gives you the vibrant bias color
Below I walk through 2 examples of live trades scenarios I made using the mindset the script offers.
The Trade
LONG IZEA
Timeframe: 4hr chart
- 3 Tilson MA's of varying length are deployed at varying intraday time frames
- A bullish pattern in an uptrend offers a possible trade allowing entry from a low risk point from the pattern low
- See the chart for notes and observations using the script
- Notice how the heatmap brightens up as price extends far away from the averages - your risk has elevated for a new position
- Notice the heatmap cool off while price action consolidates sideways
The Trade
SHORT BTCUSDT
Timeframe: 4hr chart
- 3 EMAs are employed - same length (50), with 3 successive timeframe resolutions
- A downtrend is formed with a sharp move to stack the EMAs into layers
- A pull back opportunity presents itself in bearish consolidation
- Notice a Doji star at resistance establishing a swing high as RSI cools off into the EMA dynamic resistance for entry
- An '"equal legs" measured move can be used for a trade target with a stop out above the swing high.
- Again, take note of distance from EMA's, the heatmap in combination with trend development surrounding the MA's
These were just two ideas to show you an example of how to implement some strategy into your trading and to get some interesting use from the indicator. Hope you enjoyed the read and happy trading.

BBofVWAP with entry at Pivot PointThis strategy uses BB of VWAP and Pivot point to enter and exit the Long position.
settings
BB length 50
BB Source VWAP
Entry
When VWAP crossing up BB midline and price/close is above weekly PivotPoint ( you can also use Daily pivot point )
Exit
When VWAP is crossing down BB lower band
Stop Loss
Stop loss defaulted to 5%
Note : Long will position will be exited on either VWAP crossing down BB lower band or stop loss is hit - whichever comes first . Being said that some time your stop loss exit is less than 5% which saves from more losses.
Entry is based on weekly Pivot point , so any time frame below weekly will work perfect. I have tested t on 30 min , 1 HR , 4 Hr , Daily charts. Even weekly setting shows good results , that will work for long term investing style.
if you change Pivot period to Daily , chose time frames below Daily.
I also noticed this strategy mostly do not enter Long position in a down trend. Even it finds one , it will be exited with minimal loss.
Warning
For the use of educational purposes only

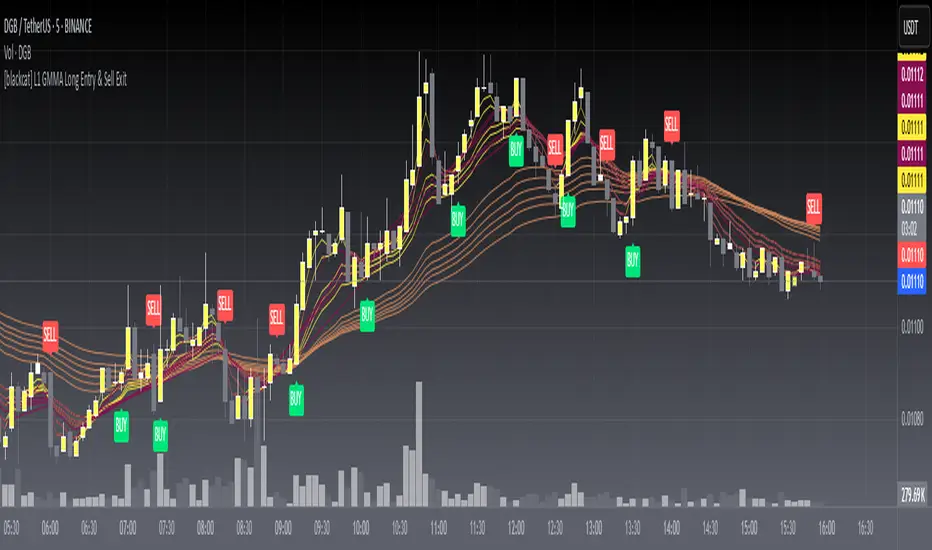
[blackcat] L1 GMMA Long EntryLevel: 1
Background
The Guppy Multiple Moving Average (GMMA) is a technical indicator that identifies changing trends, breakouts, and trading opportunities in the price of an asset by combining two sets of moving averages (MA) with different time periods. There is a short term group of MAs and a long term group of MAs.
Function
L1 GMMA Long Entry classify short-mid term GMMA cluster and long term GMMA cluster with key Fibnocci numbers. Long entry signal is generated with GMMA cluster relationship.
Key Signal
Long entry 1~6 ---> Long entry signal generated with GMMA cluster relationship.
Pros and Cons
Pros:
1. easy observe price trend
2. it covers short, middle and long term trend analysis
Cons:
1. Only long entry signal is disclosed here
2. No complex trading strategy is used yet
Remarks
NA
Readme
In real life, I am a prolific inventor. I have successfully applied for more than 60 international and regional patents in the past 12 years. But in the past two years or so, I have tried to transfer my creativity to the development of trading strategies. Tradingview is the ideal platform for me. I am selecting and contributing some of the hundreds of scripts to publish in Tradingview community. Welcome everyone to interact with me to discuss these interesting pine scripts.
The scripts posted are categorized into 5 levels according to my efforts or manhours put into these works.
Level 1 : interesting script snippets or distinctive improvement from classic indicators or strategy. Level 1 scripts can usually appear in more complex indicators as a function module or element.
Level 2 : composite indicator/strategy. By selecting or combining several independent or dependent functions or sub indicators in proper way, the composite script exhibits a resonance phenomenon which can filter out noise or fake trading signal to enhance trading confidence level.
Level 3 : comprehensive indicator/strategy. They are simple trading systems based on my strategies. They are commonly containing several or all of entry signal, close signal, stop loss, take profit, re-entry, risk management, and position sizing techniques. Even some interesting fundamental and mass psychological aspects are incorporated.
Level 4 : script snippets or functions that do not disclose source code. Interesting element that can reveal market laws and work as raw material for indicators and strategies. If you find Level 1~2 scripts are helpful, Level 4 is a private version that took me far more efforts to develop.
Level 5 : indicator/strategy that do not disclose source code. private version of Level 3 script with my accumulated script processing skills or a large number of custom functions. I had a private function library built in past two years. Level 5 scripts use many of them to achieve private trading strategy.
[blackcat] L1 Banker Entry IndicatorLevel: 1
Background
@testtttt1111 inquired me how to model banker entry
Function
L1 Banker Entry Indicator demostrates a simple model of banker entry for long or short
Key Signal
bankerthreshold ---> customized input for threshold value for banker move identification
pumpdumpsoon ---> alerts for pump or dump start soon in green color
longshortentry ---> alerts for long or short entry in orange color
bankermove ---> alerts for banker move in yellow color
Pros and Cons
Pros:
1. indicating banker move and entries
2. simple classification of banker move alerts
Cons:
1. no direction can be identified
2. no volume information is utilized for big fund move
Remarks
A demo for banker entry inquired by @testtttt1111
Readme
In real life, I am a prolific inventor. I have successfully applied for more than 60 international and regional patents in the past 12 years. But in the past two years or so, I have tried to transfer my creativity to the development of trading strategies. Tradingview is the ideal platform for me. I am selecting and contributing some of the hundreds of scripts to publish in Tradingview community. Welcome everyone to interact with me to discuss these interesting pine scripts.
The scripts posted are categorized into 5 levels according to my efforts or manhours put into these works.
Level 1 : interesting script snippets or distinctive improvement from classic indicators or strategy. Level 1 scripts can usually appear in more complex indicators as a function module or element.
Level 2 : composite indicator/strategy. By selecting or combining several independent or dependent functions or sub indicators in proper way, the composite script exhibits a resonance phenomenon which can filter out noise or fake trading signal to enhance trading confidence level.
Level 3 : comprehensive indicator/strategy. They are simple trading systems based on my strategies. They are commonly containing several or all of entry signal, close signal, stop loss, take profit, re-entry, risk management, and position sizing techniques. Even some interesting fundamental and mass psychological aspects are incorporated.
Level 4 : script snippets or functions that do not disclose source code. Interesting element that can reveal market laws and work as raw material for indicators and strategies. If you find Level 1~2 scripts are helpful, Level 4 is a private version that took me far more efforts to develop.
Level 5 : indicator/strategy that do not disclose source code. private version of Level 3 script with my accumulated script processing skills or a large number of custom functions. I had a private function library built in past two years. Level 5 scripts use many of them to achieve private trading strategy.

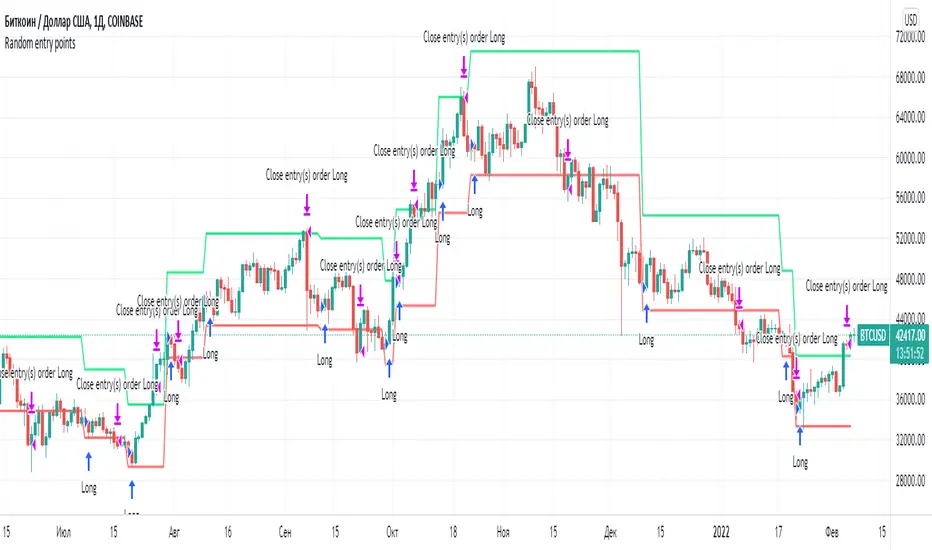
Random entry pointsIt is profitable strategy with random entry points.
A simple strategy involving random opening of trades. But such a strategy on large samples will demonstrate profit. Because the strategy adheres to the golden rule of trading: "Let profits rise and quickly stop losses."
Remember, exit points are very important. Many traders make the mistake of focusing all their attention on entry points.
SMA Cross Entry & Exit StrategyThis is a TradingView Strategy Script meaning you can't execute real trades using your exchange API connected to your TradingView account, it is designed for backtesting only
This is a basic backtesting script for charting the bullish and bearish cross of two user defined simple moving averages, select the cog next to the name of the script ON the price chart in the left hand corner. The script will print to the screen either "Long Entry" or "Short Entry" depending on the direction of the cross. The script using TradingView strategies will subsequently close the opposite of the position that is executed when the bullish or bearish cross occurs. Simply put, if you are short and a bullish cross occurs, your short trade will close and be logged in strategies and the long will fire. You can pyramid the long and short positions to continue entering as long as the trend doesn't flip. You will find this in the script settings. Since this script is for backtesting you can manually set the "backtesting range" for TradingView Strategies and firing the "Long Entry" and "Short Entry". This as well, is in the settings.
Notice: When the SMA cross occurs, you have to wait till the next candle before TradingView Strategy will print the "Long Entry" or "Short Entry" to the screen
TradingView - How To Use Strategies: www.tradingview.com

Momentum and Trend Strength Entry Exit Pivot StudyUpdated version of previous Momentum Strength Entry Exit Pivot Study:
//************************
// @TheGeeBee - Credit where used
//
//Notes:
//
// Use 1,2,3,5 minute timeframes
// EMA Cross line and offset allows user to alter the sell characteristics where the candle low is above the EMA line and indicates a possible pre-pivot reversal
// Adjust Min and Max pivots based on risk profile
// Single Candle drawdown value represents the maximum size of a single red candle before an Exit Pivot is generated
// ADX Threshold inhibits Pivots when trending signal is below the threshold value
// Percentage Max drawdown since Entry Pivot allows the system to generate an Exit Pivot if the security has dropped X percent from the most recent Entry Pivot point
// Use Bars, Candles (preferred) or Heikin-Ashi
// Multiple Green Bars = BTFD
// Multiple Red bars = If you didn't already get out, do it now!
//
//************************
Allows for Alerts to be set for Entry and Exit Pivots.
LongSetups with Entry Signals and Trailing Stop(HA)High probable Long Setups for any time frame and asset.
75+ win rate
Trailing stop always used as exit point
To trade only with the trand - enable MAs in the Inputs tab
x - means Entry signal is active and waiting for long validation
B - on a closed bar is entry signal for long
C - on a developing bar is exit long signal
Green line - long validation line. must close above to go long
Pink line - trailing stop
On Long Entry alert - use Once Per Bar Close option.
On Long Exit alert (Trailing stop triggered) - use Once Per Bar option to trigger sooner and protect your capital.
Always do your own analysis and make trades on your own risk. Find a confluence point where everything aligns and make your own decision. Don't enter a trade because the indicator tells you so. You are free to make a copy of the script and change it to your own needs for your own personal use.
RSI/MFI - MTF - Entry signals/Trend colored bars - JD@version=2
This indicator is designed to give early entry signals as well as to follow trend moves, according to different settings.
The indicator shows a histogram of the RSI ro MFI in relation to an ema of the RSI or MFI.
The histogram is then smoothed to give early reversal/entry signals.
The actual RSI/MFI line with oversold/overbought indication can be displayed or omitted, as preferred.
in addition to the RSI/MFI line or as an alternative to it, the background colour can be set to change folowing the RSI/MFI signals.
The timeframe can be chosen. Higher timeframes (eg. 3h) tend to give less false signals.
version 5.
added support for custom Multiple Time Frame selection.
added option for choice of RSI or MFI as base indicator.
added option for price bar coloring according to the indicator. (deselecting "borders" in the "style" tab is recommended)
price bar coloring can be adjusted for different strategies:
1. following the slope of the histogram (for faster entry/exit signals)
2. according to positive or negative histogram (for longer moves)
3. according to pos. or neg. RSI/MFI (for longer term trend holds)
4. uptrend: biased towards faster buy signals and slower sell signals to stay in the uptrend
5. downtrend: biased towards faster sell signals and slower buy signals to stay in the downtrend
A longer timeframe (eg. 3x) is recommended for following trend moves.
try different strategies to see what works better for RSI or MFI.
JD.
