TJR SEEK AND DESTROYTJR SEEK AND DESTROY – Intraday ICT Trading Tool
Built for day traders, TJR SEEK AND DESTROY combines Smart Money concepts like order blocks, fair value gaps, and liquidity sweeps with structure breaks and daily bias to pinpoint high-probability trades during US market hours (9:30–16:00). Ideal for scalping or intraday strategies on stocks, futures, or forex.
What Makes It Unique?
Unlike standalone ICT indicators, this script integrates:
Order Blocks with volume and range filters for precise support/resistance zones.
Fair Value Gaps (FVG) to spot pre-market price imbalances.
Break of Structure (BOS) and Liquidity Sweeps for trend and reversal signals.
A 1H MA-based Bias to align trades with the day’s direction.
BUY/SELL Labels triggered only when bias, BOS, and sweeps align, reducing noise.
How Does It Work?
Order Blocks: Marks zones with high volume (>1.5x 20-period SMA) and low range (<0.5x ATR20) as teal boxes—potential reversal points.
Fair Value Gap: Compares the prior day’s close to the current open (pre- or post-9:30), shown as a purple line and label (e.g., "FVG: 0.005").
Pivot Point: Calculates (prevHigh + prevLow + prevClose) / 3 from the prior day, plotted as an orange line for equilibrium.
Break of Structure: Detects crossovers of 5-bar highs/lows (gray lines), marked with red triangles.
Liquidity Sweeps: Tracks breaches of the prior day’s high/low (yellow lines), marked with yellow triangles.
Daily Bias: Uses 1H close vs. 20-period MA (blue line) for bullish (green background), bearish (red), or neutral (gray) context.
Signals: BUY (green label) when bias is bullish, price breaks up, and sweeps the prior high; SELL (red label) when bias is bearish, price breaks down, and sweeps the prior low.
How to Use It
Setup: Apply to 1M–15M charts for US session trading (9:30–16:00 EST).
Trading:
Wait for a BUY label after a yellow sweep triangle above the prior day’s high in a green (bullish) background.
Wait for a SELL label after a yellow sweep triangle below the prior day’s low in a red (bearish) background.
Use order blocks (teal boxes) as support/resistance for stop-loss or take-profit.
Markets: Best for SPY, ES futures, or forex pairs with US session volatility.
Underlying Concepts
Order Blocks: High-volume, low-range bars suggest institutional activity.
FVG: Gaps between close and open indicate imbalance to be filled.
BOS & Sweeps: Price breaking key levels signals momentum or stop-hunting.
Bias: 1H MA filters trades by broader trend.
Chart Setup
Displays order blocks (teal boxes), pivot (orange), open (purple), bias (colored background), BOS/sweeps (triangles), and signals (labels). Keep other indicators off for clarity.
Cerca negli script per "fair value gap"

Enhanced London Session SMC SetupEnhanced London Session SMC Setup Indicator
This Pine Script-based indicator is designed for traders focusing on the London trading session, leveraging smart money concepts (SMC) to identify potential trading opportunities in the GBP/USD currency pair. The script uses multiple techniques such as Order Block Detection, Imbalance (Fair Value Gap) Analysis, Change of Character (CHoCH) detection, and Fibonacci retracement levels to aid in market structure analysis, providing a well-rounded approach to trade setups.
Features:
London Session Highlight:
The indicator visually marks the London trading session (from 08:00 AM to 04:00 PM UTC) on the chart using a blue background, signaling when the high-volume, high-impulse moves tend to occur, helping traders focus their analysis on this key session.
Order Block Detection:
Identifies significant impulse moves that may form order blocks (supply and demand zones). Order blocks are areas where institutions have executed large orders, often leading to price reversals or continuation. The indicator plots the high and low of these order blocks, providing key levels to monitor for potential entries.
Imbalance (Fair Value Gap) Detection:
Detects and highlights price imbalances or fair value gaps (FVG) where the market has moved too quickly, creating a gap in price action. These areas are often revisited by price, offering potential trade opportunities. The upper and lower bounds of the imbalance are visually marked for easy reference.
Change of Character (CHoCH) Detection:
This feature identifies potential trend reversals by detecting significant changes in market character. When the price action shifts from bullish to bearish or vice versa, a CHoCH signal is triggered, and the corresponding level is marked on the chart. This can help traders catch trend reversals at key levels.
Fibonacci Retracement Levels:
The script calculates and plots the key Fibonacci retracement levels (0.618 and 0.786 by default) based on the highest and lowest points over a user-defined swing lookback period. These levels are commonly used by traders to identify potential pullback zones where price may reverse or find support/resistance.
Directional Bias Based on Market Structure:
The indicator provides a market structure analysis by comparing the current highs and lows to the previous periods' highs and lows. This helps in identifying whether the market is in a bullish or bearish state, providing a clear directional bias for trade setups.
Alerts:
The indicator comes with built-in alert conditions to notify the trader when an order block, imbalance, CHoCH, or other significant price action event is detected, ensuring timely action can be taken.
Ideal Usage:
Timeframe: Suitable for intraday trading, particularly focusing on the London session (08:00 AM to 04:00 PM UTC).
Currency Pair: Specifically designed for GBP/USD but can be adapted to other pairs with similar market behavior.
Trading Strategy: Best used in conjunction with a price action strategy, focusing on the key levels identified (order blocks, FVG, CHoCH) and using Fibonacci retracement levels for precision entries.
Target Audience: Ideal for traders who follow smart money concepts (SMC) and are looking for a structured approach to identify high-probability setups during the London session.

Candle Range Theory | Flux Charts💎 GENERAL OVERVIEW
Introducing our new Candle Range Theory Indicator! This powerful tool offers a strategy built around the Candle Range Theory, which analyzes market movements through the relative size and structure of price candles. For more information about the process, check the "HOW DOES IT WORK" section.
Features of the new Candle Range Theory Indicator :
Implementation of the Candle Range Theory
FVG & Order Block Entry Methods
2 Different TP / SL Methods
Customizable Execution Settings
Customizable Backtesting Dashboard
Alerts for Buy, Sell, TP & SL Signals
📌 HOW DOES IT WORK ?
The Candle Range Theory (CRT) indicator operates by identifying significant price movements through the relative size and structure of candlesticks. A key part of the strategy is determining large candles based on their range compared to the Average True Range (ATR) in a higher timeframe. Once identified, a breakout of either the high wick or the low wick of the large candle is required. This breakout is considered a liquidity grab. After that, the indicator waits for confirmation through Fair Value Gaps (FVGs) or Order Blocks (OBs). The confirmation structure must be the opposite direction of the breakout, for example if the high wick is broken, a bearish FVG is required for the short entry. After a confirmation signal is received, the indicator will trigger entry points based on your chosen entry method (FVG or OB), and exit points will be calculated using either a dynamic ATR-based TP/SL method or fixed percentages. Alerts for Buy, Sell, Take-Proft, and Stop-Loss are available.
🚩 UNIQUENESS
This indicator stands out because it combines two highly effective entry methods: Fair Value Gaps (FVGs) and Order Blocks (OBs). You can choose between these strategies depending on market conditions. Additionally, the dynamic TP/SL system uses the ticker's volatility to automatically calculate stop-loss and take-profit targets. The backtesting dashboard provides metrics about the performance of the indicator. You can use it to tune the settings for best use in the current tiker. The Candle Range Theory approach offers more flexibility compared to traditional indicators, allowing for better customization and control based on your risk tolerance.
⚙️ SETTINGS
1. General Configuration
Higher Timeframe: Customize the higher timeframe for analysis. Recommended combinations include M15 -> H4, H4 -> Daily, Daily -> Weekly, and Weekly -> Monthly.
HTF Candle Size: Define the size of the higher timeframe candles as Big, Normal, or Small to filter valid setups based on their range relative to ATR.
Entry Mode: Choose between FVGs and Order Blocks for your entry triggers.
Require Retracement: Enable this option if you want a retracement to the FVG or OB for entry confirmation.
Show HTF Candle Lines: Toggle to display the higher timeframe candle lines for better visual clarity.
2. Fair Value Gaps
FVG Sensitivity: You may select between Low, Normal, High or Extreme FVG detection sensitivity. This will essentially determine the size of the spotted FVGs, with lower sensitivities resulting in spotting bigger FVGs, and higher sensitivities resulting in spotting all sizes of FVGs.
3. Order Blocks
Swing Length: Swing length is used when finding order block formations. Smaller values will result in finding smaller order blocks.
4. TP / SL
TP / SL Method:
a) Dynamic: The TP / SL zones will be auto-determined by the algorithm based on the Average True Range (ATR) of the current ticker.
b) Fixed : You can adjust the exact TP / SL ratios from the settings below.
Dynamic Risk: The risk you're willing to take if "Dynamic" TP / SL Method is selected. Higher risk usually means a better winrate at the cost of losing more if the strategy fails. This setting is has a crucial effect on the performance of the indicator, as different tickers may have different volatility so the indicator may have increased performance when this setting is correctly adjusted.

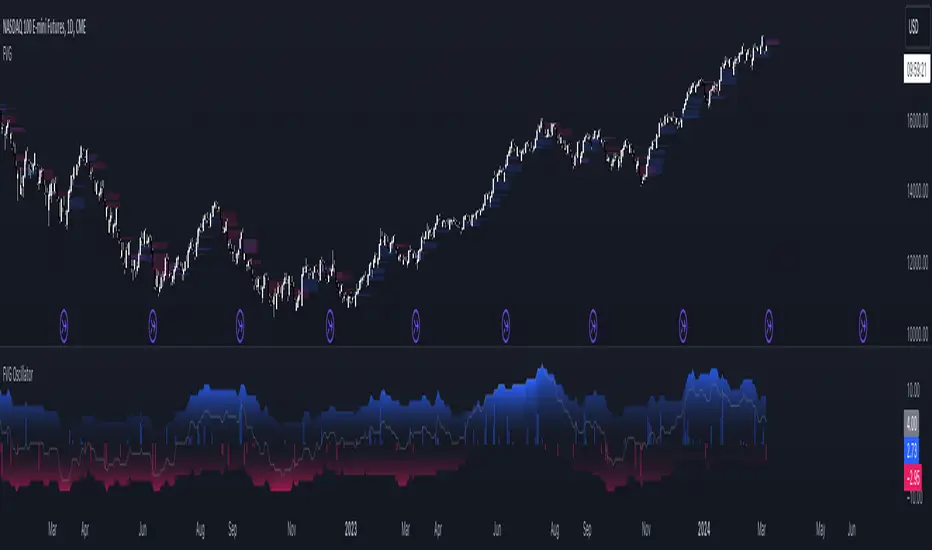
FVG OscillatorThe FVG Oscillator, developed by OmegaTools and available on TradingView, is a specialized analytical tool designed to offer traders insight into the market's potential direction through the lens of Fair Value Gaps (FVGs). This script combines traditional oscillator functionality with a unique focus on FVGs, providing a nuanced approach to understanding market dynamics.
Understanding FVGs and Their Importance:
Fair Value Gaps (FVGs) are identified when there's a discrepancy between the high price of one session and the low of the subsequent session (or vice versa), indicating areas where price movements have skipped over, creating a gap. These gaps often signal potential price movement areas, as markets may move to "fill" these gaps. The FVG Oscillator is designed to quantify these occurrences and their potential impact on market direction.
Key Features of the FVG Oscillator:
- Adjustable Lookback Period: Traders can set the number of bars back (defaulted at 50) to adjust the sensitivity of the oscillator to recent market activity.
- Visual Area Representation: The option to display areas of positive and negative FVG occurrences provides a visual representation of market sentiment over the selected period.
- Color Customisation: Users can personalize the oscillator's appearance with color selections for positive and negative movements, enhancing readability and analysis.
- Volume and ATR Confirmation: Incorporates volume data and Average True Range (ATR) filtering to verify FVG occurrences, adding a layer of validation to the identified gaps.
Operational Mechanism:
The oscillator tallies bullish FVG occurrences as positive values and bearish FVG occurrences as negative values over the specified lookback period. It then applies volume and ATR criteria to confirm the significance of these gaps. The final output is an oscillator line that reflects the net value of bullish versus bearish FVGs, alongside histograms that show the width (or significance) of long and short patterns based on confirmed FVGs.
How to Use the FVG Oscillator:
- After adding the FVG Oscillator to your TradingView chart, adjust the 'Bars Back' input to tailor the oscillator's sensitivity to your trading strategy.
- Use the net value line to gauge the overall market sentiment based on FVG occurrences; a higher net value suggests bullish sentiment, while a lower value indicates bearish sentiment.
- The histograms provide an additional layer of insight, highlighting the relative strength and significance of confirmed bullish and bearish FVGs.
Application in Trading:
The FVG Oscillator is intended as an analytical tool to complement your existing trading strategy. By offering a unique perspective on FVG occurrences and their potential market implications, the oscillator can help inform your trading decisions. However, traders are encouraged to combine this tool with other forms of analysis and employ sound risk management practices.
Originality and Usefulness:
This oscillator is original in its integration of FVG analysis with traditional oscillator metrics, offering traders a novel tool for market analysis. Its usefulness lies in its ability to provide a quantitative and visual representation of FVGs, aiding traders in identifying potential market movements.
Disclaimer:
It is important for traders to understand that the financial markets are inherently unpredictable, and the FVG Oscillator is not a predictive tool nor does it guarantee trading success. It should be used as part of a comprehensive trading strategy, incorporating additional market analysis and risk management practices. Remember, past performance does not necessarily predict future results, and trading involves risks, including the potential loss of capital.
ICT Unicorn Model [LuxAlgo]The ICT Unicorn Model indicator highlights the presence of "unicorn" patterns on the user's chart which is derived from the lectures of "The Inner Circle Trader" (ICT) .
Detected patterns are followed by targets with a distance controlled by the user.
🔶 USAGE
At its core, the ICT Unicorn Model relies on two popular concepts, Fair Value Gaps and Breaker Blocks. This combination highlights a future area of support/resistance.
A Bullish Unicorn Pattern consists out of:
A Lower Low (LL), followed by a Higher High (HH)
A Fair Value Gap (FVG), overlapping the established Breaker Block
A successful re-test of the FVG which confirms the pattern.
A Bearish Unicorn Pattern consists of:
A Higher High (HH), followed by a Lower Low (LL)
A Fair Value Gap (FVG), overlapping the established Breaker Block
A successful re-test of the FVG which confirms the pattern
The pattern detection depends on detected swings, which can be controlled by the Swing setting. Using higher values of this setting will return longer-term breaker blocks.
🔹 Using Risk/Reward Targets
A confirmed Unicorn pattern will show a blue ( Target ) / grey ( Stop Loss) "Risk/Reward" areas (RR).
When the Stop Loss or Target is hit, a white line is shown on the concerned side.
The Risk/Reward ratio can be adjusted in the "Targets" settings.
🔹 Trailing Stop
As seen in the previous snapshots, besides the RR areas, this indicator also includes an optional Trailing Stop .
This can be helpful to lower your risk, by exiting earlier than if you would wait until the Stop Loss is hit.
This example shows a successful bullish and bearish Unicorn Pattern . In this scenario, the Trailing Stop could be used for partial Take Profit.
The goal of this publication is to show confirmed Unicorn Patterns . To increase the chance of success, it is important to evaluate the bigger picture & use this in confluence with your price action analysis. For example, look for potential areas of liquidity, consider this pattern only during certain market sessions, avoid trading during heavy impact news, &/or incorporate other aspects of technical analysis rather than just following this pattern blindly.
🔶 DETAILS
🔹 Combine
When disabled, all potential Unicorn Patterns will delete previous unconfirmed patterns:
Enabling Combine ensures the last Unicorn Patterns in the opposite direction will remain.
While the latter bullish pattern became invalid, another one formed.
The combination of the previous bearish pattern, and looking at the big picture, the bullish pattern did not have much chance to be successful.
While disabling 'combine' helps minimize clutter, enabling this feature can give a pattern more chance to hit the SL/Target level.
🔹 Mitigated FVG
Users can determine if a pattern becomes invalid due to a mitigated FVG, causing the pattern to be deleted.
🔹 New pattern detected
When a new pattern is detected, the previous unconfirmed pattern in the same direction (bullish - bullish or bearish - bearish) will be deleted. This will always be the case, whether "Combine' is enabled or disabled.
When the previous pattern was confirmed but no SL or Target level was hit, this pattern will stop updating.
🔶 SETTINGS
🔹 Unicorn
Swings: This sets the length of swings, used for the underlying ZigZag and Unicorn Patterns detection.
Bull: Enable/disable Bullish patterns, and set the color of FVG box and Trailing Stop .
Bear: Enable/disable Bearish patterns, and set the color of FVG box and Trailing Stop .
Combine: When enabled, patterns in opposite directions (bullish/bearish) can exist at the same time. disabling this feature tends to give less clutter. See the "Usage" section for more information.
🔹 Targets
Risk/Reward: Sets the Risk/Reward ratio.
Trailing Stop: Set the length of small swings, which is used for the Trailing Stop .

Inverse FVG with Rejections [TFO]This indicator is made to look for Inverse Fair Value Gaps (IFVGs) and show rejections from relevant areas. Fair Value Gaps (FVGs) are created when there is an energetic move that leaves a gap between the preceding and following candle's wicks. When that area is violated, we may consider that area as an Inverse FVG, treating it along the lines of a "support turned resistance" type setup with proper context.
Once a Fair Value Gap (FVG) is found with sufficient user-defined displacement, it is saved until price fully closes through that area, at which point it becomes an IFVG, which is also saved until price once again closes through that area.
Users can select a specific time period from which to look for and save FVGs, such as during the New York trading session in the following example.
Lastly, users can enable rejections that look for swing lows in bullish FVGs/IFVGs and swing highs in bearish FVGs/IFVGs. The following picture shows an instance of rejections from both regular and inverse FVGs, meaning the pivots were formed in a mutually shared area between a FVG and IFVG.

Volume Gaps & Imbalances (Zeiierman)█ Overview
Volume Gaps & Imbalances (Zeiierman) is an advanced market-structure and order-flow visualizer that maps where the market traded, where it did not, and how buyer-vs-seller pressure accumulated across the entire price range.
The core of the indicator is a price-by-price volume profile built from Bullish and Bearish volume assignments. The script highlights:
True zero-volume voids (regions of no traded volume)
Bull/Bear imbalance rows (horizontal volume slices)
A multi-section Delta Panel, showing aggregated Buy–Sell pressure per vertical sector
A clean separation between profile structure, volume efficiency, and delta flows
Together, these components reveal market inefficiencies, displacement zones, and fair-value regions that price tends to revisit — making it an exceptional tool for structural trading, order-flow analysis, and contextual confluence.
Highlights
Identifies true volume voids (untraded price regions), more precisely than standard FVG tools
Plots Bull vs Bear volume at each price row for fine-grained imbalance reading
Includes a sector-based Delta Grid that aggregates Buy–Sell dominance
█ How It Works
⚪ Profile Construction
The indicator scans a user-defined Lookback window and divides the full high–low range into Rows. Each bar's volume is allocated into the correct price bucket:
Bullish volume when close > open
Bearish volume when close <= open
This produces three values per price level:
Bull Volume
Bear Volume
Total Volume & Imbalance Profile
Rows where no volume at all occurred are marked as volume gaps — signaling true untraded zones, often produced by impulsive imbalanced moves.
⚪ Zero-Volume Gaps (True Voids)
Unlike candle-based Fair Value Gaps (FVGs), volume gaps identify the deeper, structural inefficiency: Price moved so fast through a region that no trades occurred at those prices. These areas often attract revisits because liquidity never exchanged hands there.
⚪ Bull/Bear Volume Imbalance
Every price row is drawn using two colored horizontal segments:
Bull segment proportional to bullish volume
Bear segment proportional to bearish volume
This reveals where buyers or sellers dominated individual price levels.
⚪ Delta Panel
The full volume profile is cut into Summary Sections. For each block, the script computes: Δ = (Bull Volume − Bear Volume) ÷ Total Volume × 100%
█ How to Use
⚪ Spot True Voids & Inefficiencies
Zero-volume zones highlight where the price moved without trading. These areas often behave like:
Refill zones during retracements
Targets during displacement
Thin regions price slices through quickly
Ideal for both SMC-style trading and structural mapping.
⚪ Identify Bull/Bear Control at Each Price Level
Broad bullish segments show zones of buyer absorption, while wide bearish slices reveal seller control.
This helps you interpret:
Where buyers supported the price
Where sellers defended a level
Which price levels matter for continuation or reversal
⚪ Use Delta Sectors for Contextual Direction
The delta panel shows where market pressure is accumulating, revealing whether the profile is dominated by:
Bullish flow (positive delta)
Bearish flow (negative delta)
Neutral flow (balanced or minimal delta)
█ Settings
Lookback – Number of bars scanned to build the profile.
Rows – Vertical resolution of price bins.
Source – Price source used to assign volume into rows.
Summary Sections – Number of vertical delta sectors.
Summary Width – Horizontal size of the delta bar panel.
Gap From Profile – Distance between profile and delta grid.
Show Delta Text – Toggle Δ% labels.
-----------------
Disclaimer
The content provided in my scripts, indicators, ideas, algorithms, and systems is for educational and informational purposes only. It does not constitute financial advice, investment recommendations, or a solicitation to buy or sell any financial instruments. I will not accept liability for any loss or damage, including without limitation any loss of profit, which may arise directly or indirectly from the use of or reliance on such information.
All investments involve risk, and the past performance of a security, industry, sector, market, financial product, trading strategy, backtest, or individual's trading does not guarantee future results or returns. Investors are fully responsible for any investment decisions they make. Such decisions should be based solely on an evaluation of their financial circumstances, investment objectives, risk tolerance, and liquidity needs.

FVG Scanner ProFVG Scanner Pro — Smart Fair Value Gap Detector (with HTF context & proximity alerts)
What it does
FVG Scanner Pro automatically finds Fair Value Gaps (FVGs) on your current chart and (optionally) on a higher timeframe (HTF), draws them as color-coded zones, and notifies you when price comes close to a gap boundary using an ADR-based proximity trigger and (optional) volume confirmation. It’s designed for ICT-style gap trading, confluence building, and clean visual execution.
How it works:
FVG definition
* Bullish FVG (gap up): low > high (the current candle’s low is above the high 2 bars ago).
* Bearish FVG (gap down): high < low (the current candle’s high is below the low 2 bars ago).
* Gaps smaller than your Min FVG Size (%) are ignored. (Gap size = (top-bottom)/bottom * 100.)
Higher-timeframe logic (auto-selected)
The script auto picks a sensible HTF:
1–5m → 15m, 15m → 1H, 1H → 4H, 4H → 1D, 1D → 1W, 1W → 1M, small 1M → 3M, big ≥3M → 12M.
You can display HTF FVGs and even filter so current-TF FVGs only show when they overlap an HTF gap.
Proximity alerts (ADR-based)
The script computes ADR on the current chart timeframe over a user-set lookback (default 20 bars).
An alert fires when price moves toward the closest actionable boundary and comes within ADR × Multiplier:
Bullish: price moving down, within distance of the bottom of a bullish FVG.
Bearish: price moving up, within distance of the top of a bearish FVG.
Yellow ▲/▼ markers show where a proximity alert triggered.
Volume filter (optional)
Require volume to be greater than SMA(20) × multiplier to accept a newly formed FVG.
Lifecycle
Each gap remains active for Extend FVG Box (Bars) bars.
You can delete the box after fill, or keep filled gaps visible as gray zones, or hide them.
Color legend
Current-TF Bullish: Pink/Magenta box
Current-TF Bearish: Cyan/Turquoise box
HTF Bullish: Gold box
HTF Bearish: Orange box
Filled (if shown): Gray box
Alert markers: Yellow ▲ (bullish), Yellow ▼ (bearish)
Inputs (what to tweak)
Show FVGs: Bullish / Bearish / Both
Max Bars Back to Find FVG: collection window & cleanup guard
Extend FVG Box (Bars): how long a zone stays tradable/active
Min FVG Size (%): ignore micro gaps
Delete Box After Fill & Show Filled FVGs: choose how you want completed gaps handled
Show Alert Markers: show/hide the yellow proximity arrows
Show Higher Timeframe FVG: overlay HTF gaps (auto TF)
HTF Filter: only display current-TF gaps that overlap an HTF gap
ADR Lookback & Proximity Multiplier: tune alert sensitivity to your market & timeframe
Volume Filter & Volume > MA Multiple: require above-average volume for new gaps
Built-in alerts (ready to use)
Create alerts in TradingView (⚠️ “Once per bar” or “Once per bar close”, your choice) and select from:
🟢 Bullish FVG Proximity — price approaching a bullish gap bottom
🔴 Bearish FVG Proximity — price approaching a bearish gap top
✅ New Bullish FVG Formed
⚠️ New Bearish FVG Formed
The alert messages include the symbol and price; proximity markers are also plotted on chart.
Tips & best practices
Use FVGs with market structure (break of structure, swing points), order blocks, or liquidity pools for confluence.
On very low timeframes, raise Min FVG Size and/or lower Max Bars Back to reduce noise and keep things fast.
Extend FVG Box controls how long a zone is considered valid; align it with your holding horizon (scalp vs swing).
Information panel (top-right)
Shows your mode, current HTF, number of gaps in memory, active bull/bear counts, and current-TF ADR.

FVG 9:31–10:00 AM ETFVG 9:31–10:00 AM ET - Script Description
What This Script Does
This indicator finds **Fair Value Gaps (FVGs)** that form during the first 29 minutes of the U.S. stock market (9:31 AM to 10:00 AM Eastern Time). A Fair Value Gap is a price imbalance where there's a gap between candles that often becomes an important support or resistance level.
Key Features:
- **Time Window**: Only looks for FVGs between 9:31-10:00 AM ET (most important opening period)
- **One Per Day**: Finds only the first FVG that forms in this time window each day
- **Visual Display**: Draws a purple box around the gap with a clear "FVG" label
- **Price Tracking**: Monitors when price comes back to test the gap level
- **Alert System**: Sends notifications when price returns to the FVG zone
How FVGs Are Detected:
- **Bullish FVG**: When there's a gap up (low of middle candle is above high of 3rd candle back)
- **Bearish FVG**: When there's a gap down (high of middle candle is below low of 3rd candle back)
The 9:31-10:00 AM window is chosen because this is when institutions and algorithms create their biggest price moves right after market open, making these gaps very reliable.
Customization Options
User Settings
Extend FVG Box (Bars)
- **What it does**: Makes the purple box longer to the right
- **Default**: 0 (box ends right after the gap forms)
- **Options**: Any number from 0 to 100+
- **When to use**:
- Keep at 0 for clean historical view
- Set to 10-20 to track the gap during the current session
- Set higher for longer reference
Code Settings (Can Be Changed)
Time Window
- **Start**: 9:31 AM Eastern Time
- **End**: 10:00 AM Eastern Time
- **Can modify**: Change the hour/minute numbers in the code
Visual Style
- **Color**: Purple with see-through background
- **Label**: Shows "FVG" text in white
- **Can modify**: Change colors and transparency in the code
How to Use:
Setup
Chart Settings
1. Use 1-minute, 5-minute, or 15-minute charts (works best on these timeframes)
2. Apply to liquid markets like ES, NQ, major stocks, or forex pairs
3. Set the "Extend FVG Box" to your preference (start with 0 or 10)
What You'll See
- A purple box appears when an FVG forms during 9:31-10:00 AM
- Box shows the exact price levels of the gap
- "FVG" label appears on the box
- Only one FVG per day will be marked
Trading Strategies
Basic FVG Trading
1. **Wait for Formation**: Let the purple box appear during 9:31-10:00 AM
2. **Watch Price Movement**: See if price moves away from the gap
3. **Enter on Retest**: When price comes back to the purple box area, consider entering
4. **Trade Direction**:
- Bullish FVG = look for long opportunities when price retests
- Bearish FVG = look for short opportunities when price retests
Entry Methods
- **Bounce Play**: Enter when price touches the FVG box and bounces away
- **Break Play**: Enter if price strongly breaks through the FVG box
- **Rejection Play**: Enter opposite direction if price gets rejected at the FVG
Risk Management
Stop Losses
- Place stops just outside the FVG box (a few ticks beyond the gap)
- If trading a bounce, stop goes on opposite side of the gap
- If trading a break, stop goes back inside the gap
Position Sizing
- Start small until you understand how FVGs work in your market
- Bigger gaps = smaller position size (more risk)
- Smaller gaps = can use larger position size
Profit Targets
- Take profits at obvious levels like round numbers, previous highs/lows
- Consider taking half profits at 1:1 risk/reward ratio
- Let some position run if the move is strong
Best Practices
When It Works Best
- High-volume stocks and futures (ES, NQ work great)
- Normal market days without major news during the 9:31-10:00 window
- When there's clear institutional activity in the opening period
When to Be Careful
- Low-volume stocks or markets
- Major economic news releases during the time window
- Market holidays when volume is low
- Very choppy or sideways days
Alert Usage
- The script will alert you when price comes back to test the FVG
- Don't trade the alert blindly - always check the current market situation
- Use the alert as a heads-up to start watching the setup more closely
Tips for Success
- The earlier the FVG forms in the 9:31-10:00 window, often the more significant it is
- FVGs that form with high volume are usually more reliable
- Always consider the overall market direction - don't fight the main trend
- Practice on paper first to understand how FVGs behave in your chosen market
🔗 Works Best With:
✅ Liquidity Levels — Smart Swing Lows: Spot key structural lows that can fuel stop hunts and reversals.
✅ ICT Turtle Soup — Liquidity Reversal: Add a classic reversal pattern to your toolkit to catch fakeouts cleanly.
✅ ICT SMC Liquidity Grabs and OBs- Liquidity Grabs, Order Block Zones, and Fibonacci OTE Levels, allowing traders to identify institutional entry models with clean, rule-based visual signals.
This script is most valuable for day traders who want to catch institutional moves right after market open, but it can also help swing traders identify important intraday levels.
✅ ICT Macro Zones (Grey Box Version)- It tracks real-time highs and lows for each Silver Bullet session.
✅ Weekly Opening Gap (cryptonnnite)

Logistic Regression ICT FVG🚀 OVERVIEW
Welcome to the Logistic Regression Fair Value Gap (FVG) System — a next-gen trading tool that blends precision gap detection with machine learning intelligence.
Unlike traditional FVG indicators, this one evolves with each bar of price action, scoring and filtering gaps based on real market behavior.
🔧 CORE FEATURES
✨ Smart Gap Detection
Automatically identifies bullish and bearish Fair Value Gaps using volatility-aware candle logic.
📊 Probability-Based Filtering
Uses logistic regression to assign each gap a confidence score (0 to 1), showing only high-probability setups.
🔁 Real-Time Retest Tracking
Continuously watches how price interacts with each gap to determine if it deserves respect.
📈 Multi-Factor Assessment
Evaluates RSI, MACD, and body size at gap formation to build a full context snapshot.
🧠 Self-Learning Engine
The logistic regression model updates on each bar using gradient descent, refining its predictions over time.
📢 Built-In Alerts
Get instant alerts when a gap forms, gets retested, or breaks.
🎨 Custom Display Options
Control the color of bullish/bearish zones, and toggle on/off probability labels for cleaner charts.
🚩 WHAT MAKES IT DIFFERENT
This isn’t just another box-drawing indicator.
While others mark every imbalance, this system thinks before it draws — using statistical modeling to filter out noise and prioritize high-impact zones.
By learning from how price behaves around gaps (not just how they form), it helps you trade only what matters — not what clutters.
⚙️ HOW IT WORKS
1️⃣ Detection
FVGs are identified using ATR-based thresholds and sharp wick imbalances.
2️⃣ Behavior Monitoring
Every gap is tracked — and if respected enough times, it becomes part of the elite training set.
3️⃣ Context Capture
Each new FVG logs RSI, MACD, and body size to provide a feature-rich context for prediction.
4️⃣ Prediction (Logistic Regression)
The model predicts how likely the gap is to be respected and assigns it a probability score.
5️⃣ Classification & Alerts
Gaps above the threshold are plotted with score labels, and alerts trigger for entry/respect/break.
⚙️ CONFIGURATION PANEL
🔧 System Inputs
• Max Retests – How many times a gap must be respected to train the model
• Prediction Threshold – Minimum score to show a gap on the chart
• Learning Rate – Controls how fast the model adapts (default: 0.009)
• Max FVG Lifetime – Expiration duration for unused gaps
• Show Historic Gaps – Show/hide expired or invalidated gaps
🎨 Visual Options
• Bullish/Bearish Colors – Set gap colors to fit your chart style
• Confidence Labels – Show probability scores next to FVGs
• Alert Toggles – Enable alerts for:
– New FVG detected
– FVG respected (entry)
– FVG invalidated (break)
💡 WHY LOGISTIC REGRESSION?
Traditional FVG tools rely on candle shapes.
This system relies on probability — by training on RSI, MACD, and price behavior, it predicts whether a gap will act as a true liquidity zone.
Logistic regression lets the system continuously adapt using new data, making it more accurate the longer it runs.
That means smarter signals, fewer false positives, and a clearer view of where real opportunities lie.

FVG MTF Consensus OscillatorFVG MTF Consensus Oscillator
A multi-timeframe, multi-component oscillator that combines momentum, deviation, and slope analysis across multiple timeframes using Zeiierman's Chebyshev-filtered trend calculation. This indicator identifies potential turning points with zone-based signal classification and timeframe consensus filtering.
Backed by ML/Deep Learning evaluation on ES Futures data from 2015-2024.
🎯 Concept
Traditional oscillators suffer from two major weaknesses:
Single measurement - relying on one metric makes them susceptible to noise
Single timeframe - missing the bigger picture leads to fighting the trend
The FVG MTF Consensus Oscillator addresses both issues by combining three independent measurements across three timeframes into a weighted consensus signal.
The Three Components
Momentum - How fast is the trend moving?
Deviation - How far has price stretched from the trend?
Slope - What is the short-term directional bias?
The Three Timeframes
TF1 (Chart) - Your current chart timeframe (lowest weight)
TF2 (Medium) - Typically 1H or 4H (medium weight)
TF3 (High) - Typically 4H or Daily (highest weight)
By requiring agreement across multiple components AND multiple timeframes, the oscillator filters out noise while capturing meaningful, high-probability market movements.
🔧 How It Works
The Core: Chebyshev Type 1 Filter
At its heart, this indicator uses a Chebyshev Type 1 low-pass filter (inspired by Zeiierman's FVG Trend) to extract a clean trend line from price action. Unlike simple moving averages, the Chebyshev filter offers:
Sharper cutoff between trend and noise
Minimal lag for a given smoothness level
Controlled overshoot via the ripple parameter
Three Oscillator Components
1. Momentum Component
Momentum = Current Trend Value - Previous Trend Value
Measures the velocity of the trend. High positive values indicate strong upward acceleration, while high negative values show downward acceleration.
2. Deviation Component
Deviation = Close Price - Trend Value
Measures how far price has stretched away from the trend line. Useful for identifying overextended conditions and mean reversion opportunities.
3. Slope Component
Slope = Change in Trend over 3 bars
Captures the short-term directional bias of the trend itself, helping confirm trend changes.
Normalization & Component Consensus
Each component is individually normalized to a -100 to +100 scale using adaptive scaling. The oscillator output is a weighted average of all three components, allowing you to emphasize different aspects based on your trading style.
Multi-Timeframe Weighting
The final oscillator value combines all three timeframes using configurable weights:
Combined = (TF1 × Weight1 + TF2 × Weight2 + TF3 × Weight3) / Total Weight
Default weights (1, 2, 3) ensure higher timeframes have more influence, keeping you aligned with the dominant trend while timing entries on lower timeframes.
📊 Zone System
The oscillator uses a fuzzy zone system to classify market conditions:
ZoneRangeInterpretationSignal ColorNeutral-5 to +5No clear bias, avoid tradingGrayContinuation±5 to ±25Trend pullback, continuation setupsAquaDeep Swing±25 to ±50Extended move, stronger setupsGreenReversalBeyond ±50Extreme extension, reversal potentialOrange
When "Show Zone Background" is enabled, the background shading darkens as the oscillator moves into more extreme zones, providing instant visual feedback.
📈 Signal Interpretation
Turn Signals
The indicator plots triangular markers when the oscillator changes direction:
▲ Triangle Up (bottom): Oscillator turning up from a low
▼ Triangle Down (top): Oscillator turning down from a high
Signal Quality by Zone
Not all signals are equal. The signal color indicates which zone the turn occurred in:
ColorZoneProbabilityBest UseGrayNeutralLowAvoid or use very tight stopsAquaContinuationModerateTrend continuation entriesGreenDeep SwingHigherSwing trade entriesOrangeReversalHighestCounter-trend with caution
Timeframe Consensus Filter
Signals only fire when the required number of timeframes agree on direction. With default settings (TF Consensus = 2), at least 2 of 3 timeframes must be moving in the same direction for a signal to trigger.
This prevents:
Taking longs when higher timeframes are bearish
Taking shorts when higher timeframes are bullish
Whipsaws during timeframe disagreement
Trend Coloring
The combined oscillator line changes color based on trend direction:
Light purple (RGB 240, 174, 252): Majority of timeframes trending up
Dark purple (RGB 84, 19, 95): Majority of timeframes trending down
Info Table
When MTF is enabled, a table in the top-right corner displays:
Current oscillator values for each timeframe (TF1, TF2, TF3)
Combined value (CMB)
Color coding: Green = rising, Red = falling
⚙️ Settings Guide
Timeframe Settings
SettingDefaultDescriptionEnable Multi-TimeframeOnMaster switch for MTF functionalityTF1 (Chart)"" (current)First timeframe, typically your chart TFTF2 (Medium)60Second timeframe, typically 1HTF3 (High)240Third timeframe, typically 4HTF1/TF2/TF3 Weight1 / 2 / 3Influence of each TF on combined signal
Timeframe Tips:
Keep TF1 ≤ TF2 ≤ TF3 (ascending order)
For day trading: 5m / 15m / 1H
For swing trading: 1H / 4H / Daily
For position trading: 4H / Daily / Weekly
Display Settings
SettingDefaultDescriptionShow All TimeframesOffDisplay individual TF oscillator linesShow Combined LineOnDisplay the weighted combined oscillatorShow Zone BackgroundOffShade background based on current zone
Trend Filter Settings
SettingDefaultDescriptionTrend Ripple4.0Filter responsiveness (1-10). Higher = faster but more overshootTrend Cutoff0.1Cutoff frequency (0.01-0.5). Lower = smoother trendNormalization Length50Lookback for scaling. Longer = more stable
Component Weights
SettingDefaultDescriptionMomentum Weight1.0Emphasis on trend speedDeviation Weight1.0Emphasis on price stretch from trendSlope Weight1.0Emphasis on short-term trend direction
Component Tips:
For trend-following: Increase Momentum and Slope weights
For mean reversion: Increase Deviation weight
Set any weight to 0 to disable that component
Zone Thresholds
SettingDefaultDescriptionNeutral Zone5Inner boundary (±5 = neutral)Continuation Zone25Middle boundary for continuation setupsDeep Swing Zone50Outer boundary for reversal zone
Adjust based on instrument volatility. More volatile instruments may need wider zones.
Signal Filters
SettingDefaultDescriptionSignal Cooldown3Minimum bars between signalsMin Turn Size2.0Minimum oscillator change for valid turnTF Consensus Required2Minimum TFs agreeing for signal (1-3)
💡 Usage Examples
Example 1: Trend Continuation (Dip Buying)
Setup: Uptrend confirmed by higher timeframes
Check the info table - TF2 and TF3 should show green (rising)
Wait for TF1 to pull back, oscillator enters Continuation zone
Enter on Aqua ▲ signal (turn up with TF consensus)
Stop below recent swing low
Target: Previous high or next resistance
Why it works: You're buying a dip in an established uptrend with multi-timeframe confirmation.
Example 2: Deep Swing Entry
Setup: Extended move showing exhaustion
Oscillator reaches Deep Swing zone (±25 to ±50)
At least 2 TFs start showing the same direction
Enter on Green signal indicating momentum exhaustion
Use tighter stop as the move is already extended
Target: Return to Continuation zone or trend line
Why it works: Extended moves tend to mean-revert. The zone system identifies these opportunities.
Example 3: Reversal Setup (Advanced)
Setup: Extreme extension with diverging timeframes
Oscillator reaches Reversal zone (beyond ±50)
Watch for TF1 to turn while TF3 is still extended
Enter on Orange signal - this is counter-trend!
Use smaller position size and wider stops
Target: Return to Deep Swing or Continuation zone
Why it works: Extreme extensions eventually correct. The orange signal marks high-probability reversal points.
Example 4: Avoiding Bad Trades
What to avoid:
Gray signals in Neutral zone - No edge, random noise
Signals against TF3 direction - Fighting the dominant trend
Signals without TF consensus - Timeframe disagreement = choppy market
Multiple signals in quick succession - Let cooldown filter work
🔬 Multi-Timeframe Analysis Tips
Reading the Info Table
The info table shows real-time oscillator values:
| TF1 | TF2 | TF3 | CMB |
| 23.5 | 45.2 | 67.8 | 52.1 |
All green: Strong uptrend across all timeframes
All red: Strong downtrend across all timeframes
Mixed colors: Potential transition or consolidation
Timeframe Alignment States
TF1TF2TF3Interpretation↑↑↑Strong bull - look for long entries↓↓↓Strong bear - look for short entries↑↑↓Pullback in downtrend - caution on longs↓↓↑Pullback in uptrend - caution on shorts↑↓↑Choppy - reduce position size↓↑↓Choppy - reduce position size
The Power of Consensus
With TF Consensus = 2, signals only fire when 2+ timeframes agree. This single filter eliminates most whipsaws and keeps you aligned with the dominant trend.
For more conservative trading, set TF Consensus = 3 (all timeframes must agree).
⚠️ Important Notes
This indicator does not predict the future. It measures current market conditions and momentum across multiple timeframes.
Always use proper risk management. No indicator is 100% accurate.
Combine with price action. The oscillator works best when confirmed by support/resistance, candlestick patterns, or other confluence factors.
Respect the higher timeframe. When TF3 disagrees, trade smaller or sit out.
Zone signals are probabilistic. Orange (reversal) signals have higher probability but aren't guaranteed reversals.
Adjust settings per instrument. Default settings are optimized for ES Futures but may need tuning for other markets.
🧪 ML/Deep Learning Background
The default parameters and zone thresholds were evaluated using machine learning techniques on ES Futures data spanning 2015-2024. This included:
Optimization of component weights
Zone threshold calibration
Timeframe weight balancing
Signal filter tuning
While past performance doesn't guarantee future results, the parameters represent a data-driven starting point rather than arbitrary defaults.
🙏 Credits
This indicator is inspired by Zeiierman's Multitimeframe Fair Value Gap (FVG) indicator, specifically utilizing concepts from his Chebyshev Type 1 filter implementation for trend calculation.
Original indicator: Multitimeframe Fair Value Gap – FVG (Zeiierman)
📝 Changelog
v1.0
Initial release
Three-component consensus oscillator (Momentum, Deviation, Slope)
Multi-timeframe support with weighted combination
Fuzzy zone classification system
Configurable component and timeframe weights
TF consensus filter for signal quality
Signal cooldown and minimum turn size filters
Real-time info table with TF values
Optional zone background shading

Smart Money Toolkit - PD Engine Bias Map [KedArc Quant]Description
Smart Money is an advanced multi-layer Smart Money Concepts framework that automatically detects structure shifts, premium-discount zones, and institutional order flow.
It is built around the PD Engine, which calculates the midpoint of the most recent market swing and dynamically determines BUY or SELL bias based on where current price trades relative to that equilibrium. This toolkit visualizes structure, order blocks, and bias context in one clean map, giving traders an institutional-grade view without unnecessary signal clutter.
Why It Is Unique
- All CHoCH, BOS, Order Block, FVG, and PD logic are coded from scratch.
- Uses true equilibrium (50 percent PD midpoint) for dynamic bias.
- Optimized for stability and non-repainting behavior.
- Designed for clarity with minimal, performance-safe visuals.
Entry and Exit Logic (Discretionary Framework)
- This toolkit is not a signal generator. It provides market context that guides discretionary trading.
BUY Bias (Discount Zone)
- Price trades below PD Mid: the market is in discount.
- Wait for a bullish CHoCH or reaction from a demand OB or FVG before buying.
- Target 1 = PD Mid. Target 2 = next opposite OB or FVG.
SELL Bias (Premium Zone)
- Price trades above PD Mid: the market is in premium.
- Wait for a bearish CHoCH or reaction from a supply OB or FVG before shorting.
- Target 1 = PD Mid. Target 2 = next opposite OB or FVG.
Institutional concept sequence: Bias → Structure Shift → Confirmation → Execution.
Input Configuration
Swing Sensitivity - Determines how far back to identify HH and LL pivots.
OB / FVG Detection - Toggles visual Order Block or Fair Value Gap zones.
PD Engine - Shows PD midpoint line, zone shading, and bias table.
Multi-TF Bias Sync - Optionally reads a higher timeframe bias for confirmation.
Color Themes - Switch between light, dark, or institutional palettes.
Formula / Logic Summary
Concept Formula
PD Mid (Equilibrium) (Recent Swing High + Recent Swing Low) / 2
BUY Bias close < PD Mid
SELL Bias close > PD Mid
CHoCH / BOS Pivot-based structure reversal: HH→LL or LL→HH
Order Block Last bullish or bearish candle before displacement.
FVG Gap between prior candle high/low and next candle range.
These formulas follow the structure used in institutional Smart Money Concepts.
How It Helps Traders
- Shows institutional premium and discount zones visually.
- Defines clear directional bias before entry.
- Combines structure, order blocks, FVG, and equilibrium in one layout.
- Works on any timeframe or asset.
- Prevents emotional trades by giving objective bias context.
Glossary
PD Mid Midpoint between recent swing high and low (market fair value).
Premium Zone Price above PD Mid; sellers control.
Discount Zone Price below PD Mid; buyers control.
CHoCH Change of Character, first reversal signal.
BOS Break of Structure, trend continuation confirmation.
OB Order Block, last institutional candle before move.
FVG Fair Value Gap, price imbalance often revisited.
FAQ
Q: Is this a signal indicator?
A: No. It is a contextual framework that supports manual decision-making.
Q: Does it repaint?
A: No. All structure logic is confirmed on bar close.
Q: Does it work on all markets?
A: Yes. It is purely price-based and timeframe independent.
Q: When does bias change?
A: Only after a new confirmed swing high or low.
Q: Can it be backtested?
A: You can build strategies on top of this context using your own entry and exit rules.
Disclaimer
This script is provided for educational purposes only.
It is not financial advice.
Trading carries risk. Past performance does not guarantee future results.
Use proper risk management and test on demo accounts before applying to live markets.

Liquidity Swap Detector Ultimate - Cedric JeanjeanAdvanced Smart Money Concepts indicator designed to detect high-probability liquidity sweeps and institutional order flow reversals. This professional-grade tool combines multiple ICT (Inner Circle Trader) strategies to identify optimal entry points.
═══════════════════════════════════════════════════════
📊 KEY FEATURES:
✅ Smart Swing Detection
- Identifies confirmed swing highs and lows using adaptive lookback periods
- Eliminates false signals through double-confirmation logic
- Detects liquidity grabs at key market structure points
✅ Fair Value Gap (FVG) Analysis
- Multi-timeframe FVG detection for enhanced accuracy
- Filters imbalances by minimum size threshold
- Combines current timeframe and higher timeframe FVGs
✅ Advanced Volatility Filter
- ATR-based volatility analysis to avoid low-quality setups
- Adjustable volatility threshold (default 0.35%)
- Ensures entries during optimal market conditions
✅ Precision Signal Generation
- LONG signals: Confirmed swing lows + FVG + volatility confirmation
- SHORT signals: Confirmed swing highs + FVG + volatility confirmation
- Clear visual markers with price labels
✅ Comprehensive Alert System
- Three alert types: Simple, Detailed, JSON (for webhooks)
- Separate LONG/SHORT alert controls
- Compatible with MT5 integration via webhooks
- TradingView native alertcondition support
✅ Professional Dashboard
- Real-time ATR monitoring
- Volatility percentage display
- FVG status indicator
- Alert status tracker
═══════════════════════════════════════════════════════
⚙️ CUSTOMIZABLE PARAMETERS:
🔹 Lookback Swing (1-50): Defines swing detection sensitivity
🔹 ATR Multiplier: Controls wick filter strength
🔹 Volatility Filter: Minimum required market volatility (%)
🔹 FVG Filter: Minimum fair value gap size (%)
🔹 FVG Timeframe: Higher timeframe for multi-TF analysis
🔹 Visual Options: Toggle swing marks, FVG zones, labels
🔹 Alert Controls: Enable/disable LONG/SHORT notifications
═══════════════════════════════════════════════════════
📈 HOW IT WORKS:
1. The indicator scans for confirmed swing points using a robust double-confirmation algorithm
2. Simultaneously analyzes Fair Value Gaps on both current and higher timeframes
3. Validates market volatility to ensure sufficient price movement
4. Generates precise entry signals when all conditions align
5. Triggers customizable alerts for instant notification
═══════════════════════════════════════════════════════
🎯 BEST PRACTICES:
- Use on liquid markets (Forex majors, indices, crypto)
- Recommended timeframes: 15m, 1H, 4H
- Combine with support/resistance for confirmation
- Adjust lookback period based on market volatility
- Test alert settings before live trading
- Use JSON alerts for automated trading integration
═══════════════════════════════════════════════════════
⚡ ALERT CONFIGURATION:
1. Click the Alert icon (bell) in TradingView
2. Select "Liquidity Swap Detector Ultimate - TITAN v6"
3. Choose your preferred alert condition:
- LONG Signal: Only bullish setups
- SHORT Signal: Only bearish setups
- ANY Signal: All trading opportunities
4. Set expiration and notification preferences
5. For MT5 integration: Select "JSON" message type and configure webhook URL

SMC Structures and Multi-Timeframe FVG PYSMC Structures and Multi-Timeframe FVG Indicator
Tip: For optimal performance, adjust the number of FVGs displayed per timeframe in the settings. On high-performance devices, up to 8 FVGs per timeframe can be used without issues. If you experience slowdowns, reduce to 3 or 4 FVGs per timeframe. If the chart flashes, disable indicators one by one to identify conflicts, or try using the TradingView Mobile or Windows App for a smoother experience.
Overview
This Pine Script indicator enhances market analysis by integrating Smart Money Concepts (SMC) with Fair Value Gaps (FVG) across multiple timeframes. It identifies trend continuations (Break of Structure, BOS) and trend reversals (Change of Character, CHoCH) while highlighting liquidity zones through FVG detection. The indicator includes eight customizable Moving Average (MA) curve templates, disabled by default, to complement SMC and FVG analysis. Its originality lies in combining multi-timeframe FVG detection with SMC structure analysis, providing traders with a cohesive tool to visualize price action patterns and liquidity zones efficiently.
Features and Functionality
1. Fair Value Gaps (FVG)
The indicator detects and displays bullish, bearish, and mitigated FVGs, representing liquidity zones where price inefficiencies occur. These gaps are dynamically updated based on price action:
Bullish FVG: Displayed in green when unmitigated, indicating potential upward liquidity zones.
Bearish FVG: Displayed in red when unmitigated, signaling potential downward liquidity zones.
Mitigated FVG: Shown in gray once the gap is partially filled by price action.
Fully Mitigated FVG: Automatically removed from the chart when the gap is fully filled, reducing visual clutter.
Users can customize the number of historical FVGs displayed via the settings, allowing focus on recent liquidity zones for targeted analysis.
2. SMC Structures
The indicator identifies key SMC price action patterns:
Break of Structure (BOS): Marked with gray lines, indicating trend continuation when price breaks a significant high or low.
Change of Character (CHoCH): Highlighted with yellow lines, signaling potential trend reversals when price fails to maintain the current structure.
High/Low Values: Blue lines denote the highest high and lowest low of the current structure, providing reference points for market context.
3. Multi-Timeframe FVG Analysis
A standout feature is the ability to analyze FVGs across multiple timeframes simultaneously. This allows traders to align higher-timeframe liquidity zones with lower-timeframe entries, improving trade precision. The indicator fetches FVG data from user-selected timeframes, displaying them cohesively on the chart.
4. Moving Average (MA) Templates
The indicator includes eight customizable MA curve templates in the Settings > Template section, disabled by default. These templates allow users to overlay MAs (e.g., SMA, EMA, WMA) to complement SMC and FVG analysis. Each template is pre-configured with different periods and types, enabling quick adaptation to various trading strategies, such as trend confirmation or dynamic support/resistance.
How It Works
The script processes price action to detect FVGs by analyzing three-candle patterns where a gap forms between the high/low of the first and third candles. Multi-timeframe data is retrieved using Pine Script’s request.security() function, ensuring accurate FVG plotting across user-defined timeframes. BOS and CHoCH are identified by tracking swing highs and lows, with logic to differentiate trend continuation from reversals. The MA templates are computed using standard Pine Script TA functions, with user inputs controlling visibility and parameters.
How to Use
Add to Chart: Apply the indicator to any TradingView chart.
Configure Settings:
FVG Settings: Adjust the number of historical FVGs to display (default: 10). Enable/disable specific FVG types (bullish, bearish, mitigated).
Timeframe Selection: Choose up to three timeframes for FVG analysis (e.g., 1H, 4H, 1D) to align with your trading strategy.
Structure Settings: Toggle BOS (gray lines) and CHoCH (yellow lines) visibility. Adjust sensitivity for structure detection if needed.
MA Templates: Enable MA curves via the Template section. Select from eight pre-configured MA types and periods to suit your analysis.
Interpret Signals:
Use green/red FVGs for potential entry points targeting liquidity zones.
Monitor gray lines (BOS) for trend continuation and yellow lines (CHoCH) for reversal signals.
Align multi-timeframe FVGs with BOS/CHoCH for high-probability setups.
Optionally, use MA curves for trend confirmation or dynamic levels.
Clean Chart Usage: The indicator is designed to work standalone. Ensure no conflicting scripts are applied unless explicitly needed for your strategy.
Why This Indicator Is Unique
Unlike standalone FVG or SMC indicators, this script combines both concepts with multi-timeframe analysis, offering a comprehensive view of market structure and liquidity. The addition of customizable MA templates enhances flexibility, while the dynamic removal of mitigated FVGs keeps the chart clean. This mashup is purposeful, as it integrates complementary tools to streamline decision-making for traders using SMC strategies.
Credits
This indicator builds on foundational SMC and FVG concepts from the TradingView community. Some open-source code was reused, and do performance enhancement as you guys can read the code. This type of indicators has inspiration was drawn from public domain SMC methodologies. All code is partly original with manual work on performance optimization in Pine Script.
Notes
Ensure your chart is clean (no unnecessary drawings or indicators) to maximize clarity.
The indicator is open-source, and traders are encouraged to review the code for deeper understanding.
For optimal use, test the indicator on a demo account to familiarize yourself with its signals.

The Best Strategy Template[LuciTech]Hello Traders,
This is a powerful and flexible strategy template designed to help you create, backtest, and deploy your own custom trading strategies. This template is not a ready-to-use strategy but a framework that simplifies the development process by providing a wide range of pre-built features and functionalities.
What It Does
The LuciTech Strategy Template provides a robust foundation for building your own automated trading strategies. It includes a comprehensive set of features that are essential for any serious trading strategy, allowing you to focus on your unique trading logic without having to code everything from scratch.
Key Features
The LuciTech Strategy Template integrates several powerful features to enhance your strategy development:
•
Advanced Risk Management: This includes robust controls for defining your Risk Percentage per Trade, setting a precise Risk-to-Reward Ratio, and implementing an intelligent Breakeven Stop-Loss mechanism that automatically adjusts your stop to the entry price once a specified profit threshold is reached. These elements are crucial for capital preservation and consistent profitability.
•
Flexible Stop-Loss Options: The template offers adaptable stop-loss calculation methods, allowing you to choose between ATR-Based Stop-Loss, which dynamically adjusts to market volatility, and Candle-Based Stop-Loss, which uses structural price points from previous candles. This flexibility ensures the stop-loss strategy aligns with diverse trading styles.
•
Time-Based Filtering: Optimize your strategy's performance by restricting trading activity to specific hours of the day. This feature allows you to avoid unfavorable market conditions or focus on periods of higher liquidity and volatility relevant to your strategy.
•
Customizable Webhook Alerts: Stay informed with advanced notification capabilities. The template supports sending detailed webhook alerts in various JSON formats (Standard, Telegram, Concise Telegram) to external platforms, facilitating real-time monitoring and potential integration with automated trading systems.
•
Comprehensive Visual Customization: Enhance your analytical clarity with extensive visual options. You can customize the colors of entry, stop-loss, and take-profit lines, and effectively visualize market inefficiencies by displaying and customizing Fair Value Gap (FVG) boxes directly on your chart.
How It Does It
The LuciTech Strategy Template is meticulously crafted using Pine Script, TradingView's powerful and expressive programming language. The underlying architecture is designed for clarity and modularity, allowing for straightforward integration of your unique trading signals. At its core, the template operates by taking user-defined entry and exit conditions and then applying a sophisticated layer of risk management, position sizing, and trade execution logic.
For instance, when a longCondition or shortCondition is met, the template dynamically calculates the appropriate position size. This calculation is based on your specified risk_percent of equity and the stop_distance (the distance between your entry price and the calculated stop-loss level). This ensures that each trade adheres to your predefined risk parameters, a critical component of disciplined trading.
The flexibility in stop-loss calculation is achieved through a switch statement that evaluates the sl_type input. Whether you choose an ATR-based stop, which adapts to market volatility, or a candle-based stop, which uses structural price points, the template seamlessly integrates these methods. The ATR calculation itself is further refined by allowing various smoothing methods (RMA, SMA, EMA, WMA), providing granular control over how volatility is measured.
Time-based filtering is implemented by comparing the current bar's time with user-defined start_hour, start_minute, end_hour, and end_minute inputs. This allows the strategy to activate or deactivate trading during specific market sessions or periods of the day, a valuable tool for optimizing performance and avoiding unfavorable conditions.
Furthermore, the template incorporates advanced webhook alert functionality. When a trade is executed, a customizable JSON message is formatted based on your webhook_format selection (Standard, Telegram, or Concise Telegram) and sent via alert function. This enables seamless integration with external services for real-time notifications or even automated trade execution through third-party platforms.
Visual feedback is paramount for understanding strategy behavior. The template utilizes plot and fill functions to clearly display entry prices, stop-loss levels, and take-profit targets directly on the chart. Customizable colors for these elements, along with dedicated options for Fair Value Gap (FVG) boxes, enhance the visual analysis during backtesting and live trading, making it easier to interpret the strategy's actions.
How It's Original
The LuciTech Strategy Template distinguishes itself in the crowded landscape of TradingView scripts through its unique combination of integrated, advanced risk management features, highly flexible stop-loss methodologies, and sophisticated alerting capabilities, all within a user-friendly and modular framework. While many templates offer basic entry/exit signal integration, LuciTech goes several steps further by providing a robust, ready-to-use infrastructure for managing the entire trade lifecycle once a signal is generated.
Unlike templates that might require users to piece together various risk management components or code complex stop-loss logic from scratch, LuciTech offers these critical functionalities out-of-the-box. The inclusion of dynamic position sizing based on a user-defined risk percentage, a configurable risk-to-reward ratio, and an intelligent breakeven mechanism significantly elevates its utility. This comprehensive approach to capital preservation and profit targeting is a cornerstone of professional trading and is often overlooked or simplified in generic templates.
Furthermore, the template's provision for multiple stop-loss calculation types—ATR-based for volatility adaptation, and candle-based for structural support/resistance—demonstrates a deep understanding of diverse trading strategies. The underlying code for these calculations is already implemented, saving developers considerable time and effort. The subtle yet powerful inclusion of FVG (Fair Value Gap) related inputs also hints at advanced price action concepts, offering a sophisticated layer of analysis and execution that is not commonly found in general-purpose templates.
The advanced webhook alerting system, with its support for various JSON formats tailored for platforms like Telegram, showcases an originality in catering to the needs of modern, automated trading setups. This moves beyond simple TradingView pop-up alerts, enabling seamless integration with external systems for real-time trade monitoring and execution. This level of external connectivity and customizable data output is a significant differentiator.
In essence, the LuciTech Strategy Template is original not just in its individual features, but in how these features are cohesively integrated to form a powerful, opinionated, yet highly adaptable system. It empowers traders to focus their creative energy on developing their core entry/exit signals, confident that the underlying framework will handle the complexities of risk management, trade execution, and external communication with precision and flexibility. It's a comprehensive solution designed to accelerate the development of robust and professional trading strategies.
How to Modify the Logic to Apply Your Strategy
The LuciTech Strategy Template is designed with modularity in mind, making it exceptionally straightforward to integrate your unique trading strategy logic. The template provides a clear separation between the core strategy management (risk, position sizing, exits) and the entry signal generation. This allows you to easily plug in your own buy and sell conditions without altering the robust underlying framework.
Here’s a step-by-step guide on how to adapt the template to your specific trading strategy:
1.
Locate the Strategy Logic Section:
Open the Pine Script editor in TradingView and navigate to the section clearly marked with the comment //Strategy Logic Example:. This is where the template’s placeholder entry conditions (a simple moving average crossover) are defined.
2.
Define Your Custom Entry Conditions:
Within this section, you will find variables such as longCondition and shortCondition. These are boolean variables that determine when a long or short trade should be initiated. Replace the existing example logic with your own custom buy and sell conditions. Your conditions can be based on any combination of indicators, price action patterns, candlestick formations, or other market analysis techniques. For example, if your strategy involves a combination of RSI and MACD, you would define longCondition as (rsi > 50 and macd_line > signal_line) and shortCondition as (rsi < 50 and macd_line < signal_line).
3.
Leverage the Template’s Built-in Features:
Once your longCondition and shortCondition are defined, the rest of the template automatically takes over. The integrated risk management module will calculate the appropriate position size based on your Risk % input and the chosen Stop Loss Type. The Risk:Reward ratio will determine your take-profit levels, and the Breakeven at R feature will manage your stop-loss dynamically. The time filter (Use Time Filter) will ensure your trades only occur within your specified hours, and the webhook alerts will notify you of trade executions.

Market Imbalance Tracker (Inefficient Candle + FVG)# 📊 Overview
This indicator combines two imbalance concepts:
• **Squared Up Points (SUP)** – midpoints of large, "inefficient" candles that often attract price back.
• **Fair Value Gaps (FVG)** – 3-candle gaps created by strong impulse moves that often get "filled."
Use them separately or together. Confluence between a SUP line and an FVG boundary/midpoint is high-value.
---
# ⚡ Quick Start (2 minutes)
1. **Add to chart** → keep defaults (Percentile method, 80th percentile, 100-bar lookback).
2. **Watch** for dashed SUP lines to print after large candles.
3. **Toggle Show FVG** → see green/red boxes where gaps exist.
4. **Turn on alerts** → New SUP created, SUP touched, New FVG.
5. **Trade the reaction** → look for confluence (SUP + FVG + S/R), then manage risk.
---
# 🛠 Features
## 🔹 Squared Up Points (SUP)
• **Purpose:** Midpoint of a large candle → potential support/resistance magnet.
• **Detection:** Choose *Percentile* (adaptive) or *ATR Multiple* (absolute).
• **Validation:** Only plots if the preceding candle does not touch the midpoint (with tolerance).
• **Lifecycle:** Line auto-extends into the future; it's removed when touched or aged out.
• **Visual:** Horizontal dashed line (color/width configurable; style fixed to dashed if not exposed).
## 🔹 Fair Value Gaps (FVG)
• **Purpose:** 3-candle gaps from an impulse; price often revisits to "fill."
• **Detection:** Requires a strong directional candle (Marubozu threshold) creating a gap.
• **Types:**
- **Bullish FVG (Green):** Gap below; expectation is downward fill.
- **Bearish FVG (Red):** Gap above; expectation is upward fill.
• **Close Rules (if implemented):**
- *Full Fill:* Gap closes when the opposite boundary is tagged.
- *Midpoint Fill:* Gap closes when its midpoint is tagged.
• **Visual:** Colored boxes; optional split-coloring to emphasize the midpoint.
> **Note:** If a listed FVG option isn't visible in Inputs, you're on a lighter build; use the available switches.
---
# ⚙️ Settings
## SUP Settings
• **Candle Size Method:** Percentile (top X% of recent ranges) or ATR Multiple.
• **Candle Size Percentile:** e.g., 80 → top 20% largest candles.
• **ATR Multiple & Period:** e.g., 1.5 × ATR(14).
• **Percentile Lookback:** Bars used to compute percentile.
• **Lookback Period:** How long SUP lines remain eligible before auto-cleanup.
• **Touch Tolerance (%):** Buffer based on the inefficient candle's range (0% = exact touch).
## Line Appearance
• **Line Color / Width:** Customizable.
• **Style:** Dashed (fixed unless you expose a style input).
## FVG Settings (if present in your build)
• **Show FVG:** On/Off.
• **Close Method:** Full Fill or Midpoint.
• **Marubozu Wick Tolerance:** Max wick % of the impulse bar.
• **Use Split Coloring:** Two-tone box halves around midpoint.
• **Colors:** Bullish/Bearish, and upper/lower halves (if split).
• **Max FVG Age:** Auto-remove older gaps.
---
# 📈 How to Use
## Trading Applications
• **SUP Lines:** Expect reaction on first touch; use as S/R or profit-taking magnets.
• **FVG Fills:** Price frequently tags the midpoint/boundary before continuing.
• **Confluence:** SUP at an FVG midpoint/boundary + higher-timeframe S/R = higher quality.
• **Bias:** Clusters of unfilled FVGs can hint at path of least resistance.
## Best Practices
• **Timeframe:** HTFs for swing levels, LTFs for execution.
• **Volume:** High volume at level = stronger signal.
• **Context:** Trade with broader trend or at least avoid counter-trend without confirmation.
• **Risk:** Always pre-define invalidation; structures fail in chop.
---
# 🔔 Alerts
• **New SUP Created** – When a qualifying inefficient candle prints a SUP midpoint.
• **SUP Touched/Invalidated** – When price touches within tolerance.
• **New FVG Detected** – When a valid gap forms per your rules.
> **Tip:** Set alerts *Once Per Bar Close* on HTFs; *Once* on LTFs to avoid noise.
---
# 🧑💻 Technical Notes
• **Percentile vs ATR:** Percentile adapts to volatility; ATR gives consistency for backtesting.
• **FVG Direction Logic:** Gap above price = bearish (expect up-fill); below = bullish (expect down-fill).
• **Performance:** Limits on lines/boxes and auto-aging keep things snappy.
---
# ⚠️ Limitations
• Imbalances are **context tools**, not signals by themselves.
• Works best with trend or clear impulses; expect noise in narrow ranges.
• Lower-timeframe gaps can be plentiful and lower quality.
---
# 📌 Version & Requirements
• **Pine Script v6**
• Heavy drawings may require **TradingView Pro** or higher (object limits).
---
*For best results, combine with your existing trading strategy and proper risk management.*

Trading Macro Windows by BW v2
Trading Macros by BW: Integrating ICT Concepts for Session Analysis
This indicator combines two key Inner Circle Trader (ICT) concepts—Change in State of Delivery (CISD) or Inverted Fair Value Gap (IFVG) signals with Macro Time Windows—to provide a unified tool for analyzing intraday price action, particularly during Pacific Time (PT) sessions. Rather than simply merging existing scripts, this integration creates a cohesive visual framework that highlights how macro consolidation periods interact with potential reversal or continuation signals like CISD or IFVG. By overlaying macro candle styling and borders on the chart alongside selectable signal lines, traders can better contextualize setups within ICT's macro narrative, where price often manipulates liquidity during these windows before displacing toward higher-timeframe objectives.
Core Components and How They Work Together:
Macro Time Windows (Inspired by ICT's Macro Periods):
ICT emphasizes "macro" as 30-minute windows (e.g., 06:45–07:15 PT, 07:45–08:15 PT, up to 11:45–12:15 PT) where price tends to consolidate, sweep liquidity, or form key structures like Fair Value Gaps (FVGs). These periods set the stage for the session's directional bias.
The indicator styles candles within these windows using a user-defined color for wicks, borders, and bodies (translucent for visibility). This visual emphasis helps traders focus on activity inside macros, where reversals or continuations often originate.
Borders are drawn as vertical lines at the start and end of each window (with a +5 minute buffer to capture related activity), using a dotted style by default. This creates a "study zone" that encapsulates macro events, allowing traders to assess if price is respecting or violating these zones in alignment with broader ICT models like the Power of 3 (AMD cycle).
Toggle: "Macro Candles Enabled" (default: true) – Turn off to disable styling and borders if focusing solely on signals.
CISD or IFVG Signals (Selectable Mode):
Mode Selection: Choose between "Change in the State of Delivery" (CISD) or "IFVG" (default: IFVG). Both detect shifts in market delivery during specific 30-minute slices (15–45 or 17–45 minutes past the hour in PT sessions).
CISD Mode: Based on ICT's definition of a sudden directional shift, this identifies aggressive displacements after sweeping recent highs/lows. It uses a rolling reference high/low over 6 bars, checks for sweeps (penetrating by at least 2 ticks in the last 2-3 bars), reclamation (closing beyond the reference with at least 50% body), and displacement (50% of prior range or an immediate FVG of 6+ ticks). Signals plot a horizontal line from the close, extending 24 bars right, labeled "CISD."
IFVG Mode: Focuses on Inverted Fair Value Gaps, where a bullish FVG (low > high by 13+ ticks) forms but is inverted (closed below) in the same slice, signaling bearish intent (or vice versa). This targets violations against opposing liquidity, often leading to raids on external ranges. Signals plot similarly, labeled "IFVG."
Shared Logic: Both modes enforce a 55-bar cooldown to prevent clustering, operate only during PT sessions (06:30–13:00), and use tick-based thresholds for precision across instruments. The integration with macros allows traders to see if signals occur within or at the edges of macro windows, enhancing confirmation—for example, a CISD inside a macro might indicate a manipulated reversal toward the session's true objective.
Toggle: "Signals Enabled" (default: true) – Turn off to hide all signal lines and labels, isolating the macro visualization.
How Components Interact:
Macro windows provide the "narrative context" (consolidation/manipulation), while CISD/IFVG signals detect the "delivery shift" (displacement). Together, they form a mashup that justifies publication: isolated signals can be noisy, but when filtered by macro periods, they align with ICT's session model. For instance, an IFVG inversion during a macro might confirm a liquidity sweep before targeting PD arrays or order blocks.
No external dependencies; all calculations are self-contained using Pine's built-in functions like ta.highest/lowest for references and time-based sessions for windows.
Usage Guidelines:
Apply to intraday charts (e.g., 1-5 min) or stocks during PT hours.
Look for confluence: A bull IFVG signal post-macro low sweep might target the next macro high or daily bias.
Customize colors/styles for signals (solid/dashed/dotted lines) and macros to suit your chart.
Backtest in replay mode to observe how macros frame signals—e.g., price often respects macro borders as S/R.
Limitations: Timezone-fixed to PT (America/Los_Angeles); signals are directional hints, not trade entries. Combine with ICT tools like order blocks or liquidity pools for full setups.
This script draws from community ICT implementations but refines them into a single, purpose-built tool for macro-driven trading, reducing chart clutter while emphasizing interconnected concepts. Feedback welcome!

Ayman – Full Smart Suite Auto/Manual Presets + PanelIndicator Name
Ayman – Full Smart Suite (OB/BoS/Liq/FVG/Pin/ADX/HTF) + Auto/Manual Presets + Panel
This is a multi-condition trading tool for TradingView that combines advanced Smart Money Concepts (SMC) with classic technical filters.
It generates BUY/SELL signals, draws Stop Loss (SL) and Take Profit (TP1, TP2) levels, and displays a control panel with all active settings and conditions.
1. Main Features
Smart Money Concepts Filters:
Order Block (OB) Zones
Break of Structure (BoS)
Liquidity Sweeps
Fair Value Gaps (FVG)
Pin Bar patterns
ADX filter
Higher Timeframe EMA filter (HTF EMA)
Two Operating Modes:
Auto Presets: Automatically adjusts all settings (buffers, ATR multipliers, RR, etc.) based on your chart timeframe (M1/M5/M15).
Manual Mode: Fully customize all parameters yourself.
Trade Management Levels:
Stop Loss (SL)
TP1 – partial profit
TP2 – full profit
Visual Panel showing:
Current settings
Filter status
Trend direction
Last swing levels
SL/TP status
Alerts for BUY/SELL conditions
2. Entry Conditions
A BUY signal is generated when all these are true:
Trend: Price above EMA (bullish)
HTF EMA: Higher timeframe trend also bullish
ADX: Trend strength above threshold
OB: Price in a valid bullish Order Block zone
BoS: Structure break to the upside
Liquidity Sweep: Sweep of recent lows in bullish context
FVG: A bullish Fair Value Gap is present
Pin Bar: Bullish Pin Bar pattern detected (if enabled)
A SELL signal is generated when the opposite conditions are met.
3. Stop Loss & Take Profits
SL: Placed just beyond the last swing low (BUY) or swing high (SELL), with a small ATR buffer.
TP1: Partial profit target, defined as a ratio of the SL distance.
TP2: Full profit target, based on Reward:Risk ratio.
4. How to Use
Step 1 – Apply Indicator
Open TradingView
Go to your chart (recommended: XAUUSD, M1/M5 for scalping)
Add the indicator script
Step 2 – Choose Mode
AUTO Mode: Leave “Use Auto Presets” ON – parameters adapt to your timeframe.
MANUAL Mode: Turn Auto OFF and adjust all lengths, buffers, RR, and filters.
Step 3 – Filters
In the Filters On/Off section, enable/disable specific conditions (OB, BoS, Liq, FVG, Pin Bar, ADX, HTF EMA).
Step 4 – Trading the Signals
Wait for a BUY or SELL arrow to appear.
SL and TP levels will be plotted automatically.
TP1 can be used for partial close and TP2 for full exit.
Step 5 – Alerts
Set alerts via BUY Signal or SELL Signal to receive notifications.
5. Best Practices
Scalping: Use M1 or M5 with AUTO mode for gold or forex pairs.
Swing Trading: Use M15+ and adjust buffers/ATR manually.
Combine with price action confirmation before entering trades.
For higher accuracy, wait for multiple filter confirmations rather than acting on the first arrow.
6. Summary Table
Feature Purpose Can Disable?
Order Block Finds key supply/demand zones ✅
Break of Structure Detects trend continuation ✅
Liquidity Sweep Finds stop-hunt moves ✅
Fair Value Gap Confirms imbalance entries ✅
Pin Bar Price action reversal filter ✅
ADX Trend strength filter ✅
HTF EMA Higher timeframe confirmation ✅

Futures Trade Entry Indicator (MTF)Work in Progress with the help of Claude. Not ready for active trading. Public for help improving. This will be a multi-timeframe futures trading indicator with supply/demand zones, Fair Value Gaps (FVGs), and sophisticated entry/exit logic.I've created a comprehensive Pine Script v6 indicator that matches all your specifications! Here's what the script includes:
## **Key Features Implemented:**
### **🔄 Multi-Timeframe Logic**
- **1H Chart Data**: Detects Supply Zones, Demand Zones, and Fair Value Gaps
- **Current Timeframe**: Monitors for re-entry and confirmation signals
### **📊 Zone Detection**
- **Supply Zones**: Identified using pivot highs with configurable strength
- **Demand Zones**: Identified using pivot lows with touch validation
- **Fair Value Gaps**: Both bullish and bearish FVGs detected automatically
- **Auto-Expiry**: Zones expire after 24 hours (configurable)
### **⚡ Entry Logic**
- **Dual Confirmation Required**:
- ✅ Engulfing candle pattern (bullish/bearish)
- ✅ Market structure shift (HH→LL or LL→HH)
- **Zone Re-entry**: Price must be within identified zones/FVGs
### **🎯 Probability System**
- **Smart Scoring**: Based on zone age, strength, and risk/reward ratio
- **Color-Coded**: Green (High), Yellow (Medium), Red (Low)
- **Real-time Calculation**: Updates with each potential entry
### **🎨 Visual Elements**
- **Colored Zones**: Supply (red), Demand (green), FVGs (blue/orange)
- **Entry Labels**: 🟩 LONG / 🟥 SHORT markers
- **Probability Labels**: Display confidence levels
- **Confirmation Shapes**: Triangle indicators for pattern completion
### **⚙️ Manual Controls**
All the requested toggles are available in the settings panel:
- Show/Hide Supply Zones
- Show/Hide Demand Zones
- Show/Hide FVGs
- Show/Hide Labels
- Show/Hide Probability
- Zone strength and expiry settings
- Custom colors for all elements
### **🔔 Alert System**
- Entry opportunity alerts
- Includes probability assessment
- Ticker symbol identification
## **Usage Instructions:**
1. **Apply to 15m chart** for active trading signals
2. **Configure settings** based on your preferences
3. **Set up alerts** for automated notifications
4. **Monitor probability levels** for trade quality assessment
The script automatically handles the complex multi-timeframe analysis while keeping the interface clean and user-friendly. All zones update dynamically and expire appropriately to avoid clutter.
Would you like me to adjust any specific parameters or add additional features?

cd_full_poi_CxOverview
This indicator tracks the price in 16 different time frames (optional) in order to answer the question of where the current price has reacted or will react.
It appears on the chart and in the report table when the price approaches or touches the fvg or mitigations (order block / supply-demand), the rules of which will be explained below.
In summary, it follows the fvg and mitigations in the higher timeframe than the lower timeframe.
Many traders see fvg or mitigates as an point of interest and see the high, low swept in those zones as a trading opportunity. Key levels, Session high/lows and Equal high and lows also point of interest.
If we summarise the description of the point of interest ;
1- Fair value gaps (FVG) (16 time frames)
2- Mitigation zones (16 time frames)
3- Previous week, day, H4, H1 high and low levels
4- Sessions zones (Asia, London and New York)
5- Equal high and low levels are in indicator display.
Details:
1- Fair Value Gaps : It is simply described as a price gap and consists of a series of 3 candles. The reaction of the price to the gap between the 1st and 3rd candle wicks is observed.
The indicator offers 3 options for marking. These are :
1-1- ‘Colours are unimportant’: candle colours are not considered for marking. Fvg formation is sufficient.(Classical)
1-2- ‘First candle opposite colour’ : when a price gap occurs, the first candle of a series of 3 candles must be opposite.
For bullish fvg : bearish - bullish - free
For Bearish fvg : bullish - bearish - free
1-3- ‘All same colour’ : all candles in a series of 3 candles must be the same direction.
For bullish fvg: bullish - bullish - bullish
For bearish fvg : bearish - bearish – bearish
Examples:
2- Mitigation zones: Opposite candles with a fvg in front of them or candles higher/lower than the previous and next candle and with the same colour as the fvg series are marked.
Examples :
3- Previous week, day, H4, H1 high and low levels
4- Sessions regions (Asia, London and New York)
5- Equal high and low levels:
Annotation: Many traders want to see a liquidity grab on the poi, then try to enter the trade with the appropriate method.
Among the indicators, there is also the indication of grabs/swepts that occur at swing points. It is also indicated when the area previously marked as equal high/low is violated (grab).
At the end, sample setups will be shown to give an idea about the use of the indicator.
Settings:
- The options to be displayed from the menu are selected by ticking.
- 1m, 2m, 3m, 5m, 5m, 10m, 15m, 30m, h1, h4, h4, h6, h8, h12, daily, weekly, monthly and quarterly, 16 time zones in total can be displayed.
- The ‘Collapse when the price touches mitigate’ tab controls whether to collapse the box as the price moves into the inner region of the mitigate. If not selected, the size of the mitigate does not change.
- ‘Approach limit =(ATR / n)’ tab controls how close the price is to the fvg or mitigate. Instant ATR(10) value is calculated by dividing by the entered ‘n’ value.
- All boxes and lines are automatically removed from the screen when the beyond is closed.
- Colour selections, table, text features are controlled from the menu.
- Sessions hours are set as standard hours, the user can select special time zones. Timezone is set to GMT-4.
- On the candle when the price touches fvg or mitigate, the timeframe information of the POI is shown in the report table together with the graphical representation.
The benefits and differences :
1- We can evaluate the factors we use for setup together.
2- We are aware of what awaits us in the high time frame in the following candles.
3- It offers the user the opportunity to be selective with different candle selection options in fvg selection.
4- Mitige areas are actually unmitige areas because they have a price gap in front of them. The market likes to retest these areas.
5- Equal high/low zones are the levels that the price creates to accumulate liquidity or fails to go beyond (especially during high volume hours). Failure or crossing of the level may give a reversal or continuation prediction.
Sample setup 1:
Sample setup 2:
Sample setup 3:
Cheerful trades…
Enjoy…

LRLR [TakingProphets]LRLR (Low Resistance Liquidity Run) Indicator
This indicator identifies potential liquidity runs in areas of low resistance, based on ICT (Inner Circle Trader) concepts. It specifically looks for a series of unmitigated swing highs in a downtrend that form without any bearish fair value gaps (FVGs) between them.
What is an LRLR?
- A Low Resistance Liquidity Run occurs when price creates a series of lower highs without any bearish fair value gaps in between
- The absence of bearish FVGs indicates there is no significant resistance in the area
- These formations often become targets for smart money to collect liquidity above the swing highs
How to Use the Indicator:
1. The indicator will draw a diagonal line connecting a series of qualifying swing highs
2. A small "LRLR" label appears to mark the pattern
3. These areas often become targets for future price moves, as they represent zones of accumulated liquidity with minimal resistance
Key Points:
- Minimum of 4 consecutive lower swing highs
- No bearish fair value gaps can exist between these swing highs
- The diagonal line helps visualize the liquidity run formation
- Can be used for trade planning and identifying potential reversal zones
Settings:
- Show Labels: Toggle the "LRLR" label visibility
- LRLR Line Color: Customize the appearance of the diagonal line
Best Practices:
1. Use in conjunction with other ICT concepts and market structure analysis
2. Pay attention to how price reacts when returning to these levels
3. Consider these areas as potential targets for smart money liquidity grabs
4. Most effective when used on higher timeframes (4H and above)
Note: This is an educational tool and should be used as part of a complete trading strategy, not in isolation.

FVG - NibzDescription: Fair Value Gap (FVG) Indicator - Nibz
This Pine Script identifies and visualizes Fair Value Gaps (FVGs) on your TradingView chart. FVGs are price inefficiencies left behind when the market moves too quickly, skipping price levels that might not be tested. These gaps often act as magnets, attracting price for potential reversals or continuations.
The script works by detecting upward (bullish) and downward (bearish) price imbalances based on specific candlestick criteria and then marks these zones on your chart using customizable shaded boxes. This tool is essential for traders looking to identify key areas of market inefficiency that could signify support/resistance levels, potential reversal zones, or areas to monitor for market rebalancing.
How It Works
1. Bullish FVG Detection
The script identifies an upward imbalance when:
The low of the candlestick two bars back is less than or equal to the open of the previous bar.
The high of the current candlestick is greater than or equal to the close of the previous bar.
When this condition is met and the size of the imbalance is greater than zero, a green box is drawn from the low of the second candlestick back to the high of the current candlestick.
2. Bearish FVG Detection
The script identifies a downward imbalance when:
The high of the candlestick two bars back is greater than or equal to the open of the previous bar.
The low of the current candlestick is less than or equal to the close of the previous bar.
When this condition is met and the size of the imbalance is greater than zero, a red box is drawn from the low of the current candlestick to the high of the second candlestick back.
Customization Options
This script is highly customizable, allowing you to tailor the appearance of the FVG boxes to suit your trading style and chart aesthetics:
Bullish FVG:
Fill color and transparency.
Border color and transparency.
Bearish FVG:
Fill color and transparency.
Border color and transparency.
The settings are user-friendly, with intuitive sliders for transparency and color pickers for customization.
How to Use the Indicator
Adding the Script:
Add the indicator to your chart, and it will automatically mark bullish (green) and bearish (red) FVGs.
Interpreting FVGs:
Bullish FVGs (green zones): These often act as support or areas of potential price rebalancing on retracement.
Bearish FVGs (red zones): These often act as resistance or areas of interest for short entries.
Trade Ideas:
Use FVG zones to confirm other trade signals or strategies.
Watch for price interaction with these zones to time entries and exits.
Key Features
Automated detection of Fair Value Gaps.
Customizable visual representation to match your chart preferences.
Enhances trading precision by identifying price inefficiencies.
Suitable for scalping, day trading, or swing trading strategies.
This script provides a powerful tool to highlight important price levels and inefficiencies in the market, enabling traders to make informed decisions. Whether you're using it as a standalone indicator or combining it with other tools, the 'FVG - Nibz' indicator is a valuable addition to any trader's toolkit!
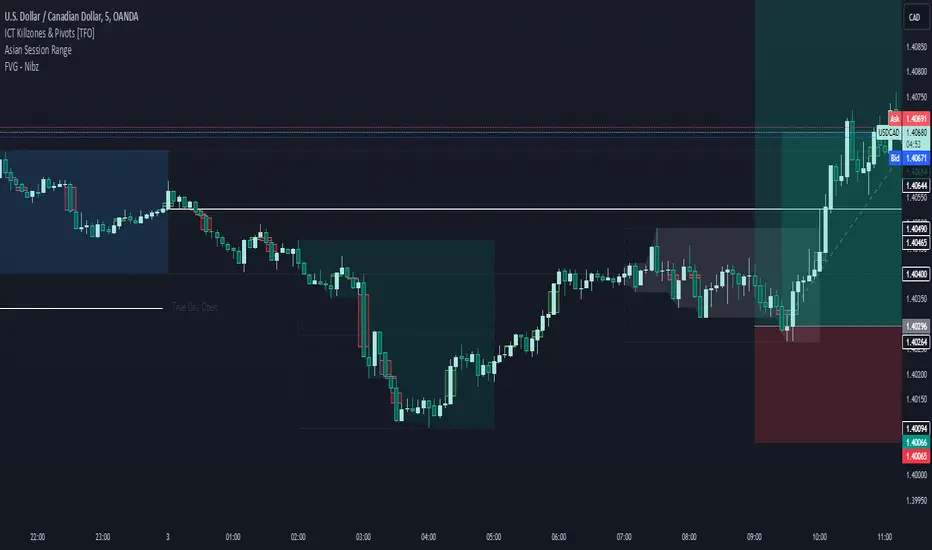
Order blocksHi all!
This indicator will show you found order blocks that can be used as supply or demand. It's my take on trying to create good order blocks and I hope it makes sense.
First off I suggest to verify the current trend before using an order block. This can be done in a variety of ways, one way could be to use my other script "Market structure" () which I use and suggest.
You can configure the indicator to behave differently depending on settings. These are the settings available:
• The order blocks created can be found in any higher timeframe defined in "Timeframe"
• The number of active order blocks are defined in "Count". If an order block is found the earliest order block will be replaced
• You can choose the type of order blocks that are found ("Bullish", "Bearish " or "Both") in "Type"
• The old order blocks can be kept if "Keep history" is checked
• Order blocks that are found are not removed when mitigated (entered) but when a new one appears. They can be removed when they are broken by price if "Remove broken zones" are checked
There is also a setting section called "Requirements" that defines what is required for an order block to be created. These are the settings:
• "Take out"
Check this if you want the base of the order block (the candle where the zone is drawn from (high and low)) to have to take out the previous candle (be higher or lower depending if the order block is bullish or bearish).
• "Consecutive rising/falling"
Each following candle in the reaction (the 3 reaction candles) needs to reach higher or lower (depending on bullish or bearish). Check this if you want that to be true.
• "Reaction"
Some sort of reaction is needed from the 3 candles creating the order block. This reaction is based on the value of the Average True Length (ATR) of length 14. You can here define a factor of the value from the ATR that these 3 candles needs to move in price. A higher need for a reaction (higher factor of the ATR) will create lesser zones. You can also choose to show this limit with the checkbox.
• "Fair Value Gap"
The reaction needs to create a gap (imbalance) in price. This gap is known as a "Fair Value Gap" and is created when the last candle's wick does not meet with the base candle's wick. Check this if you want this to be needed.
After these settings you can also choose the colors of the created zones. The ones that are active (called "Zones"), the ones that are replaced ("Replaced zones") and the ones that are broken ("Broken zones") (if this is enabled in "Remove broken zones").
I'm using my library "Touched" to be able to show you labels when the order blocks have a retest, false breakout and breakout. These labels can be hidden if you disable the labels under the style tab in the indicator settings.
The concept of order blocks is widely used among traders and can provide you with good supply or demand zones. I hope that this indicator makes sense.
My todo-list has a few things, but top of that list is adding alerts for zone interactions or creations. Please feel free to say what you want to be coded!
The order blocks in the publication chart are found in weekly timeframe but are shown on the daily timeframe. Other than that the image shows you zones from the default settings (which are based on the daily timeframe).
Best of luck trading!