GEEKSDOBYTE IFVG w/ Buy/Sell Signals1. Inputs & Configuration
Swing Lookback (swingLen)
Controls how many bars on each side are checked to mark a swing high or swing low (default = 5).
Booleans to Toggle Plotting
showSwings – Show small triangle markers at swing highs/lows
showFVG – Show Fair Value Gap zones
showSignals – Show “BUY”/“SELL” labels when price inverts an FVG
showDDLine – Show a yellow “DD” line at the close of the inversion bar
showCE – Show an orange dashed “CE” line at the midpoint of the gap area
2. Swing High / Low Detection
isSwingHigh = ta.pivothigh(high, swingLen, swingLen)
Marks a bar as a swing high if its high is higher than the highs of the previous swingLen bars and the next swingLen bars.
isSwingLow = ta.pivotlow(low, swingLen, swingLen)
Marks a bar as a swing low if its low is lower than the lows of the previous and next swingLen bars.
Plotting
If showSwings is true, small red downward triangles appear above swing highs, and green upward triangles below swing lows.
3. Fair Value Gap (3‐Bar) Identification
A Fair Value Gap (FVG) is defined here using a simple three‐bar logic (sometimes called an “inefficiency” in price):
Bullish FVG (bullFVG)
Checks if, two bars ago, the low of that bar (low ) is strictly greater than the current bar’s high (high).
In other words:
bullFVG = low > high
Bearish FVG (bearFVG)
Checks if, two bars ago, the high of that bar (high ) is strictly less than the current bar’s low (low).
In other words:
bearFVG = high < low
When either condition is true, it identifies a three‐bar “gap” or unfilled imbalance in the market.
4. Drawing FVG Zones
If showFVG is enabled, each time a bullish or bearish FVG is detected:
Bullish FVG Zone
Draws a semi‐transparent green box from the bar two bars ago (where the gap began) at low up to the current bar’s high.
Bearish FVG Zone
Draws a semi‐transparent red box from the bar two bars ago at high down to the current bar’s low.
These colored boxes visually highlight the “fair value imbalance” area on the chart.
5. Inversion (Fill) Detection & Entry Signals
An inversion is defined as the price “closing through” that previously drawn FVG:
Bullish Inversion (bullInversion)
Occurs when a bullish FVG was identified on bar-2 (bullFVG), and on the current bar the close is greater than that old bar-2 low:
bullInversion = bullFVG and close > low
Bearish Inversion (bearInversion)
Occurs when a bearish FVG was identified on bar-2 (bearFVG), and on the current bar the close is lower than that old bar-2 high:
bearInversion = bearFVG and close < high
When an inversion is true, the indicator optionally draws two lines and a label (depending on input toggles):
Draw “DD” Line (yellow, solid)
Plots a horizontal yellow line from the current bar’s close price extending five bars forward (bar_index + 5). This is often referred to as a “Demand/Daily Demand” line, marking where price inverted the gap.
Draw “CE” Line (orange, dashed)
Calculates the midpoint (ce) of the original FVG zone.
For a bullish inversion:
ce = (low + high) / 2
For a bearish inversion:
ce = (high + low) / 2
Plots a horizontal dashed orange line at that midpoint for five bars forward.
Plot Label (“BUY” / “SELL”)
If showSignals is true, a green “BUY” label is placed at the low of the current bar when a bullish inversion occurs.
Likewise, a red “SELL” label at the high of the current bar when a bearish inversion happens.
6. Putting It All Together
Swing Markers (Optional):
Visually confirm recent swing highs and swing lows with small triangles.
FVG Zones (Optional):
Highlight areas where price left a 3-bar gap (bullish in green, bearish in red).
Inversion Confirmation:
Wait for price to close beyond the old FVG boundary.
Once that happens, draw the yellow “DD” line at the close, the orange dashed “CE” line at the zone’s midpoint, and place a “BUY” or “SELL” label exactly on that bar.
User Controls:
All of the above elements can be individually toggled on/off (showSwings, showFVG, showSignals, showDDLine, showCE).
In Practice
A bullish FVG forms whenever a strong drop leaves a gap in liquidity (three bars ago low > current high).
When price later “fills” that gap by closing above the old low, the script signals a potential long entry (BUY), draws a demand line at the closing price, and marks the midpoint of that gap.
Conversely, a bearish FVG marks a potential short zone (three bars ago high < current low). When price closes below that gap’s high, it signals a SELL, with similar lines drawn.
By combining these elements, the indicator helps users visually identify inefficiencies (FVGs), confirm when price inverts/fills them, and place straightforward buy/sell labels alongside reference lines for trade management.
Cerca negli script per "fair value gap"

FvgTypes█ OVERVIEW
This library serves as a foundational module for Pine Script™ projects focused on Fair Value Gaps (FVGs). Its primary purpose is to define and centralize custom data structures (User-Defined Types - UDTs) and enumerations that are utilized across various components of an FVG analysis system. By providing standardized types for FVG characteristics and drawing configurations, it promotes code consistency, readability, and easier maintenance within a larger FVG indicator or strategy.
█ CONCEPTS
The library introduces several key data structures (User-Defined Types - UDTs) and an enumeration to organize Fair Value Gap (FVG) related data logically. These types are central to the functioning of FVG analysis tools built upon this library.
Timeframe Categorization (`tfType` Enum)
To manage and differentiate FVGs based on their timeframe of origin, the `tfType` enumeration is defined. It includes:
`LTF`: Low Timeframe (typically the current chart).
`MTF`: Medium Timeframe.
`HTF`: High Timeframe.
This allows for distinct logic and visual settings to be applied depending on the FVG's source timeframe.
FVG Data Encapsulation (`fvgObject` UDT)
The `fvgObject` is a comprehensive UDT designed to encapsulate all pertinent information and state for an individual Fair Value Gap throughout its lifecycle. Instead of listing every field, its conceptual structure can be understood as holding:
Core Definition: The FVG's fundamental price levels (top, bottom) and its formation time (`startTime`).
Classification Attributes: Characteristics such as its direction (`isBullish`) and whether it qualifies as a Large Volume FVG (`isLV`), along with its originating timeframe category (`tfType`).
Lifecycle State: Current status indicators including full mitigation (`isMitigated`, `mitigationTime`), partial fill levels (`currentTop`, `currentBottom`), midline interaction (`isMidlineTouched`), and overall visibility (`isVisible`).
Drawing Identifiers: References (`boxId`, `midLineId`, `mitLineLabelId`, etc.) to the actual graphical objects drawn on the chart to represent the FVG and its components.
Optimization Cache: Previous-bar state values (`prevIsMitigated`, `prevCurrentTop`, etc.) crucial for optimizing drawing updates by avoiding redundant operations.
This comprehensive structure facilitates easy access to all FVG-related information through a single object, reducing code complexity and improving manageability.
Drawing Configuration (`drawSettings` UDT)
The `drawSettings` UDT centralizes all user-configurable parameters that dictate the visual appearance of FVGs across different timeframes. It's typically populated from script inputs and conceptually groups settings for:
General Behavior: Global FVG classification toggles (e.g., `shouldClassifyLV`) and general display rules (e.g., `shouldHideMitigated`).
FVG Type Specific Colors: Colors for standard and Large Volume FVGs, both active and mitigated (e.g., `lvBullColor`, `mitigatedBearBoxColor`).
Timeframe-Specific Visuals (LTF, MTF, HTF): Detailed parameters for each timeframe category, covering FVG boxes (visibility, colors, extension, borders, labels), midlines (visibility, style, color), and mitigation lines (visibility, style, color, labels, persistence after mitigation).
Contextual Information: The current bar's time (`currentTime`) for accurate positioning of time-dependent drawing elements and timeframe display strings (`tfString`, `mtfTfString`, `htfTfString`).
This centralized approach allows for extensive customization of FVG visuals and simplifies the management of drawing parameters within the main script. Such centralization also enhances the maintainability of the visual aspects of the FVG system.
█ NOTES
User-Defined Types (UDTs): This library extensively uses UDTs (`fvgObject`, `drawSettings`) to group related data. This improves code organization and makes it easier to pass complex data between functions and libraries.
Mutability and Reference Behavior of UDTs: When UDT instances are passed to functions or methods in other libraries (like `fvgObjectLib`), those functions might modify the fields of the passed object if they are not explicitly designed to return new instances. This is because UDTs are passed by reference and are mutable in Pine Script™. Users should be aware of this standard behavior to prevent unintended side effects.
Optimization Fields: The `prev_*` fields in `fvgObject` are crucial for performance optimization in the drawing logic. They help avoid unnecessary redrawing of FVG elements if their state or relevant settings haven't changed.
No Direct Drawing Logic: `FvgTypes` itself does not contain any drawing logic. It solely defines the data structures. The actual drawing and manipulation of these objects are handled by other libraries (e.g., `fvgObjectLib`).
Centralized Definitions: By defining these types in a separate library, any changes to the structure of FVG data or settings can be made in one place, ensuring consistency across all dependent scripts and libraries.
█ EXPORTED TYPES
fvgObject
fvgObject Represents a Fair Value Gap (FVG) object.
Fields:
top (series float) : The top price level of the FVG.
bottom (series float) : The bottom price level of the FVG.
startTime (series int) : The start time (timestamp) of the bar where the FVG formed.
isBullish (series bool) : Indicates if the FVG is bullish (true) or bearish (false).
isLV (series bool) : Indicates if the FVG is a Large Volume FVG.
tfType (series tfType) : The timeframe type (LTF, MTF, HTF) to which this FVG belongs.
isMitigated (series bool) : Indicates if the FVG has been fully mitigated.
mitigationTime (series int) : The time (timestamp) when the FVG was mitigated.
isVisible (series bool) : The current visibility status of the FVG, typically managed by drawing logic based on filters.
isMidlineTouched (series bool) : Indicates if the price has touched the FVG's midline (50% level).
currentTop (series float) : The current top level of the FVG after partial fills.
currentBottom (series float) : The current bottom level of the FVG after partial fills.
boxId (series box) : The drawing ID for the main FVG box.
mitigatedBoxId (series box) : The drawing ID for the box representing the partially filled (mitigated) area.
midLineId (series line) : The drawing ID for the FVG's midline.
mitLineId (series line) : The drawing ID for the FVG's mitigation line.
boxLabelId (series label) : The drawing ID for the FVG box label.
mitLineLabelId (series label) : The drawing ID for the mitigation line label.
testedBoxId (series box) : The drawing ID for the box of a fully mitigated (tested) FVG, if kept visible.
keptMitLineId (series line) : The drawing ID for a mitigation line that is kept after full mitigation.
prevIsMitigated (series bool) : Stores the isMitigated state from the previous bar for optimization.
prevCurrentTop (series float) : Stores the currentTop value from the previous bar for optimization.
prevCurrentBottom (series float) : Stores the currentBottom value from the previous bar for optimization.
prevIsVisible (series bool) : Stores the visibility status from the previous bar for optimization (derived from isVisibleNow passed to updateDrawings).
prevIsMidlineTouched (series bool) : Stores the isMidlineTouched status from the previous bar for optimization.
drawSettings
drawSettings A structure containing settings for drawing FVGs.
Fields:
shouldClassifyLV (series bool) : Whether to classify FVGs as Large Volume (LV) based on ATR.
shouldHideMitigated (series bool) : Whether to hide FVG boxes once they are fully mitigated.
currentTime (series int) : The current bar's time, used for extending drawings.
lvBullColor (series color) : Color for Large Volume Bullish FVGs.
mitigatedLvBullColor (series color) : Color for mitigated Large Volume Bullish FVGs.
lvBearColor (series color) : Color for Large Volume Bearish FVGs.
mitigatedLvBearColor (series color) : Color for mitigated Large Volume Bearish FVGs.
shouldShowBoxes (series bool) : Whether to show FVG boxes for the LTF.
bullBoxColor (series color) : Color for LTF Bullish FVG boxes.
mitigatedBullBoxColor (series color) : Color for mitigated LTF Bullish FVG boxes.
bearBoxColor (series color) : Color for LTF Bearish FVG boxes.
mitigatedBearBoxColor (series color) : Color for mitigated LTF Bearish FVG boxes.
boxLengthBars (series int) : Length of LTF FVG boxes in bars (if not extended).
shouldExtendBoxes (series bool) : Whether to extend LTF FVG boxes to the right.
shouldShowCurrentTfBoxLabels (series bool) : Whether to show labels on LTF FVG boxes.
shouldShowBoxBorder (series bool) : Whether to show a border for LTF FVG boxes.
boxBorderWidth (series int) : Border width for LTF FVG boxes.
boxBorderStyle (series string) : Border style for LTF FVG boxes (e.g., line.style_solid).
boxBorderColor (series color) : Border color for LTF FVG boxes.
shouldShowMidpoint (series bool) : Whether to show the midline (50% level) for LTF FVGs.
midLineWidthInput (series int) : Width of the LTF FVG midline.
midpointLineStyleInput (series string) : Style of the LTF FVG midline.
midpointColorInput (series color) : Color of the LTF FVG midline.
shouldShowMitigationLine (series bool) : Whether to show the mitigation line for LTF FVGs.
(Line always extends if shown)
mitLineWidthInput (series int) : Width of the LTF FVG mitigation line.
mitigationLineStyleInput (series string) : Style of the LTF FVG mitigation line.
mitigationLineColorInput (series color) : Color of the LTF FVG mitigation line.
shouldShowCurrentTfMitLineLabels (series bool) : Whether to show labels on LTF FVG mitigation lines.
currentTfMitLineLabelOffsetX (series float) : The horizontal offset value for the LTF mitigation line's label.
shouldKeepMitigatedLines (series bool) : Whether to keep showing mitigation lines of fully mitigated LTF FVGs.
mitigatedMitLineColor (series color) : Color for kept mitigation lines of mitigated LTF FVGs.
tfString (series string) : Display string for the LTF (e.g., "Current TF").
shouldShowMtfBoxes (series bool) : Whether to show FVG boxes for the MTF.
mtfBullBoxColor (series color) : Color for MTF Bullish FVG boxes.
mtfMitigatedBullBoxColor (series color) : Color for mitigated MTF Bullish FVG boxes.
mtfBearBoxColor (series color) : Color for MTF Bearish FVG boxes.
mtfMitigatedBearBoxColor (series color) : Color for mitigated MTF Bearish FVG boxes.
mtfBoxLengthBars (series int) : Length of MTF FVG boxes in bars (if not extended).
shouldExtendMtfBoxes (series bool) : Whether to extend MTF FVG boxes to the right.
shouldShowMtfBoxLabels (series bool) : Whether to show labels on MTF FVG boxes.
shouldShowMtfBoxBorder (series bool) : Whether to show a border for MTF FVG boxes.
mtfBoxBorderWidth (series int) : Border width for MTF FVG boxes.
mtfBoxBorderStyle (series string) : Border style for MTF FVG boxes.
mtfBoxBorderColor (series color) : Border color for MTF FVG boxes.
shouldShowMtfMidpoint (series bool) : Whether to show the midline for MTF FVGs.
mtfMidLineWidthInput (series int) : Width of the MTF FVG midline.
mtfMidpointLineStyleInput (series string) : Style of the MTF FVG midline.
mtfMidpointColorInput (series color) : Color of the MTF FVG midline.
shouldShowMtfMitigationLine (series bool) : Whether to show the mitigation line for MTF FVGs.
(Line always extends if shown)
mtfMitLineWidthInput (series int) : Width of the MTF FVG mitigation line.
mtfMitigationLineStyleInput (series string) : Style of the MTF FVG mitigation line.
mtfMitigationLineColorInput (series color) : Color of the MTF FVG mitigation line.
shouldShowMtfMitLineLabels (series bool) : Whether to show labels on MTF FVG mitigation lines.
mtfMitLineLabelOffsetX (series float) : The horizontal offset value for the MTF mitigation line's label.
shouldKeepMtfMitigatedLines (series bool) : Whether to keep showing mitigation lines of fully mitigated MTF FVGs.
mtfMitigatedMitLineColor (series color) : Color for kept mitigation lines of mitigated MTF FVGs.
mtfTfString (series string) : Display string for the MTF (e.g., "MTF").
shouldShowHtfBoxes (series bool) : Whether to show FVG boxes for the HTF.
htfBullBoxColor (series color) : Color for HTF Bullish FVG boxes.
htfMitigatedBullBoxColor (series color) : Color for mitigated HTF Bullish FVG boxes.
htfBearBoxColor (series color) : Color for HTF Bearish FVG boxes.
htfMitigatedBearBoxColor (series color) : Color for mitigated HTF Bearish FVG boxes.
htfBoxLengthBars (series int) : Length of HTF FVG boxes in bars (if not extended).
shouldExtendHtfBoxes (series bool) : Whether to extend HTF FVG boxes to the right.
shouldShowHtfBoxLabels (series bool) : Whether to show labels on HTF FVG boxes.
shouldShowHtfBoxBorder (series bool) : Whether to show a border for HTF FVG boxes.
htfBoxBorderWidth (series int) : Border width for HTF FVG boxes.
htfBoxBorderStyle (series string) : Border style for HTF FVG boxes.
htfBoxBorderColor (series color) : Border color for HTF FVG boxes.
shouldShowHtfMidpoint (series bool) : Whether to show the midline for HTF FVGs.
htfMidLineWidthInput (series int) : Width of the HTF FVG midline.
htfMidpointLineStyleInput (series string) : Style of the HTF FVG midline.
htfMidpointColorInput (series color) : Color of the HTF FVG midline.
shouldShowHtfMitigationLine (series bool) : Whether to show the mitigation line for HTF FVGs.
(Line always extends if shown)
htfMitLineWidthInput (series int) : Width of the HTF FVG mitigation line.
htfMitigationLineStyleInput (series string) : Style of the HTF FVG mitigation line.
htfMitigationLineColorInput (series color) : Color of the HTF FVG mitigation line.
shouldShowHtfMitLineLabels (series bool) : Whether to show labels on HTF FVG mitigation lines.
htfMitLineLabelOffsetX (series float) : The horizontal offset value for the HTF mitigation line's label.
shouldKeepHtfMitigatedLines (series bool) : Whether to keep showing mitigation lines of fully mitigated HTF FVGs.
htfMitigatedMitLineColor (series color) : Color for kept mitigation lines of mitigated HTF FVGs.
htfTfString (series string) : Display string for the HTF (e.g., "HTF").

Custom V2 KillZone US / FVG / EMAThis indicator is designed for traders looking to analyze liquidity levels, opportunity zones, and the underlying trend across different trading sessions. Inspired by the ICT methodology, this tool combines analysis of Exponential Moving Averages (EMA), session management, and Fair Value Gap (FVG) detection to provide a structured and disciplined approach to trading effectively.
Indicator Features
Identifying the Underlying Trend with Two EMAs
The indicator uses two EMAs on different, customizable timeframes to define the underlying trend:
EMA1 (default set to a daily timeframe): Represents the primary underlying trend.
EMA2 (default set to a 4-hour timeframe): Helps identify secondary corrections or impulses within the main trend.
These two EMAs allow traders to stay aligned with the market trend by prioritizing trades in the direction of the moving averages. For example, if prices are above both EMAs, the trend is bullish, and long trades are favored.
Analysis of Market Sessions
The indicator divides the day into key trading sessions:
Asian Session
London Session
US Pre-Open Session
Liquidity Kill Session
US Kill Zone Session
Each session is represented by high and low zones as well as mid-lines, allowing traders to visualize liquidity levels reached during these periods. Tracking the price levels in different sessions helps determine whether liquidity levels have been "swept" (taken) or not, which is essential for ICT methodology.
Liquidity Signal ("OK" or "STOP")
A specific signal appears at the end of the "Liquidity Kill" session (just before the "US Kill Zone" session):
"OK" Signal: Indicates that liquidity conditions are favorable for trading the "US Kill Zone" session. This means that liquidity levels have been swept in previous sessions (Asian, London, US Pre-Open), and the market is ready for an opportunity.
"STOP" Signal: Indicates that it is not favorable to trade the "US Kill Zone" session, as certain liquidity conditions have not been met.
The "OK" or "STOP" signal is based on an analysis of the high and low levels from previous sessions, allowing traders to ensure that significant liquidity zones have been reached before considering positions in the "Kill Zone".
Detection of Fair Value Gaps (FVG) in the US Kill Zone Session
When an "OK" signal is displayed, the indicator identifies Fair Value Gaps (FVG) during the "US Kill Zone" session. These FVGs are areas where price may return to fill an "imbalance" in the market, making them potential entry points.
Bullish FVG: Detected when there is a bullish imbalance, providing a buying opportunity if conditions align with the underlying trend.
Bearish FVG: Detected when there is a bearish imbalance, providing a selling opportunity in the trend direction.
FVG detection aligns with the ICT Silver Bullet methodology, where these imbalance zones serve as probable entry points during the "US Kill Zone".
How to Use This Indicator
Check the Underlying Trend
Before trading, observe the two EMAs (daily and 4-hour) to understand the general market trend. Trades will be prioritized in the direction indicated by these EMAs.
Monitor Liquidity Signals After the Asian, London, and US Pre-Open Sessions
The high and low levels of each session help determine if liquidity has already been swept in these areas. At the end of the "Liquidity Kill" session, an "OK" or "STOP" label will appear:
"OK" means you can look for trading opportunities in the "US Kill Zone" session.
"STOP" means it is preferable not to take trades in the "US Kill Zone" session.
Look for Opportunities in the US Kill Zone if the Signal is "OK"
When the "OK" label is present, focus on the "US Kill Zone" session. Use the Fair Value Gaps (FVG) as potential entry points for trades based on the ICT methodology. The identified FVGs will appear as colored boxes (bullish or bearish) during this session.
Use ICT Methodology to Manage Your Trades
Follow the FVGs as potential reversal zones in the direction of the trend, and manage your positions according to your personal strategy and the rules of the ICT Silver Bullet method.
Customizable Settings
The indicator includes several customization options to suit the trader's preferences:
EMA: Length, source (close, open, etc.), and timeframe.
Market Sessions: Ability to enable or disable each session, with color and line width settings.
Liquidity Signals: Customization of colors for the "OK" and "STOP" labels.
FVG: Option to display FVGs or not, with customizable colors for bullish and bearish FVGs, and the number of bars for FVG extension.
-------------------------------------------------------------------------------------------------------------
Cet indicateur est conçu pour les traders souhaitant analyser les niveaux de liquidité, les zones d’opportunité, et la tendance de fond à travers différentes sessions de trading. Inspiré de la méthodologie ICT, cet outil combine l'analyse des moyennes mobiles exponentielles (EMA), la gestion des sessions de marché, et la détection des Fair Value Gaps (FVG), afin de fournir une approche structurée et disciplinée pour trader efficacement.

كلاستر
Detailed Description – Fibonacci Cluster Zones + OB + FVG (AR34)
This script is an advanced multi-layer confluence system developed under the AR34 Trading Framework, designed to identify high-accuracy reversal zones, liquidity imbalances, institutional footprints, and trend direction using a unified analytic engine.
It combines Fibonacci mathematics, Smart Money Concepts, market structure, and smart trend signals to produce precise, reliable trading zones.
⸻
🔶 1 — Fibonacci Retracement Zones + Custom Smart Levels
The script calculates the highest and lowest prices over a selected lookback period to generate key Fibonacci retracement levels:
• 0.236
• 0.382
• 0.500
• 0.618
• 0.786
• 1.000
You can also add up to three custom Fibonacci levels (0.66, 0.707, 0.88 or any value you want).
✔ Each level is drawn as a horizontal line
✔ Optional label display for every level
✔ Color and activation fully customizable
These levels help identify pullback zones and potential turning points.
⸻
🔶 2 — True Fibonacci Cluster Detection
The script automatically identifies Cluster Zones, which occur when:
1. A Fibonacci level
2. An Order Block
3. A Fair Value Gap
all overlap in the same price range.
When all three conditions align, the script prints a CLUSTER marker in yellow.
These zones represent:
• High-probability reversal areas
• Strong institutional footprints
• Highly reactive price levels
⸻
🔶 3 — Automatic Order Block (OB) Detection
The indicator detects Order Blocks based on structural candle behavior:
• Bearish candle → followed by bullish
• Price interacts with a Fibonacci level
• Area aligns with institutional order flow
When detected, the OB is marked for easy visualization.
⸻
🔶 4 — Fair Value Gap (FVG) Mapping
The script scans for liquidity imbalances using the classic FVG logic:
• low > high
When an FVG exists, it draws a green liquidity box.
This highlights:
• Gaps left by institutional moves
• High-value return zones
• Efficient price retracement levels
⸻
🔶 5 — Fibonacci Extension Projections
The script calculates extension targets using:
• 1.272
• 1.618
• 2.000
These are drawn as dashed teal lines and help forecast:
• Breakout continuation targets
• Wave extension objectives
• Take-profit areas
⸻
🔶 6 — Smart Trend Signal (EMA-200 Engine)
Trend direction is determined using the EMA 200:
• Price above EMA → uptrend
• Price below EMA → downtrend
A green or red signal icon appears only when the trend flips, reducing noise and improving clarity.
This helps detect:
• Trend shifts early
• Cleaner entries and exits
• Trend-based filtering
⸻
🔶 7 — Four-EMA Multi-Trend System
The indicator includes optional visualization of four moving averages:
• EMA 20 → Short-term
• EMA 50 → Medium-term
• EMA 100 → Long-term
• EMA 200 → Major trend
All are fully customizable (length + color + visibility).
⸻
🔶 8 — Dynamic Negative Fibonacci Levels (Green Only)
When enabled, the script calculates deep retracement zones using:
• –0.23
• –0.75
• –1.20
These negative Fibonacci levels are drawn in green and help identify:
• Deep liquidity capture points
• Hidden structural supports
• Potential reversal bottoms
⸻
🔶 9 — Complete User Control
Users maintain full control over:
✔ Enabling/disabling OB detection
✔ Enabling/disabling FVG detection
✔ Activating custom Fibonacci levels
✔ Showing or hiding labels
✔ Selecting timeframe for Fib calculations
✔ Adjusting moving average parameters
✔ Activating dynamic Fibonacci
The script is designed to be flexible, scalable, and suitable for any trading style.
⸻
🎯 Summary
This indicator is a powerful all-in-one analytical system that merges:
✔ Fibonacci Mathematics
✔ Smart Money Concepts (OB + FVG)
✔ Trend-based filtering
✔ Institutional cluster detection
✔ Dynamic extensions + retracements
✔ Multi-EMA trend mapping
شرح السكربت بالتفصيل – Fibonacci Cluster Zones + OB + FVG (AR34)
هذا السكربت هو نظام تحليل احترافي متكامل من تطوير AR34 Framework يجمع بين أقوى أدوات التداول الحديثة في مؤشر واحد، ويهدف إلى كشف مناطق الانعكاس القوية، والتجميع الذكي، والاتجاه العام، باستخدام مزيج علمي من فيبوناتشي + السيولة + الاتجاه.
يعمل هذا المؤشر بأسلوب Confluence Trading بحيث يدمج عدة مدارس مختلفة في طبقة واحدة لتحديد مناطق الانعكاس والارتداد والاختراق بدقة عالية.
⸻
🔶 1 — مناطق فيبوناتشي (Retracement) + الكلاستر الذكي
يقوم المؤشر بحساب أعلى وأدنى سعر خلال عدد محدد من الشموع (Retracement Length) ثم يرسم مستويات فيبوناتشي الكلاسيكية:
• 0.236
• 0.382
• 0.500
• 0.618
• 0.786
• 1.000
مع إمكانية إضافة 3 مستويات خاصة من اختيارك (0.66 – 0.707 – 0.88 وغيرها).
✔️ كل مستوى يتم رسمه بخط مستقل
✔️ يظهر بجانبه رقم المستوى إذا تم تفعيل خيار Show Fib Labels
✔️ يمكن تغيير لونه، قيمته، وتفعيله حسب رغبتك
⸻
🔶 2 — كاشف الكلاستر الحقيقي (Cluster Detection)
الكلاستر يُعتبر أقوى مناطق الارتداد في التحليل الفني.
السكربت يحدد الكلاستر عندما تتداخل 3 عناصر مع مستوى فيبوناتشي:
1. مستوى فيبوناتشي مهم
2. Order Block
3. Fair Value Gap
إذا اجتمعت الثلاثة في نفس المنطقة، يتم رسمها باللون الأصفر وتظهر كلمة CLUSTER.
هذا يعطيك:
• أقوى منطقة انعكاس
• أعلى دقة في تحديد نقاط الدخول
• مناطق ذات سيولة مرتفعة
⸻
🔶 3 — دمج Order Blocks تلقائياً
يكتشف المؤشر الـ OB الحقيقي باستخدام شروط حركة الشموع:
• bearish candle → bullish candle
• السعر لمس مستوى فيبوناتشي
• منطقة محتملة لتجميع المؤسسات
إذا تحققت الشروط يظهر OB باللون الأحمر.
⸻
🔶 4 — دمج Fair Value Gaps (FVG)
يكتشف الفجوات السعرية بين الشمعتين الأولى والثالثة:
• low > high
ويقوم برسم بوكس أخضر حول الفجوة (FVG Zone).
يساعدك على معرفة:
• مناطق اختلال السيولة
• أهداف السعر القادمة
• مناطق “العودة” المحتملة
⸻
🔶 5 — امتدادات فيبوناتشي (Fibonacci Extensions)
يقوم بحساب الامتدادات من مستويات:
• 1.272
• 1.618
• 2.0
ويظهرها بخطوط متقطعة (Teal Color).
هذه المستويات مهمة لتوقع:
• أهداف اختراق
• مناطق TP
• امتداد موجات السعر
⸻
🔶 6 — إشارة الاتجاه الذكية (Smart Trend Engine – EMA200)
يعتمد على EMA 200 لتحديد الاتجاه العام:
• إذا السعر فوق EMA200 → اتجاه صاعد
• إذا السعر تحت EMA200 → اتجاه هابط
ويظهر المؤشر:
🟢 سهم أخضر عند تحول الاتجاه لصعود
🔴 سهم أحمر عند تحول الاتجاه لهبوط
ميزة التحول فقط عند تغيير الاتجاه (No Noise).
⸻
🔶 7 — أربع موفنقات احترافية (EMA 20 – 50 – 100 – 200)
المؤشر يعرض الموفنقات الأربعة الأساسية:
• EMA 20 → اتجاه قصير
• EMA 50 → متوسط
• EMA 100 → طويل
• EMA 200 → الاتجاه الرئيسي
مع إمكانية:
• تغيير اللون
• تغيير الطول
• إخفائها وإظهارها
⸻
🔶 8 — فيبوناتشي الديناميكي (Dynamic Green Fib)
ميزة قوية جداً تظهر فقط عند تفعيلها.
تحسب أعلى وأدنى سعر في Lookback Period ثم ترسم مستويات سلبية:
• –0.23
• –0.75
• –1.20
هذه المستويات تظهر كخطوط خضراء تحت السعر وتستخدم لـ:
• تحديد مناطق الانعكاس المخفية
• رصد الدعم الديناميكي
• اكتشاف القيعان المحتملة
⸻
🔶 9 — المرونة الكاملة للمستخدم
المؤشر يسمح لك التحكم بكل شيء:
✔️ تفعيل/إلغاء الـ OB
✔️ تفعيل/إلغاء الـ FVG
✔️ تفعيل/إلغاء مستويات فيبوناتشي
✔️ إضافة مستويات مخصصة
✔️ اختيار الفريم المستخدم
✔️ تغيير الألوان
✔️ التحكم في الاتجاه والموفنقات
⸻
🎯 الخلاصة
هذا السكربت يعمل كنظام تحليلي متكامل يجمع:
✔️ فيبوناتشي
✔️ السيولة المؤسسية (OB + FVG)
✔️ الاتجاه الذكي
✔️ الكلاستر الاحترافي
✔️ الموفنقات
✔️ فيبوناتشي الديناميكي

FVG Volume Profile [ChartPrime]⯁ OVERVIEW
FVG Volume Profile is a smart volume analysis tool that identifies Fair Value Gaps (FVGs) and overlays a volume profile inside each gap using data from lower timeframes. The indicator automatically selects the best time resolution or allows for manual control, giving traders deeper insight into the volume structure within each imbalance. POC levels and total volumes gives a full microstructure view inside every FVG.
⯁ KEY FEATURES
Fair Value Gap Detection (Bullish & Bearish)
Detects price gaps where inefficiency exists using a 3-bar structure.
-Bullish Gaps: Low > High with confirming middle bar.
-Bearish Gaps: High < Low with confirming middle bar.
Only significant gaps (filtered by standard deviation) are plotted to avoid noise.
Multi-Timeframe Volume Profiling
Pulls granular candle and volume data from a lower timeframe —
In Auto Mode, uses a resolution ~10x lower than the current chart.
In Manual Mode, lets the user select a custom timeframe.
This ensures accurate intra-gap volume distribution.
Dynamic Volume Binning
Each FVG is divided into vertical volume bins based on the Resolution input.
Each bin displays relative volume intensity as a horizontal box, scaled by percentage of the max bin volume.
Point of Control (PoC) Line & Label
The bin with the maximum volume inside each FVG is marked with:
A horizontal line (PoC) extending from the left to right side.
A label showing the absolute volume of that bin.
Color-coded to match bullish or bearish FVGs.
Total Volume Label Inside FVG
Each FVG displays the total volume sum from its profile:
For bullish FVGs , shown in the bottom-right corner.
For bearish FVGs , shown in the top-right corner.
Auto-Removal of Invalid Gaps
If price fully closes the gap (crosses its bounds), the FVG, profile, and PoC are deleted automatically.
This keeps the chart clean and focused only on active zones.
Toggleable Volume Profile Display
User can show or hide the volume profiles within FVGs using the "Display" toggle under the "FVG Volume Profile" group.
Only the PoC and FVG boxes remain visible if toggled off.
Volume Resolution Customization
Control the number of bins used for each FVG profile.
Higher resolution = more bins and finer volume analysis. (default 15)
Auto Timeframe Validation Warning
If the selected lower timeframe isn’t actually lower than the chart's, the script shows a visible warning label prompting adjustment.
Helps prevent calculation errors.
⯁ USAGE
Use this tool to identify active imbalance zones (FVGs) with embedded volume context.
Look for PoC positioning inside gaps — near top may indicate absorption or reversal zones.
Combine with price action at the PoC level for precision entries.
Hide volume profile for a cleaner view while retaining key POC and FVG boxes.
Use resolution controls to zoom into fine-grained profiles inside large gaps.
Consider Auto mode for seamless multi-timeframe analysis, or switch to Manual for full control.
⯁ CONCLUSION
FVG Volume Profile transforms raw imbalance detection into actionable insight by embedding lower-timeframe volume structure inside each Fair Value Gap. With PoC highlights, total volume labels, and customizable bin resolution, this indicator is essential for traders who want to understand not just where the gap is — but what volume did inside it .

Double FVG-BPR [QuantVue]The Double FVG BPR Indicator is a versatile tool that helps traders identify potential support and resistance levels through the concept of balanced price ranges.
A Balanced Price Range (BPR) is a zone on a price chart where the market has found equilibrium after a period of price imbalance.
It is identified by detecting a Fair Value Gap (FVG) in one direction, followed by an overlapping Fair Value Gap in the opposite direction.
Components of a Balanced Price Range
Fair Value Gap (FVG): A FVG occurs when there is a rapid price movement, creating a gap in the price chart where minimal trading occurs. This gap represents an imbalance between supply and demand.
Bullish FVG: A bullish FVG is identified when the low of a candle is higher than the high of a candle two periods ago, and the close of the previous candle is higher than the high of that same period.
Bearish FVG: A bearish FVG is identified when the high of a candle is lower than the low of a candle two periods ago, and the close of the previous candle is lower than the low of that same period.
Overlapping Fair Value Gap: For a BPR to be formed, an initial FVG must be followed by an overlapping FVG in the opposite direction. This creates a balanced zone where the price has moved up (or down) quickly and then moved down (or up) with similar intensity, suggesting a temporary equilibrium.
The area between the high and low points of these overlapping FVGs forms the BPR. This zone represents a temporary market equilibrium where supply and demand have balanced out after a period of significant price movement in both directions.
How to Use
Support and Resistance Levels: The upper and lower boundaries of the BPR act as dynamic support and resistance levels. Traders can use these levels to place buy and sell orders, anticipating that the price may find support or face resistance within these zones.
Trend Reversal and Continuation: The BPR can signal potential trend reversals or continuations.
If the price moves back into the BPR after a breakout, it may indicate a reversal. Conversely, if the price breaks out of the BPR with strong momentum, it may signal a trend continuation.

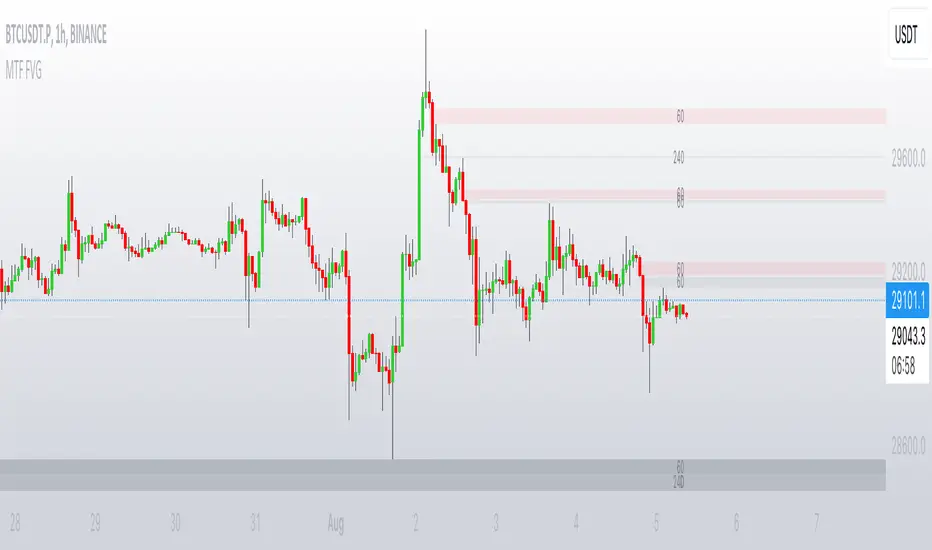
MTF FVGThis script finds Imbalance (Fair Value Gap (FVG)) on multi timeframes.
If needed all TF can be used at once: 1, 3, 5, 15, 30, 45, 60, 120, 180, 240, D, W.
It finds FVG on any desired TF that is greater or equal than TF on the chart.
FVG stands for fair value gap, which is a three-candle structure that indicates an imbalance or inefficiency in the market. An imbalance means that the buying and selling is not equal, and there is a gap between the fair value and the market value of an asset. A bullish FVG shows that the market value is lower than the fair value, and a bearish FVG shows the opposite.
FVG takes place in a series of 3 candles when the middle candle gaps up or down. This signals strong buying or selling pressure in the direction of the gap. When a gap occurs the wicks of the candles do not overlap each other.
Institutional Liquidity Engine [Pointalgo]PointAlgo – Institutional Liquidity Engine is a price-overlay market structure and liquidity visualization tool designed to help traders analyze supply & demand behavior, liquidity zones, and price inefficiencies using rule-based logic inspired by modern market structure concepts.
This indicator focuses on where price aggressively moved from, where liquidity may remain, and how those zones evolve over time, without generating direct buy/sell signals.
The script is fully open-source, free to use, and intended strictly for educational and analytical purposes.
Core Analytical Concepts :
This indicator visualizes:
Market structure pivot points
High-volatility displacement zones
Supply & demand (order-block–like) areas
Liquidity mitigation behavior
Fair Value Gaps (price inefficiencies)
Zone lifecycle management (active vs mitigated)
It does not claim to detect actual institutional orders.
How the Indicator Works :
Volatility-Filtered Structure Detection
Uses ATR-based volatility filtering
Zones are only created when price displacement exceeds normal volatility
Helps reduce noise from weak or random candles
Demand & Supply Zone Identification
A demand zone is detected when:
A pivot low forms
The candle before the move is bearish
Price rapidly expands upward after the pivot
Volatility conditions are met
These zones highlight areas where price previously reacted strongly upward.
Supply Zones (Bearish)
A supply zone is detected when:
A pivot high forms
The candle before the move is bullish
Price drops aggressively after the pivot
Volatility conditions are met
These zones highlight areas where selling pressure previously dominated.
Smart Mitigation Engine (Automatic Zone Management)
One of the key design goals of this indicator is chart cleanliness.
Each zone is continuously monitored:
If price returns into the zone, it is considered mitigated
Users can choose to:
Automatically remove mitigated zones
Or gray them out for historical reference
Old and irrelevant zones far from price are also automatically deleted.
This prevents the chart from filling with outdated boxes.
Fair Value Gap (Liquidity Void) Detection
Optional Fair Value Gaps (FVGs) are displayed when:
Price moves so fast that wicks do not overlap
The gap size exceeds a user-defined ATR threshold
These gaps visually represent price inefficiencies where liquidity may be revisited.
Types:
🔵 Bullish FVG
🟠 Bearish FVG
Real-Time Dashboard
A small dashboard displays:
Active demand zones
Active supply zones
This provides a quick structural overview without scanning the entire chart.
Customization Options
Users can configure:
Pivot sensitivity
Zone colors
Mitigation behavior
Fair Value Gap visibility
Minimum gap size (ATR-based)
This makes the indicator adaptable across:
Forex
Indices
Crypto
Stocks
Futures
How to Use This Indicator
This tool is best used for:
Market structure analysis
Supply & demand studies
Liquidity mapping
Confluence with price action
Higher-timeframe bias alignment
Recommended complementary tools:
Support & Resistance
Trend analysis
Volume profiling
Risk management rules
Important Disclaimer
This indicator is provided for educational and analytical purposes only.
It does not provide trading signals, investment advice, or profit guarantees.
Market structure and liquidity concepts are interpretive in nature.
Users are solely responsible for their own trading decisions and risk management

Range Indicator Golden Pocket, Liquidity, FairValueGapOverview
This indicator is a comprehensive institutional market structure toolkit. It is designed to identify high-probability reversal zones by merging three powerful technical analysis concepts: Fibonacci Golden Pockets (61.8% - 65%), Liquidity Pool Analysis (Swing Failure Patterns), and Fair Value Gaps (FVG). By automating the detection of price inefficiencies and "stop runs," it helps traders navigate complex price action with objective, rule-based confirmation.
What the Script Does
The script continuously monitors a user-defined lookback period to define a trading range. Within this range, it dynamically plots:
Golden Pockets: High-confluence retracement zones (calculated as 0.35 - 0.382 internal range levels).
Liquidity Zones: Highlighted regions at the absolute high and low (Top/Bottom 5%) where institutional orders and retail stops are typically concentrated.
Swing Failure Patterns (SFP): Real-time detection of liquidity grabs where price breaches a range extreme but fails to close outside, signaling a potential trap.
Fair Value Gaps (FVG): Visualizes 3-candle price imbalances, showing areas of aggressive buying or selling that often act as future magnets or support/resistance.
2-Candle Confirmation: A momentum-based filter requiring a candle-close confirmation before a reversal signal is generated.
For Whom is it?
Smart Money Concepts (SMC) & ICT Students: Traders looking for automated liquidity sweeps and market inefficiencies.
Fibonacci & Mean Reversion Traders: Those seeking a clean, professional visualization of the Golden Pocket across multiple timeframes.
Systematic Day Traders: Who require strict price-action confirmation (SFP and 2-candle rules) to remove emotional bias from their entries.
Functions and Input Options
1. Market Structure & Visuals
Lookback Period (Default: 100): Defines the window for calculating the range extremes.
Box Offset Right (Default: 50): Extends all zones into the future for better anticipatory trading.
Show Price Lines & Labels: Displays the exact price for every zone boundary on the right axis for precise execution.
2. Fair Value Gap (FVG) Settings
Show Fair Value Gaps: A toggle to enable/disable the plotting of price imbalances.
FVG Extension (Default: 10): Determines how many bars into the future the FVG box remains visible.
Custom Colors: Separate color inputs for Bullish (Gap Up) and Bearish (Gap Down) inefficiencies.
3. Professional Alert System
The script includes five specific alert conditions:
GP Touch: Early warning when price enters a Golden Pocket.
2-Candle Pattern: Confirmed momentum shift within a Golden Pocket.
SFP Long/Short: Alerts when a Liquidity Grab (Swing Failure) is confirmed at the range high or low.
Transparency and Compliance (Moderator Info)
Non-Repainting Logic: All signals (SFP, 2-Candle, and FVG) are calculated and triggered based on confirmed candle closes. Drawings use barstate.islast purely for visual efficiency without altering historical data integrity.
Educational Context: The script visualizes well-known market principles (Fibonacci, SFPs, and FVGs) to aid traders in their analysis; it does not provide automated financial advice or "black-box" buy/sell signals.
Resource Management: Optimized for Pine Script v5, using efficient array and box handling to ensure smooth performance even on lower timeframes.

Smart Money Zones (FVG + OB) + MTF Trend Panel## Overview
Professional-grade institutional trading zones indicator that identifies **Fair Value Gaps (FVG)** and **Order Blocks (OB)** - key price inefficiencies where smart money operates. Includes a comprehensive **Multi-Timeframe Trend Panel** for complete market context at a glance.
## Core Features
### 🎯 Fair Value Gaps (FVG)
Fair Value Gaps occur when price moves so aggressively that it leaves an "imbalance" or "gap" in the market structure. These zones often act as magnets where price returns to find liquidity.
**Detection Logic:**
- **Bullish FVG**: When current candle's low is above the high of the candle 2 bars ago
- **Bearish FVG**: When current candle's high is below the low of the candle 2 bars ago
- Requires strong impulse candle (configurable body percentage threshold)
- Color-coded zones: Green for bullish, Red for bearish
### 📦 Order Blocks (OB)
Order Blocks represent the last opposite candle before a significant price move - the zone where institutional orders were placed before the breakout.
**Detection Logic:**
- Identifies the last bearish candle before a strong bullish breakout (Bullish OB)
- Identifies the last bullish candle before a strong bearish breakout (Bearish OB)
- Validates breakout strength using ATR multiplier (1.2x default)
- Color-coded zones: Blue for bullish, Orange for bearish
### 📊 Multi-Timeframe Trend Panel
Real-time trend analysis across **7 timeframes** displayed in an elegant dashboard:
- **1 Minute** - Ultra short-term scalping
- **5 Minutes** - Short-term momentum
- **15 Minutes** - Intraday swings
- **30 Minutes** - Session trends
- **1 Hour** - Multi-session trends
- **4 Hours** - Daily structure
- **Daily** - Long-term direction
**Visual Indicators:**
- 🟢 Green circle = Bullish trend
- 🔴 Red circle = Bearish trend
- Clean, professional table design with customizable position and size
## Intelligence Features
### 🧠 Zone Strength Rating
Every zone is automatically classified by strength based on size relative to ATR:
- **VERY STRONG** - 2.0x ATR or more (major institutional zones)
- **STRONG** - 1.5x to 2.0x ATR (significant zones)
- **MEDIUM** - 1.0x to 1.5x ATR (moderate zones)
- **WEAK** - Below 1.0x ATR (minor zones)
Strength rating helps you prioritize which zones to trade from!
### 📉 Smart Mitigation Tracking
Zones automatically track how much they've been "filled" or mitigated:
- Calculates penetration percentage as price enters the zone
- Zones turn **gray** when 50%+ mitigated or fully filled
- Option to **auto-delete** mitigated zones to keep chart clean
- Live zones extend dynamically with price action
### 🎨 Trend Filter (Optional)
When enabled, only shows zones aligned with the current trend:
- Uses customizable MA period (default 50)
- Bullish zones only appear in uptrend
- Bearish zones only appear in downtrend
- Reduces noise and false signals significantly
## Customization Options
### Display Settings
- Toggle FVGs and OBs independently
- Adjust max zones per type (5-200)
- Choose to remove or gray out mitigated zones
- Color customization for all zone types
### Detection Parameters
- **Min Impulse Body %**: Controls how strong the impulse candle must be (0.3-1.0)
- **Order Block Lookback**: How many bars to look back for OB validation (5-50)
- **ATR Length**: Period for ATR calculation (5-50)
### Trend Filter
- Enable/disable trend filtering
- Adjustable MA period for trend determination
### MTF Panel
- Show/hide the trend panel
- 4 position options: Top Right, Top Left, Bottom Right, Bottom Left
- 3 size options: Small, Normal, Large
- Customizable MA period for trend calculation across all timeframes
## Trading Applications
### 1. **Liquidity Grab Entries**
Wait for price to sweep a zone (50%+ mitigation) then enter on reversal. Smart money often "hunts" these zones before the real move begins.
### 2. **Confluence Trading**
Look for zones that align with:
- Multiple timeframe trends showing same direction
- Multiple FVGs/OBs stacking in same area
- Key support/resistance levels
### 3. **Breakout Confirmation**
Use Order Blocks to confirm the strength of breakouts. Strong OBs indicate institutional participation.
### 4. **Retracement Entries**
Enter when price returns to a fresh, unmitigated zone in the direction of the higher timeframe trend.
### 5. **Range Trading**
Identify FVG zones at range extremes - price often reverses at these inefficiencies.
## How It Works
**Fair Value Gaps** form when the middle candle creates such aggressive movement that it leaves a price gap between the high/low of surrounding candles. Institutional traders know these gaps get filled.
**Order Blocks** mark the origin of major moves. The last opposite-colored candle before a breakout is where large orders were placed. Price often returns to these zones for "retests" before continuing.
**Mitigation** happens when price returns to fill these zones. The indicator tracks this automatically, showing you which zones are still "fresh" and which have been used up.
## Best Practices
✅ **Use higher timeframe trends** - Always check the MTF panel before taking trades
✅ **Trade fresh zones** - Unmitigated zones (not gray) have the highest probability
✅ **Combine with price action** - Look for rejection wicks and engulfing candles at zones
✅ **Respect zone strength** - VERY STRONG and STRONG zones are most reliable
✅ **Use trend filter** - Especially on lower timeframes to reduce false signals
❌ **Don't overtrade** - Not every zone will react, wait for confirmation
❌ **Don't ignore context** - Check the MTF panel for conflicting trends
❌ **Don't chase** - Wait for price to come to the zone, don't enter mid-zone
## Technical Details
- **Non-repainting**: All zones are drawn on confirmed candles only
- **Performance optimized**: Uses efficient array management with per-type caps
- **Real-time updates**: Zones extend and track mitigation as price moves
- **Universal compatibility**: Works on all markets and timeframes
## Recommended Settings by Style
**Scalping (1m-5m charts):**
- Max zones: 10-15
- Use trend filter: ON
- MTF Panel: Focus on 1m-15m trends
- Remove mitigated: ON (keep chart clean)
**Day Trading (5m-1H charts):**
- Max zones: 15-20
- Use trend filter: ON
- MTF Panel: Focus on 15m-4H trends
- Remove mitigated: OFF (track zone history)
**Swing Trading (1H-D charts):**
- Max zones: 20+
- Use trend filter: Optional
- MTF Panel: Focus on 1H-1D trends
- Remove mitigated: OFF (important zones persist)
---
## Perfect For
- Smart Money Concept (SMC) traders
- ICT methodology followers
- Institutional order flow traders
- Price action traders seeking key zones
- Multi-timeframe analysis enthusiasts
**Compatible with all markets:** Forex, Crypto, Stocks, Indices, Commodities, Futures
*Trade where the institutions trade. Follow the smart money.*

SMC+The "SMC+" indicator is a comprehensive tool designed to overlay key Smart Money Concepts (SMC) levels, support/resistance zones, order blocks (OB), fair value gaps (FVG), and trap detection on your TradingView chart. It aims to assist traders in identifying potential areas of interest based on price action, swing structures, and volume dynamics across multiple timeframes. This indicator is fully customizable, allowing users to adjust lookback periods, colors, opacity, and sensitivity to suit their trading style.
Key Components and Functionality
1. Key Levels (Support and Resistance)
This section plots horizontal lines representing support and resistance levels based on highs and lows over three distinct lookback periods, plus daily nearest levels.
Short-Term Lookback Period (Default: 20 bars)
Plots the highest high (short_high) and lowest low (short_low) over the specified period.
Visualized as dotted lines with customizable colors (Short-Term Resistance Color, Short-Term Support Color) and opacity (Short-Term Resistance Opacity, Short-Term Support Opacity).
Adjustment Tip: Increase the lookback (e.g., to 30-50) for less frequent but stronger levels on higher timeframes, or decrease (e.g., to 10-15) for scalping on lower timeframes.
Long-Term Lookback Period (Default: 50 bars)
Plots broader support (long_low) and resistance (long_high) levels using a solid line style.
Customizable via Long-Term Resistance Color, Long-Term Support Color, and their respective opacity settings.
Adjustment Tip: Extend to 100-200 bars for swing trading or major trend analysis on daily/weekly charts.
Extra-Long Lookback Period (Default: 100 bars)
Identifies significant historical highs (extra_long_high) and lows (extra_long_low) with dashed lines.
Configurable with Extra-Long Resistance Color, Extra-Long Support Color, and opacity settings.
Adjustment Tip: Use 200-500 bars for monthly charts to capture macro-level key zones.
Daily Nearest Resistance and Support Levels
Dynamically calculates the nearest resistance (daily_res_level) and support (daily_sup_level) based on the current day’s price action relative to historical highs and lows.
Displayed with Daily Resistance Color and Daily Support Color (with opacity options).
Adjustment Tip: Works best on intraday charts (e.g., 15m, 1h) to track daily pivots; combine with volume profile for confirmation.
How It Works: These levels update dynamically as new highs/lows form, providing a visual guide to potential reversal or breakout zones.
2. SMC Inputs (Smart Money Concepts)
This section identifies swing structures, order blocks, fair value gaps, and entry signals based on SMC principles.
SMC Swing Lookback Period (Default: 12 bars)
Defines the period for detecting swing highs (smc_swing_high) and lows (smc_swing_low).
Adjustment Tip: Increase to 20-30 for smoother swings on higher timeframes; reduce to 5-10 for faster signals on lower timeframes.
Minimum Swing Size (%) (Default: 0.5%)
Filters out minor price movements to focus on significant swings.
Adjustment Tip: Raise to 1-2% for volatile markets (e.g., crypto) to avoid noise; lower to 0.2-0.3% for forex pairs with tight ranges.
Order Block Sensitivity (Default: 1.0)
Scales the size of detected order blocks (OBs) for bullish reversal (smc_ob_bull), bearish reversal (smc_ob_bear), and continuation (smc_cont_ob).
Visuals include customizable colors, opacity, border thickness, and blinking effects (e.g., SMC Bullish Reversal OB Color, SMC Bearish Reversal OB Blink Thickness).
Adjustment Tip: Increase to 1.5-2.0 for wider OBs in choppy markets; keep at 1.0 for precision in trending conditions.
Minimum FVG Size (%) (Default: 0.3%)
Sets the minimum gap size for Fair Value Gaps (fvg_high, fvg_low), displayed as boxes with Fair Value Gap Color and FVG Opacity.
Adjustment Tip: Increase to 0.5-1% for larger, more reliable gaps; decrease to 0.1-0.2% for scalping smaller inefficiencies.
How It Works:
Bullish Reversal OB: Detects a bearish candle followed by a bullish break, marking a potential demand zone.
Bearish Reversal OB: Identifies a bullish candle followed by a bearish break, marking a supply zone.
Continuation OB: Spots strong bullish momentum after a prior high, indicating a continuation zone.
FVG: Highlights bullish gaps where price may retrace to fill.
Entry Signals: Plots triangles (SMC Long Entry) when price retests an OB with a liquidity sweep or break of structure (BOS).
3. Trap Inputs
This section detects potential bull and bear traps based on price action, volume, and key level rejections.
Min Down Move for Bear Trap (%) (Default: 1.0%)
Sets the minimum drop required after a bearish OB to qualify as a trap.
Visualized with Bear Trap Color, Bear Trap Opacity, and blinking borders.
Adjustment Tip: Increase to 2-3% for stronger traps in trending markets; lower to 0.5% for ranging conditions.
Min Up Move for Bull Trap (%) (Default: 1.0%)
Sets the minimum rise required after a bullish OB to flag a trap.
Customizable with Bull Trap Color, Bull Trap Border Thickness, etc.
Adjustment Tip: Adjust similarly to bear traps based on market volatility.
Volume Lookback for Traps (Default: 5 bars)
Compares current volume to a moving average (avg_volume) to filter low-volume traps.
Adjustment Tip: Increase to 10-20 for confirmation on higher timeframes; reduce to 3 for intraday sensitivity.
How It Works:
Bear Trap: Triggers when price drops significantly after a bearish OB but reverses up with low volume or support rejection.
Bull Trap: Activates when price rises after a bullish OB but fails with low volume or resistance rejection.
Boxes highlight trap zones, resetting when price breaks out.
4. Visual Customization
Line Width (Default: 2)
Adjusts thickness of support/resistance lines.
Tip: Increase to 3-4 for visibility on cluttered charts.
Blink On (Default: Close)
Sets whether OB/FVG borders blink based on Open or Close price interaction.
Tip: Use "Open" for intraday precision; "Close" for confirmed reactions.
Colors and Opacity: Each element (OBs, FVGs, traps, key levels) has customizable colors, opacity (0-100), border thickness (1-5 or 1-7), and blink effects for dynamic visualization.
How to Use SMC+
Setup: Apply the indicator to any chart and adjust inputs based on your timeframe and market.
Key Levels: Watch for price reactions at short, long, extra-long, or daily levels for potential reversals or breakouts.
SMC Signals: Look for entry signals (triangles) near OBs or FVGs, confirmed by liquidity sweeps or BOS.
Traps: Avoid false breakouts by monitoring trap boxes, especially near key levels with low volume.
Notes:
This indicator is a visual aid and does not guarantee trading success. Combine it with other analysis tools and risk management strategies.
Performance may vary across markets and timeframes; test settings thoroughly before use.
For optimal results, experiment with lookback periods and sensitivity settings to match your trading style.
The default settings are optimal for 1 minute and 10 second time frames for small cap low float stocks.
Continuation OB are Blue.
Bullish Reversal OB color is Green
Bearish Reversal OB color is Red
FVG color is purple
Bear Trap OB is red with a green border and often appears with a Bearish Reversal OB signaling caution to a short position.
Bull trap OB is green with a Red border signaling caution to a long position.
All active OB area are highlighted and solid in color while other non active OB area are dimmed.
My personal favorite setups are when we have an active bullish reversal with an active FVG along with an active Continuation OB.
Another personal favorite is the Bearish reversal OB signaling an end to a recent uptrend.
The Trap OB detection are also a unique and Original helpful source of information.
The OB have a white boarder by default that are colored black giving a simulated blinking effect when price is acting in that zone.
The Trap OB border are colored with respect to direction of intended trap, all of which can be customized to personal style.
All vaild OB zones are shown compact in size ,a unique and original view until its no longer valid.

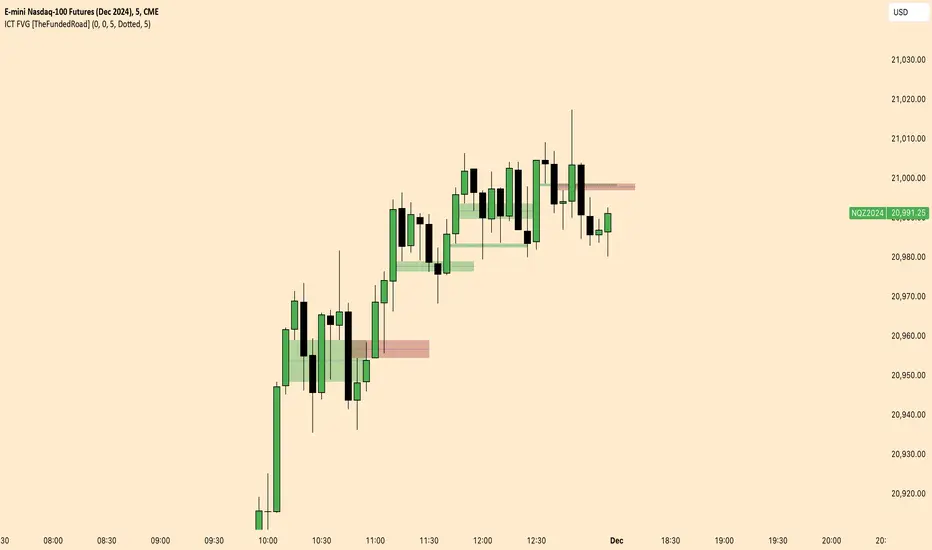
ICT FVG [TheFundedRoad]This indicator shows you all ICT Fair value gaps on chart with midpoint line
Fair value gap is a gap in a set of 3 candles, in a bullish FVG you have 1st candle high being lower than third candle low, and in a bearish FVG you have first candle low higher than third candle high, thats how this indicator finds these fair value gaps
It draws the fair value gap from the 2nd candle forward
You can customize the color and if you want to see the midpoint or not, midpoint is 50% of the gap
Gaps Trend [ChartPrime]The Gaps Trend - ChartPrime indicator is designed to detect Fair Value Gaps (FVGs) in the market and apply a trailing stop mechanism based on those gaps. It identifies both bullish and bearish gaps and provides traders with a way to manage trades dynamically as gaps appear. The indicator visually highlights gaps and uses the detected momentum to assess trend direction, helping traders identify price imbalances caused by strong buy or sell pressure.
⯁ KEY FEATURES & HOW TO USE
⯌ Fair Value Gap (FVG) Detection :
The indicator automatically detects both bullish and bearish FVGs, identifying gaps between candle highs and lows. Bullish gaps are shown in green, and bearish gaps in purple. These gaps indicate price imbalances driven by strong momentum, such as when there is significant buying or selling pressure.
Use : Traders can use FVG detection to identify periods of high price momentum, offering insight into potential continuation or exhaustion of trends.
⯌ Trailing Stop Feature Based on FVGs :
A core feature of this indicator is the trailing stop mechanism, which adjusts dynamically based on the identified FVGs. When a bullish gap is detected, the trailing stop is placed below the price to capture upward momentum, while bearish gaps result in a trailing stop placed above the price. This feature helps traders stay in trends while protecting profits as the price moves.
Use : The trailing stop follows the momentum of the price, ensuring that traders can stay in profitable trades during strong trends and exit when the momentum shifts.
bullish set up
bearish set up
⯌ Trend Direction Indication :
The indicator colors the chart according to the current trend direction based on the position of the price relative to the trailing stop. Green indicates an uptrend (bullish gap), while purple shows a downtrend (bearish gap). This provides traders with a quick visual assessment of trend direction based on the presence of gaps.
Use : Traders can monitor the chart's color to stay aligned with the market’s trend, staying long during green phases and short during purple ones.
⯌ Gap Size Filtering :
Each detected gap is assigned a numerical ranking based on its size, with larger gaps having higher rankings. The gap size filter allows traders to only display gaps that meet a minimum size threshold, focusing on the most impactful gaps in terms of price movement.
Use : Traders can use the filter to focus on gaps of a certain size, filtering out smaller, less significant gaps. The numerical ranking helps identify the largest and most influential gaps for decision-making.
⯌ FVG Level Visualization :
The indicator can display dashed lines marking the levels of previously filled FVGs. These levels represent areas where price once experienced a gap and later filled it. Monitoring these levels can provide traders with key reference points for potential reactions in price.
Use : Traders can use these gap levels to track where price has filled gaps and potentially use these levels as zones for entry, exit, or assessing market behavior.
⯁ USER INPUTS
Filter Gaps : Adjust the size threshold to filter gaps by their size ranking.
Show Gap Levels : Toggle the display of dashed lines at filled FVG levels.
Enable Trailing Stop : Activate or deactivate the trailing stop feature based on FVGs.
Trailing Stop Length : Set the number of bars used to calculate the trailing stop.
Bullish/Bearish Colors : Customize the colors representing bullish and bearish gaps.
⯁ CONCLUSION
The Gaps Trend indicator combines Fair Value Gap detection with a dynamic trailing stop feature to help traders manage trades during periods of high price momentum. By detecting gaps caused by strong buy or sell pressure and applying adaptive stops, the indicator provides a powerful tool for riding trends and managing risk. The additional ability to filter gaps by size and visualize previously filled gaps enhances its utility for both trend-following and risk management strategies.

FVG Detector LibraryLibrary "FVG Detector Library"
🔵 Introduction
To save time and improve accuracy in your scripts for identifying Fair Value Gaps (FVGs), you can utilize this library. Apart from detecting and plotting FVGs, one of the most significant advantages of this script is the ability to filter FVGs, which you'll learn more about below. Additionally, the plotting of each FVG continues until either a new FVG occurs or the current FVG is mitigated.
🔵 Definition
Fair Value Gap (FVG) refers to a situation where three consecutive candlesticks do not overlap. Based on this definition, the minimum conditions for detecting a fair gap in the ascending scenario are that the minimum price of the last candlestick should be greater than the maximum price of the third candlestick, and in the descending scenario, the maximum price of the last candlestick should be smaller than the minimum price of the third candlestick.
If the filter is turned off, all FVGs that meet at least the minimum conditions are identified. This mode is simplistic and results in a high number of identified FVGs.
If the filter is turned on, you have four options to filter FVGs :
1. Very Aggressive : In addition to the initial condition, another condition is added. For ascending FVGs, the maximum price of the last candlestick should be greater than the maximum price of the middle candlestick. Similarly, for descending FVGs, the minimum price of the last candlestick should be smaller than the minimum price of the middle candlestick. In this mode, a very small number of FVGs are eliminated.
2. Aggressive : In addition to the conditions of the Very Aggressive mode, in this mode, the size of the middle candlestick should not be small. This mode eliminates more FVGs compared to the Very Aggressive mode.
3. Defensive : In addition to the conditions of the Very Aggressive mode, in this mode, the size of the middle candlestick should be relatively large, and most of it should consist of the body. Also, for identifying ascending FVGs, the second and third candlesticks must be positive, and for identifying descending FVGs, the second and third candlesticks must be negative. In this mode, a significant number of FVGs are eliminated, and the remaining FVGs have a decent quality.
4. Very Defensive : In addition to the conditions of the Defensive mode, the first and third candlesticks should not resemble very small-bodied doji candlesticks. In this mode, the majority of FVGs are filtered out, and the remaining ones are of higher quality.
By default, we recommend using the Defensive mode.
🔵 How to Use
🟣 Parameters
To utilize this library, you need to provide four input parameters to the function.
"FVGFilter" determines whether you wish to apply a filter on FVGs or not. The possible inputs for this parameter are "On" and "Off", provided as strings.
"FVGFilterType" determines the type of filter to be applied to the found FVGs. These filters include four modes: "Very Defensive", "Defensive", "Aggressive", and "Very Aggressive", respectively exhibiting decreasing sensitivity and indicating a higher number of Fair Value Gaps (FVG).
The parameter "ShowDeFVG" is a Boolean value defined as either "true" or "false". If this value is "true", FVGs are shown during the Bullish Trend; however, if it is "false", they are not displayed.
The parameter "ShowSuFVG" is a Boolean value defined as either "true" or "false". If this value is "true", FVGs are displayed during the Bearish Trend; however, if it is "false", they are not displayed.
FVGDetector(FVGFilter, FVGFilterType, ShowDeFVG, ShowSuFVG)
Parameters:
FVGFilter (string)
FVGFilterType (string)
ShowDeFVG (bool)
ShowSuFVG (bool)
🟣 Import Library
You can use the "FVG Detector" library in your script using the following expression:
import TFlab/FVGDetectorLibrary/1 as FVG
🟣 Input Parameters
The descriptions related to the input parameters were provided in the "Parameter" section. In this section, for your convenience, the code related to the inputs is also included, and you can copy and paste it into your script.
PFVGFilter = input.string('On', 'FVG Filter', )
PFVGFilterType = input.string('Defensive', 'FVG Filter Type', )
PShowDeFVG = input.bool(true, ' Show Demand FVG')
PShowSuFVG = input.bool(true, ' Show Supply FVG')
🟣 Call Function
You can copy the following code into your script to call the FVG function. This code is based on the naming conventions provided in the "Input Parameter" section, so if you want to use exactly this code, you should have similar parameter names or have copied the "Input Parameter" values.
FVG.FVGDetector(PFVGFilter, PFVGFilterType, PShowDeFVG, PShowSuFVG)

BuLLzEyE_MNQ FVG/IFVG SystemFVG Boxes
These are the main trading zones. The indicator automatically detects Fair Value Gaps and draws boxes on your chart:
• GREEN boxes = Bullish FVG (potential buy zone)
• RED boxes = Bearish FVG (potential sell zone)
• YELLOW boxes = IFVG (Inverse FVG - filled gaps that now act as support/resistance)
• GRAY boxes = Mitigated FVG (gap has been filled)
• WHITE dashed line = 50% level (optimal entry point within the FVG)
Session Boxes
Session boxes show you the high/low range of each major trading session. This helps identify where liquidity sits:
• PURPLE = Asia Session (6:00 PM - 3:00 AM ET)
• BLUE = London Session (3:00 AM - 12:00 PM ET)
• ORANGE = New York Session (9:30 AM - 4:00 PM ET)
• TEAL = Sydney Session (5:00 PM - 2:00 AM ET)
• LIME GREEN = Kill Zone / London-NY Overlap (8:00 AM - 11:00 AM ET) - BEST TRADING TIME
Entry Signals
• GREEN triangle pointing UP = Long entry signal at a Bullish FVG (not 100% reliable)
• RED triangle pointing DOWN = Short entry signal at a Bearish FVG (not 100% reliable)
Liquidity Sweeps
• RED X with 'SWEEP' = Previous Day High (PDH) was swept
• GREEN X with 'SWEEP' = Previous Day Low (PDL) was swept
• Dotted lines = PDH (red) and PDL (green) levels
Information Tables
HTF Bias Table (Top Right): Shows whether the higher timeframe (default 15m) is bullish or bearish, the number of active FVGs, and whether you're in the trading session.
Risk Calculator Table (Bottom Right): Shows your risk amount and calculates how many contracts you can trade for different stop loss sizes (5pt, 10pt, 15pt).
How It Works
What is a Fair Value Gap?
A Fair Value Gap (FVG) is a 3-candle pattern where aggressive buying or selling creates a price void. Specifically, it's when the wick of the first candle doesn't overlap with the wick of the third candle, leaving a gap in between. Price tends to return to these gaps to 'rebalance' before continuing in the original direction.
What is an Inverse FVG?
When an FVG gets filled (price returns and closes through the gap), it becomes an Inverse FVG (IFVG). These zones flip their polarity - a filled Bullish FVG becomes resistance, and a filled Bearish FVG becomes support. The indicator automatically converts mitigated FVGs to yellow IFVG boxes.
The 50% Entry Level
The dashed white line in each FVG represents the 50% level (also called Consequent Encroachment). This is considered the optimal entry point - it's the middle of the imbalance where price is most likely to react.
Suggested Trading Strategy
1. Check HTF Bias (top right table) - only trade in that direction
2. Wait for a liquidity sweep (SWEEP label appears)
3. Look for an FVG to form AFTER the sweep
4. Enter when price returns to the 50% level (dashed line)
5. Place stop loss below/above the FVG (add 2 ticks buffer)
6. Take profit at 1:2 or 1:3 risk-to-reward ratio
Settings Explained
FVG Settings
• Min FVG Size: Minimum gap size in points to be considered valid (default: 2.0)
• Max FVG Age: How many bars until an FVG is removed from chart (default: 50)
• Show 50% Entry Level: Toggle the dashed entry line on/off
Session Settings
• Show Session Boxes: Toggle all session boxes on/off
• Max Sessions to Show: How many historical sessions to display (default: 5)
• Individual Session Toggles: Turn each session (Asia/London/NY/Sydney/Kill Zone) on or off
Risk Calculator Settings
• Account Size: Your trading account balance
• Risk Per Trade: Percentage of account to risk per trade (default: 0.5%)
• Tick Value/Size: Contract specifications for MNQ ($0.50 per tick, 0.25 point tick size)
Tips for Best Results
1. Trade during the Kill Zone (8:00-11:00 AM ET) for best volatility and liquidity
2. Always align trades with HTF bias - don't fight the trend
3. Wait for liquidity sweeps before entering - this confirms smart money activity
4. Use the 50% level for entries - it offers the best risk-to-reward
5. Watch for IFVG zones as additional confluence for entries
6. Use the risk calculator to size positions properly - never risk more than you can afford
7. Session boxes help identify where stops are clustered - sweeps of these levels often precede reversals
Available Alerts
• New FVG Formed (Bullish or Bearish)
• Price Touching 50% Entry Level
• FVG Mitigated (gap filled)
• Long Entry Signal
• Short Entry Signal
• PDH/PDL Liquidity Sweep
─────────────────────────────────────
Created by BullyTrading
Designed for MNQ Prop Firm Trading

无敌大饺子缺口Indicator Name:Dumpling Price Action Gaps (Price Action Gaps)
Type: Price Action Indicator / Technical Analysis Tool
Applicable Markets: Stocks, Futures, Forex, Cryptocurrencies, and other charting markets
Timeframe: Any timeframe; supports multi-timeframe EMA smoothing
Indicator Overview
This indicator is a visual analysis tool based on Price Action and Fair Value Gaps (FVGs). It automatically identifies bullish and bearish gaps in the market, helping traders spot potential support and resistance areas, gap fill opportunities, and market sentiment turning points.
By combining EMA (Exponential Moving Average) and ATR (Average True Range) filtering, the indicator clearly plots on the chart:
Bullish Gaps: Highlight rapid upward price gaps.
Bearish Gaps: Highlight rapid downward price gaps.
Mitigation Zones: Mark areas where gaps are likely to be filled, assisting in judging potential price retracements.
Historical Gaps: Optionally display past gaps for multi-timeframe analysis.
Smoothed EMA20: Provides both current and multi-timeframe trend references to make gap analysis more reliable.
Key Features
Intelligent Gap Detection: Automatically identifies gap types by comparing the high and low of the current bar with the previous two bars.
Fair Value Filtering: Uses ATR to filter out insignificant gaps, reducing noise.
Visual Gap Fill Percentage: Displays the percentage of gap fill, helping traders gauge the strength of retracement.
Multi-Timeframe Smoothing: Supports current and 5-minute smoothed EMA to capture short-term trend impacts.
Flexible Across Timeframes: Suitable for intraday or swing trading strategies.
Use Cases
Support/Resistance Identification: Gap tops and bottoms can act as potential support or resistance levels.
Trend Continuation Confirmation: If price breaks through a gap without filling it, the trend is likely to continue.
Retracement Strategy: Gap fill zones can serve as potential entry or exit points for short-term trades.
Risk Management: Historical gaps help identify high-risk zones, optimizing stop-loss placement.
中文:
指标介绍
指标名称:无敌大饺子价格行为缺口(Dumpling Price Action Gaps)
类型:价格行为指标 / 技术分析工具
适用市场:股票、期货、外汇、加密货币等各类K线图市场
周期适用:任意时间周期,指标支持跨周期 EMA 平滑显示
功能概述
是一种基于价格行为(Price Action)和公允价值缺口(Fair Value Gap, FVG)的可视化分析工具。它通过自动识别市场中的看涨和看跌缺口,帮助交易者发现潜在的支撑与阻力区域、回补机会以及市场情绪转折点。
该指标结合了 EMA(指数移动平均)和 ATR(平均真实波幅)过滤,能够在图表上清晰绘制出:
看涨缺口(Bullish Gap):显示市场快速上涨形成的价格缺口。
看跌缺口(Bearish Gap):显示市场快速下跌形成的价格缺口。
回补区域(Mitigation Zone):标记缺口可能被回补的区域,辅助判断价格回调的概率。
历史缺口(Historical Gaps):可选择显示历史上形成的缺口,便于进行多周期分析。
平滑 EMA20(Smoothed EMA20):提供当前周期和跨周期的趋势参考,使缺口分析更加可靠。
核心特点
智能缺口识别:通过比较当前 K 线与前两根 K 线的高低价,自动判断缺口类型。
公允价值过滤:结合 ATR 值过滤掉微小缺口,避免噪音干扰。
可视化百分比显示:支持显示缺口回补的百分比,让交易者直观判断回补强弱。
跨周期平滑:可显示当前周期和平滑 5 分钟 EMA,帮助捕捉短期趋势与缺口冲击。
多周期适用:支持不同时间周期图表,可灵活应用于日内交易或波段策略。
使用场景
支撑/阻力判断:缺口上沿和下沿可以作为潜在支撑或阻力区域。
趋势延续确认:价格突破缺口并未回补时,表明趋势可能继续延续。
回调策略:当价格回补缺口至回补区域时,可作为短线交易的进出参考。
风险管理:历史缺口帮助交易者识别潜在高风险区域,优化止损设置。

MirPapa:ICT:HTF: FVG OB Threeple# MirPapa:ICT:HTF: FVG OB (Fair Value Gap Order Block)
**Version:** Pine Script® v6
**Author:** © goodia
**License:** MPL-2.0 (Mozilla Public License 2.0)
---
## Overview
“FVG OB” (Fair Value Gap Order Block) identifies higher-timeframe candle ranges where a gap (imbalance) exists between two non-consecutive candles, signaling potential institutional order blocks. This module draws bullish or bearish FVG OB boxes on your lower-timeframe chart, extends them until price interacts a specified number of times, and then finalizes (recolors) the box.
---
## Inputs
- **Enable FVG OB Boxes** (`bool`)
Toggle drawing of HTF FVG OB boxes on the chart.
- **Enable FVG OB Midlines** (`bool`)
Toggle drawing of a midpoint line inside each FVG OB box.
- **FVG OB Close Count** (`int` 1–10)
Number of HTF closes beyond the FVG range required to finalize (recolor) the box.
- **FVG OB Bull Color** (`color`)
Fill & border color for bullish FVG OB boxes.
- **FVG OB Bear Color** (`color`)
Fill & border color for bearish FVG OB boxes.
- **FVG OB Box Transparency** (`int` 1–100)
Opacity level for FVG OB box fills (higher = more transparent).
---
## How It Works
1. **HTF Data Retrieval**
- The script uses `request.security()` (via `GetHTFrevised()`) to fetch HTF OHLC and historical values:
- `_htfHigh3` (high three bars ago) and `_htfLow1` (low one bar ago) for bullish FVG OB.
- `_htfLow3` (low three bars ago) and `_htfHigh1` (high one bar ago) for bearish FVG OB.
- It also tracks the HTF `bar_index` on the lower timeframe to align drawing.
2. **FVG OB Detection**
- **Bullish FVG OB**: Occurs when the HTF low of the previous bar (`low `) is strictly above the HTF high of three bars ago (`high `), creating a gap.
- **Bearish FVG OB**: Occurs when the HTF high of the previous bar (`high `) is strictly below the HTF low of three bars ago (`low `), creating a gap.
3. **Box Creation**
- On each new HTF bar (`ta.change(time(HTF)) != 0`), if a bullish or bearish FVG OB condition is met, the script calls `CreateBoxData()` with:
- **Bullish**: `bottom = HTF low `, `top = HTF high `, `_isBull = true`.
- **Bearish**: `bottom = HTF low `, `top = HTF high `, `_isBull = false`.
- Midline toggled by input.
- A `BoxData` struct is created and stored in either the Bull or Bear array.
4. **Box Extension & Finalization**
- On **every LTF bar**, `ProcessBoxDatas(...)` iterates over all active FVG OB boxes:
1. **Extend Right Edge**: `box.set_right(bar_index)` ensures the box follows the latest bar.
2. **Record Volume Delta**: Tracks buy/sell volume inside the box.
3. **Touch Stage Update**: `modBoxUpdateStage()` increments `_stage` when price touches its “basePoint” (for FVG OB, the basePrice is one side of the gap).
4. **Finalize**: `setBoxFinalize()` checks if the configured number of closes beyond the FVG gap (`FVG OB Close Count`) has occurred. If so:
- `_isActive := false`
- Border and background colors are changed to the “Box Close Color” (input).
- Finalized boxes remain on screen semi-transparent, indicating that the FVG OB zone has been tested.
5. **Midline (Optional)**
- If “Enable FVG OB Midlines” is checked, `ProcessBoxDatas()` also extends a horizontal midpoint line inside the box with `line.set_x2(bar_index)`.
---
## Usage Instructions
1. **Installation**
- Copy the FVG OB section of the Pine Script into TradingView’s Pine Editor (ensure the library import is included).
- Click “Add to Chart.”
2. **Configure Inputs**
- Choose a Higher Time Frame via the dropdown (e.g., “4시간” maps to a 4H timeframe).
- Toggle “Enable FVG OB Boxes” and “Enable FVG OB Midlines.”
- Select colors for bullish and bearish boxes and set transparency.
- Adjust “FVG OB Close Count” to control how many closes beyond the gap finalize the box.
3. **Interpretation**
- **Active FVG OB Boxes** extend to the right until price closes beyond the gap range the specified number of times.
- When finalized, each box changes to the “Box Close Color,” signaling that institutional orders in that gap have likely been filled.
Enjoy precise visualization of higher-timeframe Fair Value Gap Order Blocks on your lower-timeframe chart!
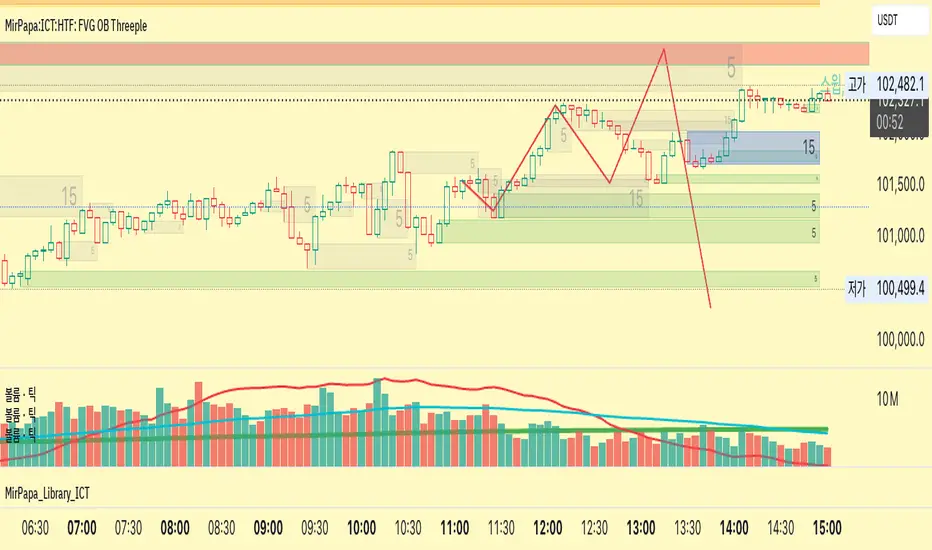
ICT Algo: Sweep + MSS + High Prob FVG/IFVGThis script is a comprehensive execution tool based on Inner Circle Trader (ICT) concepts, specifically designed to identify high-probability entries by combining Liquidity Sweeps, Market Structure Shifts (MSS), and Fair Value Gaps (FVG/IFVG).
Unlike standard FVG indicators that highlight every gap on the chart, this "Algo" version filters for gaps that occur specifically after a liquidity purge and a shift in structure, ensuring you are only looking at setups with institutional backing.
How It Works
The script follows a strict 3-step validation process before plotting a signal:
Liquidity Sweep (The Context): The script tracks Higher Timeframe (HTF) levels including Previous Day High/Low, Weekly High/Low, and Monthly High/Low. A setup is only considered valid if price has recently "swept" one of these levels, indicating a hunt for liquidity.
Market Structure Shift (The Confirmation): Once a sweep occurs, the script looks for a displacement in the opposite direction. It identifies a "Pivot High/Low" (customizable length) and waits for a candle body to close beyond it (MSS).
Filtered Entry (The Trigger): * FVG: Plots a standard Fair Value Gap if it forms within a "Deep Value" zone (Discount for longs, Premium for shorts).
IFVG (Inversion FVG): Highlights failed FVGs that have been reclaimed by price to act as support or resistance.
Key Features
Multi-Timeframe Liquidity Filters: Automatically plots PDH/L, PWH/L, PMH/L, and PYH/L. You can toggle which levels act as your sweep triggers.
Deep Value Logic: The script uses built-in logic to ensure Bullish FVGs are only highlighted when price is below a key liquidity level (Discount), and Bearish FVGs when price is above (Premium).
Dynamic Box Management: To keep your chart clean, boxes for FVGs and IFVGs are automatically shortened ("cut") once they are mitigated by price.
Inversion Logic: Includes a specialized toggle for Inversion Fair Value Gaps, allowing you to trade "failed" gaps that flip their polarity.
Settings & Customization
Entry Setup Bias: Choose to see only Bullish, only Bearish, or Both setups.
MSS Pivot Length: Adjust how "sensitive" the Market Structure Shift detection is. A higher number requires a more significant swing to be broken.
Sweep Lookback: Defines how many bars back the script looks for a liquidity sweep to remain "active" for a setup.
Include Opens: Optional toggle to include Previous Day/Week/Month Opens as liquidity points.
Usage Tips
The Golden Setup: Look for a sweep of a Previous Day High, followed by a Bearish MSS, and an entry at the Red FVG box.
Risk Management: This indicator is designed for entry identification. Always use stop losses (usually placed above/below the candle that created the FVG or the MSS swing point).
Timeframes: Best used on execution timeframes (1m, 5m, 15m) while the script handles the HTF levels automatically.
Disclaimer: This script is an educational tool and does not constitute financial advice. Trading involves significant risk. Past performance of a strategy does not guarantee future results.
Credits: Concepts based on the teachings of Michael J. Huddleston (ICT).

SMC Alpha Engine [PhenLabs]📊 SMC Alpha Engine
Version: PineScript™ v6
📌 Description
The SMC Alpha Engine is a comprehensive Smart Money Concepts indicator that automates institutional trading pattern recognition. Built for traders who understand that confluence is king, this indicator stacks multiple SMC elements together and scores them in real-time, allowing you to focus exclusively on high-probability setups.
Rather than manually tracking HTF bias, market structure, liquidity levels, order blocks, and fair value gaps separately, the SMC Alpha Engine consolidates everything into a unified scoring system. When enough factors align, you get a signal. When they don’t, you wait. This systematic approach removes emotion and subjectivity from SMC trading.
The indicator is designed around one core principle: only trade when the probabilities are stacked in your favor. By requiring multiple confluence factors before generating signals, it filters out the noise and keeps you focused on setups that institutional traders actually care about.
🚀 Points of Innovation
Automated confluence scoring system that evaluates 6 distinct SMC factors in real-time
HTF-to-LTF bias alignment ensuring trades flow with institutional direction
Intelligent liquidity sweep detection using wick-ratio analysis for confirmation
ATR-based FVG quality filtering that eliminates noise and shows only significant imbalances
Anti-spam signal logic preventing overtrading during volatile market conditions
Session-aware killzone integration timing entries with institutional activity windows
🔧 Core Components
HTF Bias Engine: Analyzes higher timeframe swing structure to establish directional bias using pivot high/low comparisons
Market Structure Module: Detects BOS (Break of Structure) and CHoCH (Change of Character) with real-time confirmation
Premium/Discount Calculator: Dynamically maps price zones relative to recent swing range equilibrium
Liquidity Tracker: Monitors swing points as liquidity targets and identifies sweep events with rejection confirmation
POI Detector: Identifies valid Order Blocks with displacement requirements and Fair Value Gaps with ATR filtering
Confluence Scorer: Aggregates all factors into bull/bear scores displayed on real-time dashboard
🔥 Key Features
Multi-timeframe analysis combining HTF directional bias with LTF precision entries
Customizable confluence threshold from 1 (low filter) to 5 (sniper mode)
Three killzone sessions: London (02:00-05:00), NY AM (08:30-11:00), NY PM (13:30-16:00)
Flexible mitigation options for OBs and FVGs: Wick, Close, 50%, or None
Visual structure labeling for BOS and CHoCH events on chart
Real-time info dashboard showing all current market conditions and scores
Built-in alert conditions for BOS, liquidity sweeps, and high-confluence signals
🎨 Visualization
Premium Zone: Red-tinted box above equilibrium indicating sell-side interest areas
Discount Zone: Green-tinted box below equilibrium indicating buy-side interest areas
Equilibrium Line: Dotted gray line marking the 50% level of current range
Order Blocks: Color-coded boxes (green for bullish, red for bearish) showing institutional candles
Fair Value Gaps: Teal boxes for bullish FVGs, maroon boxes for bearish FVGs
Killzone Backgrounds: Blue (London), Orange (NY AM), Purple (NY PM) session highlighting
Info Table: Top-right dashboard displaying HTF bias, LTF trend, zone, killzone status, and scores
📖 Usage Guidelines
HTF Settings
HTF Timeframe - Default: 60 - Controls higher timeframe for directional bias
HTF Swing Length - Default: 10, Range: 3+ - Determines pivot sensitivity for HTF trend
Market Structure Settings
LTF Swing Length - Default: 3, Range: 1-10 - Controls swing detection sensitivity
Show BOS/CHoCH - Default: Off - Toggles structure labels on chart
Show Strong/Weak Points - Default: Off - Displays swing point classifications
POI Settings
Show Valid Order Blocks - Default: Off - Displays OBs that caused displacement
Show Unmitigated FVGs - Default: On - Shows active fair value gaps
Filter FVG by ATR - Default: On - Only shows FVGs larger than 0.5x ATR
OB Mitigation Type - Options: Wick, Close, None - Determines when OBs are invalidated
FVG Mitigation Type - Options: Wick, Close, 50%, None - Determines when FVGs are filled
Confluence Settings
Minimum Score for Signal - Default: 4, Range: 1-5 - Required confluence level for entries
Show Entry Signals - Default: On - Toggles LONG/SHORT labels on chart
✅ Best Use Cases
Trend continuation trades during active killzone sessions with HTF alignment
Discount zone entries on bullish HTF bias with recent liquidity sweep below
Premium zone shorts on bearish HTF bias after liquidity grab above recent highs
Reversal identification following CHoCH with POI confluence in optimal zone
Filtering existing strategy signals by requiring minimum confluence score
⚠️ Limitations
HTF bias detection requires sufficient price history for accurate pivot identification
Liquidity sweep detection depends on wick-ratio settings and may miss some events
Order blocks require displacement confirmation which may exclude some valid zones
Confluence scoring is probabilistic and does not guarantee profitable outcomes
Killzone times are based on EST/EDT and require timezone adjustment for other regions
Signal spam prevention may delay valid signals by up to 10 bars after previous signal
💡 What Makes This Unique
Unified SMC Framework: Combines all major SMC concepts into one cohesive indicator rather than requiring multiple tools
Objective Scoring System: Removes subjectivity by quantifying confluence into measurable scores
Institutional Timing Integration: Built-in killzone awareness ensures signals align with high-volume sessions
Quality Filtering: ATR-based FVG filtering and displacement-required OBs eliminate low-quality setups
Anti-Overtrading Logic: Smart signal spacing prevents emotional trading during choppy conditions
🔬 How It Works
Step 1: HTF Bias Determination
Analyzes higher timeframe pivot highs and lows
Compares consecutive pivots to identify HH/HL (bullish) or LH/LL (bearish) sequences
Establishes directional filter that all signals must respect
Step 2: LTF Structure Mapping
Detects swing points on execution timeframe
Identifies BOS when price closes beyond confirmed swing level
Recognizes CHoCH when structure break occurs against current trend
Step 3: Confluence Calculation
Awards +1 for HTF bias alignment
Awards +1 for active killzone timing
Awards +1 for optimal zone positioning (discount for longs, premium for shorts)
Awards +1 for price at unmitigated POI
Awards +1 for recent liquidity sweep in trade direction
Awards +1 for recent supportive structure break
Step 4: Signal Generation
Compares total score against user-defined minimum threshold
Requires candle confirmation (bullish close for longs, bearish close for shorts)
Applies 10-bar spacing filter to prevent signal clustering
💡 Note:
This indicator is designed for traders already familiar with Smart Money Concepts. While it automates detection and scoring, understanding why each factor matters will significantly improve your ability to filter signals and manage trades effectively. Use the minimum confluence setting to match your risk tolerance, higher values mean fewer but higher-quality signals.

Scout Regiment - D17# Scout Regiment - D17 Indicator
## English Documentation
### Overview
Scout Regiment - D17 is a comprehensive TradingView indicator that combines multiple technical analysis tools into one powerful overlay indicator. It provides traders with market structure analysis, divergence detection, volume profiling, smart money concepts, and session analysis.
### Key Features
#### 1. **EMA (Exponential Moving Averages)**
- **Purpose**: Trend identification and dynamic support/resistance levels
- **Configuration**: 13 customizable EMAs with adjustable periods
- **Default Active EMAs**: EMA 3 (21), EMA 5 (55), EMA 7 (144), EMA 8 (233)
- **Uses**: Identify trend direction, entry/exit points, and trend strength
- **Color Coding**: Different colors for easy visual distinction
#### 2. **TFMA (Timeframe Moving Averages)**
- **Purpose**: Multi-timeframe trend analysis
- **Features**:
- 3 EMAs on higher timeframes
- Dynamic labels showing trend direction
- Price difference percentage display
- Customizable timeframe settings
- **Default Settings**: 21-period timeframe with lengths 55, 144, and 233
- **Benefits**: Align trades with higher timeframe trends
#### 3. **DFMA (Daily Frame Moving Averages)**
- **Purpose**: Daily timeframe perspective on any chart
- **Features**: Similar to TFMA but specifically for daily analysis
- **Default Timeframe**: 1D (Daily)
- **Use Case**: Long-term trend confirmation and positioning
#### 4. **PMA (Price Moving Averages)**
- **Purpose**: Price channel analysis with filled areas
- **Configuration**: 7 customizable moving averages with fill zones
- **Default Lengths**: 12, 144, 169, 288, 338, 576, 676
- **Visual**: Color-filled zones between selected MAs for channel trading
#### 5. **VWAP (Volume Weighted Average Price)**
- **Purpose**: Institutional trading levels and fair value
- **Features**:
- Multiple anchor periods (Session, Week, Month, Quarter, Year, etc.)
- Standard deviation bands
- Corporate event anchoring (Earnings, Dividends, Splits)
- **Use Case**: Identify institutional support/resistance and mean reversion opportunities
#### 6. **Divergence Detector**
- **Purpose**: Identify potential trend reversals
- **Supported Indicators**: MACD, MACD Histogram, RSI, Stochastic, CCI, Williams %R, Bias, Momentum, OBV, SOBV, VWmacd, CMF, MFI, and external indicators
- **Divergence Types**:
- Regular Bullish/Bearish
- Hidden Bullish/Bearish
- **Features**:
- Automatic divergence line drawing
- Customizable detection parameters
- Color-coded alerts
#### 7. **Volume Profile & Node Detection**
- **Purpose**: Identify key price levels based on volume distribution
- **Features**:
- Volume Profile with POC (Point of Control)
- Value Area High (VAH) and Value Area Low (VAL)
- Peak and trough volume node detection
- Highest/lowest volume node highlighting
- **Lookback**: Configurable (default 377 bars)
- **Use Case**: Identify support/resistance zones and liquidity areas
#### 8. **Smart Money Concepts**
- **Purpose**: Track institutional trading patterns
- **Features**:
- Market Structure (BOS - Break of Structure, CHoCH - Change of Character)
- Internal and Swing structures
- Strong/Weak Highs and Lows
- Equal Highs/Lows detection
- Fair Value Gaps (FVG)
- **Modes**: Historical or Present (latest only)
- **Use Case**: Trade with institutional flow
#### 9. **Trading Sessions**
- **Purpose**: Analyze market behavior during different global sessions
- **Available Sessions**:
- Asian Session
- Sydney, Tokyo, Shanghai, Hong Kong
- European Session
- London, New York, NYSE
- **Features**:
- Session boxes with high/low visualization
- Real-time countdown timers
- Volume and price change tracking
- Information table with session statistics
- **Customization**: Choose which sessions to display, colors, and box styles
### How to Use
#### For Trend Following:
1. Enable EMAs 3, 5, 7, and 8
2. Use TFMA for higher timeframe confirmation
3. Look for price above/below key EMAs for trend direction
4. Use VWAP as additional confirmation
#### For Reversal Trading:
1. Enable Divergence Detector with MACD Histogram and Bias
2. Look for divergences at key support/resistance levels
3. Confirm with Smart Money CHoCH signals
4. Use Volume Profile nodes as entry/exit targets
#### For Intraday Trading:
1. Enable Trading Sessions
2. Focus on high-volume sessions (London, New York overlap)
3. Use session highs/lows as support/resistance
4. Trade Fair Value Gaps during active sessions
#### For Swing Trading:
1. Use DFMA for daily trend
2. Enable PMA for channel identification
3. Look for price reactions at volume profile value areas
4. Confirm with swing structure breaks
### Best Practices
1. **Don't Overcrowd**: Enable only the components you need for your strategy
2. **Multi-Timeframe Analysis**: Always check higher timeframe TFMA/DFMA
3. **Confluence**: Look for multiple signals confirming the same direction
4. **Volume Confirmation**: Use Volume Profile to validate price action
5. **Session Awareness**: Be aware of which session is active for volatility expectations
### Performance Optimization
- Disable unused features to improve chart loading speed
- Use "Present Mode" for Smart Money Concepts if historical data isn't needed
- Reduce Volume Profile lookback period on slower devices
### Alerts
The indicator includes alert conditions for:
- All divergence types (8 conditions)
- Smart Money structure breaks (8 conditions)
- Equal highs/lows detection
- Fair Value Gaps formation
---
## 中文说明文档
### 概述
Scout Regiment - D17 是一款综合性TradingView指标,将多个技术分析工具整合到一个强大的叠加指标中。它为交易者提供市场结构分析、背离检测、成交量分析、聪明钱概念和时区分析。
### 核心功能
#### 1. **EMA(指数移动平均线)**
- **用途**:趋势识别和动态支撑阻力位
- **配置**:13条可自定义周期的EMA
- **默认启用**:EMA 3(21)、EMA 5(55)、EMA 7(144)、EMA 8(233)
- **应用**:识别趋势方向、进出场点位和趋势强度
- **颜色编码**:不同颜色便于视觉区分
#### 2. **TFMA(时间框架移动平均线)**
- **用途**:多时间框架趋势分析
- **特点**:
- 3条更高时间框架的EMA
- 显示趋势方向的动态标签
- 价格差异百分比显示
- 可自定义时间框架设置
- **默认设置**:21周期时间框架,长度为55、144和233
- **优势**:使交易与更高时间框架趋势保持一致
#### 3. **DFMA(日线框架移动平均线)**
- **用途**:在任何图表上提供日线时间框架视角
- **特点**:与TFMA类似,但专门用于日线分析
- **默认时间框架**:1D(日线)
- **使用场景**:长期趋势确认和定位
#### 4. **PMA(价格移动平均线)**
- **用途**:价格通道分析与填充区域
- **配置**:7条可自定义的移动平均线,带填充区域
- **默认长度**:12、144、169、288、338、576、676
- **视觉效果**:选定MA之间的彩色填充区域,用于通道交易
#### 5. **VWAP(成交量加权平均价格)**
- **用途**:机构交易水平和公允价值
- **特点**:
- 多个锚定周期(交易日、周、月、季度、年等)
- 标准差波段
- 企业事件锚定(财报、分红、拆股)
- **使用场景**:识别机构支撑阻力和均值回归机会
#### 6. **背离检测器**
- **用途**:识别潜在趋势反转
- **支持指标**:MACD、MACD柱状图、RSI、随机指标、CCI、威廉指标、乖离率、动量、OBV、SOBV、VWmacd、CMF、MFI及外部指标
- **背离类型**:
- 常规看涨/看跌背离
- 隐藏看涨/看跌背离
- **特点**:
- 自动绘制背离连线
- 可自定义检测参数
- 颜色编码警报
#### 7. **成交量分布与节点检测**
- **用途**:基于成交量分布识别关键价格水平
- **特点**:
- 成交量分布图与POC(控制点)
- 价值区域高点(VAH)和低点(VAL)
- 峰值和低谷成交量节点检测
- 最高/最低成交量节点突出显示
- **回溯期**:可配置(默认377根K线)
- **使用场景**:识别支撑阻力区域和流动性区域
#### 8. **聪明钱概念**
- **用途**:追踪机构交易模式
- **特点**:
- 市场结构(BOS-突破结构、CHoCH-结构转变)
- 内部和摆动结构
- 强/弱高低点
- 等高/等低检测
- 公允价值缺口(FVG)
- **模式**:历史模式或当前模式(仅最新)
- **使用场景**:跟随机构资金流动交易
#### 9. **交易时区**
- **用途**:分析不同全球时段的市场行为
- **可用时段**:
- 亚洲时段
- 悉尼、东京、上海、香港
- 欧洲时段
- 伦敦、纽约、纽交所
- **特点**:
- 时段方框显示高低点
- 实时倒计时
- 成交量和价格变化追踪
- 时段统计信息表格
- **自定义**:选择显示哪些时段、颜色和方框样式
### 使用方法
#### 趋势跟随策略:
1. 启用EMA 3、5、7和8
2. 使用TFMA进行更高时间框架确认
3. 观察价格在关键EMA上方/下方确定趋势方向
4. 使用VWAP作为额外确认
#### 反转交易策略:
1. 启用背离检测器(MACD柱状图和乖离率)
2. 在关键支撑阻力位寻找背离
3. 用聪明钱CHoCH信号确认
4. 使用成交量分布节点作为进出场目标
#### 日内交易策略:
1. 启用交易时区
2. 关注高成交量时段(伦敦、纽约重叠时段)
3. 使用时段高低点作为支撑阻力
4. 在活跃时段交易公允价值缺口
#### 波段交易策略:
1. 使用DFMA确定日线趋势
2. 启用PMA识别通道
3. 观察价格在成交量分布价值区域的反应
4. 用摆动结构突破确认
### 最佳实践
1. **避免过度拥挤**:仅启用策略所需的组件
2. **多时间框架分析**:始终检查更高时间框架的TFMA/DFMA
3. **汇合点**:寻找多个信号确认同一方向
4. **成交量确认**:使用成交量分布验证价格行为
5. **时段意识**:了解当前活跃时段以预期波动性
### 性能优化
- 禁用未使用的功能以提高图表加载速度
- 如果不需要历史数据,对聪明钱概念使用"当前模式"
- 在较慢设备上减少成交量分布回溯期
### 警报
指标包含以下警报条件:
- 所有背离类型(8个条件)
- 聪明钱结构突破(8个条件)
- 等高/等低检测
- 公允价值缺口形成
---
## Technical Support
For questions or issues, please refer to the TradingView community or contact the indicator creator.
## 技术支持
如有问题,请参考TradingView社区或联系指标创建者。

Fractals + FVG [Combined]Звісно, ось варіант опису англійською, який можна використати для публікації індикатора в TradingView.
Description
This script combines two powerful and widely-used trading concepts into a single, comprehensive indicator: Bill Williams Fractals with dynamic support/resistance lines and Fair Value Gaps (FVG) based on the popular logic from LuxAlgo.
The goal is to provide a cleaner chart by merging two essential tools, allowing traders to analyze market structure and imbalances simultaneously.
Features
1. Williams Fractals with Invalidation Lines
This part of the indicator identifies classic Bill Williams fractals and enhances them with a unique visualization feature.
Fractal Detection: Automatically identifies both bullish (bottom) and bearish (top) fractals. You can choose between a 3-bar or 5-bar pattern in the settings.
Dynamic S/R Lines: A horizontal line is automatically drawn from every confirmed fractal, acting as a potential support or resistance level.
Automatic Invalidation: A line is considered "invalidated" or breached when the body of a candle closes past it. When this happens, the line stops extending, changes its color to the "invalidated" color, and remains on the chart as a historical reference. This provides a clear, objective signal that a level has been broken.
Customization: You can fully customize the colors for the support, resistance, and invalidated lines to match your chart theme.
2. Fair Value Gaps (FVG) / Imbalance
This module incorporates the robust FVG detection logic from LuxAlgo to automatically identify and display market imbalances.
FVG Detection: Highlights bullish and bearish Fair Value Gaps on the chart with colored boxes, representing inefficiencies in price delivery.
Automatic Mitigation: The FVG boxes are automatically removed from the chart once the price has "mitigated" or filled the gap, keeping your workspace clean and focused on active imbalances.
Multi-Timeframe (MTF): You can set the indicator to find and display FVGs from a higher timeframe directly on your current chart.
Dashboard: An optional on-screen dashboard provides a quick summary of the total count of bullish/bearish FVGs and the percentage that have been mitigated.
Full Customization: Control the colors of FVG boxes, extend their length, and configure other visual style settings.
How to Use
Fractal Lines: Use the active support and resistance lines as key levels for potential bounces or breaks. A line's invalidation can serve as confirmation of a shift in market structure.
FVG Zones: Fair Value Gaps often act as "magnets" for price. Use these zones as potential targets for your trades or as areas of interest for entries when price retraces to fill the imbalance.
Combined Strategy: The true power of this indicator comes from combining both concepts. For example, a bullish FVG forming near a key fractal support level can create a high-probability confluence zone for a long entry. Similarly, a break and invalidation of a fractal resistance line might signal that price is heading towards the next bearish FVG above.
This indicator is a tool for analysis and should be used in conjunction with your own trading strategy and risk management rules.

Anti-SMT + FVG SignalMade by Laila
Anti-SMT + FVG Strategy
A contrarian price-action strategy that combines SMT illusion with Fair Value Gap (FVG) confirmation and multiple filters.
Strategy Concept
This strategy challenges traditional SMT divergence logic. Instead of entering trades based on expected SMT divergence between correlated pairs (e.g., EURUSD and DXY), it assumes the divergence is false and will reverse. The concept is to take advantage of these false signals, also known as "SMT illusions."
To confirm the setup, the strategy integrates Fair Value Gaps (FVGs), which are price imbalances left unfilled between candle 1 and 3.
Anti-SMT Logic
Short Entry:
EURUSD makes a new high (Candle 1)
DXY does not make a new low
Long Entry:
EURUSD makes a new low (Candle 1)
DXY does not make a new high
This divergence is considered false, and the strategy expects a reversal.
Fair Value Gap (FVG) Confirmation
A trade is only triggered if the price touches a Fair Value Gap during:
Candle 1 (the candle that forms the SMT illusion), or
Candle 2 (entry confirmation)
This helps avoid low-quality setups and increases entry precision.
Additional Filters
To improve robustness and prevent overfitting, the strategy includes:
EMA Trend Filter:
Long entries are allowed only if price is above the 50 EMA
Short entries are allowed only if price is below the 50 EMA
Time Filter:
Trades are only permitted between 08:00 and 18:00 UTC
Cooldown Filter:
A minimum of 10 candles between trades is required to prevent overtrading
Strategy Parameters and Defaults
Optimized for EURUSD on the 4-hour (4H) timeframe
Includes realistic commission and slippage
Uses conservative position sizing (e.g., 1% per trade)
Backtesting over hundreds of trades shows approximately 57% win rate under default conditions
These results are historical and do not guarantee future performance
Purpose and Value
This strategy offers a structured and logical approach to contrarian trading by:
Introducing the concept of false SMT divergence
Using price inefficiencies (FVGs) as confirmation
Filtering trades with realistic and widely accepted conditions
Encouraging quality over quantity through strict entry rules
It is not a simple mashup but a well-defined trading system that blends institutional concepts in a usable framework.