Fibonacci Zone Study w/Candles - R3c0nTraderCredits:
Thank you "eykpunter" for granting me permission to use "Fibonacci Zones" to create this study
What does this do? How is it different?
This study was created so it can be used with the strategy 'Fibonacci Zone DCA Strategy - R3c0nTrader' in order to generate buy/sell signals for a 3Commas bot.
I was not able to use "eykpunter's" "Fibonacci Zones" to create these signals as it was missing the code for this. To create the buy or sell signal you need to be able to create an alert for when the price moves through the Fib levels. Unfortunately, the "price" is not available to be selected when creating an alert with the original study. Hence the need to create this new study and to resolve the issue.
This study has overlay turned off by default so it will appear in a separate pane below your active chart. I did this so I can clearly view and separate the strategy from the study.
Steps Overview:
Add the study to your chart
Configure the study to match the Fib length you used in the strategy.
Create Alerts from the study to generate the buy or sell signals to 3Commas
The below steps for creating signals are just examples! Since there are numerous ways you can open or close a trade from a signal, please do your own testing. This cannot be understated.
Example of how to generate buy signals:
After adding the study, select the three dots for this study and click on "Add an alert on Fibonacci Zone Study /w Candles…"
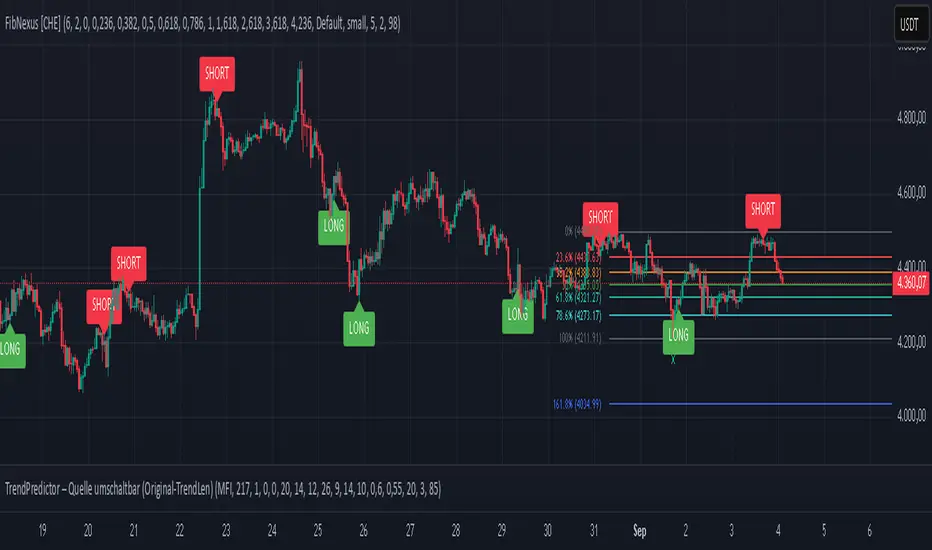
Setup the condition to trigger the alert. If you want to initiate a buy when the price crosses over the top of the lower Fib zone (downtrend zone), then use the following:
Condition>Fibonacci Zone Study>Price High>Crossing Up>Fibonacci Zone Study>Top-Low Fib Border
Options>Once per bar
Expiration>Open-ended
Alert actions>Webhook URL (use the 3Commas webhook URL)
Alert name>Enter a name, "BUY Paper-Fib-Bot"
Message>Use the 3Commas message from the paper bot to open the trade
Example of how to generate sell signals:
After adding the study, select the three dots for this study and click on "Add an alert on Fibonacci Zone Study /w Candles…"
Setup the condition to trigger the alert. If you want to initiate a sell when the price reaches the top of the High Fib zone (uptrend zone), then try the following:
Condition>Fibonacci Zone Study>Price High>Crossing Up>Fibonacci Zone Study>Top-High Fib Border
(Note: I used "Crossing Up" but "Crossing" is another option; I just haven't tested it yet with a paper bot)
Options>Once per bar
Expiration>Open-ended
Alert actions>Webhook URL (use the 3Commas webhook URL)
Alert name>Enter a name, "SELL Paper-Fib-Bot"
Message>Use the 3Commas message from the paper bot to close the trade
Indicatore Pine Script®