Alt Trading: Asia Fibonacci Strategy
The Alt Trading: Asia Fibonacci Strategy is a session-anchored liquidity and Fibonacci engine designed for traders who want to systematically exploit the overnight Asia range instead of just marking it and guessing. It automatically profiles the Asia session to build a precise high–low liquidity band, then waits for clean sweeps of that range before it will even consider a setup forcing every idea to start from an objective liquidity event. Behind the scenes, a swing-based structure model defines the dominant leg and projects a true, directionally-aligned Fibonacci map, extending down for long scenarios and up for shorts so the premium/discount zones are never “mirrored” or visually inverted. Key extension bands are converted into forward-projected price zones, with dedicated entry corridors that only activate once price has both raided the Asia high/low and traded back into the correct Fibonacci pocket. A lightweight FVG engine tracks the most recent opposing Fair Value Gap and uses its invalidation as a final confirmation step, so your long setups only trigger when a bearish imbalance has been meaningfully reclaimed and vice versa for shorts. The result is a minimal but strict playbook: sweep the Asia range, respect the leg, touch the fib zone, invalidate the opposing FVG, then and only then print a clean visual marker on the chart. Transparent fib blocks, trigger FVG highlights, and compact “double-circle” text markers keep the chart readable even on lower timeframes, while still giving you a clear sense of where the setup originated and which liquidity it’s built around. All colors and visual layers are customizable, making it easy to blend the tool into your existing layout while preserving the core logic. Rather than trying to predict the entire session, Asia Fibonacci Strategy turns one of the most consistent structures in the market overnight range and its sweep into a repeatable, rule-driven framework for high-quality intraday entries.
Cerca negli script per "fib"

Volatility Aurora [The_lurker]█░░░░░░░░░░░░░░░░░░░ VOLATILITY AURORA ░░░░░░░░░░░░░░░░░░░░█
█░░░░░░░░░░░░░░░ Where Market Energy Meets Visual Poetry ░░░░░░░░░░░░░░░░█
📖 INTRODUCTION
━━━━━━━━━━━━━━━━━━━━━━━━━━━━━━━━━━━━━━━━━━━
The Aurora Borealis occurs when charged particles from the sun collide with gases in Earth's atmosphere, creating mesmerizing waves of colorful light.
𝗩𝗼𝗹𝗮𝘁𝗶𝗹𝗶𝘁𝘆 𝗔𝘂𝗿𝗼𝗿𝗮 applies this elegant concept to financial markets:
⚡ Price Momentum = Charged Particles
🌌 ATR Layers = Atmospheric Layers
🎨 Color Intensity = Energy Magnitude
📐 Layer Expansion = Volatility State
When momentum "collides" with volatility layers, the Aurora illuminates potential market regime changes — often before they fully manifest in price action.
🔬 THE SCIENCE BEHIND IT
━━━━━━━━━━━━━━━━━━━━━━━━━━━━━━━━━━━━━━━━━━━━━━━━━━━━━━━━━━━━━━━━━━━━━━━━━━━━━
Unlike traditional volatility indicators that provide a single value, Volatility Aurora creates a 𝗺𝘂𝗹𝘁𝗶-𝗱𝗶𝗺𝗲𝗻𝘀𝗶𝗼𝗻𝗮𝗹 𝘃𝗼𝗹𝗮𝘁𝗶𝗹𝗶𝘁𝘆 𝗳𝗶𝗲𝗹𝗱 using five distinct ATR layers based on Fibonacci periods:
│ Layer │ Period │ Atmospheric │ Function │
├──────────────────────┼─────────────────┼─────────────────┤
│ Layer 1 │ 5 │ Ionosphere │ Captures immediate vol shifts
│ Layer 2 │ 13 │ Mesosphere │ Medium-term vol response
│ Layer 3 │ 34 │ Stratosphere │ Intermediate vol structure
│ Layer 4 │ 55 │ Troposphere │ Foundational vol baseline
│ Layer 5 │ 89 │ Surface │ Structural, long-term vol
⚡ CORE CONCEPTS
━━━━━━━━━━━━━━━━━━━━━━━━━━━━━━━━━━━━━━━━━━━
𝟭. 𝗟𝗮𝘆𝗲𝗿 𝗘𝘅𝗽𝗮𝗻𝘀𝗶𝗼𝗻 & 𝗖𝗼𝗻𝘁𝗿𝗮𝗰𝘁𝗶𝗼𝗻
Each layer dynamically expands or contracts based on its normalized ATR value:
• 𝗘𝘅𝗽𝗮𝗻𝗱𝗶𝗻𝗴 𝗟𝗮𝘆𝗲𝗿𝘀 → Increasing volatility regime
• 𝗖𝗼𝗻𝘁𝗿𝗮𝗰𝘁𝗶𝗻𝗴 𝗟𝗮𝘆𝗲𝗿𝘀 → Decreasing volatility / Consolidation
• 𝗕𝗿𝗲𝗮𝘁𝗵𝗶𝗻𝗴 𝗘𝗳𝗳𝗲𝗰𝘁 → Natural market rhythm visualization
𝟮. 𝗛𝗮𝗿𝗺𝗼𝗻𝘆 𝗦𝗰𝗼𝗿𝗲
Measures alignment between all five layers:
• 𝗛𝗶𝗴𝗵 𝗛𝗮𝗿𝗺𝗼𝗻𝘆 (>70%) → All timeframes agree → Strong, reliable trends
• 𝗟𝗼𝘄 𝗛𝗮𝗿𝗺𝗼𝗻𝘆 (<30%) → Timeframe divergence → Choppy conditions
𝟯. 𝗘𝗻𝗲𝗿𝗴𝘆 𝗜𝗻𝘁𝗲𝗻𝘀𝗶𝘁𝘆
Quantifies how strongly momentum is "hitting" the volatility layers:
• 𝗛𝗶𝗴𝗵 𝗜𝗻𝘁𝗲𝗻𝘀𝗶𝘁𝘆 → Strong directional conviction
• 𝗟𝗼𝘄 𝗜𝗻𝘁𝗲𝗻𝘀𝗶𝘁𝘆 → Weak momentum, potential reversal
𝟰. 𝗥𝗲𝗴𝗶𝗺𝗲 𝗖𝗹𝗮𝘀𝘀𝗶𝗳𝗶𝗰𝗮𝘁𝗶𝗼𝗻
Based on aggregate layer states:
🟢 𝗖𝗔𝗟𝗠 → Low volatility across all layers
🟡 𝗡𝗢𝗥𝗠𝗔𝗟 → Balanced market conditions
🟠 𝗩𝗢𝗟𝗔𝗧𝗜𝗟𝗘 → Elevated activity
🔴 𝗘𝗫𝗧𝗥𝗘𝗠𝗘 → Maximum volatility state
🎨 VISUAL COMPONENTS
━━━━━━━━━━━━━━━━━━━━━━━━━━━━━━━━━━━━━━━━━━━
🌈 𝗔𝘂𝗿𝗼𝗿𝗮 𝗟𝗮𝘆𝗲𝗿𝘀 (𝗚𝗿𝗮𝗱𝗶𝗲𝗻𝘁 𝗕𝗮𝗻𝗱𝘀)
• Five pairs of symmetrical bands around the price core
• Color gradient from core (bright) to outer (dim)
• Expansion reflects current volatility state
💠 𝗖𝗼𝗿𝗲 𝗟𝗶𝗻𝗲
• Central EMA-based trend line
• Color changes with momentum direction:
🟢 Cyan/Teal = Bullish
🔴 Pink/Magenta = Bearish
🟣 Purple = Neutral
💫 𝗘𝗻𝗲𝗿𝗴𝘆 𝗣𝘂𝗹𝘀𝗲 𝗟𝗶𝗻𝗲𝘀
• Diagonal flow lines showing momentum trajectory
• Thicker lines = Higher energy
• Direction indicates momentum flow
🎵 𝗛𝗮𝗿𝗺𝗼𝗻𝘆 𝗪𝗮𝘃𝗲𝘀
• Vertical dotted lines appear when harmony exceeds 70%
• Signals timeframe alignment — high-probability zones
📊 HOW TO USE
━━━━━━━━━━━━━━━━━━━━━━━━━━━━━━━━━━━━━━━━━━━
📈 𝗧𝗿𝗲𝗻𝗱 𝗙𝗼𝗹𝗹𝗼𝘄𝗶𝗻𝗴
• Enter when Aurora expands in your direction
• Core line color confirms bias
• High harmony = Higher confidence
💥 𝗩𝗼𝗹𝗮𝘁𝗶𝗹𝗶𝘁𝘆 𝗕𝗿𝗲𝗮𝗸𝗼𝘂𝘁𝘀
• Watch for regime shift from CALM to VOLATILE
• Expanding layers signal incoming movement
• Intensity spike confirms breakout strength
↩️ 𝗠𝗲𝗮𝗻 𝗥𝗲𝘃𝗲𝗿𝘀𝗶𝗼𝗻
• EXTREME regime often precedes reversals
• Contracting layers after expansion = Potential pullback
• Low harmony during trends = Weakening momentum
🛡️ 𝗥𝗶𝘀𝗸 𝗠𝗮𝗻𝗮𝗴𝗲𝗺𝗲𝗻𝘁
• Use outer layers as dynamic support/resistance
• Wider Aurora = Wider stops required
• Contracting Aurora = Tighter risk parameters
⚙️ SETTINGS GUIDE
━━━━━━━━━━━━━━━━━━━━━━━━━━━━━━━━━━━━━━━━━━━
🌌 𝗔𝘂𝗿𝗼𝗿𝗮 𝗖𝗼𝗿𝗲
│ Setting │Default │ Description
│ Layer 1-5 │ Fib │ ATR periods (5,13,34,55,89)
│ Expansion Factor │ 2.5 │ Controls layer width multiplier
│ Smoothing │ 5 │ EMA smoothing for visual clarity
⚡ 𝗘𝗻𝗲𝗿𝗴𝘆 𝗙𝗶𝗲𝗹𝗱
│ Setting │ Default │ Description
│ Momentum Length │ 14 │ Period for momentum calculation
│ Energy Lookback │ 21 │ Normalization window
│ Energy Multiplier │ 1.5 │ Amplifies energy display
🎨 𝗩𝗶𝘀𝘂𝗮𝗹
│ Setting │ Default │ Description
│ Language │ EN │ Interface language (EN/AR)
│ Show Aurora │ ✓ │ Toggle layer visibility
│ Show Core Line │ ✓ │ Toggle center line
│ Show Energy Pulse │ ✓ │ Toggle flow lines
│ Show Harmony Waves │ ✓ │ Toggle alignment indicators
🔔 ALERTS
━━━━━━━━━━━━━━━━━━━━━━━━━━━━━━━━━━━━━━━━━━━
⚡ 𝗥𝗲𝗴𝗶𝗺𝗲 𝗦𝗵𝗶𝗳𝘁 — Volatility regime changed
🎵 𝗛𝗶𝗴𝗵 𝗛𝗮𝗿𝗺𝗼𝗻𝘆 — All layers aligned (>85%)
↕️ 𝗗𝗶𝗿𝗲𝗰𝘁𝗶𝗼𝗻 𝗖𝗵𝗮𝗻𝗴𝗲 — Momentum direction reversed
🔥 𝗜𝗻𝘁𝗲𝗻𝘀𝗶𝘁𝘆 𝗦𝗽𝗶𝗸𝗲 — Energy exceeded 80% threshold
💡 TIPS FOR BEST RESULTS
━━━━━━━━━━━━━━━━━━━━━━━━━━━━━━━━━━━━━━━━━━━
1️⃣ 𝗛𝗶𝗴𝗵𝗲𝗿 𝗧𝗶𝗺𝗲𝗳𝗿𝗮𝗺𝗲𝘀 — Aurora works best on 1H+ charts
2️⃣ 𝗖𝗼𝗺𝗯𝗶𝗻𝗲 𝘄𝗶𝘁𝗵 𝗣𝗔 — Use Aurora as context, not signals
3️⃣ 𝗪𝗮𝘁𝗰𝗵 𝗛𝗮𝗿𝗺𝗼𝗻𝘆 — High harmony setups win more
4️⃣ 𝗥𝗲𝘀𝗽𝗲𝗰𝘁 𝗥𝗲𝗴𝗶𝗺𝗲 — Don't fight EXTREME volatility
5️⃣ 𝗟𝗮𝘆𝗲𝗿 𝗖𝗼𝗻𝗳𝗹𝘂𝗲𝗻𝗰𝗲 — Multi-layer bounces = Strong S/R
⚠️ DISCLAIMER
━━━━━━━━━━━━━━━━━━━━━━━━━━━━━━━━━━━━━━━━━━━
This indicator is for educational purposes only. Past performance does not
guarantee future results. Always use proper risk management and conduct your
own analysis before making trading decisions.
█████████████████████████████████████████████████████████████
█░░░░░░░░░░░░░░░░░░░░░ شفق التقلب ░░░░░░░░░░░░░░░░░░░░░░█
█░░░░░░░░░░░░░░░ حيث تلتقي طاقة السوق بالشعور البصري ░░░░░░░░░░░░░░░░█
📖 المقدمة
━━━━━━━━━━━━━━━━━━━━━━━━━━━━━━━━━━━━━━━━━━━
يحدث الشفق القطبي عندما تصطدم الجسيمات المشحونة القادمة من الشمس بالغازات في الغلاف الجوي للأرض، مما يخلق موجات ساحرة من الضوء الملون.
يطبق نفس المفهوم الأنيق على الأسواق المالية
⚡ زخم السعر = الجسيمات المشحونة
🌌 طبقات ATR = طبقات الغلاف الجوي
🎨 شدة اللون = حجم الطاقة
📐 توسع الطبقات = حالة التقلب
عندما "يصطدم" الزخم بطبقات التقلب، يُضيء الشفق التغيرات المحتملة في نظام السوق — غالباً قبل أن تتجلى بالكامل في حركة السعر.
🔬 العلم وراء المؤشر
━━━━━━━━━━━━━━━━━━━━━━━━━━━━━━━━━━━━━━━━━━━
على عكس مؤشرات التقلب التقليدية التي تقدم قيمة واحدة، يُنشئ شفق التقلب 𝗽𝗮𝗾𝗹 𝘁𝗮𝗾𝗮𝗹𝗹𝘂𝗯 𝗺𝘂𝘁𝗮'𝗮𝗱𝗱𝗶𝗱 𝗮𝗹-𝗮𝗯'𝗮𝗱 باستخدام خمس طبقات ATR مميزة مبنية على أرقام فيبوناتشي:
│ الطبقة │ الفترة │ المعادل الجوي │ الوظيفة
│ الطبقة١ │ 5 │ الأيونوسفير │ تلتقط تحولات التقلب الفورية
│ الطبقة٢ │ 13 │ الميزوسفير │ استجابة التقلب متوسطة المدى
│ الطبقة٣ │ 34 │ الستراتوسفير │ هيكل التقلب المتوسط
│ الطبقة٤ │ 55 │ التروبوسفير │ خط الأساس للتقلب
│ الطبقة٥ │ 89 │ السطح │ التقلب الهيكلي طويل المدى
⚡ المفاهيم الأساسية
━━━━━━━━━━━━━━━━━━━━━━━━━━━━━━━━━━━━━━━━━━━
𝟭. توسع وانكماش الطبقات
تتوسع أو تنكمش كل طبقة ديناميكياً بناءً على قيمة ATR المعيارية:
• طبقات متوسعة ← نظام تقلب متزايد
• طبقات منكمشة ← تقلب متناقص / تجميع
• تأثير التنفس ← تصور إيقاع السوق الطبيعي
𝟮. درجة التناغم
تقيس التوافق بين جميع الطبقات الخمس:
• تناغم عالي (>٧٠٪) ← جميع الأطر متفقة ← اتجاهات قوية
• تناغم منخفض (<٣٠٪) ← تباين الأطر ← ظروف متقطعة
𝟯. شدة الطاقة
تحدد مدى قوة "اصطدام" الزخم بطبقات التقلب:
• شدة عالية ← قناعة اتجاهية قوية
• شدة منخفضة ← زخم ضعيف، احتمال انعكاس
𝟰. تصنيف النظام
بناءً على حالات الطبقات المجمعة:
🟢 هادئ ← تقلب منخفض عبر جميع الطبقات
🟡 طبيعي ← ظروف سوق متوازنة
🟠 متقلب ← نشاط مرتفع
🔴 متطرف ← حالة التقلب القصوى
🎨 المكونات البصرية
━━━━━━━━━━━━━━━━━━━━━━━━━━━━━━━━━━━━━━━━━━━
🌈 طبقات الشفق (النطاقات المتدرجة)
• خمسة أزواج من النطاقات المتماثلة حول نواة السعر
• تدرج لوني من النواة (ساطع) إلى الخارج (خافت)
• التوسع يعكس حالة التقلب الحالية
💠 خط النواة
• خط اتجاه مركزي قائم على EMA
• يتغير اللون مع اتجاه الزخم:
🟢 سماوي = صاعد
🔴 وردي = هابط
🟣 بنفسجي = محايد
💫 خطوط نبض الطاقة
• خطوط تدفق مائلة تُظهر مسار الزخم
• خطوط أسمك = طاقة أعلى
• الاتجاه يشير إلى تدفق الزخم
🎵 موجات التناغم
• خطوط عمودية منقطة تظهر عندما يتجاوز التناغم ٧٠٪
• تشير إلى توافق الأطر الزمنية — مناطق احتمالية عالية
📊 كيفية الاستخدام
━━━━━━━━━━━━━━━━━━━━━━━━━━━━━━━━━━━━━━━━━━━
📈 تتبع الاتجاه
• ادخل عندما يتوسع الشفق في اتجاهك
• لون خط النواة يؤكد التحيز
• تناغم عالي = ثقة أعلى
💥 اختراقات التقلب
• راقب تحول النظام من هادئ إلى متقلب
• الطبقات المتوسعة تشير إلى حركة قادمة
• ارتفاع الشدة يؤكد قوة الاختراق
↩️ الارتداد للمتوسط
• النظام المتطرف غالباً يسبق الانعكاسات
• طبقات منكمشة بعد التوسع = احتمال تراجع
• تناغم منخفض أثناء الاتجاهات = زخم ضعيف
🛡️ إدارة المخاطر
• استخدم الطبقات الخارجية كدعم/مقاومة ديناميكية
• شفق أوسع = وقف خسارة أوسع مطلوب
• شفق منكمش = معايير مخاطر أضيق
⚙️ دليل الإعدادات
━━━━━━━━━━━━━━━━━━━━━━━━━━━━━━━━━━━━━━━━━━━
🌌 نواة الشفق
│ الإعداد │الافتراضي│ الوصف
│ الطبقات ١-٥ │ Fib │ فترات ATR (5,13,34,55,89)
│ معامل التوسع │ 2.5 │ يتحكم في مضاعف عرض الطبقات
│ التنعيم │ 5 │ تنعيم EMA للوضوح البصري
⚡ مجال الطاقة
│ الإعداد │الافتراضي│ الوصف
│ فترة الزخم │ 14 │ فترة حساب الزخم
│ فترة الطاقة │ 21 │ نافذة التطبيع
│ مضاعف الطاقة │ 1.5 │ يضخم عرض الطاقة
🎨 العرض البصري
│ الإعداد │الافتراضي│ الوصف
│ اللغة │ EN │ لغة الواجهة (EN/AR)
│ إظهار الشفق │ ✓ │ تبديل ظهور الطبقات
│ خط النواة │ ✓ │ تبديل الخط المركزي
│ نبض الطاقة │ ✓ │ تبديل خطوط التدفق
│ موجات التناغم │ ✓ │ تبديل مؤشرات التوافق
🔔 التنبيهات
━━━━━━━━━━━━━━━━━━━━━━━━━━━━━━━━━━━━━━━━━━━
⚡ تحول النظام — تغير نظام التقلب
🎵 تناغم عالي — جميع الطبقات متوافقة (>٨٥٪)
↕️ تغير الاتجاه — انعكس اتجاه الزخم
🔥 ارتفاع الشدة — تجاوزت الطاقة عتبة ٨٠٪
💡 نصائح للحصول على أفضل النتائج
━━━━━━━━━━━━━━━━━━━━━━━━━━━━━━━━━━━━━━━━━━━
1️⃣ الأطر الزمنية الأعلى — الشفق يعمل بشكل أفضل على ساعة فأكثر
2️⃣ ادمج مع حركة السعر — استخدم الشفق كسياق وليس إشارات
3️⃣ راقب التناغم — إعدادات التناغم العالي تربح أكثر
4️⃣ احترم النظام — لا تحارب التقلب المتطرف
5️⃣ تقاطع الطبقات — ارتداد من طبقات متعددة = دعم/مقاومة قوية
⚠️ إخلاء المسؤولية
━━━━━━━━━━━━━━━━━━━━━━━━━━━━━━━━━━━━━━━━━━━
هذا المؤشر للأغراض التعليمية فقط. الأداء السابق لا يضمن النتائج المستقبلية.
استخدم دائماً إدارة مخاطر مناسبة وقم بتحليلك الخاص قبل اتخاذ قرارات التداول.
█████████████████████████████████████████████████████████████

BK AK-FVG/SR Institutional⚔️ BK AK-FVG/SR Institutional — Smart Money Gaps. True Support/Resistance. ⚔️
There are already some excellent FVG tools out there—built by traders who’ve put in real work studying imbalance, liquidity, and smart money behavior.
BK AK-FVG/SR Institutional is simply my version of that idea: my attempt to take what I learned from those great frameworks and push it further into volume, structure, lifecycle, and accountability—so every zone is treated as a living, graded object, not just a static box on a chart.
This is my 12th script release—and that number matters to me. Twelve is structure: twelve tribes, twelve months, twelve divisions of ordered space. It’s the number of complete arrangement. So for script twelve, I’m releasing what I consider my institutional map—a tool built specifically around boundaries, alignment, and where real money chooses to defend and attack.
This script is invite-only. Access is controlled. It’s built for traders who actually respect structure, not tourists looking for colors on a chart.
“AK” in the name is not branding—it’s honor. It belongs to my mentor A.K., whose standard of discipline and clarity sits behind every decision in this tool. Above that, all glory and gratitude to Gd—the real source of any wisdom, edge, or endurance we have in this game.
🧠 What BK AK-FVG/SR Institutional Actually Does
This is a full institutional FVG/SR system, not a paintbrush. It:
Detects and manages bullish & bearish FVG zones using ATR/percent filters and aging logic
Assigns a 0–100 institutional strength score and 1–5★ rating to every zone
Builds a per-zone lower-timeframe volume profile with POC, volume delta, and optional volume text
Tracks historical touches, breaks, role reversals, merging, clustering, and divergence at the zone
Runs per-zone backtest stats and feeds that into an adaptive/ML-style confidence weight
Compresses the whole environment into a real-time Info Table: bias, market position, nearest S/R, risk, session
Fires alerts only when something actually matters: strong FVGs, magnetic pull, divergence at a level
If price is the map, this is the layer that tells you which levels are real and which are noise.
🧱 Core Engine — Institutional Zone Logic
Smart FVG Detection
Clean 3-bar gap logic for bullish & bearish FVGs
ATR or % based minimum gap size + optional distance filter from price
Zone aging with max life in bars and optional “reset on touch”
Overlap & proximity control:
Prevent overlapping zones
Enforce minimum bar spacing
Or keep only the strongest zone in a cluster
Institutional Strength & Rating
Each zone gets a score (0–100) + star rating (1–5★) based on:
Volume vs average (with optional lower timeframe split)
Gap size vs ATR
Pivot confluence
Historical meaningful touches
Role reversal (support ↔ resistance)
MTF FVG alignment
Session weighting (Asian / London / NY / overlaps)
Order block overlap & imbalance behavior
VWAP proximity/extremes
Fib level alignment
Delta divergence
Zone clustering & consolidation
Adaptive “performance weight” from historical reactions
Bad zones don’t just look weaker—they literally get filtered out when you enable minimum star / institutional filters.
📊 In-Zone Volume & Profile Intelligence
Each zone can be backed by lower-timeframe volume:
Per-zone volume histogram inside the gap
POC line at the most traded price in that zone
Optional total volume label
POC line color shifts with volume delta (buy vs sell pressure)
Additional bull/bear volume bars alongside the zone and/or numeric volume text inside the box
You’re not just staring at a gap—you’re seeing the liquidity pocket inside the gap.
🎯 Structure, Confluence & Role Reversal
The engine includes deep structural context:
Pivots: stored swing highs/lows for S/R confluence
MTF FVG Confluence: two extra timeframes for higher-timeframe alignment
Fibonacci Levels: auto-mapped 0.236 / 0.382 / 0.5 / 0.618 / 0.786 with optional lines & labels
Order Blocks & Imbalance: engulfing OB detection + volume/imbalance filters
VWAP Intelligence: VWAP proximity/extreme bonuses, optional short-form plotting
Delta Divergence: volume-based confirmation flags for zones under real internal pressure
Smart S/R Positioning & Role Flip
Hide “wrong side” zones or auto-flip roles when broken & retested
Track broken zones for N bars, then retire them
Mark role reversals with badges and strength bonuses
Support/resistance is treated like behavior, not just lines.
🤖 Adaptive Learning & Backtesting
Each zone is monitored when price touches it:
Checks if price respects the zone and moves X points away (success)
Or violates beyond failure threshold (failure)
Tracks successes, failures, and win rate per zone
Feeds a confidence score into an adaptive weight so consistently performing zones matter more
Zones that meet the bar get ML/🤖 marking when enabled
The script doesn’t just say “this looks strong”—it tracks how it actually behaved.
📋 Info Table & Sessions — On-Chart War Room
On the latest bar, an Info Table summarizes:
Zone count (bull vs bear)
Market position (NEAR SUPPORT / NEAR RESISTANCE / ABOVE RESISTANCE / BELOW SUPPORT / NEUTRAL)
Nearest S/R levels
Trade bias (BULLISH / BEARISH / NEUTRAL)
Active session (ASIAN / LONDON / NY / OVERLAP / OFF)
Risk level (LOW / MED / HIGH)
Sessions are coded in EST with multipliers so you can weight London/NY more heavily than Asia if that matches your playbook.
Hover the table for a strategy tooltip: live market posture, suggested behavior near the zones, and context around the current environment.
⚠ Divergence & Alerts
Real-time RSI/OBV/ADX divergence detection at the zone
Flexible visual modes: border, icon, color change, or combinations
Alerts included:
Magnetic Zone Pull (price entering ATR-based “field” of a strong zone)
Strong Bullish FVG
Strong Bearish FVG
Divergence at Zone
Let the chart call you when a real decision point appears, instead of forcing you to stare all day.
🕹 How to Use BK AK-FVG/SR Institutional
1️⃣ Build Bias With Structure
Use the Info Table, star ratings, and where the 4–5★ zones cluster relative to price to decide which side of the tape you’re allowed to trade on.
2️⃣ Only Trade From Strong, Aligned Zones
Focus on 4–5★ zones with confluence (pivots, Fib, OB, VWAP, clustering).
Use the zone body/wick region as your execution area, not some random mid-air candle.
3️⃣ Treat Role Reversal & Clusters as Campaign Nodes
When a strong zone breaks, flips role, and collects touches, that’s campaign territory—not scalp noise.
4️⃣ Use Divergence/Delta as a Brake, Not a Toy
If divergence lights up at your level, respect it: size down, wait for confirmation, or stand down.
5️⃣ Let the Engine Filter Junk For You
Tune volMultiplier, star thresholds, session multipliers, distance filters, and min star rating to match your timeframe and instrument.
This script’s job is to remove your excuse for taking low-quality trades.
📜 Boundaries & Wisdom
King Solomon wrote:
“Do not remove the ancient boundary stone that your fathers have set.”
This tool is built around that idea. It maps where the real boundaries live—where smart money defends, attacks, traps, and reverses.
It will not give you discipline. It will simply remove the illusion that “you didn’t know the level was there.”
🔒 Access & Usage
This is an invite-only TradingView script.
Access is granted at my discretion to traders who take structure, risk, and discipline seriously.
⚔️ BK AK-FVG/SR Institutional — Map the Smart Money Gaps. Trade Only the Real Levels.
May Gd bless your vision, your patience, and every decision you make at the edge. 🙏

Sniper 50: VFI Lockedבבקשה. הנה תיאור מקצועי, חד וברור באנגלית עבור האינדיקטור הסופי שבנינו (Sniper 50: VFI Locked). זה כתוב בצורה שמתאימה לפרסום ב-TradingView או לשיתוף עם סוחרים אחרים, ומסביר בדיוק את ה"מוח" מאחורי המערכת.
תעתיק את זה:
Name:
Sniper 50: VFI Locked & Fib Guard
Description:
Overview This is a comprehensive "Fusion Strategy" overlay designed to filter out false breakouts and catch high-probability trends. It upgrades the classic EMA 50 Cross Strategy by "locking" the signal with Institutional Volume Flow (VFI) and adding an automated Fibonacci safety guard.
The Problem Standard moving average strategies often fail in two scenarios:
Fakeouts: Price crosses the line, but there is no real volume backing the move.
Choppy Markets: The price dances around the line, generating multiple false signals.
The Solution: Triple-Layer Filtering This indicator solves these issues using a strict logic:
The Trigger (EMA 50): The primary signal is generated when price crosses the EMA 50.
The Lock (VFI Filter): A signal is ONLY valid if the Volume Flow Indicator (VFI) confirms the direction (Positive for Buy, Negative for Sell). If price crosses but VFI disagrees, the line turns GRAY, warning of a "Empty Rally" or "Bear Trap."
The Safety (Fib Guard): The system automatically draws invisible Fibonacci retracement levels based on recent price action. If a trend reverses and breaks the Golden Ratio (0.618), a Yellow Warning Arrow appears, signaling a potential trend failure.
Anti-Chop Filter: It calculates the slope of the EMA. If the market is flat/ranging, the line turns WHITE and signals are suppressed.
Visual Guide & Legend
🟢 Green Line + BUY Label: Confirmed Uptrend (Price > EMA 50 + Positive Institutional Volume).
🔴 Red Line + SELL Label: Confirmed Downtrend (Price < EMA 50 + Negative Institutional Volume).
⚪ Gray Line: CAUTION. Price has crossed the EMA, but Volume does NOT confirm. Do not enter.
⬜ White Line / Background: CHOP ZONE. The market is ranging/flat. No trades.
⚠️ Yellow Arrows (EXIT?): The price has moved against the trend and broken key Fibonacci Support/Resistance. Consider tightening stops or exiting.
Best For:
Trend Following on 1H, 4H, and Daily timeframes.
Traders looking to filter out "Noise" and focus only on Volume-Backed moves.

FDL Horizontal Levels + EMAs (US30 & YM1)What this indicator does
This tool automatically plots institutional horizontal levels so traders don’t need to draw them manually. These levels are commonly used in the FIPS Don’t Lie methodology and frequently act as areas of respect or reaction, especially on lower timeframes.
Along with the levels, the indicator includes the 100 EMA and 200 EMA, which serve as higher-probability trend and confluence references. Using institutional levels together with EMAs allows traders to quickly identify trend direction, potential high-probability reaction zones, and areas where price may seek liquidity or show reversals.
Why this is original / useful
• The indicator removes the manual process of drawing institutional levels on every session or chart.
• The levels are calculated programmatically and updated automatically.
• All tools used in the FIPS Don’t Lie methodology (institutional levels + 100/200 EMAs) are combined into one place for convenience and price-action clarity.
• Helps traders speed up charting, maintain consistency, and focus on reading market structure.
How to use
• Best performance is on lower timeframes: 3-minute, 5-minute, or 30-minute charts.
• The institutional levels act as potential reaction zones, liquidity areas, or targets based on how price interacts with them.
• The 100 EMA and 200 EMA help identify overall trend direction.
• When price aligns with both EMAs and institutional levels, this forms a clean confluence setup within the FIPS Don’t Lie strategy.
Recommended timeframes
✔ 3m
✔ 5m
✔ 30m
Not recommended
✘ Daily
✘ 4H
✘ 3H
Higher timeframes do not reflect the intended intraday institutional behavior used in this methodology.
Notes
• This indicator was created by a Fibs Don’t Lie student, for the Fibs Don’t Lie community and for anyone who wants to apply the same confluence-based approach without manually drawing the levels.
• The goal is to provide an all-in-one price-action tool so traders can focus on reading structure without constantly re-adding EMAs or redrawing levels.
• The script does not generate signals or entries, it is strictly a price-action and confluence tool.

KHUSHBU-3OVERVIEW:
KHUSHBU-3 is a comprehensive multi-strategy trading indicator that combines SuperTrend signals, Order Block analysis, Fibonacci retracement levels, and dynamic Support/Resistance detection. This powerful tool helps traders identify high-probability entry and exit points with clear visual markers and alert systems.
KEY FEATURES:
🎯 TREND IDENTIFICATION
SuperTrend Integration: Uses ATR-based SuperTrend to determine market direction
Visual Labels: Displays "उड़ा" (Uda - Flying) for uptrend beginnings and "गिरा" (Gira - Falling) for downtrend beginnings
Color-coded Plot: Green for uptrend, Red for downtrend
📊 ORDER BLOCK ANALYSIS
Smart Order Blocks: Identifies significant buying and selling zones
Automatic Box Drawing: Creates extended boxes for order blocks with price levels
Invalidation Alerts: Alerts when order blocks are broken
Buy/Sell Signals: Triangle markers for entry points
📈 FIBONACCI & PIVOT LEVELS
Auto Fib Retracement: Automatically calculates Fibonacci levels based on recent pivots
ZigZag Integration: Identifies significant swing highs and lows
Customizable Depth: Adjustable pivot detection sensitivity
🛡️ SUPPORT & RESISTANCE
Dynamic S/R Lines: Automatically plots support (lime) and resistance (red) levels
Pivot-based Detection: Uses pivot high/low calculations
Trend-based Adjustment: Adapts support/resistance levels based on market trend
⚙️ CUSTOMIZABLE SETTINGS
EMA Length: Adjustable EMA period (default: 50)
Box Extension: Customizable order block extension bars
ATR Parameters: Configurable ATR period and SuperTrend factor
S/R Sensitivity: Adjustable left/right bars for pivot detection
🔔 ALERT SYSTEM
Trend change alerts (Hindi voice/text alerts)
Order block formation alerts
Order block invalidation alerts
Buy/Sell signal alerts
PRACTICAL USAGE:
Trend Following: Use SuperTrend signals for directional bias
Order Block Trading: Enter trades at order blocks in direction of trend
Fibonacci Retracement: Use Fib levels for potential reversal areas
Support/Resistance: Trade bounces or breaks from dynamic levels
Multi-timeframe Analysis: Combine signals across different timeframes
PERFECT FOR:
Swing traders and position traders
Order flow and market structure analysts
Multi-timeframe analysis enthusiasts
Traders looking for confluence between different strategies
NOTE: This indicator works best on higher timeframes (1H and above) and should be used in conjunction with proper risk management and additional confirmation signals.
Combine the power of trend following, order blocks, and Fibo

ProEdge Strategy's — Structure ReclaimWhat it does
ProEdge Indicator — Fib Reclaim Pro (Signals Only) finds “reclaim” setups of the active Time-Based Fib (TBF) leg and confirms them with weekly gates, optional POC alignment, and light OB proximity. When conditions line up, it prints a one-shot BUY/SELL triangle and can fire alerts—no auto-trading, no repainting tricks.
Best use / timeframes
HTF bias & swing trades: run your chart on 1D or 12H (default TBF = 12H). Great for swing positioning and “let it trend” moves.
Intraday: 4H / 1H for cleaner entries while keeping the 12H/1D bias.
Scalping: 15m / 5m with the higher-timeframe bias. Consider increasing Pivot Strength and Min Confluence Score, enable Require POC, and reduce Max bars to fill.
Alerts & Other Settings
Add alert → ProEdge BUY or ProEdge SELL → Once per bar close. Works with webhooks/Discord/Telegram.
Key settings (tune to your market)
TBF Timeframe (anchor leg, e.g., 12H/1D) & Pivot Strength.
Weekly gates: W 0.25 reclaim (longs) / W 0.75 loss (shorts), plus optional 0.50 bias.
Min Confluence Score, Require POC, OB band (ATR), Retest style (wick vs close), Cooldown, Max bars to fill.
All options live in settings - flip chart timeframes freely and adjust inputs to suit each symbol’s personality (crypto, FX, indices, stocks).
Trading notes
Use HTF for direction, LTF for execution. Let alerts bring you to the chart; still apply risk, invalidations, and position sizing. Educational tool - not financial advice.

TrendX Amila Bro
TrendX Fib + RSI Divergence is a modern trend-following + confluence-based trading tool designed to reduce false signals and improve accuracy.
It combines EMA crossover , RSI momentum , Fibonacci retracement zones , and RSI divergence to provide high-quality BUY/SELL signals.
---
🔥 Core Features
### ✅ 1. Trend Detection (EMA 9/21 by default)]
The script identifies trend shifts using fast and slow EMAs.
* BUY when Fast EMA crosses above Slow EMA + RSI confirmation
* SELL when Fast EMA crosses below Slow EMA + RSI confirmation
These are the Base Signals — always shown.
---
### ✅ 2. Fibonacci Confluence Filter (Optional)
Signals become stronger when price pulls back into key Fib zones:
* 0.5 retracement
* 0.618 golden ratio
This helps avoid chasing late entries and improves accuracy in trend pullbacks.
---
### ✅ 3. RSI Divergence Filter (Optional)
Detects both:
* Bullish Divergence → BUY
* Bearish Divergence → SELL
When divergence agrees with EMA trend shift, a Filtered BUY+/SELL+ signal is shown.
---
### ✅ 4. Two Types of Signals
✔ BUY / SELL
Base signals from EMA + RSI (appears even if filters are OFF)
✔ BUY+ / SELL+
Strong signals using
* EMA Trend
* RSI Confirmation
* Fibonacci Confluence
* RSI Divergence
These are rare but extremely high-probability entries.
---
### ✅ 5. Visual Elements
* EMAs
* Fibonacci 50% & 61.8% levels
* Divergence markers
* BUY / SELL arrows
* BUY+ / SELL+ arrows for filtered confluence entries
---
### ✅ 6. Alerts Included
You can set TradingView alerts for:
* BUY+ (strong long signal)
* SELL+ (strong short signal)
Great for mobile/Telegram alerts.
---
## 🎯 How Traders Use This
* Scalping (1m, 5m)
* Intraday (15m, 30m, 1H)
* Swing trading (4H, 1D)
Works on **Forex, Crypto, Indices, Metals, Stocks**.
---
## ⚠️ Disclaimer
No indicator guarantees 100% accuracy.
Always combine with proper risk management and market context.
---
## ⭐ Ideal For:
* Trend traders
* Pullback traders
* Divergence traders
* Anyone wanting cleaner, filtered BUY/SELL signals
---

Rage of UltronRage of Ultron - Multi-Timeframe Smart Money Trading System
Advanced Confluence-Based Trading Indicator
Rage of Ultron is a comprehensive multi-timeframe trading system that combines Smart Money Concepts (SMC) with macro market context, RSI divergences, liquidity sweeps, and volume analysis to identify high-probability setups across all markets.
Key Features
Multi-Timeframe Alignment
* Weekly Bias - Directional trend context
* Daily Structure - Order Blocks and Fair Value Gaps
* 4H Confirmation - Entry timing and execution
* Real-time MTF alignment scoring (🟢 Bull Aligned / 🔴 Bear Aligned / 🟡 Mixed)
Smart Money Concepts
* Order Blocks (OB) - Institutional entry zones with visual clarity
* Fair Value Gaps (FVG) - Price imbalances and retracement magnets
* Change of Character (CHoCH) - Market structure breaks (▲▼)
* Liquidity Sweeps - Stop hunt detection before reversals (💧)
Technical Analysis
* RSI Divergences - Regular and hidden divergences with zones (◆)
* RSI Swing Failure Patterns - Grade-A reversal setups (★)
* Automatic Fibonacci - Dynamic retracements and extensions
* Volume Impulse Detection - Weighted confirmation signals
Macro Market Radar
* DXY - Dollar strength assessment
* BTC Dominance - Crypto market risk gauge
* USDT Dominance - Stablecoin flow analysis
* Combined risk environment scoring
Confluence Scoring System (0-7)
Quantified setup quality with three alert tiers:
* Tier 1 (Score 6-7): Full confluence + sweep + volume + MTF alignment
* Tier 2 (Score 5): High confluence + volume or sweep
* Tier 3 (Score 4): Standard confluence setups
"Rage" Volume State
* 🟢 RAGE PULSE - Explosive volume spike (score 6+ trigger)
* ⚡ Active - Strong volume with good confluence
* 🟡 Stable - Moderate volume conditions
* 🔴 Dormant - Low volume, wait for confirmation
Visual Design
* Clean Zone Rendering - Persistent OB/FVG boxes with limited extension
* Signal Bar Highlighting - Colored fills and contrasting borders for instant recognition
* Dynamic Symbol Placement - ATR-based offset prevents overlap
* Comprehensive Panel - Real-time macro + trade metrics in one view
* Toggleable Legend - Learn signals, hide once familiar
How to Use
1. Set Your Timeframes - Default 1W/1D/4H works for swing trading
2. Monitor Macro Environment - Check risk-on/off context
3. Wait for Confluence ≥4 - Let multiple signals align
4. Enter on Tier 1/2 Alerts - Best probability setups
5. Use Fib Extensions for Targets - Systematic profit taking
Customizable Settings
* Multi-timeframe periods
* RSI length and divergence sensitivity
* Liquidity sweep parameters
* Fibonacci swing lookback
* Volume thresholds
* Shape offset multiplier
* Visual toggles (Fibs, extensions, legend)
Built-in Alert System
Three-tier alert structure lets you filter by setup quality. Set alerts for Tier 1 only for highest conviction trades, or include Tier 2 for more opportunities.
Best Practices
* Use on clean timeframes - 1H+ for less noise
* Combine with support/resistance - Zones near key levels = highest probability
* Respect the macro - Don't fight extreme risk-off environments
* Wait for the full stack - Best trades have 4+ aligned signals
* Practice on demo first - Learn signal behavior in your market
Works On
* Cryptocurrency (spot & futures)
* Forex pairs
* Stock indices
* Individual stocks
* Commodities
Note: This indicator identifies potential setups but does not guarantee profits. Always use proper risk management, position sizing, and stops. Past performance does not predict future results.
Created by cdotgnz | For educational purposes

Candle PA Scanner (Engulfing / Inside / Pin) by BK SahniHere’s how to read the “Candle PA Scanner (Engulfing / Inside / Pin)” and what each input means.
What the signals look like on your chart
B-ENG (label above/below bar)
Bullish Engulfing → “B-ENG” below the bar (green/teal).
Bearish Engulfing → “B-ENG” above the bar (red).
IB (small orange dot at the top)
Inside Bar (compression). Use the mother bar’s high/low for the break.
PIN (triangle)
Bullish Pin → triangle below the bar (long lower wick; rejection of support).
Bearish Pin → triangle above the bar (long upper wick; rejection of resistance).
Treat these as price-action alerts, not automatic buy/sell signals. Act only when they occur at your levels (VWAP band, Fib 38.2–61.8, PDH/PDL, OB/FVG, etc.).
How to trade the prints (quick rules)
A) Bullish Engulfing at support
Context: at VWAP/VAL/0.5–0.618 Fib.
Entry: next candle above the engulfing high (or market order on close if volume/momentum confirm).
Stop: a tick below the engulfing low (or below the level).
Targets: mid/range, VWAP, prior swing; trail with Chandelier/ATR if trend extends.
B) Bearish Engulfing at resistance
Mirror the above: trigger below the engulfing low; stop above its high.
C) Inside Bar
It’s compression. Mark the mother bar’s high/low.
Trade the breakout in the direction of bias (above VWAP for longs, below for shorts).
If the break fails (closes back inside), often sets up a reversal—manage fast.
D) Pin Bar (rejection)
Enter on break of the pin’s body in the direction away from the wick.
Stop beyond the wick tip (invalidated if wick gets closed through).
Scale at VWAP/mid or the opposite range edge.
What the Inputs do (the panel you showed)
Inside Bar lookback (default 1)
How many bars back can be the mother bar.
Keep 1 for strict IB; raise to 2–3 to catch nested/compression patterns (more signals, a bit noisier).
Pin wick:body min ratio (default 2)
How long the rejection wick must be compared to the body.
Higher (2.5–3.0) = pickier, great in chop.
Lower (1.5–1.8) = more pins, useful in strong trends where wicks are shorter.
Min body % of range (0–1) (default 0.25)
Filters out dojis. The body must be at least 25% of the bar’s high-low range.
If you want to allow slimmer bodies (more pins/dojis), drop to 0.15–0.20.
If you want only decisive bodies, raise to 0.30–0.35.
Suggested tuning by market state
Trending / high momentum:
IB lookback 1, Pin ratio 1.8–2.2, Min body 0.20–0.25 (to catch more continuation entries).
Ranging / choppy:
IB lookback 2, Pin ratio 2.5–3.0, Min body 0.30 (fewer, higher-quality reversals).
A simple confluence checklist (use before clicking)
Signal printed at a level (VWAP band, Fib, PDH/PDL, OB/FVG)?
Bias aligned (above VWAP for longs, below for shorts) or you’re intentionally fading a range edge?
For engulfing: did it close through nearby minor structure?
For IB: are you trading the mother bar break, not just the small inside candle?
Risk defined: stop beyond wick/zone, target mapped (mid/VWAP/swing/extension).
Common pitfalls
Taking signals mid-range (low R:R).
Treating an IB as a reversal without a break/shift.
Buying a bullish pin that closed below your level (no acceptance).
Ignoring volatility—during news spikes, patterns fail more often.

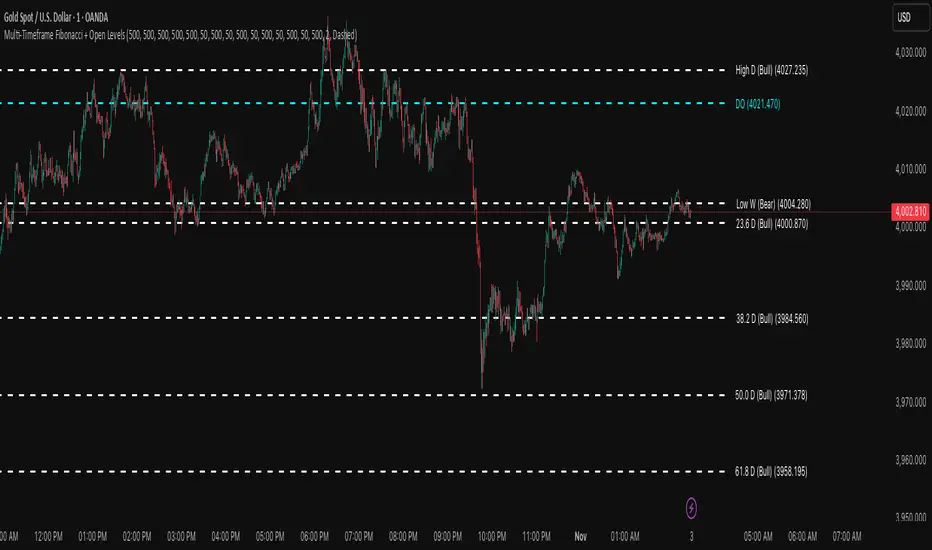
Multi-Timeframe Fibonacci + Open Levels🟣 Multi-Timeframe Fibonacci Levels + Open Levels | Trade Symmetry
This indicator automatically plots Fibonacci levels derived from higher timeframe candle ranges — all at once, directly on your current chart.
It helps you quickly visualize confluence zones and reaction levels where institutional traders are likely to participate.
⚙️ Features
✅ Multi-timeframe Fibonacci Levels — Daily, Weekly, Monthly, Quarterly & Yearly
✅ Automatic Bullish/Bearish detection based on previous candle
✅ Dynamic overlap detection (combines overlapping Fib levels into a single clean label)
✅ Configurable Fibonacci levels, colors, and styles
✅ Optional Open-Price Levels (Daily, Weekly, Monthly)
✅ Clean memory management to keep your chart lightweight
🧠 How to Use
• Add it to any timeframe — it will automatically overlay higher timeframe Fibs.
• Use overlapping or aligned Fib zones as confluence areas.
• Combine with structure or liquidity indicators for high-probability setups.
💡 Inspired by
The concept of higher-timeframe Fibonacci confluences used in Smart Money Concepts (SMC) and ICT-style analysis.
Chronos Reversal Labs🧬 Chronos Reversal Lab - Machine Learning Market Structure Analysis
OVERVIEW
Chronos Reversal Lab (CRL) is an advanced market structure analyzer that combines computational intelligence kernels with classical technical analysis to identify high-probability reversal opportunities. The system integrates Shannon Entropy analysis, Detrended Fluctuation Analysis (DFA), Kalman adaptive filtering, and harmonic pattern recognition into a unified confluence-based signal engine.
WHAT MAKES IT ORIGINAL
Unlike traditional reversal indicators that rely solely on oscillators or pattern recognition, CRL employs a multi-kernel machine learning approach that analyzes market behavior through information theory, statistical physics, and adaptive state-space estimation. The system combines these computational methods with geometric pattern analysis and market microstructure to create a comprehensive reversal detection framework.
HOW IT WORKS (Technical Methodology)
1. COMPUTATIONAL KERNELS
Shannon Entropy Analysis
Measures market uncertainty using information theory:
• Discretizes price returns into bins (user-configurable 5-20 bins)
• Calculates probability distribution entropy over lookback window
• Normalizes entropy to 0-1 scale (0 = perfectly predictable, 1 = random)
• Low entropy states (< 0.3 default) indicate algorithmic clarity phases
• When entropy drops, directional moves become statistically more probable
Detrended Fluctuation Analysis (DFA)
Statistical technique measuring long-range correlations:
• Analyzes price series across multiple box sizes (4 to user-set maximum)
• Calculates fluctuation scaling exponent (Alpha)
• Alpha > 0.5: Trend persistence (momentum regime)
• Alpha < 0.5: Mean reversion tendency (reversal regime)
• Alpha range 0.3-1.5 mapped to trading strategies
Kalman Adaptive Filter
State-space estimation for lag-free trend tracking:
• Maintains separate fast and slow Kalman filters
• Process noise and measurement noise are user-configurable
• Tracks price state with adaptive gain adjustments
• Calculates acceleration (second derivative) for momentum detection
• Provides cleaner trend signals than traditional moving averages
2. HARMONIC PATTERN DETECTION
Identifies geometric reversal patterns:
• Gartley: 0.618 AB/XA, 0.786 AD/XA retracement
• Bat: 0.382-0.5 AB/XA, 0.886 AD/XA retracement
• Butterfly: 0.786 AB/XA, 1.272-1.618 AD/XA extension
• Cypher: 0.382-0.618 AB/XA, 0.786 AD/XA retracement
Pattern Validation Process:
• Requires alternating swing structure (XABCD points)
• Fibonacci ratio tolerance: 0.02-0.20 (user-adjustable precision)
• Minimum 50% ratio accuracy score required
• PRZ (Potential Reversal Zone) calculated around D point
• Zone size: ATR-based with pattern-specific multipliers
• Active pattern tracking with 100-bar invalidation window
3. MARKET STRUCTURE ANALYSIS
Swing Point Detection:
• Pivot-based swing identification (3-21 bars configurable)
• Minimum swing size: ATR multiples (0.5-5.0x)
• Adaptive filtering: volatility regime adjustment (0.7-1.3x)
• Swing confirmation tracking with RSI and volume context
• Maintains structural history (up to 500 swings)
Break of Structure (BOS):
• Detects price crossing previous swing highs/lows
• Used for trend continuation vs reversal classification
• Optional requirement for signal validation
Support/Resistance Detection:
• Identifies horizontal levels from swing clusters
• Touch counting algorithm (price within ATR×0.3 tolerance)
• Weighted by recency and number of tests
• Dynamic updating as structure evolves
4. CONFLUENCE SCORING SYSTEM
Multi-factor analysis with regime-aware weighting:
Hierarchical Kernel Logic:
• Entropy gates advanced kernel activation
• Only when entropy < threshold do DFA and Kalman accelerate scoring
• Prevents false signals during chaotic (high entropy) conditions
Scoring Components:
ML Kernels (when entropy low):
• Low entropy + trend alignment: +3.0 points × trend weight
• DFA super-trend (α>1.5): +4.0 points × trend weight
• DFA persistence (α>0.65): +2.5 points × trend weight
• DFA mean-reversion (α<0.35): +2.0 points × mean-reversion weight
• Kalman acceleration: up to +3.0 points (scaled by magnitude)
Classical Technical Analysis:
• RSI oversold (<30) / overbought (>70): +1.5 points
• RSI divergence (bullish/bearish): +2.5 points
• High relative volume (>1.5x): +0-2.0 points (scaled)
• Volume impulse (>2.0x): +1.5 points
• VWAP extremes: +1.0 point
• Trend alignment (Kalman fast vs slow): +1.5 points
• MACD crossover/momentum: +1.0 point
Structural Factors:
• Near support (within 0.5 ATR): +0-2.0 points (inverse distance)
• Near resistance (within 0.5 ATR): +0-2.0 points (inverse distance)
• Harmonic PRZ zone: +3.0 to +6.0 points (pattern score dependent)
• Break of structure: +1.5 points
Regime Adjustments:
• Trend weight: 1.5× in trend regime, 0.5× in mean-reversion
• Mean-reversion weight: 1.5× in MR regime, 0.5× in trend
• Volatility multiplier: 0.7-1.3× based on ATR regime
• Theory mode multiplier: 0.8× (Conservative) to 1.2× (APEX)
Final Threshold:
Base threshold (default 3.5) adjusted by:
• Theory mode: -0.3 (APEX) to +0.8 (Conservative)
• Regime: +0.5 (high vol) to -0.3 (low vol or strong trend)
• Filter: +0.2 if regime filter enabled
5. SIGNAL GENERATION ARCHITECTURE
Five-stage validation process:
Stage 1 - ML Kernel Analysis:
• Entropy threshold check
• DFA regime classification
• Kalman acceleration confirmation
Stage 2 - Structural Confirmation:
• Market structure supports directional bias
• BOS alignment (if required)
• Swing point validation
Stage 3 - Trigger Validation:
• Engulfing candle (if required)
• HTF bias confirmation (if strict HTF enabled)
• Harmonic PRZ alignment (if confirmation enabled)
Stage 4 - Consistency Check:
• Anticipation depth: checks N bars back (1-13 configurable)
• Ensures Kalman acceleration direction persists
• Filters whipsaw conditions
Stage 5 - Structural Soundness (Critical Filter):
• Verifies adequate room before next major swing level
• Long signals: must have >0.25 ATR clearance to last swing high
• Short signals: must have >0.25 ATR clearance to last swing low
• Prevents trades directly into obvious structural barriers
Dynamic Risk Management:
• Stop-loss: Placed beyond last structural swing ± 2 ticks
• Take-profit 1: Risk × configurable R1 multiplier (default 1.5R)
• Take-profit 2: Risk × configurable R2 multiplier (default 3.0R)
• Confidence score: Calibrated 0-99% based on confluence + kernel boost
6. ADAPTIVE REGIME SYSTEM
Continuous market state monitoring:
Trend Regime:
• Kalman fast vs slow positioning
• Multi-timeframe alignment (optional HTF)
• Strength: ATR-normalized fast/slow spread
Volatility Regime:
• Current ATR vs 100-bar average
• Regime ratio: 0.7-1.3 typical range
• Affects swing size filtering and cooldown periods
Signal Cooldown:
• Base: User-set bars (1-300)
• High volatility (>1.5): cooldown × 1.5
• Low volatility (<0.5): cooldown × 0.7
• Post-BOS: minimum 20-bar cooldown enforced
FOUR OPERATIONAL MODES
CONSERVATIVE MODE:
• Threshold adjustment: +0.8
• Mode multiplier: 0.8×
• Strictest filtering for highest quality
• Recommended for: Beginners, large accounts, swing trading
• Expected signals: 3-5 per week (typical volatile instrument)
BALANCED MODE:
• Threshold adjustment: +0.3
• Mode multiplier: 1.0×
• Standard operational parameters
• Recommended for: General trading, learning phase
• Expected signals: 5-10 per week
APEX MODE:
• Threshold adjustment: -0.3
• Mode multiplier: 1.2×
• Maximum sensitivity, reduced cooldowns
• Recommended for: Scalping, high volatility, experienced traders
• Expected signals: 10-20 per week
INSTITUTIONAL MODE:
• Threshold adjustment: +0.5
• Mode multiplier: 1.1×
• Enhanced structural weighting, HTF emphasis
• Recommended for: Professional traders, swing positions
• Expected signals: 4-8 per week
VISUAL COMPONENTS
1. Fibonacci Retracement Levels
• Auto-calculated from most recent swing structure
• Standard levels: 0%, 23.6%, 38.2%, 50%, 61.8%, 78.6%, 100%, 127.2%, 161.8%, 200%, 261.8%
• Key levels emphasized (50%, 61.8%, 100%, 161.8%)
• Color gradient from bullish to bearish based on level
• Automatic cleanup when levels are crossed
• Label intensity control (None/Fib only/All)
2. Support and Resistance Lines
• Dynamic horizontal levels from swing clusters
• Width: 2px solid lines
• Colors: Green (support), Red (resistance)
• Labels show price and level type
• Touch-based validation (minimum 2 touches)
• Real-time updates and invalidation
3. Harmonic PRZ Boxes
• Displayed around pattern completion (D point)
• Pattern-specific colors (Gartley: purple, Bat: orange, etc.)
• Box height: ATR-based zone sizing
• Score-dependent transparency
• 100-bar active window before removal
4. Confluence Boxes
• Appear when confluence ≥ threshold
• Yellow/orange gradient based on score strength
• Height: High to low of bar
• Width: 1 bar on each side
• Real-time score-based transparency
5. Kalman Filter Lines
• Fast filter: Bullish color (green default)
• Slow filter: Bearish color (red default)
• Width: 2px
• Transparency adjustable (0-90%)
• Optional display toggle
6. Signal Markers
• Long: Green triangle below bar (tiny size)
• Short: Red triangle above bar (tiny size)
• Appear only on confirmed signals
• Includes alert generation
7. Premium Dashboard
Features real-time metrics with visual gauges:
Layout Options:
• Position: 4 corners selectable
• Size: Small (9 rows) / Normal (12 rows) / Large (14 rows)
• Themes: Supreme, Cosmic, Vortex, Heritage
Metrics Displayed:
• Gamma (DFA - 0.5): Shows trend persistence vs mean-reversion
• TCI (Trend Strength): ATR-normalized Kalman spread with gauge
• v/c (Relative Volume): Current vs average with color coding
• Entropy: Market predictability state with gauge
• HFL (High-Frequency Line): Kalman fast/slow difference / ATR
• HFL_acc (Acceleration): Second derivative momentum
• Mem Bias: Net bullish-bearish confluence (-1 to +1)
• Assurance: Confidence × (1-entropy) metric
• Squeeze: Bollinger Band / Keltner Channel squeeze detection
• Breakout P: Probability estimate from DFA + trend + acceleration
• Score: Final confluence vs threshold (normalized)
• Neighbors: Active harmonic patterns count
• Signal Strength: Strong/Moderate/Weak classification
• Signal Banner: Current directional bias with emoji indicators
Gauge Visualization:
• 10-bar horizontal gauges (█ filled, ░ empty)
• Color-coded: Green (strong) / Gold (moderate) / Red (weak)
• Real-time updates every bar
HOW TO USE
Step 1: Configure Mode and Resolution
• Select Theory Mode based on trading style (Conservative/Balanced/APEX/Institutional)
• Set Structural Resolution (Standard for fast markets, High for balanced, Ultra/Institutional for swing)
• Enable Adaptive Filtering (recommended for all volatile assets)
Step 2: Enable Desired Kernels
• Shannon Entropy: Essential for predictability detection (recommended ON)
• DFA Analysis: Critical for regime classification (recommended ON)
• Kalman Filter: Provides lag-free trend tracking (recommended ON)
• All three work synergistically; disabling reduces effectiveness
Step 3: Configure Confluence Factors
• Enable desired technical factors (RSI, MACD, Volume, Divergence)
• Enable Liquidity Mapping for support/resistance proximity scoring
• Enable Harmonic Detection if trading pattern-based setups
• Adjust base confluence threshold (3.5 default; higher = fewer, cleaner signals)
Step 4: Set Trigger Requirements
• Require Engulfing: Adds precision, reduces frequency (recommended for Conservative)
• Require BOS: Ensures structural alignment (recommended for trend-following)
• Require Structural Soundness: Critical filter preventing traps (highly recommended)
• Strict HTF Bias: For multi-timeframe traders only
Step 5: Adjust Visual Preferences
• Enable/disable Fibonacci levels, S/R lines, PRZ boxes, confluence boxes
• Set label intensity (None/Fib/All)
• Adjust transparency (0-90%) for overlay clarity
• Configure dashboard position, size, and theme
Step 6: Configure Alerts
• Enable master alerts toggle
• Select alert types: Anticipation, Confirmation, High Confluence, Low Entropy
• Enable JSON details for automated trading integration
Step 7: Interpret Signals
• Wait for triangle markers (green up = long, red down = short)
• Check dashboard for confluence score, entropy, DFA regime
• Verify signal aligns with higher timeframe bias (if using HTF setting)
• Confirm adequate space to take-profit levels (no nearby structural barriers)
Step 8: Execute and Manage
• Enter at close of signal candle (or next bar open)
• Set stop-loss at calculated level (visible in alert if JSON enabled)
• Scale out at TP1 (1.5R default), trail remaining to TP2 (3.0R default)
• Exit early if entropy spikes >0.7 or DFA regime flips against position
CUSTOMIZATION GUIDE
Timeframe Optimization:
Scalping (1-5 minutes):
• Theory Mode: APEX
• Anticipation Depth: 3-5
• Structural Resolution: STANDARD
• Signal Cooldown: 8-12 bars
• Enable fast kernels, disable HTF bias
Day Trading (15m-1H):
• Theory Mode: BALANCED
• Anticipation Depth: 5-8
• Structural Resolution: HIGH
• Signal Cooldown: 12-20 bars
• Standard configuration
Swing Trading (4H-Daily):
• Theory Mode: INSTITUTIONAL
• Anticipation Depth: 8-13
• Structural Resolution: ULTRA or INSTITUTIONAL
• Signal Cooldown: 20-50 bars
• Enable HTF bias, strict confirmations
Market Type Optimization:
Forex Majors:
• All kernels enabled
• Harmonic patterns effective
• Balanced or Institutional mode
• Standard settings work well
Stock Indices:
• Emphasis on volume analysis
• DFA critical for regime detection
• Conservative or Balanced mode
• Enable liquidity mapping
Cryptocurrencies:
• Adaptive filtering essential
• Higher volatility regime expected
• APEX mode for active trading
• Wider ATR multiples for swing sizing
IMPORTANT DISCLAIMERS
• This indicator does not predict future price movements
• Computational kernels calculate probabilities, not certainties
• Past confluence scores do not guarantee future signal performance
• Always backtest on YOUR specific instruments and timeframes before live trading
• Machine learning kernels require calibration period (minimum 100 bars of data)
• Performance varies significantly across market conditions and regimes
• Signals are suggestions for analysis, not automated trading instructions
• Proper risk management (stops, position sizing) is mandatory
• Complex calculations may impact performance on lower-end devices
• Designed for liquid markets; avoid illiquid or gap-prone instruments
PERFORMANCE CONSIDERATIONS
Computational Intensity:
• DFA analysis: Moderate (scales with length and box size parameters)
• Entropy calculation: Moderate (scales with lookback and bins)
• Kalman filtering: Low (efficient state-space updates)
• Harmonic detection: Moderate to High (pattern matching across swing history)
• Overall: Medium computational load
Optimization Tips:
• Reduce Structural Analysis Depth (144 default → 50-100 for faster performance)
• Increase Calc Step (2 default → 3-4 for lighter load)
• Reduce Pattern Analysis Depth (8 default → 3-5 if harmonics not primary focus)
• Limit Draw Window (150 bars default prevents visual clutter on long charts)
• Disable unused confluence factors to reduce calculations
Best Suited For:
• Liquid instruments: Major forex, stock indices, large-cap crypto
• Active timeframes: 5-minute through daily (avoid tick/second charts)
• Trending or ranging markets: Adapts to both via regime detection
• Pattern traders: Harmonic integration adds geometric confluence
• Multi-timeframe analysts: HTF bias and regime detection support this approach
Not Recommended For:
• Illiquid penny stocks or micro-cap altcoins
• Markets with frequent gaps (stocks outside regular hours without gap adjustment)
• Extremely fast timeframes (tick, second charts) due to calculation overhead
• Pure mean-reversion systems (unless using CONSERVATIVE mode with DFA filters)
METHODOLOGY NOTE
The computational kernels (Shannon Entropy, DFA, Kalman Filter) are established statistical and signal processing techniques adapted for financial time series analysis. These are deterministic mathematical algorithms, not predictive AI models. The term "machine learning" refers to the adaptive, data-driven nature of the calculations, not neural networks or training processes.
Confluence scoring is rule-based with regime-dependent weighting. The system does not "learn" from historical trades but adapts its sensitivity to current volatility and trend conditions through mathematical regime classification.
SUPPORT & UPDATES
• Questions about configuration or usage? Send me a message on TradingView
• Feature requests are welcome for consideration in future updates
• Bug reports appreciated and addressed promptly
• I respond to messages within 24 hours
• Regular updates included (improvements, optimizations, new features)
FINAL REMINDERS
• This is an analytical tool for confluence analysis, not a standalone trading system
• Combine with your existing strategy, risk management, and market analysis
• Start with paper trading to learn the system's behavior on your markets
• Allow 50-100 signals minimum for performance evaluation
• Adjust parameters based on YOUR timeframe, instrument, and trading style
• No indicator guarantees profitable trades - proper risk management is essential
— Dskyz, Trade with insight. Trade with anticipation.
ScalpDaddy V3ScalpDaddy bundles eight battle‑tested tools into a single, toggleable overlay for fast confluence and clean charts. It’s designed for intraday scalpers and swing traders who want a lightweight dashboard plus precision levels and volatility context—without juggling multiple indicators.
What’s Inside (all can be turned on/off)
SD: Trend Sniper (MTF RSI/ADX table)
8‑TF heatmap with emoji glyphs (momentum/strength/chop).
Weighted bias meter, HTF dominance and adjacency bonus to reward agreement.
Tiny Entry‑Qualifier dashboard (Trend, Throttle, Quality, Boost) for quick “go/no‑go”.
SD: Squeeze (BB/KC)
Bollinger Bands + Keltner Channel with squeeze fill for compression/expansion reads.
SD: Fibonacci Levels
Swing‑aware fib grid with instant flip option, reject band, extension gates, target‑zone shading, and labels.
SD: PM/AH/RTH Levels
Prior extended‑hours and prior RTH high/low, with dynamic/previous‑only modes.
SD: Pivot Points (Structure)
Clean, confirmed pivot markers to visualize HH/HL/LH/LL, BOS/MSS turns.
SD: Liquidity Sweeper
Buyside/Sellside liquidity pools with live maintenance and optional invalidation highlighting.
SD: FVG Finder
Present/Full‑history scan with budget controls, configurable fill logic and coloring.
SD: Fourier ATR
Smoothed ATR “center line” with envelope; optional labels when price exits/re‑enters the band.
Quick Start
Open inputs. In “SD: Modules,” enable only what you need for the session.
For Trend Sniper:
Pick “Table TF Preset” (e.g., fibs day trade, scalp, short/long swing) or enable “Custom TFs” and set each TF.
Choose Update Mode: “Live” for intrabar responsiveness or “On Close” for confirmed, non‑flickering signals.
Table and mini dashboard positions are configurable.
Optional confluence:
Turn on Squeeze to spot compression before Trend Sniper shifts.
Add Sessions + Liquidity + FVG to map targets/voids and where price is likely to react.
Use ATR Envelope to gauge when price is stretching outside normal travel.
How To Read The Trend Sniper Table
Emojis:
🚀/🔥 = bullish pressure; ⚓️/🩸 = bearish pressure; 🪓 = chop; ⚠️ = caution (e.g., OB/OS with strong ADX).
Bias:
A normalized, weighted read of the 8 TFs. The default thresholds used for alerts: +0.30 (bullish) / −0.30 (bearish).
HTF dominance:
When enabled, strong alignment on the slowest TFs dampens opposite LTF noise.
Entry‑Qualifier mini dash:
“Trend” (ADX), “Throttle” (RSI), “Quality” (Chop), “Boost” (relative volume). Green/steady reads support continuation; yellow/red flags warn of choppiness/whipsaw.
Module Notes
Squeeze (BB/KC): Look for squeeze fill changes—breakouts often follow compression.
Fibonacci: “Zigzag Period” sets swing sensitivity; “Instant flip” optionally flips the active leg when price breaks a chosen threshold (wick/close). Target‑zone shading highlights extension ranges; labels can be limited to extensions only.
PM/AH/RTH: “RTH Mode” = Dynamic (today’s running levels during RTH) or Previous Session Only. Optional volume filter for PM/AH to show only significant sessions.
Pivot Points: Uses confirmed pivots; simple circular markers show HH/HL/LH/LL and shifts (BOS/MSS) without clutter.
Liquidity: “margin” adjusts pool thickness sensitivity; enable “Show Broken” to keep invalidated pools visible with different fill.
FVG Finder: Choose Present or Full History and set a bar budget to control performance. “Fill Mode” supports touch/close/percent thresholds.
Fourier ATR: Envelope defines typical travel. Optional labels:
⚠️ when price exits the band
⬇️ when price re‑enters
Built‑in Alerts
Open the Alerts dialog and choose this indicator; you’ll see named alerts you can attach to any symbol/interval:
Bull Combo (🚀/🔥 no ⚠️)
Table: RSI/ADX Bull Majority
Table: RSI/ADX Bear Majority
Bias turns Bullish (≥ +0.30)
Bias turns Bearish (≤ −0.30)
EQ Bull Align
EQ Bear Align
ATR: ⚠️ Price exited envelope
ATR: ⬇️ Price re‑entered envelope
Performance Tips
Start with only the modules you need. Turn others off in “SD: Modules.”
For FVG, use Present mode with a reasonable “Present Mode Bars” budget on lower timeframes.
Set Trend Sniper to “On Close” for steadier updates during fast markets.
Heavy drawings (many labels/lines/fills) can be reduced by lowering visible counts or disabling labels.
Best Practices & Disclaimers
Educational tool, not financial advice. Past performance does not guarantee future results.
Signals are contextual—use with sound risk management and higher‑timeframe bias.
Some elements can update intrabar when “Live” or “allow repaint” is on (ATR emojis); prefer confirmed/close‑based modes if you want steadier behavior.
Works on most symbols and timeframes; intended primarily for intraday to swing trading.

Apex Edge – Wolfe Wave HunterApex Edge – Wolfe Wave Hunter
The modern Wolfe Wave, rebuilt for the algo era
This isn’t just another Wolfe Wave indicator. Classic Wolfe detection is rigid, outdated, and rarely tradable. Apex Edge – Wolfe Wave Hunter re-engineers the pattern into a modern, SMC-driven model that adapts to today’s liquidity-dominated markets. It’s not about drawing pretty shapes – it’s about extracting precision entries with asymmetric risk-to-reward potential.
🔎 What it does
Automatic Wolfe Wave Detection
Identifies bullish and bearish Wolfe Wave structures using pivot-based logic, symmetry filters, and slope tolerances.
Channel Glow Zones
Highlights the Wolfe channel and projects it forward into the future (bars are user-defined). This allows you to see the full potential of the trade before price even begins its move.
Stop Loss (SL) & Entry Arrow
At the completion of Wave 5, the algo prints a Stop Loss line and a tiny entry arrow (green for bullish, red for bearish). but the colours can be changed in user settings. This is the “execution point” — where the Wolfe setup becomes tradable.
Target Projection Lines
TP1 (EPA): Derived from the traditional 1–4 line projection.
TP2 (1.272 Fib): Optional secondary profit target.
TP3 (1.618 Fib): Optional extended target for large runners.
All TP lines extend into the future, so you can track them as price evolves.
Volume Confirmation (optional)
A relative volume filter ensures Wave 5 is formed with meaningful market participation before a setup is confirmed.
Alerts (ready out of the box)
Custom alerts can be fired whenever a bullish or bearish Wolfe Wave is confirmed. No need to babysit the charts — let the script notify you.
⚙️ Customisation & User Control
Every trader’s market and style is different. That’s why Wolfe Wave Hunter is fully customisable:
Arrow Colours & Size
Works on both light and dark charts. Choose your own bullish/bearish entry arrow colours for maximum visibility.
Tolerance Levels
Adjust symmetry and slope tolerance to refine how strict the channel rules are.
Tighter settings = fewer but cleaner zones.
Looser settings = more frequent setups, but with slightly lower structural quality.
Channel Glow Projection
Define how many bars forward the channel is drawn. This controls how far into the future your Wolfe zones are extended.
Stop Loss Line Length
Keep the SL visible without it extending infinitely across your chart.
Take Profit Line Colors
Each TP projection can be styled to your preference, allowing you to clearly separate TP1, TP2, and TP3.
This isn’t a one-size-fits-all tool. You can shape Wolfe detection logic to match the pairs, timeframes, and market conditions you trade most.
🚀 Why it’s different
Classic Wolfe waves are rare — this script adapts the model into something practical and tradeable in modern markets.
Liquidity-aligned — many setups align with structural sweeps of Wave 3 liquidity before driving into profit.
Entry built-in — most Wolfe scripts only draw the structure. Wolfe Wave Hunter gives you a precise entry point, SL, and projected TPs.
Backtest-friendly — you’ll quickly discover which assets respect Wolfe waves and which don’t, creating your own high-probability Wolfe watchlist.
⚠️ Limitations & Disclaimer
Not all markets respect Wolfe Waves. Some FX pairs, metals, and indices respect the structure beautifully; others do not. Backtest and create your own shortlist.
No guaranteed sweeps. Many entries occur after a liquidity sweep of Wave 3, but not all. The algo is designed to detect Wolfe completion, not enforce textbook liquidity rules.
Probabilistic, not predictive. Wolfe setups don’t win every time. Always use risk management.
High-RR focus. This is not a high-frequency tool. It’s designed for precision, asymmetric setups where risk is small and reward potential is large.
✅ The Bottom Line
Apex Edge – Wolfe Wave Hunter is a modern reimagination of the Wolfe Wave. It blends structural geometry, liquidity dynamics, and algo-driven execution into a single tool that:
Detects the pattern automatically
Provides SL, entry, and TP levels
Offers alerts for hands-off trading
Allows deep customisation for different markets
When it hits, it delivers outstanding risk-to-reward. Backtest, refine your tolerances, and build your watchlist of assets where Wolfe structures consistently pay.
This isn’t just Wolfe detection — it’s Wolfe trading, rebuilt for the modern trader.
Developer Notes - As always with the Apex Edge Brand, user feedback and recommendations will always be respected. Simply drop us a message with your comments and we will endeavour to address your needs in future version updates.

RSI (8 & 13) + Fibonacci LevelsIndicator Description: RSI (8 & 13) + Fibonacci Levels
This custom indicator is designed to provide a dual-speed RSI framework with embedded Fibonacci retracement levels for advanced momentum and reversal analysis. It combines the power of relative strength measurement with the natural harmony of Fibonacci ratios to give traders a structured approach to market timing and confluence trading.
The indicator plots two RSI lines on a dedicated sub-chart:
RSI Fast (8) → short-term momentum, highly sensitive to price action, helps identify quick shifts and micro-trends.
RSI Slow (13) → smoother and less volatile, acts as confirmation of broader trend direction and underlying strength.
By combining both RSI speeds, traders can spot alignment, divergences, and crossover signals between fast and slow momentum. When both lines move in sync, it reflects strong conviction; when they diverge, it signals potential exhaustion or trend shifts.
Overlaying Fibonacci retracement levels on RSI adds an extra dimension of precision. Instead of using arbitrary zones, the indicator relies on mathematically significant levels tied to natural market cycles:
23.6% → shallow pullbacks, early momentum pauses.
38.2% → minor retracements, often signaling trend continuation.
50% → balance point between strength and weakness.
61.8% → golden ratio, strong correction or reversal zone.
78.6% → deep retracement, last line before full reversal.
In addition, the script marks the classic RSI boundaries:
70 (Overbought) → potential profit-taking, stretched bullish conditions.
30 (Oversold) → potential accumulation, stretched bearish conditions.
Together, these zones help traders gauge not only when the RSI is “too high” or “too low,” but also where price momentum aligns with natural Fibonacci retracement zones. This approach transforms RSI from a simple oscillator into a multi-layered momentum map.
Practical Uses:
Trend Confirmation → When RSI(8) and RSI(13) are both above 50 and rising, bullish strength is confirmed.
Divergence Detection → If price makes higher highs but RSI(8) fails to confirm, it warns of weakening momentum.
Reversal Hunting → Look for RSI rejection candles at Fib levels (e.g., fast RSI hitting 61.8 and rolling over).
Entry/Exit Timing → Use fast RSI crossovers with slow RSI as tactical entries within the broader structure.
Confluence Trading → Strong signals occur when RSI rejection coincides with price structure (double tops/bottoms, Fibonacci levels on chart, Bollinger Band rejections).
This indicator is especially powerful when paired with Bollinger Bands or price action rejection patterns, creating a system where price extremes are validated against RSI Fib zones.
Ultimately, the RSI (8 & 13) + Fibonacci Levels indicator acts as a precision filter — helping traders separate noise from genuine turning points and reinforcing entries/exits with multiple layers of confluence.

Price Action By ProfitAlgo.io Price Action Alerts combined with the BackEnd Order Matrix and TrendSync Tool Kit.
ProfitAlgo.io Price Action
A companion tool to the Backend Order Matrix and TrendSync, this indicator helps visualize trade direction with A/B/C/D retracement lines that align with fib retracement levels which can react as a BIG BOUNCE RETEST ENTRY, multi-timeframe support/resistance, and an RSI filter. It’s designed as a guide for bias confirmation, not a signal to enter every mark. Combine it with the Backend Order Matrix (for liquidity/stop-hunt zones) and TrendSync (for trend confirmation) to better spot where stop hunts become opportunities and price action aligns with higher-probability setups.
Price is shown bullish and the retracement lines are defined by the dotted lines. You may color the lines to your discretion to be able to quickly differentiate the different retracments lines on the chart aligning to Fib levels for possible early entries. Here you can anticipate for price to have a significant reaction with placing your stop loss being the Buy-Side Liquidity as show below. Though the BackEnd Order Matrix liquidity can be swept so keep in mind being more patient to wait for the liquidity sweep as the point entry can serve as another approach to minimize risk exposure.
Exiting at the SellSide Liquidity where price can have an reaction to the downside.
Vise Versa for bearish trend following retracement entires.
⚙️ Settings Guide – ProfitAlgo.io Price Action
Retracement Line (A/B/C/D) → Shows potential price action setups where price can have a strong reaction. Having Price above the lines- price can be shown to buy at these levels. If Price is below the lines and the trend is showing bearish the price can be shown to retest and sell at these levels.
Multi-Timeframe S/R → Plots higher-timeframe support and resistance levels for added context.
RSI Filter → Filters entries when RSI conditions are extreme, helping avoid false setups.
Top-Down Analysis (TDA) → Aligns lower-timeframe entries with higher-timeframe structure.
📌 Tip: The TrendSync's trend detection visual representation Together with Backend Order Matrix (for liquidity zones/stop hunts) helps Traders understand trend based trading with liquidity stop hunts which can be used as a entry model that does not happen as many times as the Price Action Tool does for early entries signals. If you would like to read more on how the The BackEnd Order Matrix and TrendSync Simulation Tool works. Feel free to read the articles below.
The How to Use The BackEnd Order Matrix?
The How to Use The TrendSync Simulation Tool?
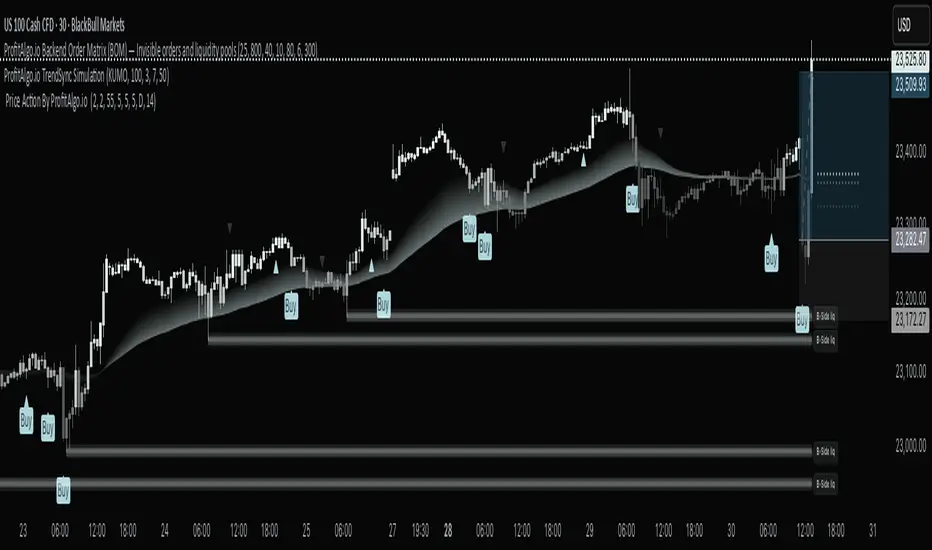
ADR H/L + Bull/Bear TargetsThis indicator calculates the Average Daily/Weekly Range over any given period and plots the Bull and Bear targets for that Session Daily/Weekly or both. Classic targets are calculated at ADR/AWR +/- .50 .75 1.00 1.25. Green is for the + and RED is for the - but colors can been changed to suit.
In 'Settings' there is the ability to toggle:
1. How many sessions you want to plotting on your chart.
2. Switching ON/OFF Bull/Bear targets.
3. Line color/thickness
4. Ability to offset Header for ADR/AWR vertically.
5. I've put in there a FIB option as well as Classic. FIB counts are at .382 .50 .618 1.00 of ADR and labelled as such.
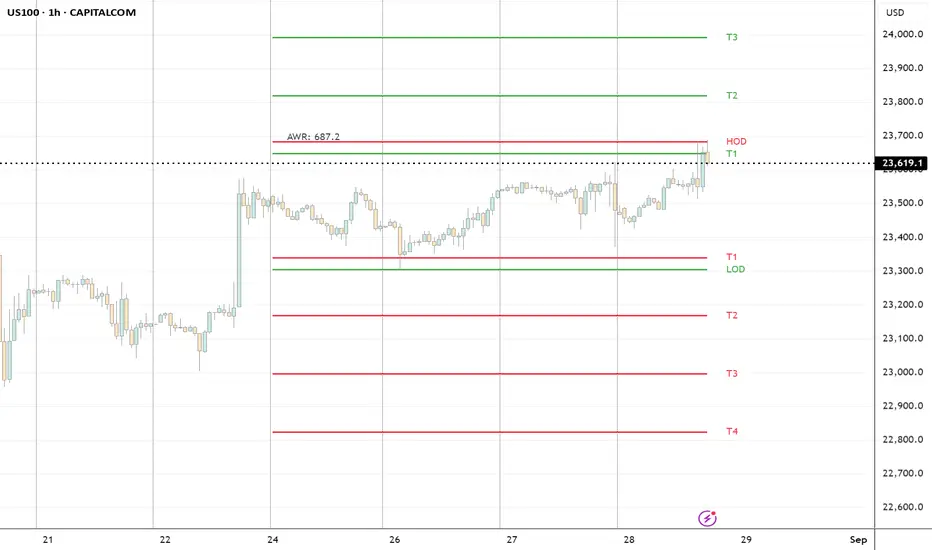
PDH/PDL Breakout—Anchored Ghost Targets + (Truth Table)What this does (integrated purpose—not a mashup):
This tool implements a “prove-it” breakout framework around prior-day levels. It (1) anchors Previous Day High/Low (PDH/PDL) to RTH, (2) reveals anchored ghost targets only after price proves itself beyond PDH/PDL, and (3) confirms direction using a 3-consecutive-closes rule. A compact Truth Table summarizes regime: Control Line, PDH/PDL position, and a microstructure-based composite trend score. Everything is designed to work together to filter fake breaks and provide objective upside/downside targets.
How it works (math/logic in plain English):
Prior-day levels (no repaint):
Pulls High, Low, Close of the previous day and extends PDH/PDL through today’s RTH session. (Daily values are read from the prior bar so signals don’t look ahead.)
Session scoping:
RTH is 09:30–16:00 ET. The script resets at 09:30, pre-creates all lines to the 16:00 session end, and confines triggers to RTH context.
Ghost target packs (original piece):
Compute classic pivot set from prior day:
P = (H+L+C) / 3, R1 = 2P − L, S1 = 2P−H
Create one full range-shift above and below the prior day:
range=H−L.
Add Fib overlays (0.382) around P/R1/S1 to form the pack.
Anchoring rule: packs are shifted so the upper pack never dips below PDH and the lower pack never rises above PDL. This prevents visual crossing with PDH/PDL and keeps targets clean after a confirmed break. Packs stay hidden until price proves itself (see next point).
Directional “prove-it” trigger:
You only get a signal after an actual cross of PDH/PDL followed by N consecutive RTH closes beyond that level (default 3; user input).
• Long: crossover above PDH → then 3 closes > PDH → one-bar pulse + optional alert.
• Short: crossunder below PDL → then 3 closes < PDL → one-bar pulse + optional alert.
After the first qualified trigger each session, bars beyond the level get a subtle Neo candle style so breakouts are visually distinct.
Truth Table (integration, not decoration):
Control Line = a smoothed multi-EMA control band (we expose a single “control line” derived from it),
PDH/PDL position (above, below, or inside),
Composite Trend = non-lag microstructure score combining: close-location value, thrust, wick imbalance, range-expansion direction, and HH/HL vs LL/LH structure (all summed over a short causal window).
Header colors use majority vote across those three rows so you see regime at a glance. This is used to interpret breaks and avoid chasing noise.
How to use it (practical workflow):
On equities during RTH, watch PDH/PDL.
When a break occurs, wait for the 3-close confirmation—that’s your “prove-it” trigger.
Upon trigger, the corresponding ghost pack becomes visible and provides objective intraday targets (pack lines + dashed Fib lines).
Use the Truth Table to sanity-check regime (e.g., bullish majority + PDH break = higher-confidence continuation).
Inputs & alerts:
Consecutive closes required (default 3).
Show Truth Table (on/off).
EMA ribbon/control line (on/off).
Alerts: “Bullish Trigger” and “Bearish Trigger” fire on the one-bar pulses right when confirmation completes.
Notes & limitations:
Designed for stocks using 09:30–16:00 ET. On 24/7 markets (e.g., crypto) RTH logic isn’t applicable.
Prior-day values are fixed from the daily timeframe, so the logic does not repaint.
The “Neo” candle styling is post-trigger only to keep earlier bars clean.
Why this is original/useful:
This is a single, integrated framework: anchored ghost targets (with a non-crossing constraint), prove-it confirmation (3-close rule), and a non-lag composite microstructure score summarized in a Truth Table. The components are purpose-built to work together to reduce false breakouts and supply clean, objective targets after confirmation—this is not a cosmetic mashup.
Educational note: Not financial advice. Test before use.

Jinny Volunacci - Magic_xDJinny Volunacci – Magic_xD is a multi-tool Fibonacci framework that merges volume context, candlestick patterns (Hammer / Shooting Star / Big Range), and fully customizable Fibonacci retracements/extensions.
It auto-selects a reference candle (or lets you pick one), then projects Fibonacci levels that adapt to your trading style.
🔧 How to Use
Candle Selection Modes
Auto Volume – automatically picks the highest-volume candle in your chosen Lookback Bars.
Custom Date – manually select any candle by date/time.
Advanced Filter – detects key candlestick setups (Hammer, Shooting Star, Big Range) and ranks them for you.
Cycle Through Candidates (Select Best #)
When multiple candidates qualify (using Advanced Filter), use Select Best # to step through them:
#1 = top match, #2 = next, #3, … — based on your chosen sorting method (Best Pattern, Most Recent, Strongest).
Fibonacci Scaling
Switch between Linear or Logarithmic scale — or plot both simultaneously.
Custom Fib Levels & Styling
Add or remove Fibonacci levels freely.
Adjust each level’s value, label (price, %, or both), line style, and individual color.
Toggle visibility for retracements vs. extensions.
Labels & Info
Enable Show Candle Info to display a quick snapshot: which candle was picked, bars ago, pattern type, and volume context.
Reverse Option
Instantly flip the projection to the opposite direction.
🎯 Why Traders Use It
Turns a high-impact candle into a Fibonacci map of support/resistance.
Flexible selection: auto, pattern-based, custom date.
Quick cycling through ranked candidates with Select Best #.
Full customization of Fib levels, scaling, colors, and labels.
Works for both retracement and extension analysis.
⚠️ Disclaimer: For educational use only. Not financial advice. Always pair with your own system and risk management.
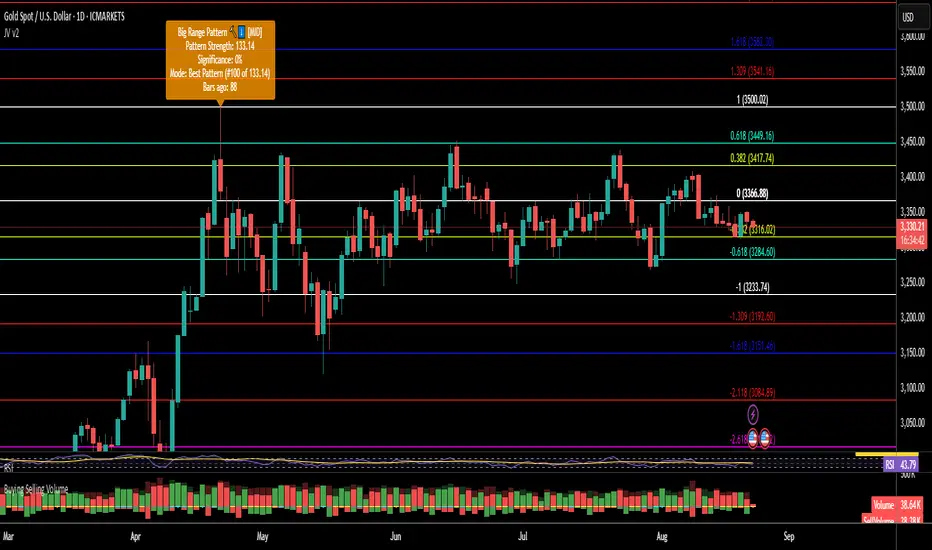
Previous Day Fibonacci + Opening RangePrev Day Fibonacci & Opening Range Levels
This indicator is designed for professional traders who want to combine yesterday’s market structure with today’s intraday levels.
🔹 Features:
Automatic Fibonacci Retracements: Draws customizable Fibonacci retracement/extension levels based on the previous day’s High & Low.
Full Customization: Users can adjust the Fibonacci ratios and colors directly in settings.
Opening Range Levels: Plots today’s first candle High & Low (user-selectable timeframe for OR).
Clear Visuals: Helps identify key reversal zones, breakout levels, and confluence areas between higher timeframe structure and intraday moves.
🔹 Usage Ideas:
Spot potential reversal zones when price reacts to previous-day Fib levels.
Combine Opening Range breakout strategies with daily Fib levels for high-probability setups.
Use as confluence levels with your existing price action or indicator-based strategy.
⚡ Pro Tip: Look for overlaps between the Opening Range and Fibonacci retracements — these zones often act as strong support/resistance areas.
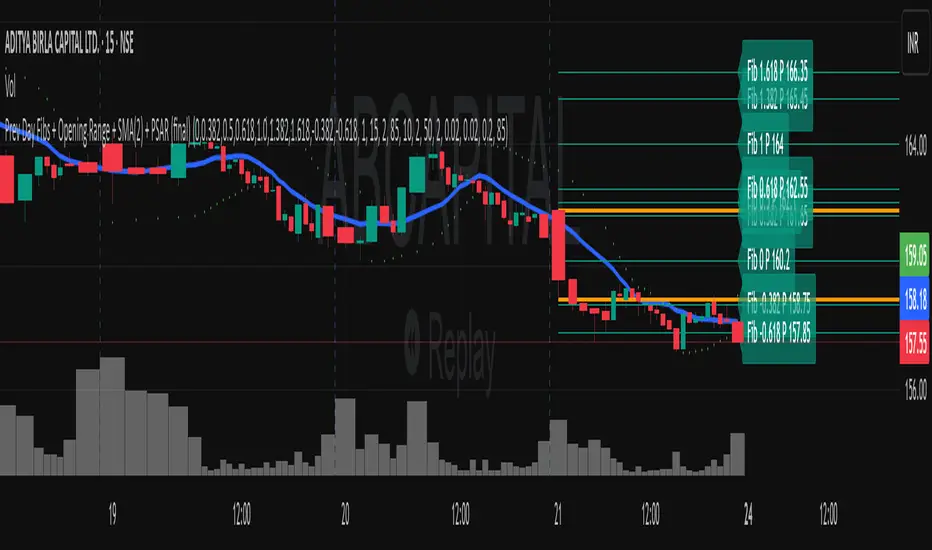
FibPivot FluidTrades ProEducational Purpose only.
Trading Plan
⏰ Timeframe
Best suited for 15-minute for direction and signal or 5/1-minute for Ep chart intraday.
For swing trades, consider 4H or 1H.
✅ Trade Setup Conditions
1. Market Structure Confirmation (MS, BOS, MSS)
Use BOS (Break of Structure) or MSS (Market Structure Shift) labels:
✅ Bullish Bias: Look for MSS/BOS up (price breaks previous swing high).
✅ Bearish Bias: Look for MSS/BOS down (price breaks previous swing low).
2. Supply & Demand Zones
Look for:
Demand box = long bias.
Supply box = short bias.
Avoid entering inside zones—wait for a retest/rejection or BOS out of zone.
3. Entry Signal
Buy Entry:
Green "Buy" shape appears. 50% of Candle
Price is above ATR trailing stop.
Signal appears near a demand zone, above MA200, and preferably above pivot level.
Sell Entry:
Red "Sell" shape appears. 50% of Candle
Price is below ATR trailing stop.
Signal appears near a supply zone, below MA200, and preferably below pivot level.
🧭 Confluences for Entry
Use 3+ of the following:
ATR trailing signal ✅
BOS/MSS ✅
Demand/Supply zone (fresh) ✅
Price above/below MA200 ✅
Close above/below pivot or Fib levels ✅
Candle breaks 50% of signal candle ✅
🎯 Entry, Stop Loss, Take Profit
Component Setting
Entry Midpoint of signal candle (auto drawn line)
Stop Loss Fixed 7 ticks (adjustable via settings)
Take Profit Fixed 14 ticks (default R:R = 2:1)
Trail Option ATR trailing stop (optional exit)
📉 Exit Strategy
Exit fully at TP line.
Or:
Partial at 1:1 (7 ticks).
Remainder at 2:1 (14 ticks).
Or trail with x ATRTrailingStop.
🚫 Avoid Trades When:
Price is inside supply/demand zones (indecision).
No BOS/MSS or weak structure.
Trading against MA200 slope/direction.
Entering near strong Fib pivot levels acting as support/resistance.
🔔 Alerts Available
Buy Signal (UT Long)
Sell Signal (UT Short)
BOS/MSS alerts (bull/bear)
🛠️ Risk Management
Risk only 1–2% of your capital per trade.
Follow the table display for low risk
Entry and Stop loss
TP
Risk-Reward Ratio (R:R)
Stick to predefined ticks for consistency.
📝 Example Trade Flow (Long):
MSS label (Bull) appears.
A Demand zone is drawn and respected.
Buy Signal appears above ATR trailing stop.
Price is above MA200.
Entry at midpoint of signal candle.
SL = -7 ticks, TP = +14 ticks.
P/S "I just wanted to say a big thank you to masterpiece FluidTrades SMC Lite script, clean, smart, and very useful. It helped me spot better entries and structure my trades properly.
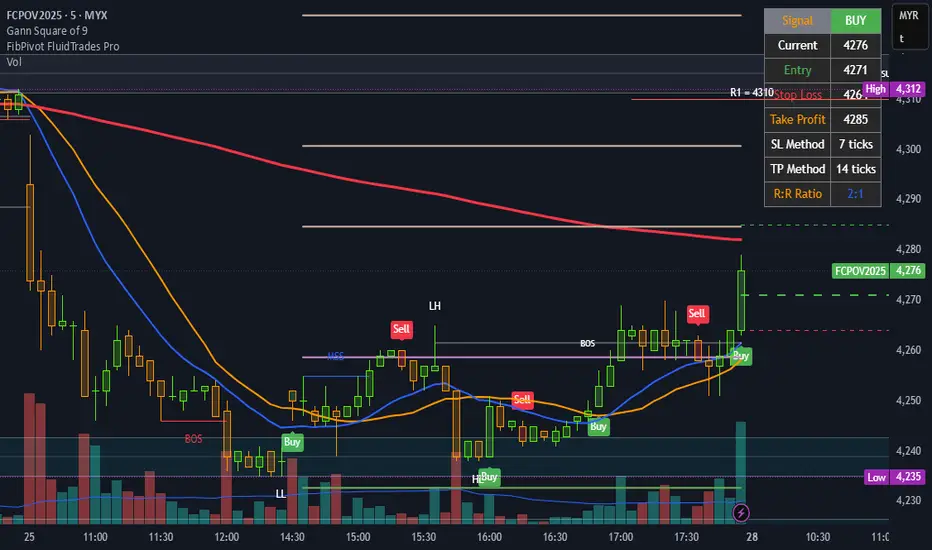
Reversal Point Dynamics⇋ Reversal Point Dynamics (RPD)
This is not an indicator; it is a complete system for deconstructing the mechanics of a market reversal. Reversal Point Dynamics (RPD) moves far beyond simplistic pattern recognition, venturing into a deep analysis of the underlying forces that cause trends to exhaust, pause, and turn. It is engineered from the ground up to identify high-probability reversal points by quantifying the confluence of market dynamics in real-time.
Where other tools provide a static signal, RPD delivers a dynamic probability. It understands that a true market turning point is not a single event, but a cascade of failing momentum, structural breakdown, and a shift in market order. RPD's core engine meticulously analyzes each of these dynamic components—the market's underlying state, its velocity and acceleration, its degree of chaos (entropy), and its structural framework. These forces are synthesized into a single, unified Probability Score, offering you an unprecedented, transparent view into the conviction behind every potential reversal.
This is not a "black box" system. It is an open-architecture engine designed to empower the discerning trader. Featuring real-time signal projection, an integrated Fibonacci R2R Target Engine, and a comprehensive dashboard that acts as your Dynamics Control Center , RPD gives you a complete, holistic view of the market's state.
The Theoretical Core: Deconstructing Market Dynamics
RPD's analytical power is born from the intelligent synthesis of multiple, distinct theoretical models. Each pillar of the engine analyzes a different facet of market behavior. The convergence of these analyses—the "Singularity" event referenced in the dashboard—is what generates the final, high-conviction probability score.
1. Pillar One: Quantum State Analysis (QSA)
This is the foundational analysis of the market's current state within its recent context. Instead of treating price as a random walk, QSA quantizes it into a finite number of discrete "states."
Formulaic Concept: The engine establishes a price range using the highest high and lowest low over the Adaptive Analysis Period. This range is then divided into a user-defined number of Analysis Levels. The current price is mapped to one of these states (e.g., in a 9-level system, State 0 is the absolute low, and State 8 is the absolute high).
Analytical Edge: This acts as a powerful foundational filter. The engine will only begin searching for reversal signals when the market has reached a statistically stretched, extreme state (e.g., State 0 or 8). The Edge Sensitivity input allows you to control exactly how close to this extreme edge the price must be, ensuring you are trading from points of maximum potential exhaustion.
2. Pillar Two: Price State Roc (PSR) - The Dynamics of Momentum
This pillar analyzes the kinetic forces of the market: its velocity and acceleration. It understands that it’s not just where the price is, but how it got there that matters.
Formulaic Concept: The psr function calculates two derivatives of price.
Velocity: (price - price ). This measures the speed and direction of the current move.
Acceleration: (velocity - velocity ). This measures the rate of change in that speed. A negative acceleration (deceleration) during a strong rally is a critical pre-reversal warning, indicating momentum is fading even as price may be pushing higher.
Analytical Edge: The engine specifically hunts for exhaustion patterns where momentum is clearly decelerating as price reaches an extreme state. This is the mechanical signature of a weakening trend.
3. Pillar Three: Market Entropy Analysis - The Dynamics of Order & Chaos
This is RPD's chaos filter, a concept borrowed from information theory. Entropy measures the degree of randomness or disorder in the market's price action.
Formulaic Concept: The calculateEntropy function analyzes recent price changes. A market moving directionally and smoothly has low entropy (high order). A market chopping back and forth without direction has high entropy (high chaos). The value is normalized between 0 and 1.
Analytical Edge: The most reliable trades occur in low-entropy, ordered environments. RPD uses the Entropy Threshold to disqualify signals that attempt to form in chaotic, unpredictable conditions, providing a powerful shield against whipsaw markets.
4. Pillar Four: The Synthesis Engine & Probability Calculation
This is where all the dynamic forces converge. The final probability score is a weighted calculation that heavily rewards confluence.
Formulaic Concept: The calculateProbability function intelligently assembles the final score:
A Base Score is established from trend strength and entropy.
An Entropy Score adds points for low entropy (order) and subtracts for high entropy (chaos).
A significant Divergence Bonus is awarded for a classic momentum divergence.
RSI & Volume Bonuses are added if momentum oscillators are in extreme territory or a volume spike confirms institutional interest.
MTF & Adaptive Bonuses add further weight for alignment with higher timeframe structure.
Analytical Edge: A signal backed by multiple dynamic forces (e.g., extreme state + decelerating momentum + low entropy + volume spike) will receive an exponentially higher probability score. This is the very essence of analyzing reversal point dynamics.
The Command Center: Mastering the Inputs
Every input is a precise lever of control, allowing you to fine-tune the RPD engine to your exact trading style, market, and timeframe.
🧠 Core Algorithm
Predictive Mode (Early Detection):
What It Is: Enables the engine to search for potential reversals on the current, unclosed bar.
How It Works: Analyzes intra-bar acceleration and state to identify developing exhaustion. These signals are marked with a ' ? ' and are tentative.
How To Use It: Enable for scalping or very aggressive day trading to get the earliest possible indication. Disable for swing trading or a more conservative approach that waits for full bar confirmation.
Live Signal Mode (Current Bar):
What It Is: A highly aggressive mode that plots tentative signals with a ' ! ' on the live bar based on projected price and momentum. These signals repaint intra-bar.
How It Works: Uses a linear regression projection of the close to anticipate a reversal.
How To Use It: For advanced users who use intra-bar dynamics for execution and understand the nature of repainting signals.
Adaptive Analysis Period:
What It Is: The main lookback period for the QSA, PSR, and Entropy calculations. This is the engine's "memory."
How It Works: A shorter period makes the engine highly sensitive to local price swings. A longer period makes it focus only on major, significant market structure.
How To Use It: Scalping (1-5m): 15-25. Day Trading (15m-1H): 25-40. Swing Trading (4H+): 40-60.
Fractal Strength (Bars):
What It Is: Defines the strength of the pivot detection used for confirming reversal events.
How It Works: A value of '2' requires a candle's high/low to be more extreme than the two bars to its left and right.
How To Use It: '2' is a robust standard. Increase to '3' for an even stricter definition of a structural pivot, which will result in fewer signals.
MTF Multiplier:
What It Is: Integrates pivot data from a higher timeframe for confluence.
How It Works: A multiplier of '4' on a 15-minute chart will pull pivot data from the 1-hour chart (15 * 4 = 60m).
How To Use It: Set to a multiple that corresponds to your preferred higher timeframe for contextual analysis.
🎯 Signal Settings
Min Probability %:
What It Is: Your master quality filter. A signal is only plotted if its score exceeds this threshold.
How It Works: Directly filters the output of the final probability calculation.
How To Use It: High-Quality (80-95): For A+ setups only. Balanced (65-75): For day trading. Aggressive (50-60): For scalping.
Min Signal Distance (Bars):
What It Is: A noise filter that prevents signals from clustering in choppy conditions.
How It Works: Enforces a "cooldown" period of N bars after a signal.
How To Use It: Increase in ranging markets to focus on major swings. Decrease on lower timeframes.
Entropy Threshold:
What It Is: Your "chaos shield." Sets the maximum allowable market randomness for a signal.
How It Works: If calculated entropy is above this value, the signal is invalidated.
How To Use It: Lower values (0.1-0.5): Extremely strict. Higher values (0.7-1.0): More lenient. 0.85 is a good balance.
Adaptive Entropy & Aggressive Mode:
What It Is: Toggles for dynamically adjusting the engine's core parameters.
How It Works: Adaptive Entropy can slightly lower the required probability in strong trends. Aggressive Mode uses more lenient settings across the board.
How To Use It: Keep Adaptive on. Use Aggressive Mode sparingly, primarily for scalping highly volatile assets.
📊 State Analysis
Analysis Levels:
What It Is: The number of discrete "states" for the QSA.
How It Works: More levels create a finer-grained analysis of price location.
How To Use It: 6-7 levels are ideal. Increasing to 9 can provide more precision on very volatile assets.
Edge Sensitivity:
What It Is: Defines how close to the absolute top/bottom of the range price must be.
How It Works: '0' means price must be in the absolute highest/lowest state. '3' allows a signal within the top/bottom 3 states.
How To Use It: '3' provides a good balance. Lower it to '1' or '0' if you only want to trade extreme exhaustion.
The Dashboard: Your Dynamics Control Center
The dashboard provides a transparent, real-time view into the engine's brain. Use it to understand the context behind every signal and to gauge the current market environment at a glance.
🎯 UNIFIED PROB SCORE
TOTAL SCORE: The highest probability score (either Peak or Valley) the engine is currently calculating. This is your main at-a-glance conviction metric. The "Singularity" header refers to the event where market dynamics align—the event RPD is built to detect.
Quality: A human-readable interpretation of the Total Score. "EXCEPTIONAL" (🌟) is a rare, A+ confluence event. "STRONG" (💪) is a high-quality, tradable setup.
📊 ORDER FLOW & COMPONENT ANALYSIS
Volume Spike: Shows if the current volume is significantly higher than average (YES/NO). A 'YES' adds major confirmation.
Peak/Valley Conf: This breaks down the probability score into its directional components, showing you the separate confidence levels for a potential top (Peak) versus a bottom (Valley).
🌌 MARKET STRUCTURE
HTF Trend: Shows the direction of the underlying trend based on a Supertrend calculation.
Entropy: The current market chaos reading. "🔥 LOW" is an ideal, ordered state for trading. "😴 HIGH" is a warning of choppy, unpredictable conditions.
🔮 FIB & R2R ZONE (Large Dashboard)
This section gives you the status of the Fibonacci Target Engine. It shows if an Active Channel (entry zone) or Stop Zone (invalidation zone) is active and displays the precise price levels for the static entry, target, and stop calculated at the time of the signal.
🛡️ FILTERS & PREDICTIVES (Large Dashboard)
This panel provides a status check on all the bonus filters. It shows the current RSI Status, whether a Divergence is present, and if a Live Pending signal is forming.
The Visual Interface: A Symphony of Data
Every visual element is designed for instant, intuitive interpretation of market dynamics.
Signal Markers: These are the primary outputs of the engine.
▼/▲ b: A fully confirmed signal that has passed all filters.
? b: A tentative signal generated in Predictive Mode, indicating developing dynamics.
◈ b: This diamond icon replaces the standard triangle when the signal is confirmed by a strong momentum divergence, highlighting it as a superior setup where dynamics are misaligned with price.
Harmonic Wave: The flowing, colored wave around the price.
What It Represents: The market's "flow dynamic" and volatility.
How to Interpret It: Expanding waves show increasing volatility. The color is tied to the "Quantum Color" in your theme, representing the underlying energy field of the market.
Entropy Particles: The small dots appearing above/below price.
What They Represent: A direct visualization of the "order dynamic."
How to Interpret Them: Their presence signifies a low-entropy, ordered state ideal for trading. Their color indicates the direction of momentum (PSR velocity). Their absence means the market is too chaotic (high entropy).
The Fibonacci Target Engine: The dynamic R2R system appearing post-signal.
Static Fib Levels: Colored horizontal lines representing the market's "structural dynamic."
The Green "Active Channel" Box: Your zone of consideration. An area to manage a potential entry.
Development Philosophy
Reversal Point Dynamics was engineered to answer a fundamental question: can we objectively measure the forces behind a market turn? It is a synthesis of concepts from market microstructure, statistics, and information theory. The objective was never to create a "perfect" system, but to build a robust decision-support tool that provides a measurable, statistical edge by focusing on the principle of confluence.
By demanding that multiple, independent market dynamics align simultaneously, RPD filters out the vast majority of market noise. It is designed for the trader who thinks in terms of probability and risk management, not in terms of certainties. It is a tool to help you discount the obvious and bet on the unexpected alignment of market forces.
"Markets are constantly in a state of uncertainty and flux and money is made by discounting the obvious and betting on the unexpected."
— George Soros
Trade with insight. Trade with anticipation.
— Dskyz, for DAFE Trading Systems
