Multi-Timeframe Smart Analysis [Abusuhil]الوصف بالعربي في الاسفل .
📊 Multi-Timeframe Smart Analysis
🇬🇧 ENGLISH DESCRIPTION
Overview
Multi-Timeframe Smart Analysis is a professional trading indicator designed for cryptocurrency and forex markets, combining RSI and MACD with multi-timeframe (MTF) confirmation to generate high-probability trading signals. The indicator provides clear entry points, automatic Fibonacci-based targets, and risk management levels.
Key Features
1. Multi-Timeframe Analysis (MTF)
Analyzes up to 3 higher timeframes simultaneously
Provides trend confirmation from HTF1, HTF2, and HTF3
Real-time dashboard showing current trend status
Optional: Can be disabled to trade based on current timeframe only
2. Smart Signal Generation
Buy Signals: Generated when MACD crosses above signal line with bullish RSI and HTF confirmation
Sell Signals: Generated when MACD crosses below signal line with bearish RSI and HTF confirmation
Anti-spam system: Minimum bars between signals (default: 10 bars)
Optional: Show only last signal to keep chart clean
3. Automatic Risk Management
Entry Line: Displays exact entry price
Stop Loss: Calculated using ATR (default: 1.5x ATR)
Take Profit Levels:
T1: 1.618x ATR (First target)
T2: 2.618x ATR (Second target)
T3: 4.236x ATR (Final target)
4. Visual Dashboard
Shows current timeframe RSI and MACD status
Displays HTF1 and HTF2 trend direction (BULL/BEAR)
Real-time signal status (🟢 BUY / 🔴 SELL / ⚪ WAIT)
Clean, professional interface in top-right corner
5. Customization Options
Multiple signal styles: Label, Triangle, Arrow, Circle
Adjustable signal size: Tiny, Small, Normal, Large
Customizable colors for buy/sell signals
Flexible target extension bars
Toggle all features on/off independently
📋 Recommended Settings by Timeframe
For 1-Minute Chart (Scalping)
HTF1: 5 minutes
HTF2: 15 minutes
HTF3: 1 hour
RSI Length: 14
MACD: 12/26/9
Stop Loss ATR: 1.0
Best for: High-frequency scalping on volatile pairs like BTC/USDT, ETH/USDT
For 5-Minute Chart (Day Trading)
HTF1: 15 minutes
HTF2: 1 hour
HTF3: 4 hours
RSI Length: 14
MACD: 12/26/9
Stop Loss ATR: 1.5
Best for: Intraday trading on major crypto pairs and forex
For 15-Minute Chart (Swing Trading)
HTF1: 1 hour
HTF2: 4 hours
HTF3: 1 day
RSI Length: 14
MACD: 12/26/9
Stop Loss ATR: 1.5
Best for: Short-term swing trades, ideal for crypto and forex
For 1-Hour Chart (Position Trading)
HTF1: 4 hours
HTF2: 1 day
HTF3: 3 days
RSI Length: 14
MACD: 12/26/9
Stop Loss ATR: 2.0
Best for: Medium-term positions, suitable for all markets
For 4-Hour Chart (Swing/Position)
HTF1: 1 day
HTF2: 3 days
HTF3: 1 week
RSI Length: 14
MACD: 12/26/9
Stop Loss ATR: 2.5
Best for: Swing trading with lower frequency, higher accuracy
For Daily Chart (Long-Term)
HTF1: 3 days
HTF2: 1 week
HTF3: 1 month
RSI Length: 14
MACD: 12/26/9
Stop Loss ATR: 3.0
Best for: Position trading and long-term investments
🎯 How to Trade with This Indicator
Entry Rules
For LONG (Buy) Entries:
Wait for 🟢 BUY signal to appear
Verify HTF1 and HTF2 show BULL trend in dashboard
Check RSI is below 70 (not overbought)
Enter at the displayed Entry Line price
Place stop loss at SL level
Set take profit at T1, T2, T3 (scale out)
For SHORT (Sell) Entries:
Wait for 🔴 SELL signal to appear
Verify HTF1 and HTF2 show BEAR trend in dashboard
Check RSI is above 30 (not oversold)
Enter at the displayed Entry Line price
Place stop loss at SL level
Set take profit at T1, T2, T3 (scale out)
Exit Strategy (Recommended)
Conservative Approach:
Close 50% position at T1
Move SL to breakeven
Close 30% at T2
Let 20% run to T3 with trailing stop
Aggressive Approach:
Hold full position to T2
Close 70% at T2
Trail remaining 30% to T3
Quick Scalp:
Close entire position at T1
Re-enter on next signal
⚙️ Settings Guide
Timeframe Settings
Enable Higher Timeframe Analysis: Toggle MTF confirmation on/off
HTF1, HTF2, HTF3: Set your desired higher timeframes
RSI Settings
RSI Length: Period for RSI calculation (default: 14)
RSI Overbought: Upper threshold (default: 70)
RSI Oversold: Lower threshold (default: 30)
Use RSI Filter: Enable/disable RSI confirmation
MACD Settings
Fast Length: Fast EMA period (default: 12)
Slow Length: Slow EMA period (default: 26)
Signal Length: Signal line period (default: 9)
Use MACD Filter: Enable/disable MACD confirmation
Target Settings
Show Price Targets: Toggle target lines on/off
Fib Target 1/2/3: Customize Fibonacci multipliers
Target Extension Bars: How far targets extend (default: 50)
Stop Loss ATR: Stop loss distance multiplier (default: 1.5)
Signal Settings
Show Buy/Sell Signals: Toggle signals independently
Show Only Last Signal: Hide previous signals, show only latest
Signal Style: Choose visual style (Label/Triangle/Arrow/Circle)
Minimum Bars Between Signals: Anti-spam filter (default: 10)
📌 Important Notes
Not a Holy Grail: This indicator is a tool, not a guarantee. Always use proper risk management
Backtest First: Test on historical data before live trading
Combine with Price Action: Use support/resistance levels for additional confirmation
Adjust to Market Conditions: Volatile markets may need wider stops, ranging markets need tighter targets
News Events: Avoid trading during major news releases
Risk Management: Never risk more than 1-2% of your capital per trade
🎓 Best Practices
Start Conservative: Begin with default settings
One Timeframe at a Time: Master one chart before expanding
Journal Your Trades: Track which settings work best for your style
Use Demo Account: Practice before risking real money
Stay Disciplined: Follow your trading plan strictly
🔔 Alert System
The indicator includes built-in alerts:
Buy Signal Alert: Notifies when long opportunity appears
Sell Signal Alert: Notifies when short opportunity appears
To activate alerts:
Click "Create Alert" in TradingView
Select "Multi-Timeframe Smart Analysis"
Choose "Buy Signal" or "Sell Signal"
Set notification preferences
💡 Pro Tips
Confluence Trading: Wait for signals that align with key S/R levels
Trend Trading: In strong trends, prioritize signals in trend direction
Multiple Timeframe Entries: Use HTF for bias, lower TF for precise entry
Partial Profits: Always secure some profit at T1
Trailing Stops: Move SL to breakeven after T1 is hit
⚠️ Risk Disclaimer
Trading cryptocurrencies, forex, and other financial instruments involves substantial risk of loss and is not suitable for all investors. Past performance is not indicative of future results. The indicator provides technical analysis only and should not be considered financial advice. You are solely responsible for your trading decisions. Always conduct your own research and consider consulting with a licensed financial advisor.
📞 Support & Updates
For questions, suggestions, or bug reports, please contact via TradingView messages.
Version: 1.0
Author: Abusuhil
Last Updated: December 2024
📊 التحليل الذكي متعدد الأطر الزمنية
🇸🇦 الوصف بالعربية
نظرة عامة
التحليل الذكي متعدد الأطر الزمنية هو مؤشر تداول احترافي مصمم لأسواق العملات الرقمية والفوركس، يجمع بين مؤشري RSI و MACD مع تأكيد من أطر زمنية أعلى لتوليد إشارات تداول عالية الاحتمالية. يوفر المؤشر نقاط دخول واضحة، أهداف تلقائية مبنية على فيبوناتشي، ومستويات إدارة المخاطر.
المزايا الرئيسية
1. التحليل متعدد الأطر الزمنية (MTF)
يحلل حتى 3 أطر زمنية أعلى في وقت واحد
يوفر تأكيد الاتجاه من HTF1، HTF2، و HTF3
لوحة معلومات فورية تظهر حالة الاتجاه الحالي
اختياري: يمكن تعطيله للتداول بناءً على الإطار الزمني الحالي فقط
2. توليد إشارات ذكية
إشارات الشراء: تُنشأ عندما يعبر MACD فوق خط الإشارة مع RSI صاعد وتأكيد HTF
إشارات البيع: تُنشأ عندما يعبر MACD تحت خط الإشارة مع RSI هابط وتأكيد HTF
نظام مضاد للإزعاج: حد أدنى من الشموع بين الإشارات (افتراضي: 10 شموع)
اختياري: إظهار آخر إشارة فقط للحفاظ على نظافة الشارت
3. إدارة تلقائية للمخاطر
خط الدخول: يعرض سعر الدخول الدقيق
وقف الخسارة: محسوب باستخدام ATR (افتراضي: 1.5x ATR)
مستويات جني الأرباح:
T1: 1.618x ATR (الهدف الأول)
T2: 2.618x ATR (الهدف الثاني)
T3: 4.236x ATR (الهدف النهائي)
4. لوحة معلومات مرئية
تعرض حالة RSI و MACD للإطار الزمني الحالي
تظهر اتجاه HTF1 و HTF2 (صاعد/هابط)
حالة الإشارة الفورية (🟢 شراء / 🔴 بيع / ⚪ انتظار)
واجهة نظيفة واحترافية في الزاوية العلوية اليمنى
5. خيارات التخصيص
أنماط إشارات متعددة: تسمية، مثلث، سهم، دائرة
حجم إشارة قابل للتعديل: صغير جداً، صغير، عادي، كبير
ألوان قابلة للتخصيص لإشارات الشراء/البيع
أشرطة تمديد الهدف مرنة
تبديل جميع الميزات تشغيل/إيقاف بشكل مستقل
📋 الإعدادات الموصى بها حسب الإطار الزمني
لشارت دقيقة واحدة (سكالبينج)
HTF1: 5 دقائق
HTF2: 15 دقيقة
HTF3: 1 ساعة
طول RSI: 14
MACD: 12/26/9
وقف الخسارة ATR: 1.0
الأفضل لـ: السكالبينج عالي التردد على الأزواج المتقلبة مثل BTC/USDT، ETH/USDT
لشارت 5 دقائق (التداول اليومي)
HTF1: 15 دقيقة
HTF2: 1 ساعة
HTF3: 4 ساعات
طول RSI: 14
MACD: 12/26/9
وقف الخسارة ATR: 1.5
الأفضل لـ: التداول اليومي على أزواج العملات الرقمية الرئيسية والفوركس
لشارت 15 دقيقة (التداول المتأرجح)
HTF1: 1 ساعة
HTF2: 4 ساعات
HTF3: 1 يوم
طول RSI: 14
MACD: 12/26/9
وقف الخسارة ATR: 1.5
الأفضل لـ: صفقات التأرجح قصيرة المدى، مثالي للعملات الرقمية والفوركس
لشارت ساعة واحدة (التداول بالمراكز)
HTF1: 4 ساعات
HTF2: 1 يوم
HTF3: 3 أيام
طول RSI: 14
MACD: 12/26/9
وقف الخسارة ATR: 2.0
الأفضل لـ: المراكز متوسطة المدى، مناسب لجميع الأسواق
لشارت 4 ساعات (التأرجح/المراكز)
HTF1: 1 يوم
HTF2: 3 أيام
HTF3: 1 أسبوع
طول RSI: 14
MACD: 12/26/9
وقف الخسارة ATR: 2.5
الأفضل لـ: التداول المتأرجح بتردد أقل ودقة أعلى
للشارت اليومي (طويل المدى)
HTF1: 3 أيام
HTF2: 1 أسبوع
HTF3: 1 شهر
طول RSI: 14
MACD: 12/26/9
وقف الخسارة ATR: 3.0
الأفضل لـ: تداول المراكز والاستثمارات طويلة المدى
🎯 كيفية التداول باستخدام هذا المؤشر
قواعد الدخول
لصفقات الشراء (LONG):
انتظر ظهور إشارة 🟢 شراء
تحقق من أن HTF1 و HTF2 تظهر اتجاه صاعد في لوحة المعلومات
تأكد من أن RSI أقل من 70 (ليس في منطقة التشبع الشرائي)
ادخل عند سعر خط الدخول المعروض
ضع وقف الخسارة عند مستوى SL
اضبط جني الأرباح عند T1، T2، T3 (اخرج تدريجياً)
لصفقات البيع (SHORT):
انتظر ظهور إشارة 🔴 بيع
تحقق من أن HTF1 و HTF2 تظهر اتجاه هابط في لوحة المعلومات
تأكد من أن RSI أعلى من 30 (ليس في منطقة التشبع البيعي)
ادخل عند سعر خط الدخول المعروض
ضع وقف الخسارة عند مستوى SL
اضبط جني الأرباح عند T1، T2، T3 (اخرج تدريجياً)
استراتيجية الخروج (موصى بها)
النهج المحافظ:
أغلق 50% من المركز عند T1
حرك وقف الخسارة إلى نقطة التعادل
أغلق 30% عند T2
دع 20% يعمل حتى T3 مع وقف خسارة متحرك
النهج العدواني:
احتفظ بالمركز الكامل حتى T2
أغلق 70% عند T2
تتبع الـ 30% المتبقية حتى T3
سكالبينج سريع:
أغلق المركز بالكامل عند T1
أعد الدخول عند الإشارة التالية
⚙️ دليل الإعدادات
إعدادات الإطار الزمني
تفعيل تحليل الإطار الزمني الأعلى: تبديل تأكيد MTF تشغيل/إيقاف
HTF1، HTF2، HTF3: اضبط الأطر الزمنية الأعلى المرغوبة
إعدادات RSI
طول RSI: فترة حساب RSI (افتراضي: 14)
RSI في التشبع الشرائي: العتبة العليا (افتراضي: 70)
RSI في التشبع البيعي: العتبة السفلى (افتراضي: 30)
استخدام فلتر RSI: تمكين/تعطيل تأكيد RSI
إعدادات MACD
الطول السريع: فترة المتوسط المتحرك السريع (افتراضي: 12)
الطول البطيء: فترة المتوسط المتحرك البطيء (افتراضي: 26)
طول الإشارة: فترة خط الإشارة (افتراضي: 9)
استخدام فلتر MACD: تمكين/تعطيل تأكيد MACD
إعدادات الأهداف
إظهار أهداف الأسعار: تبديل خطوط الأهداف تشغيل/إيقاف
هدف فيبوناتشي 1/2/3: تخصيص مضاعفات فيبوناتشي
أشرطة تمديد الأهداف: مدى امتداد الأهداف (افتراضي: 50)
وقف الخسارة ATR: مضاعف مسافة وقف الخسارة (افتراضي: 1.5)
إعدادات الإشارات
إظهار إشارات الشراء/البيع: تبديل الإشارات بشكل مستقل
إظهار آخر إشارة فقط: إخفاء الإشارات السابقة، إظهار الأحدث فقط
نمط الإشارة: اختر النمط المرئي (تسمية/مثلث/سهم/دائرة)
الحد الأدنى من الشموع بين الإشارات: فلتر مضاد للإزعاج (افتراضي: 10)
📌 ملاحظات مهمة
ليس الكأس المقدسة: هذا المؤشر أداة، وليس ضماناً. استخدم دائماً إدارة مخاطر مناسبة
اختبار رجعي أولاً: اختبر على البيانات التاريخية قبل التداول المباشر
ادمج مع حركة السعر: استخدم مستويات الدعم/المقاومة لتأكيد إضافي
تكيّف مع ظروف السوق: الأسواق المتقلبة قد تحتاج إلى وقف خسارة أوسع، الأسواق الجانبية تحتاج إلى أهداف أضيق
أحداث الأخبار: تجنب التداول أثناء إصدارات الأخبار الكبرى
إدارة المخاطر: لا تخاطر أبداً بأكثر من 1-2% من رأس مالك لكل صفقة
🎓 أفضل الممارسات
ابدأ بحذر: ابدأ بالإعدادات الافتراضية
إطار زمني واحد في كل مرة: أتقن شارت واحد قبل التوسع
سجل صفقاتك: تتبع أي الإعدادات تعمل بشكل أفضل لأسلوبك
استخدم حساب تجريبي: تدرب قبل المخاطرة بأموال حقيقية
التزم بالانضباط: اتبع خطة تداولك بصرامة
🔔 نظام التنبيهات
يتضمن المؤشر تنبيهات مدمجة:
تنبيه إشارة الشراء: يُعلمك عند ظهور فرصة شراء
تنبيه إشارة البيع: يُعلمك عند ظهور فرصة بيع
لتفعيل التنبيهات:
انقر على "إنشاء تنبيه" في TradingView
اختر "Multi-Timeframe Smart Analysis"
اختر "Buy Signal" أو "Sell Signal"
اضبط تفضيلات الإشعارات
💡 نصائح احترافية
تداول التقاء: انتظر الإشارات التي تتماشى مع مستويات الدعم والمقاومة الرئيسية
تداول الاتجاه: في الاتجاهات القوية، أعط الأولوية للإشارات في اتجاه الترند
مداخل الإطار الزمني المتعدد: استخدم HTF للتحيز، إطار زمني أقل للدخول الدقيق
أرباح جزئية: احفظ دائماً بعض الربح عند T1
وقف خسارة متحرك: حرك وقف الخسارة إلى التعادل بعد الوصول إلى T1
⚠️ إخلاء مسؤولية المخاطر
تداول العملات الرقمية والفوركس وغيرها من الأدوات المالية ينطوي على مخاطر كبيرة للخسارة وليس مناسباً لجميع المستثمرين. الأداء السابق لا يشير إلى النتائج المستقبلية. يوفر المؤشر التحليل الفني فقط ولا ينبغي اعتباره نصيحة مالية. أنت المسؤول الوحيد عن قرارات التداول الخاصة بك. قم دائماً بإجراء بحثك الخاص وفكر في استشارة مستشار مالي مرخص.
📞 الدعم والتحديثات
للأسئلة أو الاقتراحات أو الإبلاغ عن الأخطاء، يرجى التواصل عبر رسائل TradingView.
الإصدار: 1.0
المطور: Abusuhil
آخر تحديث: ديسمبر 2024
Cerca negli script per "fib"

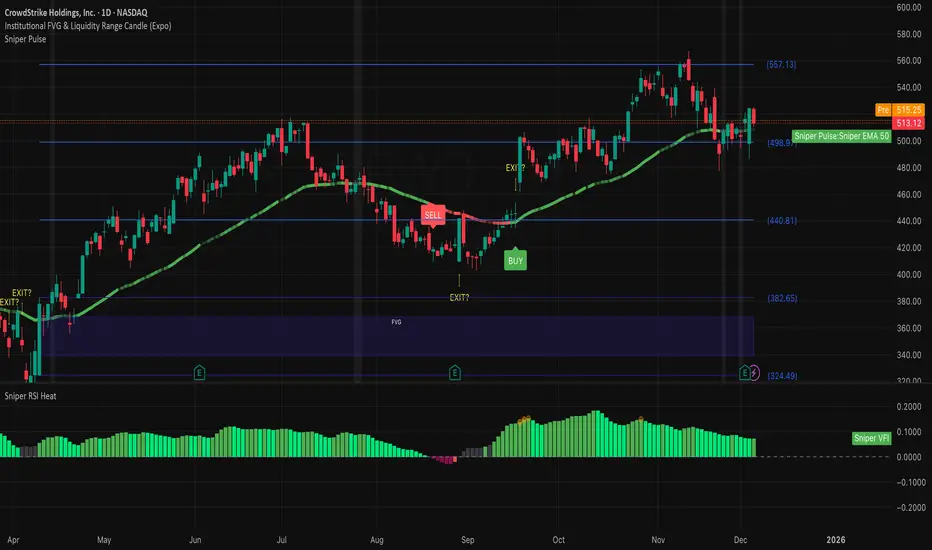
Institutional 50: The Truth TellerOverview This is a comprehensive "Fusion Strategy" overlay designed to filter out false breakouts and catch high-probability trends. It upgrades the classic EMA 50 Cross Strategy by "locking" the signal with Institutional Volume Flow (VFI) and adding an automated Fibonacci safety guard.
The Problem Standard moving average strategies often fail in two scenarios:
Fakeouts: Price crosses the line, but there is no real volume backing the move.
Choppy Markets: The price dances around the line, generating multiple false signals.
The Solution: Triple-Layer Filtering This indicator solves these issues using a strict logic:
The Trigger (EMA 50): The primary signal is generated when price crosses the EMA 50.
The Lock (VFI Filter): A signal is ONLY valid if the Volume Flow Indicator (VFI) confirms the direction (Positive for Buy, Negative for Sell). If price crosses but VFI disagrees, the line turns GRAY, warning of a "Empty Rally" or "Bear Trap."
The Safety (Fib Guard): The system automatically draws invisible Fibonacci retracement levels based on recent price action. If a trend reverses and breaks the Golden Ratio (0.618), a Yellow Warning Arrow appears, signaling a potential trend failure.
Anti-Chop Filter: It calculates the slope of the EMA. If the market is flat/ranging, the line turns WHITE and signals are suppressed.
Visual Guide & Legend
🟢 Green Line + BUY Label: Confirmed Uptrend (Price > EMA 50 + Positive Institutional Volume).
🔴 Red Line + SELL Label: Confirmed Downtrend (Price < EMA 50 + Negative Institutional Volume).
⚪ Gray Line: CAUTION. Price has crossed the EMA, but Volume does NOT confirm. Do not enter.
⬜ White Line / Background: CHOP ZONE. The market is ranging/flat. No trades.
⚠️ Yellow Arrows (EXIT?): The price has moved against the trend and broken key Fibonacci Support/Resistance. Consider tightening stops or exiting.
Best For:
Trend Following on 1H, 4H, and Daily timeframes.
Traders looking to filter out "Noise" and focus only on Volume-Backed moves.
7 hours ago
Release Notes
Update: Visual Risk Management (The Fade Effect)
This update transforms the indicator from a simple Trend Follower into a Dynamic Momentum Monitor. Instead of just telling you "Up" or "Down," the line now visually communicates the strength of the trend in real-time.
The Logic: Main Trend vs. Immediate Momentum We introduced a secondary, faster engine in the background (EMA 13) to act as a "Pulse Check" against the Main Trend (EMA 50).
How to Read the Line:
1. Solid, Bright Line (Full Opacity) = "Full Throttle" 🟢🔴
Condition: Price is respecting BOTH the Main Trend (50) and the Fast Momentum (13).
Meaning: The trend is healthy and accelerating. Hold your position with confidence.
2. Faded, Transparent Line (Ghost Mode) = "Deceleration Warning" ⚠️
Condition: Price is still respecting the Main Trend (50), BUT has broken the Fast Momentum (13).
Meaning: The trend is getting tired. The major direction hasn't flipped yet, but the immediate momentum is gone.
Action: This is your Early Warning Signal. Consider tightening stops, taking partial profits, or preparing for a potential reversal. Do not add to positions when the line is faded.
Summary:
Bright Green: Strong Buy.
Faded Green: Weakening Uptrend (Caution).
Bright Red: Strong Sell.
Faded Red: Weakening Downtrend (Caution).

Swing F&O All‑Inclusive + Auto Fib & TBEAutomatically find swing opportunities, plots FR & TBE automatically

Daily Fib Levels Clean (Retrace + Extension)This indicator automatically detects the latest Daily Swing High and Swing Low and plots clean Fibonacci retracement levels based on those swings.
Even if you switch to 4H, 1H, 15m, or 5m, the levels remain locked to the Daily timeframe, giving you consistent higher-timeframe structure on any chart.

Daily Swing High/Low Fibs (Clean v6)This indicator automatically detects the latest Daily Swing High and Swing Low and plots clean Fibonacci retracement levels based on those swings.
Even if you switch to 4H, 1H, 15m, or 5m, the levels remain locked to the Daily timeframe, giving you consistent higher-timeframe structure on any chart.

Institutional 50: The Truth TellerOverview This is a comprehensive "Fusion Strategy" overlay designed to filter out false breakouts and catch high-probability trends. It upgrades the classic EMA 50 Cross Strategy by "locking" the signal with Institutional Volume Flow (VFI) and adding an automated Fibonacci safety guard.
The Problem Standard moving average strategies often fail in two scenarios:
Fakeouts: Price crosses the line, but there is no real volume backing the move.
Choppy Markets: The price dances around the line, generating multiple false signals.
The Solution: Triple-Layer Filtering This indicator solves these issues using a strict logic:
The Trigger (EMA 50): The primary signal is generated when price crosses the EMA 50.
The Lock (VFI Filter): A signal is ONLY valid if the Volume Flow Indicator (VFI) confirms the direction (Positive for Buy, Negative for Sell). If price crosses but VFI disagrees, the line turns GRAY, warning of a "Empty Rally" or "Bear Trap."
The Safety (Fib Guard): The system automatically draws invisible Fibonacci retracement levels based on recent price action. If a trend reverses and breaks the Golden Ratio (0.618), a Yellow Warning Arrow appears, signaling a potential trend failure.
Anti-Chop Filter: It calculates the slope of the EMA. If the market is flat/ranging, the line turns WHITE and signals are suppressed.
Visual Guide & Legend
🟢 Green Line + BUY Label: Confirmed Uptrend (Price > EMA 50 + Positive Institutional Volume).
🔴 Red Line + SELL Label: Confirmed Downtrend (Price < EMA 50 + Negative Institutional Volume).
⚪ Gray Line: CAUTION. Price has crossed the EMA, but Volume does NOT confirm. Do not enter.
⬜ White Line / Background: CHOP ZONE. The market is ranging/flat. No trades.
⚠️ Yellow Arrows (EXIT?): The price has moved against the trend and broken key Fibonacci Support/Resistance. Consider tightening stops or exiting.
Best For:
Trend Following on 1H, 4H, and Daily timeframes.
Traders looking to filter out "Noise" and focus only on Volume-Backed moves.
Multi-Factor Trend Confluence Indicator (PTP V4)Disclaimer: This is a technical analysis tool for educational and informational purposes only. It does not constitute investment advice, financial solicitation, or a recommendation to buy or sell any security or instrument. Trading involves significant risk, and past performance is not indicative of future results. Use at your own risk.
KEY Features and Strategic Methodology
This is a comprehensive trend and confluence indicator built on multiple factors to identify potential pullbacks within an established trend.
• Core Trend Filter: Uses a long-term EMA to confirm the overall market bias.
• Fibonacci Pullback Logic: Identifies potential low-risk entry zones by calculating a 61.8% Fibonacci Retracement over a user-defined lookback period.
• Multi-Factor Confluence: A signal is generated only when the price touches the Fib zone AND the following factors align (You can edit the script to adjust the confluence conditions.):
o RSI is above 50.
o Positive DI is above Negative DI (DMI Bullish Crossover).
o Price is above the fast EMA.
• Consecutive Signal Counter: Includes a unique counter that highlights bars where the confluence conditions have been met for a minimum number of consecutive candles (4 by default), aiding in the validation of strong momentum entries.
• Moving Average Visualization: Plots and color-fills 10 WMA, 21 EMA, 42 EMA, and 200 EMA to provide a full market context and visualize momentum shifts.
1. Short-Term Momentum (WMA10 vs. EMA42 Fill)
This fill area highlights immediate price acceleration and momentum shifts:
• Green Fill (Bullish Momentum): WMA10 > EMA42.
• Red Fill (Bearish Momentum): WMA10 < EMA42.
2. Long-Term Market Context (EMA200 vs. EMA42 Fill)
This fill area defines the dominant backdrop of the market, essential for strategic positioning:
• Green Fill (Bullish Context): EMA200 < EMA42.
• Red Fill (Bearish Context): EMA200 > EMA42.
EMA200 Line Coloration
The EMA200 line color itself also provides a visual cue for the long-term context:
• Red Line: When EMA200 > EMA42 (Bearish Context).
• Green Line: When EMA200 < EMA42 (Bullish Context).
Customization
The indicator is highly customizable via the settings menu, allowing users to adjust lengths for EMA, RSI, DMI, Pivot Points, and the specific parameters for the Fibonacci Retracement Strategy (tolerance and candle limits).

LJ Parsons Adjustable expanding MRT Fibpapers.ssrn.com
Market Resonance Theory (MRT) reinterprets financial markets as structured multiplicative, recursive systems rather than linear, dollar-based constructs. By mapping price growth as a logarithmic lattice of intervals, MRT identifies the deep structural cycles underlying long-term market behaviour. The model draws inspiration from the proportional relationships found in musical resonance, specifically the equal temperament system, revealing that markets expand through recurring octaves of compounded growth. This framework reframes volatility, not as noise, but as part of a larger self-organising structure.

Intraday Fibonacci Retracement Golden pocket for scalping# Intraday Fibonacci Retracement Golden pocket for scalping
## Overview
This advanced Pine Script indicator provides dynamic Fibonacci retracement levels specifically designed for intraday trading. Using proprietary AI-powered algorithms, the script automatically identifies optimal high and low reference points to generate precise Fibonacci levels that adapt in real-time throughout the trading day.
## Key Features
### 🎯 Dynamic Level Generation
- **Intelligent Auto-Detection**: Advanced algorithm automatically identifies key price levels using machine learning-based pattern recognition
- **Real-Time Updates**: Fibonacci levels dynamically adjust as new highs or lows are established during the session
- **Seven Core Levels**: 0% (LOD), 23.6%, 38.2%, 50%, 61.8%, 78.6%, and 100% (HOD)
### 📊 Visual Customization
- **Individual Level Control**: Show or hide any Fibonacci level independently
- **Custom Color Schemes**: Assign unique colors to each retracement level for easy identification
- **Adjustable Line Width**: Choose line thickness from 1-5 pixels for optimal chart clarity
- **Professional Labeling**: Each level displays both percentage and exact price value
### 🏆 Golden Zone Highlighting
- **Automated Zone Detection**: Automatically highlights the critical 50%-61.8% retracement zone
- **Visual Emphasis**: Shaded area between these key levels for quick visual reference
- **Customizable Transparency**: Adjust the golden zone color and opacity to match your chart theme
### 🔧 Flexible Configuration Options
#### Label Management
- **Master Toggle**: Instantly show or hide all labels with a single switch
- **Individual Label Control**: Selective visibility for each Fibonacci level label
- **Custom Label Colors**: Choose distinct colors for each label to match your trading style
- **Price Display Format**: Labels show percentage and corresponding price level
#### Level Visibility
Independent toggles for each retracement level:
- 0% (Low of Day)
- 23.6% Retracement
- 38.2% Retracement
- 50% Retracement (Midpoint)
- 61.8% Retracement (Golden Ratio)
- 78.6% Retracement
- 100% (High of Day)
### 📈 Trading Applications
**Support & Resistance**
- Identify potential reversal zones
- Spot key support and resistance levels
- Plan entry and exit points
**Price Targets**
- Set realistic profit targets based on Fibonacci extensions
- Identify potential pullback levels in trending markets
**Risk Management**
- Place stop losses at strategic Fibonacci levels
- Calculate risk-to-reward ratios using multiple levels
**Golden Zone Strategy**
- Focus on the 50%-61.8% zone for high-probability trade setups
- The golden ratio area often acts as a strong confluence zone
### 🔔 Built-in Alert System
Pre-configured alert conditions for critical price level crossings:
- 38.2% level cross
- 50% level cross (equilibrium)
- 61.8% level cross (golden ratio)
### 💡 Best Practices
**Optimal Usage**
- Works on all intraday timeframes (1min, 5min, 15min, 30min, 1hour)
- Most effective during active trading sessions
- Combine with volume analysis for confirmation
- Use alongside other technical indicators for confluence
**Chart Setup Tips**
- Adjust colors to ensure levels are visible against your chart background
- Use thicker lines on higher timeframes for better visibility
- Enable only the levels most relevant to your trading strategy
- Customize label colors to differentiate between key levels quickly
## Technical Specifications
**Performance Features**
- Maximum 500 lines supported for extensive historical analysis
- Maximum 500 labels for comprehensive price level identification
- Optimized calculations for minimal chart lag
- Real-time updates with every price tick
**Compatibility**
- Pine Script Version 6
- Compatible with all TradingView chart types
- Works across all markets (Stocks, Forex, Crypto, Futures, Options)
- Supports all timeframes from 1-minute to daily
## Installation & Setup
1. Copy the script code into TradingView Pine Editor
2. Click "Add to Chart" to apply the indicator
3. Access settings via the indicator's gear icon
4. Customize colors, labels, and visibility options to your preference
5. Save your configuration as a default template for future use
## Advanced Configuration
**For Clean Charts**
- Disable labels for a minimalist view
- Show only 50% and 61.8% levels for focused trading
- Use muted colors with higher transparency
**For Detailed Analysis**
- Enable all levels and labels
- Use high-contrast colors for each level
- Increase line width for emphasis
**For Specific Strategies**
- Mean reversion traders: Focus on 38.2%, 50%, 61.8%
- Breakout traders: Monitor 0% and 100% levels closely
- Scalpers: Use golden zone exclusively with tight stops
## Algorithm Intelligence
The indicator employs sophisticated algorithms to:
- Automatically calculate optimal reference points
- Adapt to changing market conditions
- Filter out noise and false signals
- Provide consistent, reliable level placement
This ensures that traders receive accurate, actionable Fibonacci levels without manual intervention or subjective placement decisions.
🎁 Free Trial Access
Interested in trying this indicator?
I'm offering a ONE MONTH FREE TRIAL to help you experience the power of dynamic Fibonacci levels in your trading.
To request your trial access:
Send me a Direct Message (DM) on TradingView
Include "Fib Trial Request" in your message
I'll respond with access instructions within 24 hours
This trial includes:
✅ Full access to all indicator features
✅ All customization options unlocked
✅ Priority support during trial period
✅ Setup assistance and configuration help
Don't miss this opportunity to enhance your intraday trading with professional-grade Fibonacci analysis!
📞 Author's Notes
For questions, feedback, or trial access requests, feel free to reach out via DM. I'm committed to helping traders succeed and continuously improving this tool based on user feedback.
Happy Trading!
---
**Disclaimer**: This indicator is a technical analysis tool. Past performance does not guarantee future results. Always use proper risk management and combine with other forms of analysis for trading decisions.

Elliott Wave - Wave 3 Entry EngineThis indicator is a Wave 3 entry engine built on top of an Elliott Wave–style 1-2-3 structure. It automatically finds potential Wave 3 trades, manages a simple R-multiple target/stop model, and marks outcomes directly on the chart.
What the indicator does
At a high level, the script:
Detects swing points on three “degrees”
Small (S) – fast, local swings
Medium (M) – broader swings
Large (L) – higher-timeframe context only
Looks for a 3-pivot pattern (W0 → W1 → W2)
Bullish setup: Low → High → Higher Low (L-H-L)
Bearish setup: High → Low → Lower High (H-L-H)
Checks whether that pattern is a valid Wave 1–2 structure
Using multiple rules:
Wave 2 retraces Wave 1 by a configurable fraction
Wave 1 is strong enough (percentage move + slope)
Wave 2 doesn’t overshoot Wave 0 too far
Trend direction and swing “consensus” across S/M/L degrees line up
Scores the setup (Pre-W3 Score)
The script calculates a 0–1 score based on:
How “nice” the Wave 2 retracement is vs the ideal level
How much stronger Wave 1’s slope is vs Wave 2’s pullback
How much consensus there is across the swing engine (S/M/L)
Only setups above your chosen minimum Pre-W3 score and that pass alignment checks become Wave 3 candidates.
Waits for breakout → creates a Wave 3 “entry”
For longs: price breaks above the Wave 1 high (plus an optional tick buffer)
For shorts: price breaks below the Wave 1 low (minus buffer)
When triggered, the indicator:
Stores entry price (close at breakout)
Sets a stop beyond Wave 2 (with optional extra ticks)
Calculates a target based on a fixed R multiple (e.g., 2R)
Tracks the trade until exit or timeout
For each open W3 trade, it monitors:
Target hit → marks “W3 ✅”
Stop hit → marks “W3 ❌”
Bar where both could have hit → conservative loss “W3 ?/❌”
Time-based expiry (too many bars in trade) → “W3 ⏰”
Candidates that never get a breakout within your chosen max bars from W2 can also be marked as timeout (⏰).
Visual elements on the chart
The script can plot several helpful visuals:
Swing connector lines (Small/Medium/Large)
Small = blue
Medium = purple
Large = orange
These show the detected swings at each degree
Pre-W3 labels at Wave 2 (optional)
Signals :
"Pre-W3 Long XX%" or"Pre-W3 Short XX%"
Placed at the Wave 2 pivot
Colored yellow, with the % score rounded to an integer
W3 Entry labels (optional)
"W3 Long Entry" below the bar for longs (green)
"W3 Short Entry" above the bar for shorts (red)
Outcome labels (optional)
W3 ✅ – target hit
W3 ❌ – stop hit
W3 ?/❌ – both hit on same bar, treated as loss
W3 ⏰ – candidate or trade timed out
All these can be toggled in the “Wave 3 Engine (Pre-W3 + Entries + Outcomes)” group.
Input groups & how to use them
Swing Detection (Small / Medium / Large)
These groups control how the script finds swing highs/lows using a multi-parameter pivot scan:
Left Min / Left Max / Right Min / Right Max
Define the pivot “strength” ranges (how many bars to the left/right the high/low must dominate).
Minimum swing % (post-aggregation)
Ensures that, once swings are merged and cleaned up, each swing is at least this % move from the prior opposite swing.
Loop Filters (Small/Medium/Large loop min % change)
Extra gating inside the pivot-search loop, so small noise pivots can be ignored even before final swing construction.
Practical use:
Tighten % thresholds or increase left/right bars to reduce noise.
Loosen them to get more swings and more potential W3 setups.
Wave 3 Logic
Wave 2 depth
W2 min / max retracement of W1 (fraction)
Example: 0.30–0.80 means W2 must retrace 30–80% of W1.
Ideal W2 retracement (for scoring)
Often set around 0.618 (classic fib). The closer W2 is to this, the higher the retracement part of the score.
Max W2 beyond W0 (%)
How far W2 may push past W0 (in %) before the setup is invalid. Set to 0 to disable this filter.
Wave 1 strength
Min W1 move (%)
Ensures Wave 1 itself is meaningful.
Min |W1 slope| / |W2 slope|
Wave 1 must be “steeper” than Wave 2’s correction.
Slope ratio for max score
Above this, extra slope advantage doesn’t improve the score further.
Scoring & Trend Alignment
Min Pre-W3 score (0..1)
Hard gate: anything below this won’t become a W3 candidate.
Trend alignment (S/M/L)
Options:
None – ignore swing directions, purely pattern/score based
Majority – at least 2 of S/M/L must point in the W3 direction
AllThree, S+M, S+L, M+L – stricter alignment variants
Alignment uses the latest swing direction (up or down) for each degree.
Max W3 candidates to track
Limits how many candidates + trades are stored. Old, already-closed items are pruned first; open trades are never pruned.
This is an indicator, not an order engine**:** it doesn’t place trades; it only marks hypothetical Wave 3 entries and outcomes based on your settings. Always validate on historical data and combine with your own analysis and risk management before using it in live trading.

Magic Swing Suite: Trend, Pullback & Risk DashboardMagic Swing Suite: Trend, Pullback & Risk Dashboard
This indicator is a complete Swing Trading System designed to identify high-probability trend continuation setups. It combines classic trend-following principles with a unique "3-Bar Retest" logic and provides a real-time Strategy Dashboard to help you manage positions without needing a separate strategy script.
How it Works:
The system looks for a "Confluence" of factors before generating a signal. It scores every bar out of 140 points based on the following criteria:
Trend Alignment: Price must be above EMA 10, and EMA 10 must be above EMA 20.
Momentum (RSI): RSI must be in the "Bullish Control Zone" (60-80) and above its SMA.
Volume: Volume must be significantly higher than the average (1.5x by default).
The "Magic" Retest: The script checks the last 2-5 bars to see if the price has pulled back to "kiss" the EMA 10. This ensures we are buying a dip in a trend, not chasing a top.
Breakout Confirmation: Checks for Darvas Box breakouts and price position relative to Pivot R1.
Features:
🎯 Virtual Strategy Dashboard: A table that mimics a strategy tester. It tracks Entry, Stop Loss (Trailing), Target 1, and Target 2 in real-time.
📊 Confluence Scorecard: A detailed table showing exactly why a signal was (or wasn't) generated (Trend, Retest, RSI, Volume, etc.).
🛡️ Risk Management: automatically calculates a Trailing Stop (EMA 10) and fixed Risk:Reward targets based on recent highs.
📉 Multi-Layered Overlays: Includes Auto-Pivots (Traditional, Fib, Woodie, etc.) and Darvas Boxes to identify support/resistance levels.
How to Use:
Wait for a Signal:
"FULL BUY SIGNAL" (Green): All conditions are met, including a recent retest of the EMA. This is the highest probability setup.
"BUY - NO RETEST" (Orange): Trend and momentum are strong, but price hasn't pulled back recently. Use caution, as this may be a breakout trade.
Monitor the Dashboard: Once a trade is active, the dashboard will change to "IN POSITION." Follow the "Action" row.
If the trend weakens, the Trailing Stop (EMA 10) will move up to protect profits.
Targets:
T1: Previous Swing High (or 5% if no high found).
T2: 1:1.6 Risk/Reward extension.
Settings:
Volume Spike Factor: Adjust how much volume is needed to confirm a move. Default is 1.2.
Retest Tolerance: Adjust how close the price needs to get to the EMA 10 to count as a "retest."
Dashboard Toggles: You can hide the tables if you prefer a clean chart.
Pivot Timeframes: customizable lookback for S/R levels.
FAQ:
Does this repaint?
No. All signals trigger only on confirmed bars.
Can I use this intraday?
Yes. Works great from 5m to 1D.
Are exits manual or automated?
The indicator tracks SL, T1, and T2, and marks them on the chart.
Does retest affect the buy signal?
Retest is optional. The buy logic does not require it, but adds weight to the score.
Disclaimer: This tool is for educational purposes only. The "Strategy Dashboard" is a simulation based on script calculations and does not execute real trades. Always manage your own risk.

Arden SMC OTEThis indicator represents a comprehensive trading system based on Smart Money Concepts (SMC) and Optimal Trade Entry (OTE). The script's key feature is the built-in "Liquidity Trap" filter, which protects the trader from entering positions where the price is highly likely to hunt for stop losses before making the true move.
Key Features:
1. Automatic OTE Search: The indicator identifies market structure (Swing Highs/Lows) on the selected timeframe and draws a Fibonacci grid. Entry is based on the 0.62 level, and the target is the -0.27 extension (or a fixed Risk:Reward ratio).
2. "Liquidity Trap" Filter (Smart Logic):
The algorithm scans the chart for Equal Highs (EQH) and Equal Lows (EQL), based on precise candle body touches.
Protection Logic: If a liquidity zone (EQH/EQL) is located between your entry point and your Stop Loss, the indicator cancels the signal. This saves you from situations where the market maker first "sweeps" liquidity (hits your stop) and only then moves in the desired direction.
3. Flexible Risk Management:
3 Stop Loss modes (Conservative behind the swing, Aggressive behind 0.88 Fib, or ATR-based).
Take Profit selection (Structure-based or fixed RR).
4. SMC Filters:
Equilibrium: Checks if the price is in the Discount zone (for buys) or Premium zone (for sells).
Structure Size: Filters out structures that are too small (noise) using ATR.
How to read the chart:
Grey zones/lines: Your potential trade (Entry, Stop, Take Profit).
Orange boxes: Liquidity Zones (EQH/EQL). If they appear, it means orders have accumulated there.
Labels: "ENTRY 🚀" — entry triggered, "TP HIT" — target reached.
Disclaimer:
This indicator is an assistive tool. Always check the higher timeframe context yourself.
Liquidity Filter Settings
❌ Block on Liquidity (EQH/EQL): The main checkbox. If enabled, the script checks: "Is there an orange liquidity box right before my stop loss?". If yes — no signal is generated.
Show Liquidity Zones: Toggle the visibility of the orange boxes.
Touch Count (cNum): How many times the price must hit the exact same level (body-to-body) for it to count as liquidity. Usually 2 (Double Top/Bottom).
Gap Count (bars): Minimum distance (in bars) between touches.
Confirmation Bars: How many candles must pass after the touch for the zone to be confirmed and drawn.

Superior-Range Bound Renko - Alerts - 11-29-25 - Signal LynxSuperior-Range Bound Renko – Alerts Edition with Advanced Risk Management Template
Signal Lynx | Free Scripts supporting Automation for the Night-Shift Nation 🌙
1. Overview
This is the Alerts & Indicator Edition of Superior-Range Bound Renko (RBR).
The Strategy version is built for backtesting inside TradingView.
This Alerts version is built for automation: it emits clean, discrete alert events that you can route into webhooks, bots, or relay engines (including your own Signal Lynx-style infrastructure).
Under the hood, this script contains the same core engine as the strategy:
Adaptive Range Bounding based on volatility
Renko Brick Emulation on standard candles
A stack of Laguerre Filters for impulse detection
K-Means-style Adaptive SuperTrend for trend confirmation
The full Signal Lynx Risk Management Engine (state machine, layered exits, AATS, RSIS, etc.)
The difference is in what we output:
Instead of placing historical trades, this version:
Plots the entry and RM signals in a separate pane (overlay = false)
Exposes alertconditions for:
Long Entry
Short Entry
Close Long
Close Short
TP1, TP2, TP3 hits (Staged Take Profit)
This makes it ideal as the signal source for automated execution via TradingView Alerts + Webhooks.
2. Quick Action Guide (TL;DR)
Best Timeframe:
4H and above. This is a swing-trading / position-trading style engine, not a micro-scalper.
Best Assets:
Volatile but structured markets, e.g.:
BTC, ETH, XAUUSD (Gold), GBPJPY, and similar high-volatility majors or indices.
Script Type:
indicator() – Alerts & Visualization Only
No built-in order placement
All “orders” are emitted as alerts for your external bot or manual handling
Strategy Type:
Volatility-Adaptive Trend Following + Impulse Detection
using Renko-like structure and multi-layer Laguerre filters.
Repainting:
Designed to be non-repainting on closed candles.
The underlying Risk Management engine is built around previous-bar data (close , high , low ) for execution-critical logic.
Intrabar values can move while the bar is forming (normal for any advanced signal), but once a bar closes, the alert logic is stable.
Recommended Alert Settings:
Condition: one of the built-in signals (see section 3.B)
Options: “Once Per Bar Close” is strongly recommended for automation
Message: JSON, CSV, or simple tokens – whatever your webhook / relay expects
3. Detailed Report: How the Alerts Edition Works
A. Relationship to the Strategy Version
The Alerts Edition shares the same internal logic as the strategy version:
Same Adaptive Lookback and volatility normalization
Same Range and Close Range construction
Same Renko Brick Emulator and directional memory (renkoDir)
Same Fib structures, Laguerre stack, K-Means SuperTrend, and Baseline signals (B1, B2)
Same Risk Management Engine and layered exits
In the strategy script, these signals are wired into strategy.entry, strategy.exit, and strategy.close.
In the alerts script:
We still compute the final entry/exit signals (Fin, CloseEmAll, TakeProfit1Plot, etc.)
Instead of placing trades, we:
Plot them for visual inspection
Expose them via alertcondition(...) so that TradingView can fire alerts.
This ensures that:
If you use the same settings on the same symbol/timeframe, the Alerts Edition and Strategy Edition agree on where entries and exits occur.
(Subject only to normal intrabar vs. bar-close differences.)
B. Signals & Alert Conditions
The alerts script focuses on discrete, automation-friendly events.
Internally, the main signals are:
Fin – Final entry decision from the RM engine
CloseEmAll – RM-driven “hard close” signal (for full-position exits)
TakeProfit1Plot / 2Plot / 3Plot – One-time event markers when each TP stage is hit
On the chart (in the separate indicator pane), you get:
plot(Fin) – where:
+2 = Long Entry event
-2 = Short Entry event
plot(CloseEmAll) – where:
+1 = “Close Long” event
-1 = “Close Short” event
plot(TP1/TP2/TP3) (if Staged TP is enabled) – integer tags for TP hits:
+1 / +2 / +3 = TP1 / TP2 / TP3 for Longs
-1 / -2 / -3 = TP1 / TP2 / TP3 for Shorts
The corresponding alertconditions are:
Long Entry
alertcondition(Fin == 2, title="Long Entry", message="Long Entry Triggered")
Fire this to open/scale a long position in your bot.
Short Entry
alertcondition(Fin == -2, title="Short Entry", message="Short Entry Triggered")
Fire this to open/scale a short position.
Close Long
alertcondition(CloseEmAll == 1, title="Close Long", message="Close Long Triggered")
Fire this to fully exit a long position.
Close Short
alertcondition(CloseEmAll == -1, title="Close Short", message="Close Short Triggered")
Fire this to fully exit a short position.
TP 1 Hit
alertcondition(TakeProfit1Plot != 0, title="TP 1 Hit", message="TP 1 Level Reached")
First staged take profit hit (either long or short). Your bot can interpret the direction based on position state or message tags.
TP 2 Hit
alertcondition(TakeProfit2Plot != 0, title="TP 2 Hit", message="TP 2 Level Reached")
TP 3 Hit
alertcondition(TakeProfit3Plot != 0, title="TP 3 Hit", message="TP 3 Level Reached")
Together, these give you a complete trade lifecycle:
Open Long / Short
Optionally scale out via TP1/TP2/TP3
Close remaining via Close Long / Close Short
All while the Risk Management Engine enforces the same logic as the strategy version.
C. Using This Script for Automation
This Alerts Edition is designed for:
Webhook-based bots
Execution relays (e.g., your own Lynx-Relay-style engine)
Dedicated external trade managers
Typical setup flow:
Add the script to your chart
Same symbol, timeframe, and settings you use in the Strategy Edition backtests.
Configure Inputs:
Longs / Shorts enabled
Risk Management toggles (SL, TS, Staged TP, AATS, RSIS)
Weekend filter (if you do not want weekend trades)
RBR-specific knobs (Adaptive Lookback, Brick type, ATR vs Standard Brick, etc.)
Create Alerts for Each Event Type You Need:
Long Entry
Short Entry
Close Long
Close Short
TP1 / TP2 / TP3 (optional, if your bot handles partial closes)
For each:
Condition: the corresponding alertcondition
Option: “Once Per Bar Close” is strongly recommended
Message:
You can use structured JSON or a simple token set like:
{"side":"long","event":"entry","symbol":"{{ticker}}","time":"{{timenow}}"}
or a simpler text for manual trading like:
LONG ENTRY | {{ticker}} | {{interval}}
Wire Up Your Bot / Relay:
Point TradingView’s webhook URL to your execution engine
Parse the messages and map them into:
Exchange
Symbol
Side (long/short)
Action (open/close/partial)
Size and risk model (this script does not position-size for you; it only signals when, not how much.)
Because the alerts come from a non-repainting, RM-backed engine that you’ve already validated via the Strategy Edition, you get a much cleaner automation pipeline.
D. Repainting Protection (Alerts Edition)
The same protections as the Strategy Edition apply here:
Execution-critical logic (trailing stop, TP triggers, SL, RM state changes) uses previous bar OHLC:
open , high , low , close
No security() with lookahead or future-bar dependencies.
This means:
Alerts are designed to fire on states that would have been visible at bar close, not on hypothetical “future history.”
Important practical note:
Intrabar: While a bar is forming, internal conditions can oscillate.
Bar Close: With “Once Per Bar Close” alerts, the fired signal corresponds to the final state of the engine for that candle, matching your Strategy Edition expectations.
4. For Developers & Modders
You can treat this Alerts script as an ”RM + Alert Framework” and inject any signal logic you want.
Where to plug in:
Find the section:
// BASELINE & SIGNAL GENERATION
You’ll see how B1 and B2 are built from the RBR stack and then combined:
baseSig = B2
altSig = B1
finalSig = sigSwap ? baseSig : altSig
To use your own logic:
Replace or wrap the code that sets baseSig / altSig with your own conditions:
e.g., RSI, MACD, Heikin Ashi filters, candle patterns, volume filters, etc.
Make sure your final decision is still:
2 → Long / Buy signal
-2 → Short / Sell signal
0 → No trade
finalSig is then passed into the RM engine and eventually becomes Fin, which:
Drives the Long/Short Entry alerts
Interacts with the RM state machine to integrate properly with AATS, SL, TS, TP, etc.
Because this script already exposes alertconditions for key lifecycle events, you don’t need to re-wire alerts each time — just ensure your logic feeds into finalSig correctly.
This lets you use the Signal Lynx Risk Management Engine + Alerts wrapper as a drop-in chassis for your own strategies.
5. About Signal Lynx
Automation for the Night-Shift Nation 🌙
Signal Lynx builds tools and templates that help traders move from:
“I have an indicator” → “I have a structured, automatable strategy with real risk management.”
This Superior-Range Bound Renko – Alerts Edition is the automation-focused companion to the Strategy Edition. It’s designed for:
Traders who backtest with the Strategy version
Then deploy live signals with this Alerts version via webhooks or bots
While relying on the same non-repainting, RM-driven logic
We release this code under the Mozilla Public License 2.0 (MPL-2.0) to support the Pine community with:
Transparent, inspectable logic
A reusable Risk Management template
A reference implementation of advanced adaptive logic + alerts
If you are exploring full-stack automation (TradingView → Webhooks → Exchange / VPS), keep Signal Lynx in your search.
License: Mozilla Public License 2.0 (Open Source).
If you build improvements or helpful variants, please consider sharing them back with the community.

GIX Analiza bar+ FIBFor feedback, I am at your disposal on WhatsApp 0040734534441 or Email George.Catinca@gmail.com

🌊 QUANTUM FLOW PRO - Ultimate Trading System🌊 QUANTUM FLOW PRO - Ultimate Trading System
Description:
QUANTUM FLOW PRO (QFP) is a comprehensive, all-in-one professional trading ecosystem designed for Crypto, Forex, and Stock markets. Unlike simple indicators that rely on a single metric, QFP combines Trend Analysis, Volume Profiles, Order Flow, and Institutional Accumulation logic into a single, powerful decision-making engine.
This system calculates a "Signal Score" (0-100) for every potential trade by analyzing over 10 different technical factors simultaneously.
🚀 KEY FEATURES
1. 🧠 Smart Signal Scoring System Every Buy or Sell signal is not just a guess; it is the result of a complex calculation. The system evaluates:
Trend: SuperTrend & EMA confluence.
Momentum: RSI, MACD, and Stochastic levels.
Volume: Money Flow, OBV, and Volume Z-Score.
Multi-Timeframe (HTF): Checks 4H and Daily trends for confirmation.
Result: You get a score (e.g., 85/100) indicating the probability of success.
2. 🐋 Whale & Accumulation Detection Identify where big players are positioning themselves before the move happens.
Purple Zones: High Accumulation areas (potential explosive breakouts).
Whale Activity: Detects unusual volume spikes often associated with institutional entries.
Consolidation: Measures volatility contraction to predict expansion.
3. 🔵 Order Flow & Pressure Visualize the battle between buyers and sellers directly on the chart.
Green/Red Dots: Show real-time Buying or Selling pressure based on price-volume divergence.
Order Walls: Identifies potential liquidity zones where price might stall or reverse.
4. 💰 Advanced Risk Management Stop guessing your exits. QFP provides dynamic levels automatically:
Entry, Stop Loss, and 3 Take Profit Levels.
Methods: Choose between ATR-based (Volatility), Fibonacci-based, or a Hybrid calculation.
Win Probability: Shows the statistical probability of reaching the next target (DN1, DN2, DN3).
5. 📊 Professional Dashboard A sleek, non-intrusive panel displaying:
Current Trend & Strength.
HTF Status.
RSI, MACD, VWAP status.
Accumulation Score & Volume Health.
🛠️ HOW TO USE
Select your Mode:
Conservative: Best for beginners. Fewer signals, higher confirmation (Wait 30 bars).
Balanced: Standard approach for day trading.
Aggressive: For scalping and volatile markets.
Wait for a Signal:
Look for the "STRONG BUY" (Green Triangle) or "STRONG SELL" (Red Triangle) labels.
Check the Score on the label (e.g., Score: 75/60). Higher is better.
Confirm with Dashboard:
Ensure the "Trend" and "HTF" (Higher Timeframe) match the signal direction.
Look for "Healthy" volume.
Execute & Manage:
Enter the trade.
Place your Stop Loss at the suggested SL line.
Take partial profits at TP1 and TP2.
Move SL to Breakeven after TP1 is hit (the script suggests this visually).
⚙️ SETTINGS OVERVIEW
Market Type: Optimize calculations for Crypto, Forex, or Stocks (BIST).
Risk Level: Low, Medium, High (Adjusts the signal threshold score).
TP Method: Hybrid (Recommended) blends ATR and Fib levels for precision.
⚠️ DISCLAIMER
This tool is for educational and analytical purposes only. Trading involves significant risk. Always perform your own due diligence and never trade with money you cannot afford to lose

Ryan Bot Signals ProRyan EMA Trend Screener Pro — Smart Auto Signals + TP/SL Engine + MTF Dashboard
Ryan EMA Trend Screener Pro is an advanced trading system that combines
✔ EMA Ribbon Trend Confirmation
✔ Auto BUY/SELL Signals
✔ ATR-based TP & SL engine
✔ Multi-Timeframe Trend Dashboard
✔ Real-Time Screener
into one clean, powerful tool.
Key Features
🔹 Smart EMA Crossover Signals
Automatically detects momentum shifts using fast vs slow EMA cloud.
🔹 Auto TP/SL System
– Up to 4 Take-Profit levels
– ATR-based dynamic Stop Loss
– Entry, SL & TP lines with labels
– Trade zones highlighted using boxes
🔹 MTF Trend Dashboard
Trend status from 5m, 15m, 30m, 1h, Daily
Shows combined trend strength (Bullish / Bearish).
🔹 Built-in Screener
Scan multiple symbols directly on your chart.
Displays trend direction & recent signals.
🔹 Fully Customizable
Modify EMA lengths, ATR settings, TP count, dashboard position & screener layout.
How to Use
Follow BUY/SELL labels created by EMA2/EMA8 crossover.
Use TP/SL lines to plan exits.
Check dashboard to confirm higher-timeframe trend.
Optional: add your favourite chart structure (S/R, Fibs, Liquidity).
Disclaimer
This tool does not guarantee profits. Use proper risk management.

[MTX] Weekly Support & Resistance Weekly Support & Resistance
Overview
Discover key market structure with this all-in-one indicator:
Weekly Support & Resistance (SR) levels , Fair Value Gap (FVG) detection , and Automatic Fibonacci retracements .
Designed for MTX traders, it plots non-repainting weekly highs/lows/opens/closes, highlights unmitigated FVGs for potential imbalances, and auto-draws Fib levels, Perfect for swing/day traders on XAUUSD.
🚀 Key Features
- Weekly SR Levels : Plots previous week's High (resistance), Low (support), Open, and Close. Optional historical levels (Week -2/-3).
- SR Zones : Customizable % zones around levels for dynamic support/resistance bands. Fill colors for easy visualization.
- FVG Detection : Identifies bullish (green) and bearish (red) Fair Value Gaps on your chart timeframe.
- buy/sell Signals :
- Trend Filter : Optional EMA/SMA to filter signals
- Auto Fibonacci : auto-retracement with 20+ levels (0%, 23.6%, 38.2%, 50%, 61.8%, 100%, extensions to 423.6%, negatives). Custom colors, labels, and background fills.
- Alerts: Built-in for FVG creation/mitigation + all buy/sell signals. Set up once for real-time notifications.
⚠️ Important Disclaimer
This indicator is for educational and analysis purposes only. It provides visual tools and signals based on historical price action— not financial advice. Past performance ≠ future results. Trading involves risk; use proper risk management. Backtest thoroughly. No guarantees of profitability. Consult a financial advisor.
#tradingview #smc #MTX #fvg #fibonacci #supportresistance

Opening Range Gap Fib + StdDevMeasures high and low of midnight, am, and pm opening range gaps. Gives standard deviation projections above and below that range, with custom settings.
***CURRENTLY AN ERROR WITH USING MORE THAN THE CURRENT DAY, IS PLOTTING 24 HOURS FROM WHEN THE RANGE WAS CREATED. FOR EXAMPLE: MIDNIGHT WILL CARRY INTO MIDNIGHT THE NEXT DAY, AM WILL CARRY INTO AM THE NEXT DAY.***
Will have a fix for that soon, but for now leave it on ONE DAY historical lookback so you're only using it for the current day.

BTC Energy + HR + Longs + M2
BTC Energy Ratio + Hashrate + Longs + M2
The #1 Bitcoin Macro Weapon on TradingView 🚀🔥
If you’re tired of getting chopped by fakeouts, ETF noise, and Twitter hopium — this is the one chart that finally puts you on the right side of every major move.
What you’re looking at:
Orange line → Bitcoin priced in real-world mining energy (Oil × Gas + Uranium × Coal) × 1000
→ The true fundamental floor of BTC
Blue line → Scaled hashrate trend (miner strength & capex lag)
Green line → Bitfinex longs EMA (leveraged bull sentiment)
Purple line → Global M2 money supply (US+EU+CN+JP) with 10-week lead (the liquidity wave BTC rides)
Why this indicator prints money:
Most tools react to price.
This one predicts where price is going based on energy, miners, leverage, and liquidity — the only four things that actually drive Bitcoin long-term.
It has nailed:
2022 bottom at ~924 📉
2024 breakout above 12,336 🚀
2025 top at 17,280 🏔️
And right now it’s flashing generational accumulation at ~11,500 (Nov 2025)
13 permanent levels with right-side labels — no guessing what anything means:
20,000 → 2021 Bull ATH
17,280 → 2025 ATH
15,000 → 2024 High Resist
14,000 → Overvalued Zone
13,000 → 2024 Breakout
12,336 → Bull/Bear Line (the most important level)
12,000 → 2024 Volume POC
10,930 → Key Support 2024
9,800 → Strong Buy Fib
8,000 → Deep Support 2023
6,000 → 2021 Mid-Cycle
4,500 → 2023 Accum Low
924 → 2022 Bear Low
Live dashboard tells you exactly what to do — no thinking required:
Current ratio (updates live)
Hashrate + 24H %
Longs trend
Risk Mode → Orange vs Hashrate (RISK ON / RISK OFF)
180-day correlation
RSI
13-tier Zone + SIGNAL (STRONG BUY / ACCUMULATE / HOLD / DISTRIBUTE / EXTREME SELL)
Dead-simple rules that actually work:
Weekly timeframe = cleanest view
Blue peaking + orange holding support → miner pain = next leg up
Green spiking + orange failing → overcrowded longs = trim
Purple rising → liquidity coming in = ride the wave
Risk Mode = RISK OFF → price is cheap vs miners → buy
Set these 3 alerts and walk away:
Ratio > 12,336 → Bull confirmed → add
Ratio > 14,000 → Start scaling out
Ratio < 9,800 → Generational buy → back up the truck
No repainting • Fully open-source • Forced daily data • Works on any TF
Energy is the only real backing Bitcoin has.
Hashrate lag is the best leading indicator.
Longs show greed.
M2 is the tide.
This chart combines all four — and right now it’s screaming ACCUMULATE.
Load it. Trust it.
Stop trading hope. Start trading reality.
DYOR • NFA • For entertainment purposes only 😎
#bitcoin #macro #energy #hashrate #m2 #cycle #riskon #riskoff

WeeklyDealingRange Pro+ (Fib Edition)Weekly Dealing Range Indicator
Overview
The Weekly Dealing Range indicator identifies range + volatility based pivot levels that form at the close of the first trading session and extend for the entire week. This tool provides key reference points for both trending and range-bound market conditions.
What It Provides
Range High & Low: Weekly session extremes
Median Level: Mid-point of the weekly range
Weekly Open: First session opening price
Fibonacci Extensions: Calculated levels above the high and below the low
Practical Application
These levels serve as:
Reversal zones for mean reversion setups
Support/resistance reference points
Target levels for existing positions
Framework for building trade ideas around high-probability pivot areas
Key Features
Optional function based alerts
Traditional price crosses level alerts
Automatically updates each week
Clean, uncluttered chart display
Works across all timeframes
Suitable for all markets and instruments

Friendly IT Algo SystemFriendly IT Algo System
Hello, this is the YouTube channel 'Friendly IT'.
This indicator is an All-in-One tool designed to help beginners easily identify trends and entry points by automating complex chart analysis.
It goes beyond simple moving average crosses by analyzing Volume (Whale Activity), Divergence, and Support/Resistance to display highly reliable signals.
The most significant feature of this indicator is that it clearly displays the specific Long and Short entry prices directly on the chart. This allows traders to know exactly at what price to enter the market without confusion.
Users can freely adjust all setting values, such as EMA lengths and volume multipliers, to optimize the strategy for the specific stock or cryptocurrency they are trading.
1. Whale Volume Hunter
- Displays fluorescent candles and entry prices only when volume exceeds 1.5x the average.
- Filters out fake signals and captures genuine trends driven by institutional activity.
2. Smart Order Block
- Green Box: High probability support zone (Buy area).
- Red Box: High probability resistance zone (Sell area).
- Automatically draws boxes to help set price targets and stop-loss levels.
3. Divergence Lines
- Bullish Divergence (Green Line): Price makes a lower low, but the indicator makes a higher low (Reversal signal).
- Bearish Divergence (Red Line): Price makes a higher high, but the indicator makes a lower high (Drop signal).
- Visually connects highs and lows with lines for intuitive reading.
4. Auto Fibonacci
- Automatically plots the key reversal levels: 0.618 (Bold White Line) and 0.5.
5. Noise Filter (Sideways Market)
- Uses the ADX indicator to highlight choppy, sideways markets with a Gray Background.
- It is recommended to avoid trading during these periods to prevent losses.
1. Entry
- LONG: Consider buying when a Green Neon Candle appears with a price number at the bottom.
- SHORT: Consider selling when a Pink Neon Candle appears with a price number at the top.
2. Exit
- Take partial profits at Order Blocks (Colored Boxes).
- Take profit when price touches the White Bold Line (Fib 0.618).
- React immediately if an opposing Divergence Line appears.
3. Note
- Reliability is low during Gray Backgrounds (Sideways market); avoid entering trades.
Friendly IT Algo System
안녕하세요, 유튜브 채널 '친절한 아이티'입니다.
이 지표는 복잡한 차트 분석을 자동화하여 초보자도 쉽게 추세와 타점을 잡을 수 있도록 설계된 올인원(All-in-One) 보조지표입니다.
단순한 이동평균선 크로스가 아니라, 거래량(세력 개입), 다이버전스, 매물대를 복합적으로 분석하여 신뢰도 높은 신호만 표시합니다.
이 지표의 가장 큰 장점은 차트에 롱(Long)과 숏(Short)의 진입 가격을 숫자로 명확하게 표시해 준다는 것입니다. 덕분에 사용자는 헷갈리지 않고 정확한 가격에 진입 타점을 잡을 수 있습니다.
이동평균선(EMA) 길이를 비롯한 모든 설정값은 본인이 거래하는 주식이나 코인의 특성에 맞게 자유롭게 변경하여 최적화할 수 있습니다.
1. 세력 거래량 감지 (Whale Volume Hunter)
- 평균 거래량의 1.5배 이상이 터질 때만 형광색 캔들과 진입 가격을 표시합니다.
- 속임수 신호를 걸러내고 세력이 개입한 진짜 추세만 포착합니다.
2. 스마트 오더블락 (Smart Order Block)
- 초록색 박스: 가격이 지지받을 확률이 높은 매수 구간
- 빨간색 박스: 가격이 저항받을 확률이 높은 매도 구간
- 차트에 자동으로 박스를 그려주어 목표가 및 손절 라인 설정에 도움을 줍니다.
3. 다이버전스 라인 (Divergence Lines)
- 상승 다이버전스 (초록선): 가격은 하락했으나 지표가 상승할 때 (반등 신호)
- 하락 다이버전스 (빨간선): 가격은 상승했으나 지표가 하락할 때 (하락 신호)
- 꼬리와 꼬리를 잇는 선으로 직관적으로 표시됩니다.
4. 자동 피보나치 (Auto Fibonacci)
- 반등의 핵심 구간인 0.618(흰색 굵은 선)과 0.5 구간을 자동으로 작도합니다.
5. 횡보장 필터 (Noise Filter)
- ADX 지표를 활용해 추세가 없는 지루한 횡보장은 회색 배경으로 표시합니다.
- 이때는 매매를 쉬면서 손실을 방지할 수 있습니다.
1. 진입 (Entry)
- LONG: 초록색 형광 캔들과 함께 하단에 가격(숫자)이 뜨면 매수 고려
- SHORT: 핑크색 형광 캔들과 함께 상단에 가격(숫자)이 뜨면 매도 고려
2. 청산 (Exit)
- 오더블락(색깔 박스)에 도달했을 때 분할 익절
- 하얀색 굵은 선(피보나치 0.618)에 닿았을 때 익절
- 반대 방향의 다이버전스 선이 생기면 즉시 대응
3. 주의사항
- 회색 배경(횡보장)에서는 신뢰도가 낮으니 진입을 자제하세요.

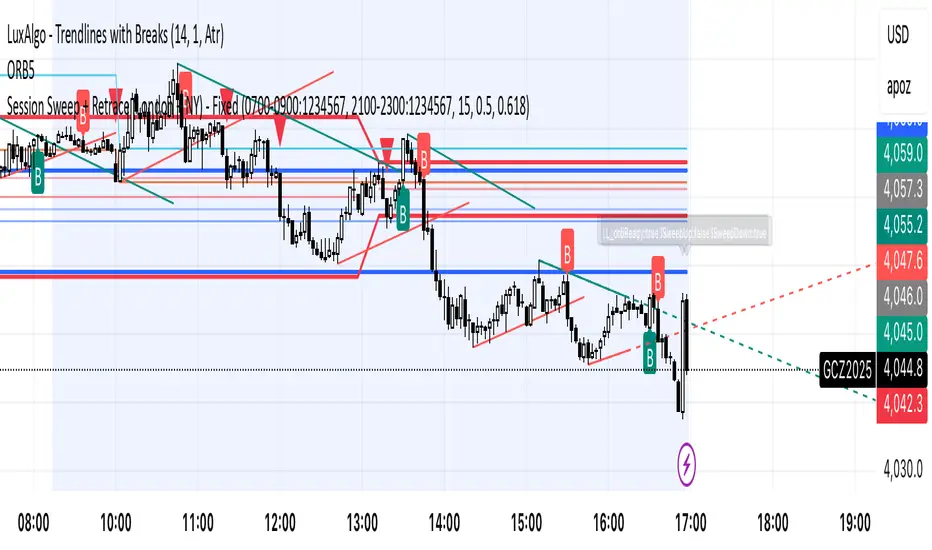
Session Sweep + Retrace (London + NY) - FixedORB Strategy with confluence. This sets out the 5 min session sweep from London and NY, and highlights a test back into the order zone with fib retracement.
Multi-Timeframe Pivot SystemMulti-Timeframe Pivot Point System
A comprehensive pivot point indicator that displays support and resistance levels across multiple timeframes simultaneously.
Key Features:
• Adaptive Latest Pivot - Automatically calculates pivots from the most recent completed candle based on your current chart timeframe (works on any timeframe from 1-minute to monthly)
• Multi-Timeframe - Customizable historical lookback (choose how many days/weeks/months back to display)
• Pivot Formula - Uses the standard pivot point calculation method:
- Pivot Point (PP) = (High + Low + Close) / 3
- R1/S1 = 2 × PP - Low/High
- R2/S2 = PP ± (High - Low)
• Visual Design - Lines extend to the right with clearly labeled price levels that automatically stagger to prevent overlap
• Fully Customizable - Choose colours, line styles, and line widths for each timeframe group
Upcoming: Fibs pivots.
