Pivot Points (Channel | Fib | Support/Resistances)auto pivot point channel, channel fibonacci and support/resistance lines
Cerca negli script per "fib"

Commercial Algo Trend © Fzn V1Hello Traders,
Here i bring to you my 2nd Price Action Atr based Indictor combined with fib entry and exit trailing levels with minimum risk and maximum profit , as we must have seen at times as we enter the trend reverse and hits our stop losses . Keeping that in mind as i too struggled and made losses so i decided and focused more on minimizing the stop loss and only on confirmation of Long or Short trade is been initiated with proper Stop loss as explained in the images below , why should we give market our money ;) as we are here to make money :D .. There is no holy grail as Stop loss wont be hit but yes it will be way less and all alerts are based on candle close . One can use this on any chart and any timeframe and its very good for scalping too .ATR Trailing SL is added too just incase you want to enter and exit trend manually . Better results are on 15m and above . Hope you guys will like it and comment if you have any doubts..
-----------------
Disclaimer
Copyright by FaizanNawazz.
The information contained in my scripts/indicators/strategies/ideas does not constitute financial advice or a solicitation to buy or sell any securities of any type. I will not accept liability for any loss or damage, including without limitation any loss of profit, which may arise directly or indirectly from the use of or reliance on such information.
All investments involve risk, and the past performance of a security, industry, sector, market, financial product, trading strategy, or individual’s trading does not guarantee future results or returns. Investors are fully responsible for any investment decisions they make. Such decisions should be based solely on an evaluation of their financial circumstances, investment objectives, risk tolerance, and liquidity needs.
My scripts/indicators are only for educational purposes!
Happy Trading!
Trend Friend - Swing Trade & Scalp Signals - Stocks Crypto ForexTREND FRIEND is a custom built, data driven algorithm that gives buy and sell signals when many different factors line up together on a single candle. It is designed to catch every move so you can expect early entries and exits across all of your favorite markets. Use scalp mode for early entries with lots of signals or swing mode for longer swings with fewer signals and long swing mode for really long swing trades with even less signals.
The best markets to use this indicator on are high volume tickers with a lot of price action as these markets have enough data to use to give the signals the algo needs to be able to detect highly probable moves in price. That being said, it works across all markets such as stocks, crypto, forex and futures and across all timeframes(on really long timeframes it may not give signals due to not having enough data to work with).
***MAJOR POINTS TO REMEMBER BEFORE USING THIS INDICATOR***
The algo is designed to catch major moves, so if a signal seems to come in late, it is highly likely the market is about to reverse so use caution when taking signals that seem late. This typically happens because the market is indecisive so always be careful in these situations and just wait for a better signal when markets are really decisive.
Always trade in the direction of the trend meaning the volume weighted moving average clouds. There is also a trend detection label and risk level label that you should follow to keep your trades as safe as possible. The safest way to do this is only trade short when the VWMA 100 is below the VWMA 500 and a Bear signal comes in very close to a VWMA line. Only trade long when the VWMA 100 is above the VWMA 500 and a Bull signal comes in very close to a VWMA line.
If price is between the moving averages, play the VWMA 100 and VWMA 500 as support and resistance and only take signals near one of the VWMAs with the plan of price returning to the other VWMA. If you are taking trades against the trend, like trying to buy the dips or sell the tops, wait for price to cross the VWMA 100 before following a signal.
If the VWMA 100 and VWMA 500 are close to each other and/or moving sideways, you can expect choppy price action and consolidation so use caution when taking trades during this time. It is better to wait for the price to hold above or below both VWMAs and stay supportive there before taking trades. Waiting for volume to increase is also a good way to avoid chop after the trend decides a direction.
This indicator will repaint sometimes before the candle has closed, so either wait for the candle to close with a signal before entering trades or only take signals before it closes on candles with good volume and technical analysis backing it.
***ALL THE FEATURES YOU NEED***
Trend Friend has multiple features designed to help you trade better and make decisions faster.
Buy & Sell Signals - When the algo detects all of our required parameters lining up on a single candle, Trend Friend will give Bull or Bear signals on the chart. Bull means upward price action is expected. Bear means downward price action is expected.
Take Profit Signals - When the price action makes a move that typically signals a reversal, a take profit signal will show up on the chart to help you get out of a trade before the next signal comes in.
Risk Levels For Signals
There is a risk detection system that tells you how risky each signal is as it comes in to help you stay out of dangerous trades. Wait for signals with low risk and you’ll be much safer than trying to take trades against the trend.
Alerts - There are options for alerts on buy signals, sell signals, take profit signals, price crossing the VWMA 100 and price crossing the VWMA 500. All of these can be controlled using tradingview alerts so you don't have to watch the charts and wait for things to happen. These alerts can also be used to send orders to trading bots if you choose.
Candles Painted Green Or Red According To Buy & Sell Pressure - By default, this indicator paints the candle sticks green, red or blue according to buy & sell pressure(DMI). You will need to turn off candle colors in your chart settings for this to appear correctly.
Percentage Updates - The table on the right has live percentage updates so you don’t have to measure out every move you are expecting. It will tell you the percentage from closest fibonacci levels, percentage away from the VWAP, percent gain or loss from the last signal entry and percentages from your own trades that can be configured in the settings. These help you always know how much more you can squeeze out of a trade and where your position stands without having to switch screens between Tradingview and your broker constantly.
Moving Average & VWAP Clouds - We included two color coded volume weighted moving averages(VWMA 100 and VWMA 500) and a color coded RMA 10 moving average. We also have a VWAP dotted line and cloud so you can easily see the trend direction on the chart at all times. The cloud and moving averages will turn green or red in real time depending on whether price is above or below each moving average or the VWAP respectively.
Trend Detection Label - The top label on the percentage update table tells you if the trend for this timeframe is Bullish or Bearish as well as when the trend is undecisive with choppy price action expected.
Chop & Low Volume Warning Labels - When price action is choppy or there is very low volume compared to historic candles, a warning label will appear at the top of the screen so you know to use caution and stay out of trades during these times.
Auto Fibonacci Levels - The chart will automatically populate fibonacci retracement and extension levels. The percentage update table will also give you real time updates on how far away the next fibonacci levels are from the current price.
Bounce Zone - We also included a very long term moving average cloud(EMA 1000 and EMA 2000) that shows as purple on the chart. When price enters that cloud, you can expect a reversal in that area. If price was trending above the cloud, expect that cloud to act as support. If price was trending below the cloud, expect that cloud to act as resistance. When price is trying to break through that cloud in either direction you can expect price action to be choppy and big moves to happen once price gets supportive in that zone and breaks out.
Margin Multiplier - If you are using margin to trade, our margin multiplier will multiply all of the percentage updates by the margin level you input in the settings tab so your percentages will reflect the percentages in your account.
***HOW TO USE***
Scalp, Swing And Long Swing Mode
You can choose from scalp mode, swing mode or long swing mode in the indicator settings. It is set to scalp mode by default. Scalpers will want to use the scalp mode as it provides early entries and exits and is designed to catch every move quickly. Swing mode is designed to catch almost every move and filter out some of the noise so it will have less signals than scalp mode. Long swing mode is designed to catch those lengthy moves and will hold positions the longest but give entries later than the other modes.
Try all three on a few charts and timeframes to see which setting matches your trading style the best. If you want more signals with any of the 3 modes, go to a lower timeframe. If you want less signals on any mode, go to a higher timeframe.
Bull & Bear Signals - When all of our algo parameters line up, a BULL or BEAR label will print on the chart. Bull labels will be colored green and bear labels will be colored red. Bull indicates a good place to enter a long trade because the algo is detecting patterns that indicate price should move upwards. Bear indicates a good place to enter a short trade because the algo is detecting patterns that indicate price should move downwards.
For best results using these signals, take trade signals that line up very closely with fibonacci levels or volume weighted moving averages or the vwap or any combination of them. It is also recommended to only take trades in the direction of the trend to avoid trading false reversals. Wait for low risk signals using our risk identifier and then enter the market. Waiting for good volume to come in will also help you avoid chop and catch those quick moves.
Also, make sure to check the percentage updates table to see if the expected move to the next fibonacci level is far enough away to make the risk to reward ratio worth taking the trade. Watch for signals when the VWMAs squeeze together after a wide gap and price breaks out with a corresponding signal as these can bring large, quick moves in price. Use caution when the VWMAs are close to each other and trending sideways as this usually brings choppy price action.
(The bull and bear signals can be turned on or off in the indicator settings input tab. Useful if you want to clean up the chart or only show bear or bull signals according to the trend.)
Take profit Signals - Take profit labels will show up on the chart when a reversal candle pattern or reversal indicator pattern is detected while a trade is still open. Use these signals as times that it may be a good point to exit the trade to avoid losses or reduced profits.
(The take profit signals can be turned on or off in the indicator settings input tab.)
Risk Level Label
Taking trades against the trend is dangerous because there are more false bottoms than there are actual bottoms. Our risk detection label is there to keep you from taking dangerous trades against the trend. The label will say Low Risk when the trend is in the same direction as the last signal given. The label will say Medium Risk when the trend is neutral because price likes to chop around during these times. The label will say High Risk when the trend is in the opposite direction as the last signal given.
Make sure you wait for the risk level detector to show Low Risk before taking trades or you may be buying a false bottom.
Candles Colored According To Buy & Sell Pressure - By default this indicator will paint the candlesticks green, red or blue depending on the buy & sell pressure for those candles using the Directional Movement Index or DMI. If buy pressure is higher than sell pressure, it will paint green. If Sell pressure is higher than buy pressure, it will paint red. If buy pressure is equal to sell pressure, it will paint blue. Use this to confirm which direction buying and selling is favoring and use a change in color trend to determine reversal points early. For this to work correctly you will need to go into chart settings(gear icon top right) and in the symbol tab turn off body, wicks and border.
(The buy & sell pressure candle coloring can be turned on or off in the indicator settings input tab.)
Auto Fibonacci - This indicator will automatically populate fibonacci retracement and extension levels for you. These levels are calculated using the previous high and low. You can switch the source between the previous day, week, month, quarter and year(the weekly setting is the default as it is great for day trading). The previous high and low levels will show as white(These are very important levels so watch for price to bounce off of the white lines). The percentage update table will also show the percentage gap from the current price and the next closest fibonacci level above and below, with labels telling you which fib levels they are.
(The fibonacci levels can be turned on or off in the indicator settings input tab.)
Volume Weighted Moving Averages With Clouds - The red or green moving averages should be treated as dynamic support and resistance as well as a visual way of telling current price trends. You can expect price to bounce off of these moving averages very often and quick moves usually happen when price breaks out of these moving averages.
The safest long trades you can take will be when the VWMA 100 is above the VWMA 500 and you get a BULL signal that is very close to the VWMA 100 or VWMA 500. The safest short trades you can take will be when the VWMA 100 is below the VWMA 500 and you get a BEAR signal that is very close to the VWMA 100 or VWMA 500.
When the moving averages squeeze together and price bounces between them, you can expect big moves in price when it breaks out. If price has been trending up and the moving averages squeeze together, expect the price to fall quickly once it breaks down from there. If price has been trending down and the moving averages squeeze together, expect the price to jump quickly once it breaks out from there.
These moving averages and the clouds associated with them will paint green when price is above them, indicating a bullish trend and they will change to red when price is below the moving averages, indicating a bearish trend.
You can also use the moving averages as support and resistance levels when markets are moving sideways. Since these are volume weighted moving averages, price tends to stick to them very well and paints a much clearer picture of what is going to happen than regular moving averages that don't take volume into account. Try it on a bunch of different timeframes and charts to see for yourself.
(The moving averages and clouds can be turned on or off in the indicator settings input tab.)
Bounce Zone - The bounce zone is a purple cloud that is made up of two very long term moving averages. When price is trending above this cloud and comes back down to it, you can expect the price to bounce back upwards in this zone. If the price is trending below this cloud and comes up to it, you can expect the price to bounce back downwards when it reaches this zone.
Sometimes price will break through this cloud and you will usually notice a lot of choppy price action and accumulation in this zone. When price does break out of it, you can expect fast, large moves. I also like to call this zone the safe zone because taking trades in this zone is typically a very safe place to enter trades depending on how the price is trending before it entered this zone. If you look at the cloud on any of your favorite charts, you will see that the cloud usually represents support and resistance areas quite well.
(The bounce zone can be turned on or off in the indicator settings input tab.)
Chop & Low Volume Warnings - When price is choppy, it can be a portfolio killer. When volume is low, it can give false signals or the market can reverse easily, so stay out of trades when these warning labels appear on your chart. If you were already in a trade when these warnings appear, keep a close eye on your trades and be ready to exit if things start to go the wrong way.
Long & Short Entry Calculator - Here you can enter your own entry price for short or long positions so that your actual P&L will be shown live on your chart. This eliminates the need to calculate percentages in your head or switch screens to your broker often or use the measuring tool to calculate your P&L. These will show as zero until a trade price is entered.
Margin Multiplier - If you use margin to trade, enter your margin multiplier in this input and all of the percentages in the percentage update table will reflect how far each level is based on your margin. So a 5x margin will multiply all percentages in the chart by 5 and so on. This way you don’t have to calculate everything in your head or switch between your chart and your broker constantly.
Customization - Go into the indicator settings and you can customize just about everything to suit your style. In the Input tab you can: turn the Bull or Bear labels off or on so you only get the signals that are going in the direction of the trend, turn on or off the moving average lines & clouds, turn on or off the vwap & clouds, set your fibonacci timeframe or turn them off completely and set your long or short entry price as well as your margin level for percentage updates according to your portfolio.
You can also easily customize: the moving average lines & clouds, the bounce zone lines and cloud, the vwap color and line style, the support and resistance line colors and thickness, the bull and bear label styles, the take profit label styles and more.
***MARKETS***
This indicator can be used as a signal on all markets, including stocks, crypto, futures and forex as long as Tradingview has enough data to support the calculations needed by the algo.
***TIMEFRAMES***
Trend Friend can be used on all timeframes.
***IMPORTANT NOTES***
For the buy & sell pressure colored candles to show up properly you will need to go to the chart settings(gear icon in top right corner) and in the symbol tab turn off body, wicks and border.
No indicator can be right 100% of the time and remember that past results do not guarantee future performance. You still need to make smart decisions when using this indicator to be successful. It is also important to note that markets with little volume and price action may not give very good signals due to many different parameters needing to line up on one candle for a signal to be given so use it on high volume tickers with lots of price action for best results.
***TIPS***
Try using numerous indicators of ours on your chart so you can instantly see the bullish or bearish trend of multiple indicators in real time without having to analyze the data. Some of our favorites are our Volume Spikes, Directional Movement Index + Fisher, Volume Profile with DMI, and MOM + MFI + RSI with Trend Friend. They all have real time Bullish and Bearish labels as well so you can immediately understand each indicator's trend.

FIBIShows Fibonacci waves for a long range and Fibonacci lines for a short range.
For me it helps to identify key levels or confluence on the macro and micro range.
In the example above you can clearly see that the macro waves are in a down-trend while the micro lines are in a up-trend..
Also the price has been rejected at the 78.6 fib mirco line but found support on the 78.6 macro wave.
these situations are hard to find with the default retracement tools
Artharjan Relative StrengthHi Guys,
I have created Artharjan Relative Strength indicator which shows the comparison of a Stock (script) either with Benchmark Index or with its respective sectoral index.
If the Relative Strength value is more than Zero (Above Zero Line) then it means the Stock is outperforming the index and vise-a-versa
A moving average is also added to smooth out data series.
Traders can chose from the Benchmark/Sectoral indices as well as Moving Average Lookback period and moving average type for extra convenience.
If the Relative Strength is strong then trader can look forward to taking bullish trade and Investor can think of investing in that particular script for a long term period (Or as long as Relative Strength line does not cross below zero line)
The Default Lookback period selected is 55 (Fib number) as it covers considerable /sufficient amount of range to find out relative strength of the stock.
The Relative Strength depends on the timeframe you chose... so feel free to adjust the Lookback period from 55 to any other number depending upon your trading/investment timeframe.
Hope you guys would find this indicator useful.
Regards
Rahul Desai
@Artharjan

RSI Swing Trading Setup (2-Period)A simple script that adjusts the RSI visibly in order to better accommodate swing trading and certain swing trading setups/strategies.
--------------------------------------------------------------------------------------------------------------------------------------------------------
Best used in conjunction with "Linear Regression Channel by LonesomeTheBlue" with 2.2σ (std.dev) and Show Fib Levels.
^Click image for a redirect to that script.
--------------------------------------------------------------------------------------------------------------------------------------------------------
In certain price action patterns:
A bearish reversal from a previously bullish move can indicate tops of a rally if the RSI moves from 0-40 to 60 (1)
A bullish reversal from a previously bearish move can indicate bottoms of a pullback if the RSI moves from 60-100 to 40 (2)
(USE THE LINEAR REGRESSION CHANNEL TO VALIDIFY THE RETRACEMENTS)
--------------------------------------------------------------------------------------------------------------------------------------------------------
(1)
--------------------------------------------------------------------------------------------------------------------------------------------------------
(2)
--------------------------------------------------------------------------------------------------------------------------------------------------------

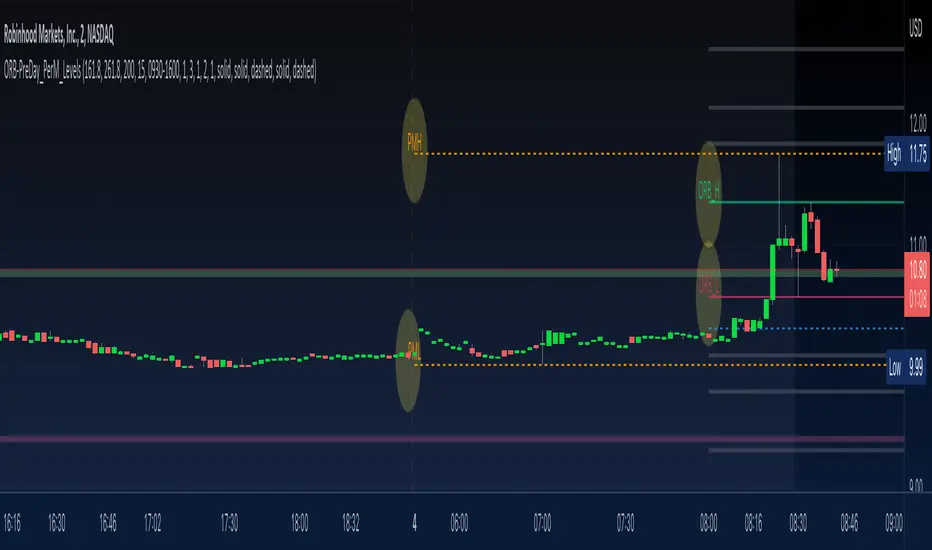
ORB-PreDay_PerM_LevelsThis script provides following levels:
1. ORB Level - You can adjust the timeframe of Opening Range (plots from 9am to 4pm)
2. ORB Fib Extension - 1.618 and 2.618 Fibonacci Extension of ORB High and Low (plots from 9am to 4pm)
3. Previous Day High/Low/Close - You can adjust color/thickness of the lines (plots from two days ago so that you can clearly see the levels)
4. Previous Two Days High/Low (plots from two days ago so that you can clearly see the levels)
5. Pre-Market High/Low (plots from 6:30am to 11am)
All in one indicator gives much better clarity of where current instrument is trading in relation to ORB, Previous Day Levels and Previous Two Days Levels along with Pre Market Levels.
You could combine these levels with your favorite EMA or EMA Cloud to create a trading system.
You could combine these levels with MA Cloud and ATR vs DTR script to gauge the move.
Look at the TWTR Chart today and see how these levels are respected.
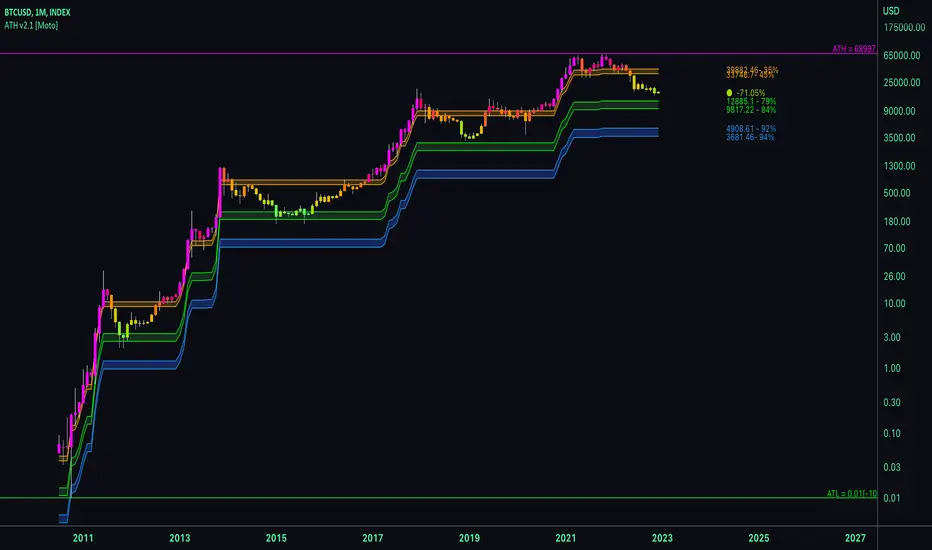
ATH [Moto]Hello traders,
This script attempts to inform trading decisions/sentiment via drawdown (percent) from all time high. Any fan of fibonacci should find this useful.
All time high is essentially checked and the script adapts to new/broken all time highs. The plot shapes and signals are based on the candle closes below these common percents from all time high. Use the signals at your own discretion.
Lines and styling are placed at the further extremes of the common % candles. For example, for "Tops", when candles cross under 5% from all time high, and line is made at the candles high, and conversely when a candle crosses above 50% from it's previous all time high a line is placed at its low.
Bar coloring, the % being crossed, and extreme background color are included, as are alerts for each signal.
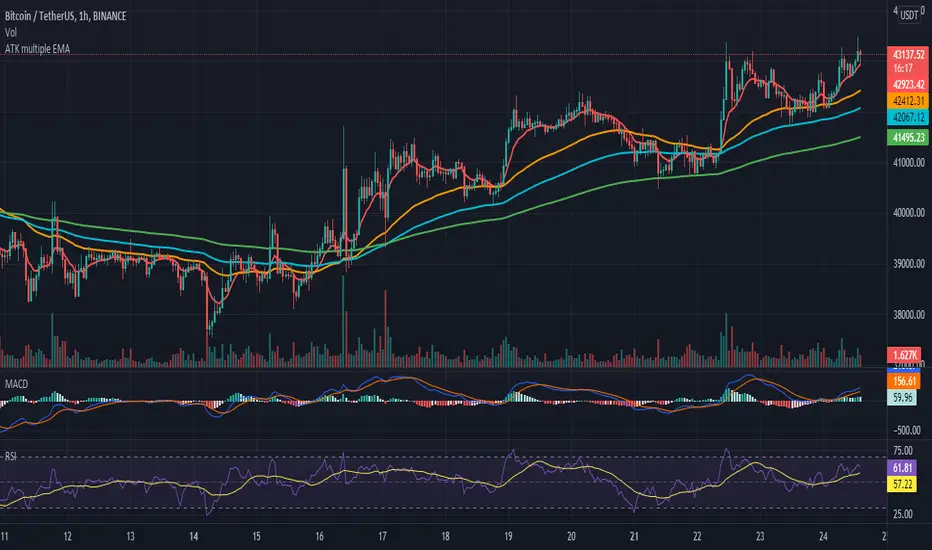
ATK multiple EMA This indicator Have EMA 9/50/99/200 . You can edit number and I add parabolic SAR And Auto Fib Retracement. if don't want to use you can close
TWS Pivot Points FibsPivot Points with Fibonacci
Day, Week, Month. Year Time Frames
0% to 200%
What is a Pivot Point?
A pivot point is a technical analysis indicator, or calculations, used to determine the overall trend of the market over different time frames. The pivot point itself is simply the average of the high, low and closing prices from the previous trading day. On the subsequent day, trading above the pivot point is thought to indicate ongoing bullish sentiment, while trading below the pivot point indicates bearish sentiment.
The pivot point is the basis for the indicator, but it also includes other support and resistance levels that are projected based on the pivot point calculation. All these levels help traders see where the price could experience support or resistance. Similarly, if the price moves through these levels it lets the trader know the price is trending in that direction.
When the price of an asset is trading above the pivot point , it indicates the day is bullish or positive.
When the price of an asset is trading below the pivot point , it indicates the day is bearish or negative.
The indicator typically includes four additional levels: S1, S2, R1, and R2. These stand for support one and two, and resistance one and two.
Support and resistance one and two may cause reversals, but they may also be used to confirm the trend. For example, if the price is falling and moves below S1, it helps confirm the downtrend and indicate a possible continuation to S2.
All levels are based on Fibonacci
FuzzyInxAuto Fib Extension is a tool that calculates target price levels following a retracement. Extension levels also indicate potential price reversal areas and show possible price levels after a retracement is completed. These levels are based on the key Fibonacci coefficients and the price movement of the symbol on the chart.

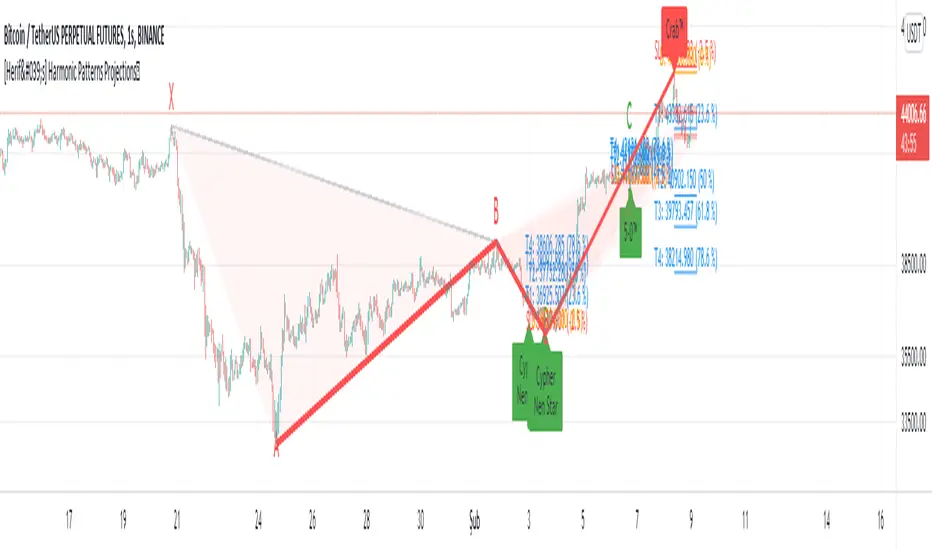
[Herif's] Harmonic Patterns ProjectionBullish and bearish 5-point patterns are based on various Fibonacci retracement levels and signify potential reversal zones (PRZ).
As they become 0%-80% complete, the dashed-line pattern will appear, displaying the PRZ and giving you time to prepare for a reversal.
Different combinations of specific fib retracements and extensions result in different patterns, and each is named for identification.
Bullish patterns signify a potential turn to the upside are colored green.
Bearish patterns signify a potential turn to the downside are colored red.
1- Live harmonic patterns which are still in trade with XABCD and ratio with labels.
2- Entry, Stop and Target levels on chart for all patterns.
in Settings:
Error Percent - This is error tollerance for matching pattern ratios. Cannot expect price ratios to be exactly as per books. Hence, adding few error tolerance will help identify patterns better. In this indicator defatult 1%
When there are multiple patterns on chart, Entry, Stop, and Target labels and lines are created with specific distance from each other to provide clarity to the users.
Trailing and Targets
1-Trailing Start Stage - Defines when to start trailing stop-loss. It is recommended to set this value to either Target 1 or Target 2. Disabling the trailing or setting too far away may lead to being in trade on ranging market for too long. This may also result in drawing errors related to distance from current bar.
2- Custom Target Levels - Target and stop levels are set to optimal values based on individual patterns. If you want to override these levels, use the available input option to override targets and chose your custom Target1, Target2, Target3 and Target4
All Pending Patterns you can enable or disable
Classic Patterns : Gartley , Bat, Butterfly , Crab , Deep Crab , Cypher , Shark , Nenstar
Anti Patterns: Anti Nenstar, Anti Shark , Anti Cypher , Anti Crab , Anti Butterfly , Anti Bat, Anti Gartley , Navarro 200
Pending Patterns example here
Fibonacci Muti-MA RibbonWelcome some, welcome small.... This is CryptoFilio, your dark knight in the crypto light - shining down my infinite wisdom upon this wasteland we call the "markets". It's me and you against the machine... so rage, rage, rage against the dying of the night!
DESCRIPTION
This indicator exemplifies the beauty of the sacred Fibonacci sequence.... used by flowers and seashells and the intrepid day trader. Each color in the ribbon represents an MA of a specific FIB lookback period. This naturally makes the ribbon front weighted, giving recent price action greater importance than older price action. The undulating curls of the ribbon allow a trader to see key convergences and divergences. The ribbon often narrows before a major price movement.
The background is lightly colored to indicate when one average of MA's crosses the other average (1+2+3+4+5) crosses (6+7+8+9+10). Like a standard MA cross, but a little more sophisticated.
The most visually pleasing is SMMA-RMA, but the more effective in anticipating the market is EMA and HMA.
USAGE
Visualizing convergence and divergence as the ribbon widens with sudden price movement and narrows during consolidation
Visualizing general trends as the flipping over of the ribbon represents a general trend change
Setting possible entry and exit points through the width and direction of the ribbon
VARIATIONS
You can select many types of MA's, such as SMA,EMA,HMA,VWMA... and a couple of others. The most effective seem to be EMA,HMA, and VWMA
SUGGESTIONS
Let me know if you'd like some other features added to this indicator, such as additional MA's or something else. I can also customize it for a specific application.
[UPRIGHT Trading] Top & Bottom Finder [Premium]Hello Traders,
Today I'm releasing an updated version of my previous Top & Bottom Finder (M.Right_Top & Bottom Finder 1.0).
The timing of this release couldn't be more perfect with everyone trying to 'find the bottom'. And the increased volatility that we've been seeing as of late.
Essentially, my indicator uses volatility and standard deviations among other things to assist you in finding the top or bottom of trends. You may also notice that it uses a lot of different strength indicators to provide an additional layer of complexity and confirmation.
Not just an RSI, but an RSI ema, smoothed OBV RSI's, and other volume RSI's. This is a truly unique and powerful tool for any Trader - whether you've just started or you've been trading for 20 years, I'm confident you will find value in the UPRIGHT Trading Top & Bottom Finder.
How to use it:
When it detects the trend Bottoming or Topping the histogram will change color. Bottom - Green/blue, Top - Red, (different shades of colors for different types of detection).
I've spent several hours tweaking the calculations and filters to enhance the accuracy, so this will be a noticeable upgrade from my original Top & Bottom Finder.
The length of the histogram bar can be an indication in itself, especially when it lines up close to one of the plotted lines and has noticeable direction change following this.
I've added a lot of text and pictures to help display it's capabilities, features, and customizability.
As always, it's fully customizable with alerts. Can toggle any thing on or off, and change the colors to suit your style.
3 Unique RSI's, different colors on the histogram will show different levels of detection. Some are more accurate in some timeframes than others. Bright Green and Bright Red are the most different from the rest.
I've jam-packed this indicator with Buy/Sell and Confirmation Signals and even background highlights (with colors that can mesh together). Feel free to find what works best for you.
RSI color indications and background highlights aid in confirmation. Also, as mentioned previously, sometimes a gray bar will land on a Fib and it will be a bottom signal.
The above chart should look like this
Good luck Traders,
Cheers,
Mike
(UPRIGHT Trading)

Volume Adaptive Bollinger Bands (MZ VABB)This indicator is a functional enhancement to John Bollinger's Bollinger Bands. I've used Volume to adapt dynamic length which is used in basis (middle line) of Bollinger Bands and Simple Moving Average is replaced with Adaptive Ehlers Deviation Scaled Moving Average ( AEDSMA ).
BOLLINGER BANDS BASIC USAGE AND LIMITATIONS
Bollinger bands are popular among traders because of their simple way to detect volatility in market and redefine support and resistance accordingly. These are some basic usages of original Bollinger Bands:
Most commonly Bollinger Band works on 20 period Simple Moving Average as Basis / Middle Line and standard deviation of 2 for volatility detection.
Upper and lower bands can act as support and resistance which accordingly update with standard deviation of same period as of Simple Moving Average.
As upper and lower bands act as volatility measure which benefits in Squeeze detection and breakout trading.
Among all the usages there are some limitations as follows:
Original Bollinger Bands use 20 period Simple Moving Average as Basis which itself restricted to some number of data pints and if market moves in one direction or simply goes sideways for long time; candles can stay on either bands for long time. This gives benefit for staying in directional trade but will completely nullify the use of both bands as support and resistance.
Above point simply be explained as markets can stay overbought / oversold for long time and one way to make Bollinger Bands more useful is to simply use higher periods in SMA but as we know with higher periods SMA becomes more laggy and less adaptive.
Most traders use BBs alongside some other Volume Oscillator for example "On Balance Volume" but that does solve BBs limitations issue that it should be more adaptive to detect volatility in market.
VOLUME ADAPTIVE BOLLINGER BAND WORKING PRINCIPLE
Best way to make original Bollinger band more adaptive was to just use dynamic length instead on constant 20 period. This dynamic length had to be based on some other powerful parameter which can't be volatility as BB itself is a volatility indicator and adapting its length based volatility would have been superimposing volatility on Bollinger bands giving unrealistic results.
For adaptive length, I tried using Volume and for this purpose I used my Relative Volume Strength Index " RVSI " indicator. RVSI is the best way to detect if Volume is going for a breakout or not and based on that indication length of Bollinger Band Basis Moving Average changes.
RVSI breaking above provided value would indicate Volume breakout and hence dynamic length would accordingly make Bollinger band basis moving average more over fitted and similarly standard deviation of achieved dynamic length would give better bands for support and resistance. Similar case would happen if Volume goes down and dynamic length becomes more underfit.
According to my back testing studies I found that Simple Moving Average wasn't the best choice for dynamic length usage in Bollinger Band Basis. So, I used Adaptive Ehlers Deviation Scaled Moving Average ( AEDSMA ) which is more adaptive and already modified to adapt with RVSI.
SLOPE USAGE FOR TREND STRENGTH DETCTION
Volume Adaptive Bollinger Bands are more reactive to market trends so, I used slope for trend strength detection.
If slope of Volume Adaptive Bollinger Band Basis (i.e. AEDSMA ), Upper and Lower Bands is supporting a trend at same time then script will provide signal in that direction. That signal can also use Volume as confirmation if Bollinger Bands trend direction is supported by Volume or not.
DYNAMIC COLORS AND TREND CORRELATION
I’ve used dynamic coloring in Basis ( AEDSMA ) to identify trends with more detail which are as follows:
Lime Color: Slope supported Strong Uptrend also supported by Volume and Volatility or whatever you’ve chosen from both of them.
Fuchsia Color: Weak uptrend only supported by Slope or whatever you’ve selected.
Red Color: Slope supported Strong Downtrend also supported by Volume and Volatility or whatever you’ve chosen from both of them.
Grey Color: Weak Downtrend only supported by Slope or whatever you’ve selected.
Yellow Color: Possible reversal indication by Slope if enabled. Market is either sideways, consolidating or showing choppiness during that period.
SIGNALS
Green Circle: Market good for long with support of Volume and Volatility or whatever you’ve chosen from both of them.
Red Circle: Market good to short with support from Volume and Volatility or whatever you’ve chosen from both of them.
Flag: Market either touched upper or lower band and can act as good TP and warning for reversal.
FIBONACCI BANDS
I’ve included Fibonacci multiple bands which would act as good support/resistance zones. For example, 0.618 Fib level act as good local support and resistance in both upper and lower zones. Fibonacci values can be modified but should be lower than 1.
DEFAULT SETTINGS
I’ve set default Minimum length to 50 and Maximum length to 100 which I’ve found works best for almost all timeframes but you can change this delta to adapt your timeframe accordingly with more precision.
Dynamic length adoption is enabled based on Volume only but volatility can be selected which is already explained above.
Trend signals are enabled based on Slope and Volume but Volatility can be enabled for more precise confirmations.
In “ RVSI ” settings "Klinger Volume Oscillator" is set to default but others work good too especially Volume Zone Oscillator. For more details about Volume Breakout you can check “MZ RVSI Indicator".
ATR breakout is set to be positive if period 14 exceeds period 46 but can be changed if more adaption with volatility is required.
EDSMA super smoother filter length is set to 20 which can be increased to 50 or more for better smoothing but this will also change slope results accordingly.
EDSMA super smoother filter poles are set to 2 because found better results with 2 instead of 3.
FURTHER ENHANCEMENTS
So far, I've achieved better results with "Klinger Volume Oscillator" in RVSI but TFS Volume Oscillator and On Balance Volume can be used which would change dynamic length differently. It doesn't mean that results would be wrong with some oscillator and precise with others but every oscillator works in its specific way for and RVSI just detect strength of Volume based on provided oscillator.

SmartProfit - Trend Indicator (Main Version) - RUSmartProfit - Trend Indicator (Main Version) detects trend direction and gives trading signals for Short and Long positions.
You can use "SmartProdit - Trend Indicator" for any timeframe, from daily, 4h, to fewer ones, even minute timeframe.
We recommend using those timeframes:
4h. and 3h. - for swing trading
15min. и 30min. - for scalping
"SmartProfit - Trend Indicator" features:
1. Sell and Buy signals ( For setup, we have three parameters: HB, sensitivity, and stop )
2. TakeProfit values for Long and Short signals ( Prices for profit fixing )
3. Profit table ( Show profit of current indicator settings for chosen time range )
4. Current position table ( Show data for the current position in real-time. At this table you have all that you need to enter the position )
5. Trend lines ( Draw Global and local trend lines. )
6. Fibonacci levels ( Automatically draw global and local Fibonacci levels )
7. Fibonacci channel ( Automatically draw global and local Fibonacci channels )
8. Auto setting - sorts out more than 6000 variants of settings at one loop and gives the best one.
For best results, you should set up an indicator for each trading pair. For setup, we have three parameters: HB, sensitivity, and stop. We have an additional feature for auto setting, which sorts out more than 6000 variants of settings at one loop and give the best one.
For work with indicators we made 3 strategies:
First - we enter the position after the signal is approved. Close and reenter to position with approved signal for another side.
Second and third - the same, we enter the position after the signal is approved, but we use TakeProfit and StopLoss values to fix the position.
"SmartProdit - Trend Indicator" определяет направления тренда и дает торговые сигналы для входа в Короткую или Длинную позицию.
Индикатор позволяет торговать на любых Таймфреймах , как на дневных, так и на более мелких временных интервалах, вплоть до минутных.
Мы рекомендуем использовать Таймфреймы:
4ч. или 3ч. - для Свинг-торговли
15мин. и 30мин. - для Скальпинга
Подробнее о функционале индикатора SmartProfit:
1. Сигналы Покупки или Продажи ( Для настройки используется уникальные параметры HB и Чувствительность )
2. Значения TakeProfit для Long и Short сигналов ( Зоны фиксации прибыли )
3. Таблица прибыльности ( Отображает прибыльность текущей настройки на выбранном интервале времени )
4. Таблица Текущей позиции ( Показывает текущую позицию в режиме реального времени - в ней есть всё, что нужно для входа в позицию )
5. Трендовые линии ( Рисует как Глобальные, так и локальные трендовые линии, в зависимости от настроек )
6. Уровни Фибоначчи ( Автоматически строит уровни Фибоначчи, как Глобальные так и Локальные )
7. Каналы по Фибоначчи ( Автоматически строит каналы по Фибоначчи, как Глобальные так и Локальные )
8. Автоподсчет всех настроек индикатора - автоматически делает подбор более 6000 вариаций настроек за раз и выдаёт лучшие под каждый актив. Вам не надо тратить недели и месяцы чтобы вручную подбирать настройки, наш инструмент подберет лучшие настройки для Вас.
Для более лучших результатов, для каждого актива индикатор настраивается отдельно !
Для настройки индикатора используются три Уникальных параметра:
HB, Чувствительность, Стоп.
Для работы с индикатором разработаны три стратегии:
Первая - мы входим в позицию при закреплении сигнала и переворачиваемся (то есть выходим из позиции и заходим в противоположную сторону) по обратному сигналу.
По 2-ой и 3-ей стратегии мы также входим после закрепления сигнала, но для фиксации прибыли используем зоны TakeProfit, указанные индикатором.
Подробнее о всех возможностях стратегий, а также настройке и работе с индикатором, вы узнаете из нашей инструкции, которую выдаем персонально.

Fibbs EMAFibbonaci EMA for Price action. You attach this to your grapg and you get a string of 7 EMAs, with default values set to the most important numbers according to the fib ratio

Stochastic RSI rainbow in fibonacci sequence using VWMAThe standard stochastic RSI gives limited information as it only contains two reference lines. This Stochastic RSI rainbow contains more lines in shorter timeframes and progressively fewer as the reference time increase. This is done in a FIB sequence 2,3,8,13,21,34,55.... The shorter timeframes are more reactive to current market conditions indicating recent price action and the longer lines represent more significant periods of time. The indicator uses VWMA for its calculations (volume weighted moving average)
HOW TO USE THIS INDICATOR:
When multiple lines are above, either 70 or 80, you can consider the commodity overbought, or OB. The more lines that are above the threshhold, the more significant the signal. The same is true in inverse. In addition, you can use each cross to signify a buy/sell signal according to the type and quantity of trading you are doing. If you are looking to get in and out quickly you can use the lower timeframe signals.
OPTIONS:
You can change what data is used for the VWMA calculation... Of course, you can select colors and other properties as well.
OJLJ Elliott Waves detector (Free)This script is made to identify Elliot Waves by setting a zigzag line as principal source, it identifies patterns with the most common rules, in the chart you will see a number in each wave detected, a wave could have the characteristics to be two different waves so it will be plotted the options that could be, To identify which one is most trustable I suggest to use the Fibonacci levels options as an additional note this is a free update to my existing script.
Features:
+ All waves ? (Option to show just the 5 Wave patterns recognition)
+ Draw zigzag line (Option to show the zigzag line)
+ Supports Multiple instruments, from FOREX to Stocks
+ It works on all the timeframes
+ Show Fib levels (Option to show the Fibonacci levels)
+ Fibonacci levels fit test (Green crosses mark were should a Bull wave be to fit with a Fibonacci Level While the purple crosses show were should the wave fit to be a bear trend, the more closer with the point of the wave the most trustable Example, a 5 Wave Bull could also be a 2 Bear Wave, if the green cross is closer to the orange point of the wave then is a 5 Wave Bull, if the purple cross is closer to the orange point)
+ A background color also show when a 5 pattern is identified
+ The way to plot the zigzag can be changed with 3 Input options
Characteristics to add in future updates (Please if you like it you can support me with coins):
+ Detect more than 1 cycle at the same time
+ Use a volume indicator to identify how many volume was traded in each wave
+ Implement the use of the EWO ( Elliot Wave Oscillator)
+ Improve the display
+ Identify ABC patterns
+ Add triangles and Zigzag formations
TSI in Dynamic Zones with Divergence and Pivot PointsTrue Strength Index , or TSI is considered a "leading indicator" - in contrast to a "lagging indicator" just as Moving Averages it does not show a confirmation what already happened, but it shows what can happen in the future. For example: The chart is climbing while the TSI oscillator is slowly declining, gets weaker and weaker, maybe even prints bearish divergences? That means that a reversal might be occurring soon. Leading indicators are best paired with Stop and Resistance Lines, General Trendlines , Fib Retracements etc. Your chart is approaching a very important Resistance Trendline but the TSI shows a very positive signal? That means there is a high probability that the Resistance is going to be pushed through and becomes Support in the future.
What are those circles?
-These are Divergences. Red for Regular-Bearish. Orange for Hidden-Bearish. Green for Regular-Bullish. Aqua for Hidden-Bullish.
What are those triangles?
- These are Pivots . They show when the TSI oscillator might reverse, this is important to know because many times the price action follows this move.
What are these blue or orange areas?
- Those are dynamic zones. For the analysis of the TSI its important to know if the indicator is in a state of oversold or overbought to filter out ranging price movement. Normally those zones are static, in this version of the TSI oscillator dynamic zones were added to show a dynamic calculation whether the TSI oscillator is oversold, overbought or ranging.
Please keep in mind that this indicator is a tool and not a strategy, do not blindly trade signals, do your own research first! Use this indicator in conjunction with other indicators to get multiple confirmations.

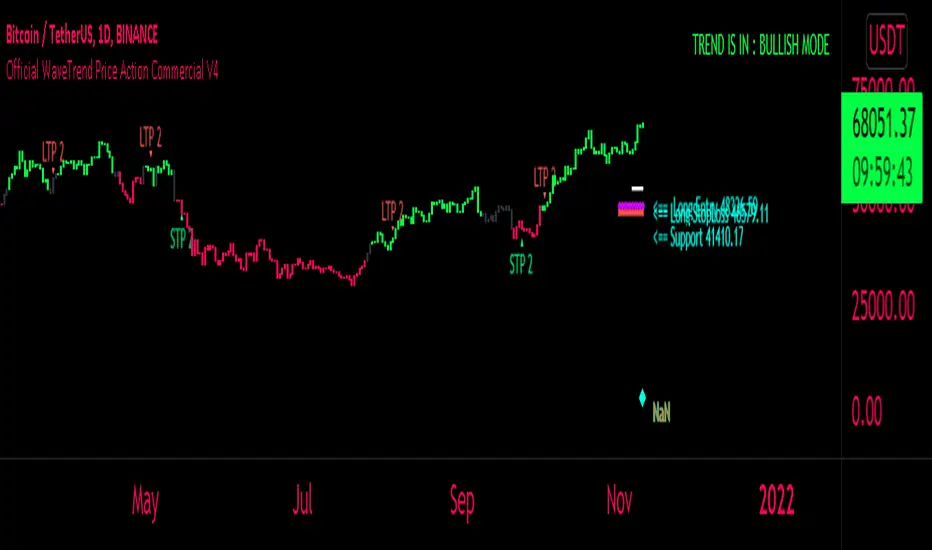
FaizanN Official WaveTrend Price Action Commercial PINEV4Hello Traders,
Here i bring you my first Price Action WaveTrend based Indictor combined with fib entry and exit trailing levels with minimum risk and maximum profit , as we must have seen at times as we enter the trend reverse and hits our stoploss . Keeping that in mind as i too struggled and made losses so i decided and focused more on minimizing the loss and only on confirmation Long or Short trade is been initiated along with Stoploss as explaned in the images below , why should we give market our money ;) as we are here to make money :D .. There is no holy grail as Stop loss wont be hit but yes it will be way less and all alerts are based on candle close ... One can use this on any chart and any timeframe and its very good for scalping too . Better results are on 15m and above . Hope you guys will like it and comment if you have any doubts..
-----------------
Disclaimer
Copyright by FaizanNawazz.
The information contained in my scripts/indicators/strategies/ideas does not constitute financial advice or a solicitation to buy or sell any securities of any type. I will not accept liability for any loss or damage, including without limitation any loss of profit, which may arise directly or indirectly from the use of or reliance on such information.
All investments involve risk, and the past performance of a security, industry, sector, market, financial product, trading strategy, or individual’s trading does not guarantee future results or returns. Investors are fully responsible for any investment decisions they make. Such decisions should be based solely on an evaluation of their financial circumstances, investment objectives, risk tolerance, and liquidity needs.
My scripts/indicators are only for educational purposes!
Happy Trading!
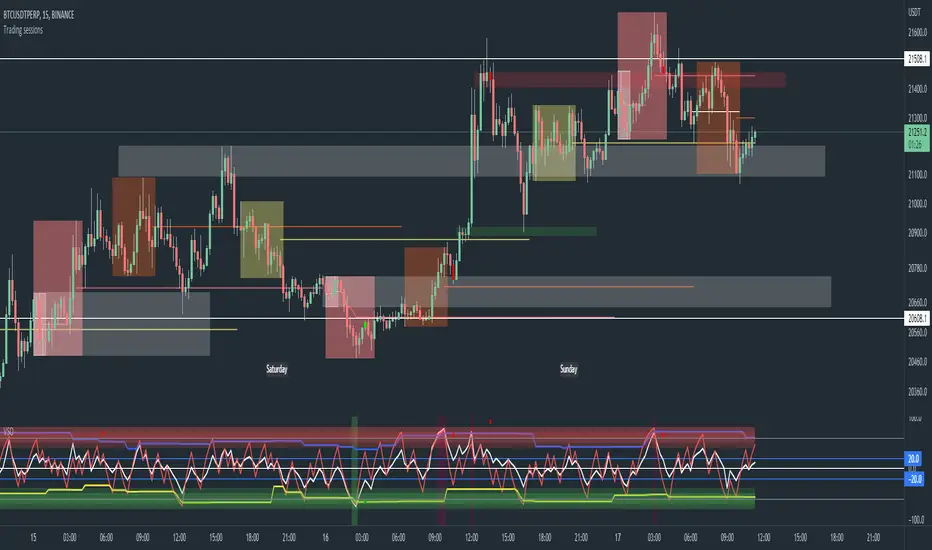
Trading sessions, Ichimoku and Classic Pivots█ OVERVIEW
This a self contained intraday trading style for crypto/forex made to be on and traded on 15-min.
This Script Creates a box around each major session to a trading range, include highlights for the first 12 15-min candles, classic Pivot points and ichimoku cloud.
█ CONCEPTS
1 — Session boxes and ranges are based of the times from Steve from Beat the market maker, and you have the option in setting to have an extension for the high/low until the start of the next box calculation.
2 — 12 candle window, this marks the first 3 hours after a open;
The first hour - stop hunt
The second hour - big moves
The third hour - tend continuation or reversal
3 — The Days of the weeks are labelled and coloured;
Weekends are in grey, ideally no trade days.
Monday, Tuesday, Thursday are green, to mark the week days
Wednesday is red to be mindful of mid week reversal
Friday is red to mark the end of week
4 — Ichimoku cloud, by default the only thing visible is the kumo cloud, but in setting you can turn the line back on. Ichimoku proves a great mark for areas to look for support and resistances.
5 — Lastly, you have classic pivots, by default they are extend to the right and on weekly, Each level act as support and resistance. Look for Bullish momentum at R3 for a larger moves to the upside.
Ichimoku and the pivot are here mainly for when you want to do higher time frame analysis.
█ OTHER SECTIONS
• HOW TO USE
Example of a trade
**Key thing to remember is London will set the high in a down trend and the low in an up trend
you can see the first hour look for stops and stopped at 50% of the range set coming into the session, the second hour a big move to the down side hitting 200% expansion then the third hour reversal stopping wick up then
back down from from London low. before continuing down.
• LIMITATIONS: I have not test this on Stock, as I have a different strategies for those market
• NOTES : I know a lot of people have moving averages on their chart, I have another separate one with all MA types, and it something that will not fit into one script, Other things you can add with this Bollinger bands, and
fib tool with 50%, 100%, 150% and 200%