BasicVisibleChartBasic library for the visible range chart; with functions to allow plotting Fibs from body high/low as well as wick high/low
-Thanks to code from @PineCoders Visible Chart library (PineCoders/VisibleChart/4), which is a much more comprehensive library than this, but which does not include some functions that I find useful:
-Added the following exportable functions: highest/lowest body, highest/lowest close, highest/lowest open. These allow one to anchor fibs from bodies rather than wicks
-Added a Fib Box function in the example code
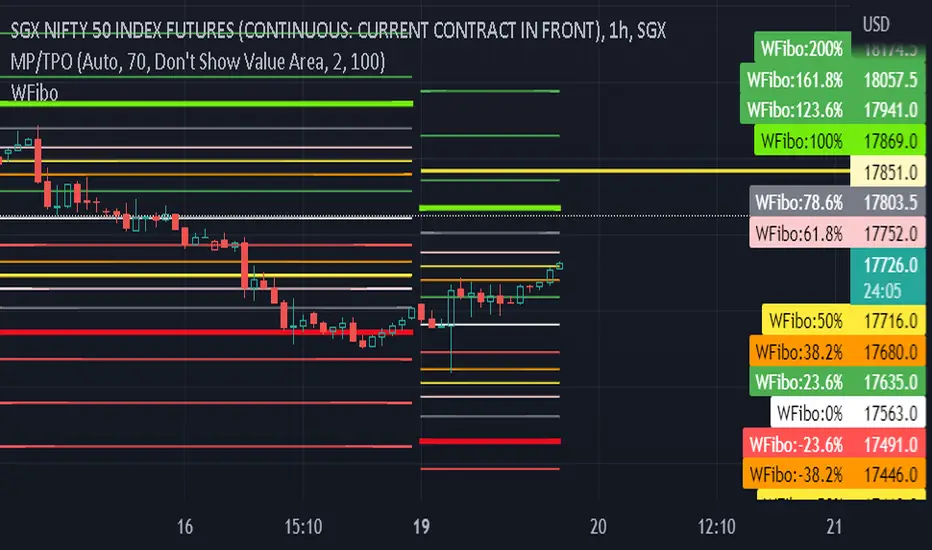
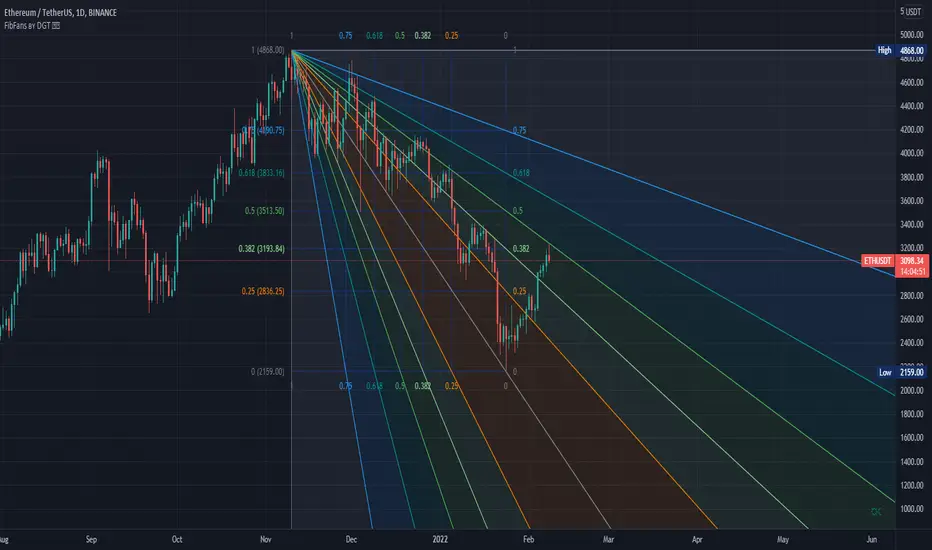
The above chart shows the example code plotting a Fib range drawn from bodies and a highlighted retracement zone (61.8 % - 78.6% )
~~All Exportable Functions~~
barIsVisible()
highestClose()
highestOpen()
highestBody()
lowestClose()
lowestOpen()
lowestBody()
high()
highBarTime()
low()
lowBarTime()
open()
close()
Libreria Pine Script®