GC-LongerTimeFrame (LTF) - Maroon, Green, Black/White (GC)Let's bring GOLD to life here! Tis the season...like always for gold. This is a Longer Time Frame Fib level indicator. To be used with Longer Time frame Indicator. Though it can be used independently. It shows where the market is looking to go and where it has been. When the market get above one level ( white bar, for example) look for price action to continue to the next level (white bar). If it breaks below the white bar look for price action to go the next level below for support. It is fractal in nature. It is fib levels inside longer time frame fib levels. I hope it will impress! More importantly I hope you can make some money! It is great for having targets and support levels. It helps in knowing why the market may continue in a direction. For example: When the price action has already moved up, why does it keep going up, because it hasn't reached targeted fib level, yet. Same reason price action may move lower once it breaks a particular level. It is looking for its fib level support. I will add this as well. the third white bar is a reversal bar. If it breaks the top it wants to continue onward. The first white bar is a pullback bar to the bar below that is between the green bars (unless market is actively riding the 8 sma)
Cerca negli script per "fib"

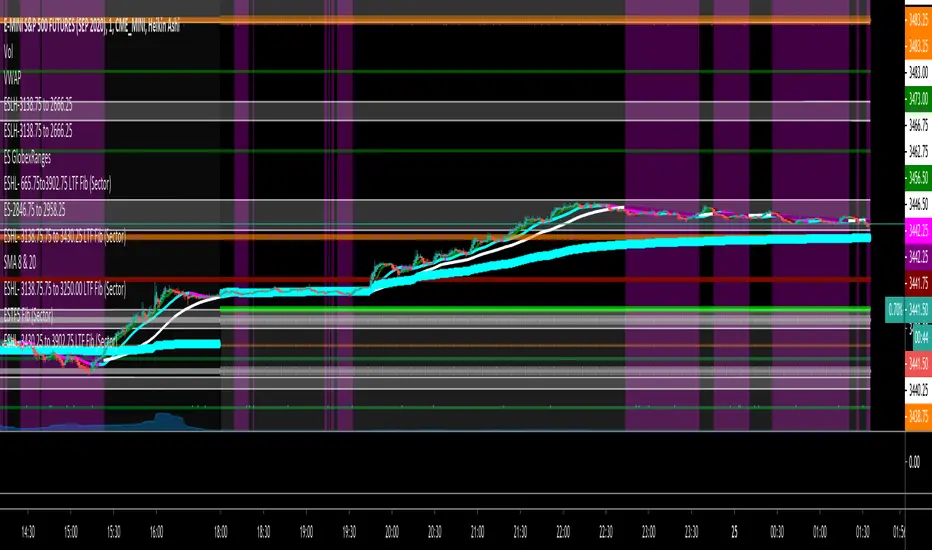
ES-3430.25 to 3902.75 ShorterTimeFrame (STF) This is a Shorter Time Frame Fib level indicator. To be used with Longer Time frame Indicator. Though it can be used independently. It shows where the market is looking to go and where it has been. When the market get above one level ( white bar, for example) look for price action to continue to the next level (white bar). If it breaks below the white bar look for price action to go the next level below for support. It is fractal in nature. It is fib levels inside longer time frame fib levels. I hope it will impress! More importantly I hope you can make some money! It is great for having targets and support levels. It helps in knowing why the market may continue in a direction. For example: When the price action has already moved up, why does it keep going up, because it hasn't reached targeted fib level, yet. Same reason price action may move lower once it breaks a particular level. It is looking for its fib level support.
NQ-ShorterTimeFrame (STF) - Maroon, Green, Black/White (NQ)This is a Shorter Time Frame Fib level indicator. To be used with Longer Time frame Indicator. Though it can be used independently. It shows where the market is looking to go and where it has been. When the market get above one level ( white bar, for example) look for price action to continue to the next level (white bar). If it breaks below the white bar look for price action to go the next level below for support. It is fractal in nature. It is fib levels inside longer time frame fib levels. I hope it will impress! More importantly I hope you can make some money! It is great for having targets and support levels. It helps in knowing why the market may continue in a direction. For example: When the price action has already moved up, why does it keep going up, because it hasn't reached targeted fib level, yet. Same reason price action may move lower once it breaks a particular level. It is looking for its fib level support.

NQ-ShorterTimeFrame2 (STF2) - Maroon, Green, Black/White (NQ)This is a Shorter Time Frame Fib level indicator. To be used with Longer Time frame Indicator. Though it can be used independently. It shows where the market is looking to go and where it has been. When the market get above one level ( white bar, for example) look for price action to continue to the next level (white bar). If it breaks below the white bar look for price action to go the next level below for support. It is fractal in nature. It is fib levels inside longer time frame fib levels. I hope it will impress! More importantly I hope you can make some money! It is great for having targets and support levels. It helps in knowing why the market may continue in a direction. For example: When the price action has already moved up, why does it keep going up, because it hasn't reached targeted fib level, yet. Same reason price action may move lower once it breaks a particular level. It is looking for its fib level support.

linreg-areas (like fib system just more accurate) So this system is a different approach to form a daily fib like system.
Its based on linear regression and its slope , we calculate the slope of the line and we put it in MTF format that is without security and non repainting (int2=1440 min)
As you in graph the coin in this case BTC has cycle from low to high similar to the fibs system.
the lowest level is bellow -0.2 , next level is -0.1 ,0,0.1 and above 0.2 is consider the highest
with this system its easy to find the highs and the lows as the coin go between the levels either up or down like the fibs system.
one can use this together with fibs system in order to make analysis more accurate.
also it easy to set signals once the slope go between levels either up or down . another advantage for this system compare to fibs system is the ability to reduce the MTF to lower frame let say 4 hour or even less and then by the same logic to create system of high and lows to the most smaller frames (but if you do that you need in code to change the levels setting numbers so it fit the best )
follow the direction of the slope and you will find the road that you wish:))

3 Fib Strategy – Automatic Trend Fib Extension ConfluenceWhat This Script Does
✔ Auto-detects swing highs and lows
Using pivot detection, adjustable by the user.
✔ Builds 3 independent trend-based Fib extension projections
Measures:
Wave 1 → Wave 2 → Wave 3
Wave 2 → Wave 3 → Wave 4
Wave 3 → Wave 4 → Wave 5
✔ Calculates the exact fib levels:
1.0 (1:1 extension)
1.236 extension
1.382 extension
✔ Detects confluence zones
When all 3 fib measurement sets overlap at the same target:
Green label = 1:1 confluence
Orange label = 1.236–1.382 confluence
✔ Draws long dotted lines across the chart
So you can visually track confluence zones.

Volume Point of Control with Fib Based Profile🍀Description:
This indicator is a comprehensive volume profile analysis tool designed to identify key price levels based on trading activity within user-defined timeframes. It plots the Point of Control (POC), Value Area High (VAH), and Value Area Low (VAL), along with dynamically calculated Fibonacci levels derived from the developing period's range. It offers extensive customization for both historical and developing levels.
🍀Core Features:
Volume Profiling (POC, VAH, VAL):
Calculates and plots the POC (price level with the highest volume), VAH, and VAL for a selected timeframe (e.g., Daily, Weekly).
The Value Area percentage is configurable. 70% is common on normal volume profiles, but this script allows you to configure multiple % levels via the fib levels. I recommend using 2 versions of this indicator on a chart, one has Value Area at 1 (100% - high and low of lookback) and the second is a specified VA area (i.e. 70%) like in the chart snapshot above. See examples at the bottom.
Historical Levels:
Plots POC, VAH, and VAL from previous completed periods.
Optionally displays only "Unbroken" levels – historical levels that price has not yet revisited, which can act as stronger magnets or resistance/support.
The user can manage the number of historical lines displayed to prevent chart clutter.
Developing Levels:
Shows the POC, VAH, and VAL as they form in real-time during the current, incomplete period. This provides insight into intraday/intra-period value migration.
Dynamic Fibonacci Levels:
Calculates and plots Fibonacci retracement/extension levels based dynamically on the range between the developing POC and the developing VAH/VAL.
Offers 8 configurable % levels above and below POC that can be toggled on/off.
Visual Customization:
Extensive options for colors, line styles, and widths for all plotted levels.
Optional gradient fill for the Value Area that visualizes current price distance from POC - option to invert the colors as well.
Labels for developing levels and Fibonacci levels for easy identification.
🍀Characteristics:
Volume-Driven: Levels are derived from actual trading volume, reflecting areas of high participation and price agreement/disagreement.
Timeframe Specific: The results are entirely dependent on the chosen profile timeframe.
Dynamic & Static Elements: Developing levels and Fibs update live, while historical levels remain fixed once their period closes.
Lagging (Historical) & Potentially Leading: Historical levels are based on the past, but are often respected by future price action. Developing levels show current dynamics.
🍀How to Use It:
Identifying Support & Resistance: Historical and developing POCs, VAHs, and VALs are often key areas where price may react. Unbroken levels are particularly noteworthy.
Market Context & Sentiment: Trading above the POC suggests bullish strength/acceptance of higher prices, while trading below suggests bearishness/acceptance of lower prices.
Entry/Exit Zones: Interactions with these levels (rejections, breakouts, tests) can provide potential entry or exit signals, especially when confirming with other analysis methods.
Dynamic Targets: The Fibonacci levels calculated from the developing POC-VA range offer potential intraday/intra-period price targets or areas of interest.
Understanding Value Migration: Observing the movement of the developing POC/VAH/VAL throughout the period reveals where value is currently being established.
🍀Potential Drawbacks:
Input Sensitivity: The choice of timeframe, Value Area percentage, and volume resolution heavily influences the generated levels. Experimentation is needed for optimal settings per instrument/market. (I've found that Range Charts can provide very accurate volume levels on TV since the time element is removed. This helps to refine the accuracy of price levels with high volume.)
Volume Data Dependency: Requires accurate volume data. May be less reliable on instruments with sparse or questionable volume reporting.
Chart Clutter: Enabling all features simultaneously can make the chart busy. Utilize the line management inputs and toggle features as needed.
Not a Standalone Strategy: This indicator provides context and key levels. It should be used alongside other technical analysis tools and price action reading for robust decision-making.
Developing Level Fluctuation: Developing POC/VA/Fib levels can shift considerably, especially early in a new period, before settling down as more volume accumulates and time passes.
🍀Recommendations/Examples:
I recommend have this indicator on your chart twice, one has the VA set at 1 (100%) and has the fib levels plotted. The second has the VA set to 0.7 (70%) to highlight the defined VA.
Here is an example with 3 on a chart. VA of 100%, VA of 80%, and VA of 20%

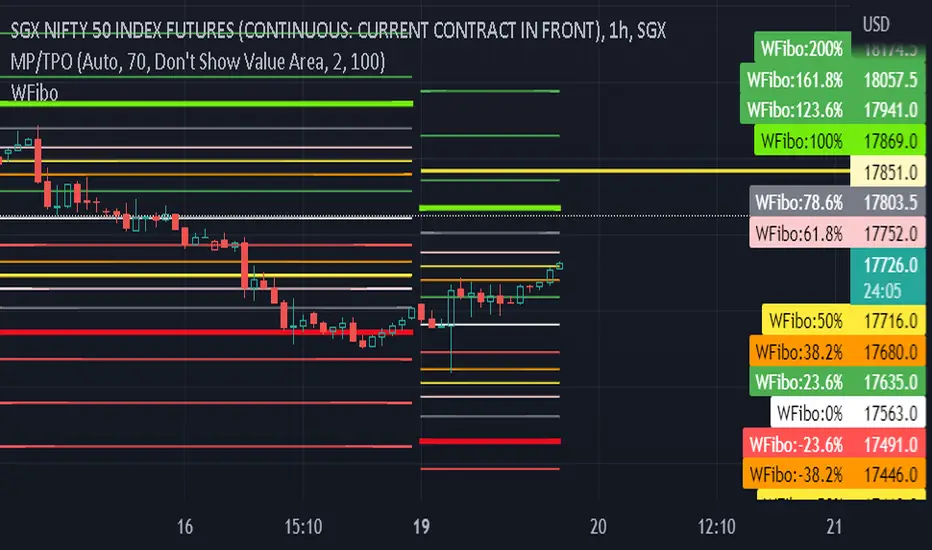
GIGANEVA V6.61 PublicThis enhanced Fibonacci script for TradingView is a powerful, all-in-one tool that calculates Fibonacci Levels, Fans, Time Pivots, and Golden Pivots on both logarithmic and linear scales. Its ability to compute time pivots via fan intersections and Range interactions, combined with user-friendly features like Bool Fib Right, sets it apart. The script maximizes TradingView’s plotting capabilities, making it a unique and versatile tool for technical analysis across various markets.
1. Overview of the Script
The script appears to be a custom technical analysis tool built for TradingView, improving upon an existing script from TradingView’s Community Scripts. It calculates and plots:
Fibonacci Levels: Standard retracement levels (e.g., 0.236, 0.382, 0.5, 0.618, etc.) based on a user-defined price range.
Fibonacci Fans: Trendlines drawn from a high or low point, radiating at Fibonacci ratios to project potential support/resistance zones.
Time Pivots: Points in time where significant price action is expected, determined by the intersection of Fibonacci Fans or their interaction with key price levels.
Golden Pivots: Specific time pivots calculated when the 0.5 Fibonacci Fan (on a logarithmic or linear scale) intersects with its counterpart.
The script supports both logarithmic and linear price scales, ensuring versatility across different charting preferences. It also includes a feature to extend Fibonacci Fans to the right, regardless of whether the user selects the top or bottom of the range first.
2. Key Components Explained
a) Fibonacci Levels and Fans from Top and Bottom of the "Range"
Fibonacci Levels: These are horizontal lines plotted at standard Fibonacci retracement ratios (e.g., 0.236, 0.382, 0.5, 0.618, etc.) based on a user-defined price range (the "Range"). The Range is typically the distance between a significant high (top) and low (bottom) on the chart.
Example: If the high is $100 and the low is $50, the 0.618 retracement level would be at $80.90 ($50 + 0.618 × $50).
Fibonacci Fans: These are diagonal lines drawn from either the top or bottom of the Range, radiating at Fibonacci ratios (e.g., 0.382, 0.5, 0.618). They project potential dynamic support or resistance zones as price evolves over time.
From Top: Fans drawn downward from the high of the Range.
From Bottom: Fans drawn upward from the low of the Range.
Log and Linear Scale:
Logarithmic Scale: Adjusts price intervals to account for percentage changes, which is useful for assets with large price ranges (e.g., cryptocurrencies or stocks with exponential growth). Fibonacci calculations on a log scale ensure ratios are proportional to percentage moves.
Linear Scale: Uses absolute price differences, suitable for assets with smaller, more stable price ranges.
The script’s ability to plot on both scales makes it adaptable to different markets and user preferences.
b) Time Pivots
Time pivots are points in time where significant price action (e.g., reversals, breakouts) is anticipated. The script calculates these in two ways:
Fans Crossing Each Other:
When two Fibonacci Fans (e.g., one from the top and one from the bottom) intersect, their crossing point represents a potential time pivot. This is because the intersection indicates a convergence of dynamic support/resistance zones, increasing the likelihood of a price reaction.
Example: A 0.618 fan from the top crosses a 0.382 fan from the bottom at a specific bar on the chart, marking that bar as a time pivot.
Fans Crossing Top and Bottom of the Range:
A fan line (e.g., 0.5 fan from the bottom) may intersect the top or bottom price level of the Range at a specific time. This intersection highlights a moment where the fan’s projected support/resistance aligns with a key price level, signaling a potential pivot.
Example: The 0.618 fan from the bottom reaches the top of the Range ($100) at bar 50, marking bar 50 as a time pivot.
c) Golden Pivots
Definition: Golden pivots are a special type of time pivot calculated when the 0.5 Fibonacci Fan on one scale (logarithmic or linear) intersects with the 0.5 fan on the opposite scale (or vice versa).
Significance: The 0.5 level is the midpoint of the Fibonacci sequence and often acts as a critical balance point in price action. When fans at this level cross, it suggests a high-probability moment for a price reversal or significant move.
Example: If the 0.5 fan on a logarithmic scale (drawn from the bottom) crosses the 0.5 fan on a linear scale (drawn from the top) at bar 100, this intersection is labeled a "Golden Pivot" due to its confluence of key Fibonacci levels.
d) Bool Fib Right
This is a user-configurable setting (a boolean input in the script) that extends Fibonacci Fans to the right side of the chart.
Functionality: When enabled, the fans project forward in time, regardless of whether the user selected the top or bottom of the Range first. This ensures consistency in visualization, as the direction of the Range selection (top-to-bottom or bottom-to-top) does not affect the fan’s extension.
Use Case: Traders can use this to project future support/resistance zones without worrying about how they defined the Range, improving usability.
3. Why Is This Code Unique?
Original calculation of Log levels were taken from zekicanozkanli code. Thank you for giving me great Foundation, later modified and applied to Fib fans. The script’s uniqueness stems from its comprehensive integration of Fibonacci-based tools and its optimization for TradingView’s plotting capabilities. Here’s a detailed breakdown:
All-in-One Fibonacci Tool:
Most Fibonacci scripts on TradingView focus on either retracement levels, extensions, or fans.
This script combines:
Fibonacci Levels: Static horizontal lines for retracement and extension.
Fibonacci Fans: Dynamic trendlines for projecting support/resistance.
Time Pivots: Temporal analysis based on fan intersections and Range interactions.
Golden Pivots: Specialized pivots based on 0.5 fan confluences.
By integrating these functions, the script provides a holistic Fibonacci analysis tool, reducing the need for multiple scripts.
Log and Linear Scale Support:
Many Fibonacci tools are designed for linear scales only, which can distort projections for assets with exponential price movements. By supporting both logarithmic and linear scales, the script caters to a wider range of markets (e.g., stocks, forex, crypto) and user preferences.
Time Pivot Calculations:
Calculating time pivots based on fan intersections and Range interactions is a novel feature. Most TradingView scripts focus on price-based Fibonacci levels, not temporal analysis. This adds a predictive element, helping traders anticipate when significant price action might occur.
Golden Pivot Innovation:
The concept of "Golden Pivots" (0.5 fan intersections across scales) is a unique addition. It leverages the symmetry of the 0.5 level and the differences between log and linear scales to identify high-probability pivot points.
Maximized Plot Capabilities:
TradingView imposes limits on the number of plots (lines, labels, etc.) a script can render. This script is coded to fully utilize these limits, ensuring that all Fibonacci levels, fans, pivots, and labels are plotted without exceeding TradingView’s constraints.
This optimization likely involves efficient use of arrays, loops, and conditional plotting to manage resources while delivering a rich visual output.
User-Friendly Features:
The Bool Fib Right option simplifies fan projection, making the tool intuitive even for users who may not consistently select the Range in the same order.
The script’s flexibility in handling top/bottom Range selection enhances usability.
4. Potential Use Cases
Trend Analysis: Traders can use Fibonacci Fans to identify dynamic support/resistance zones in trending markets.
Reversal Trading: Time pivots and Golden Pivots help pinpoint moments for potential price reversals.
Range Trading: Fibonacci Levels provide key price zones for trading within a defined range.
Cross-Market Application: Log/linear scale support makes the script suitable for stocks, forex, commodities, and cryptocurrencies.
The original code was from zekicanozkanli . Thank you for giving me great Foundation.

Auto Fib GOLDEN ENTRY WITH PROFIT ZONE TARGETAuto Fib "GOLDEN ENTRY ZONE WITH TARGET PROFIT TAKING" Indicator Review
Overview
The Auto Fib "GOLDEN ENTRY ZONE WITH TARGET PROFIT TAKING" is a sophisticated TradingView indicator designed to enhance Fibonacci analysis by combining entry signals with predefined profit-taking targets. This tool automates the identification of Fibonacci retracement levels and integrates target profit zones, aiming to streamline the trading process and improve overall trading efficiency.
Features
Automatic Fibonacci Levels: This feature automatically plots Fibonacci retracement levels based on recent price swings, removing the need for manual level setting. This ensures consistency and accuracy in identifying key support and resistance levels.
Golden Entry Zone: The indicator highlights the "Golden Entry Zone," a critical area around significant Fibonacci levels such as the 38.2% and 61.8% retracement levels. This zone helps traders identify potential entry points where the price is likely to reverse or find support.
Target Profit Taking Zones: In addition to identifying entry points, the indicator sets predefined profit-taking targets. These targets are derived from Fibonacci extension levels and are visually marked on the chart, guiding traders on where to consider exiting their positions for optimal gains.
Customizable Settings: Users can tailor the indicator’s settings to fit their trading style, including adjusting Fibonacci levels, entry zone parameters, and profit-taking targets. This flexibility ensures that the indicator aligns with various trading strategies and preferences.
Visual Enhancements: The indicator features clear and customizable visual elements, including color-coded entry zones and profit targets. This visual clarity helps traders quickly interpret and act on the signals provided.
Alerts and Notifications: Traders can set up alerts to be notified when the price approaches the "Golden Entry Zone" or reaches the profit-taking targets. This functionality ensures that traders can act swiftly and capitalize on trading opportunities.
Pros
Streamlined Fibonacci Analysis: By automating Fibonacci level plotting, the indicator eliminates manual errors and saves time, allowing traders to focus on strategy execution.
Enhanced Entry and Exit Points: The combination of the "Golden Entry Zone" and predefined profit-taking targets provides a comprehensive approach to trading, helping traders identify both optimal entry points and strategic exit levels.
Customizable and Flexible: The ability to adjust settings allows traders to adapt the indicator to various market conditions and personal trading styles, making it a versatile tool.
Visual Clarity: The clear graphical representation of entry zones and profit targets improves decision-making and reduces the likelihood of missing key trading opportunities.
Cons
Market Conditions Dependence: The effectiveness of the indicator may vary depending on market volatility and trends. In highly dynamic markets, the predefined profit targets may need adjustments or additional analysis.
Lagging Nature: As with any tool based on historical data, there can be a lag in signal accuracy. Traders should use the indicator in conjunction with other analysis methods to validate signals.
Potential Over-Reliance: Relying solely on the indicator without considering broader market conditions or additional technical factors may lead to suboptimal trading decisions.
Conclusion
The Auto Fib "GOLDEN ENTRY ZONE WITH TARGET PROFIT TAKING" indicator is a powerful tool for traders who utilize Fibonacci retracement and extension levels. By automating the identification of entry points and integrating profit-taking targets, it simplifies the trading process and helps traders make more informed decisions. While the indicator offers significant advantages in terms of ease of use and visual clarity, it is important to use it as part of a broader trading strategy and to consider additional market factors.
For traders looking to enhance their Fibonacci analysis and streamline their trading approach, the Auto Fib "GOLDEN ENTRY ZONE WITH TARGET PROFIT TAKING" provides a valuable and effective solution.
Feel free to modify or expand upon this review based on your specific experiences or additional features of the indicator!

Auto Fib GOLDEN ENTRYAuto Fib "GOLDEN ENTRY ZONE" Indicator Review
Overview
The Auto Fib "GOLDEN ENTRY ZONE" is a TradingView indicator designed to streamline the Fibonacci retracement process for traders. By automatically identifying key Fibonacci levels and highlighting a "golden entry zone," this tool aims to simplify the trading process and enhance decision-making.
Features
Automatic Fibonacci Levels: The indicator automatically plots Fibonacci re-tracement levels on the chart based on recent price swings. This removes the need for manual Fibonacci drawing, which can be subjective and prone to errors.
Golden Entry Zone: The core feature is the "Golden Entry Zone," a highlighted area on the chart where the indicator suggests that the price is likely to reverse or find support/resistance. This zone is typically centered around key Fibonacci levels such as the 38.2% and 61.8% retracement levels, which are considered significant by many traders.
Customizable Settings: Users can adjust the indicator’s settings to fit their trading style. Options include modifying the Fibonacci levels used, the appearance of the zones, and the sensitivity of the automatic level detection.
Visual Enhancements: The indicator features clear and visually appealing graphics, with customizable colors and line styles to match user preferences and enhance readability.
Alerts and Notifications: The indicator can be set up to send alerts when price action enters the "Golden Entry Zone" or when specific Fibonacci levels are approached, allowing traders to act quickly.
Pros
Ease of Use: The automatic plotting of Fibonacci levels is a significant advantage, especially for traders who are new to Fibonacci analysis or those who prefer not to spend time drawing levels manually.
Strategic Entry Points: By highlighting the "Golden Entry Zone," the indicator helps traders identify potentially lucrative entry points with less guesswork involved.
Customization: The ability to customize settings ensures that the indicator can be tailored to fit different trading strategies and preferences.
Visual Clarity: The graphical representation of the Fibonacci levels and the entry zone is well-designed, making it easy to interpret and act on the signals provided.
Cons
Dependence on Recent Price Action: The accuracy of the Fibonacci levels and the "Golden Entry Zone" relies heavily on recent price swings. In highly volatile or trending markets, the indicator may need to be adjusted or supplemented with other tools.
Lagging Indicator: Like most indicators based on historical data, there can be a lag in the signal provided. Traders should use it in conjunction with other analysis methods to confirm signals.
Over-reliance Risk: Relying solely on the indicator without considering broader market context, fundamental analysis, or additional technical indicators can be risky.
Conclusion
The Auto Fib "GOLDEN ENTRY ZONE" indicator is a robust tool for traders who use Fibonacci retracement levels to inform their trading decisions. Its automatic plotting feature and focus on key entry zones simplify the process of identifying potential trading opportunities. However, as with any trading tool, it’s essential to use it as part of a broader strategy and consider additional market factors to enhance trading success.
For traders seeking a reliable and visually intuitive way to apply Fibonacci analysis, the Auto Fib "GOLDEN ENTRY ZONE" is a valuable addition to their TradingView toolkit.
Feel free to adjust or expand on any sections based on your specific experience with the indicator or additional details you’d like to include!

High/Low Fibs using Bullish Anchors I do Love me some fibs!!
i used a lot of 30 min Opening Range Fibs for interday trading, but have found that using more bars back can make for stronger levels just like when we use higher time frame to see support & resistant levels.
You can just find high and lows for making an easy auto draw fib retracment, I think you will find these to be fairly accurate or at least just entertaining .
Here are some basics on how to use FIb Retracments
Fibonacci retracement is a popular technical analysis tool used by traders to identify potential levels of support and resistance in financial markets, including stocks. It is based on the Fibonacci sequence, a series of numbers where each number is the sum of the two preceding ones (e.g., 0, 1, 1, 2, 3, 5, 8, 13, 21, ...). The key Fibonacci retracement levels are 23.6%, 38.2%, 50%, 61.8%, and 78.6%. These levels are used to identify potential reversal points or areas of price consolidation. Here's how to use Fibonacci retracement in stock trading:
1. Identify a Significant Price Move:
Start by identifying a significant price move in the stock you are analyzing. This move can be either an uptrend or a downtrend. For uptrends, you'll be measuring from the low point to the high point, and for downtrends, you'll measure from the high point to the low point.
2. Draw Fibonacci Levels: *With this indicator We do this for you
Once you have identified the price move, use a Fibonacci retracement tool available on most trading platforms to draw the retracement levels. Typically, you will draw lines from the low point to the high point for uptrends and vice versa for downtrends.
3. Analyze Key Levels:
Pay attention to the key Fibonacci retracement levels, especially the most commonly used ones, which are 38.2%, 50%, and 61.8%. These levels are considered significant in determining potential support and resistance areas. The 23.6% and 78.6% levels are also used but are considered secondary.
4. Look for Confluence:
Consider other technical analysis tools and indicators to look for confluence at these Fibonacci retracement levels. For example, if a 50% retracement level coincides with a moving average or a trendline, it may strengthen the level's significance.
5. Monitor Price Action:
Watch how the stock's price reacts when it approaches these Fibonacci retracement levels. If the price stalls, reverses direction, or shows signs of consolidation around a particular level, it may act as support or resistance.
6. Set Entry and Exit Points:
Based on your analysis, you can set entry and exit points for your trades. Traders often look for buying opportunities near Fibonacci support levels and selling opportunities near resistance levels. Stop-loss orders can be placed just below support or above resistance levels to manage risk.
7. Practice Risk Management:
Always use proper risk management techniques in your trading. This includes setting stop-loss orders, determining your position size, and not risking more than you can afford to lose on a single trade.
8. Monitor Market Conditions:
Be aware that Fibonacci retracement levels are not foolproof and should be used in conjunction with other analysis methods and market conditions. Market sentiment, news events, and economic factors can also influence stock prices.
9. Continuously Learn and Adapt:
As with any trading strategy, it's essential to continuously learn and adapt. Test the effectiveness of Fibonacci retracement levels on different time frames and with different stocks to refine your trading strategy.
** Special Thanks to @KioseffTrading for doing most all of the HEAVY LIFTING on the code here... he is beyond a Top G!!
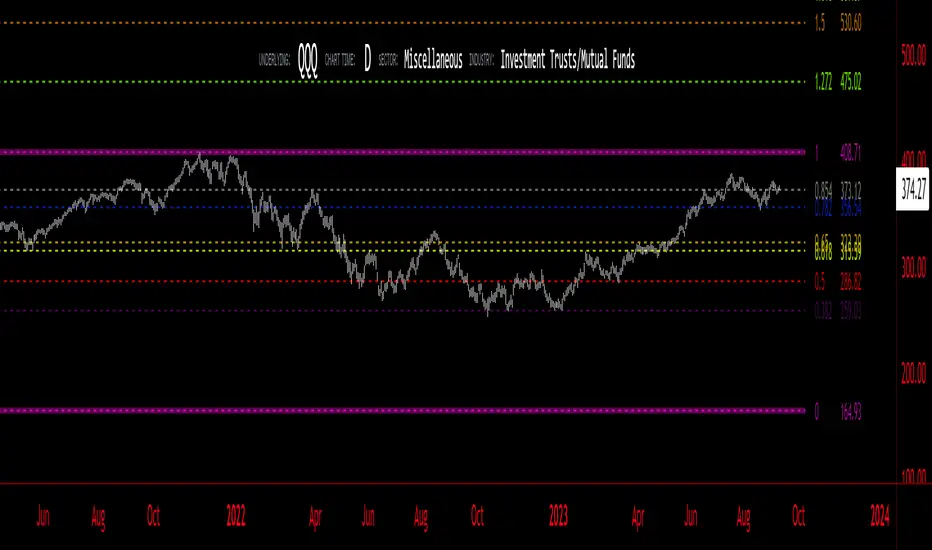
Fibonacci Ratios with Volatility(Weekly Time Frame.)Script is based on weekly time Frame. Fib ratios are drawn at the Open of the Market. Open price is compared with Previous week High , low and close. If weekly open is above Previous week high or low, Fib 0 % is plotted above High or the low as the case may be . If weekly open is between previous week high and low Fib 0% is equal to previous week Close and other fib ratios are plotted accordingly. As its vol based, works fantastically. This script is inspired by Fibonacci and Volatility script by PB GHOSH.
GreatBlueTradingTeam FibDev SignalsScript Purpose:
This script was designed to look for trend reversals and be used with other TA tools to help build confluence for day traders.
TA Used:
Without diverging too much information, this script relies on Highs, Lows, Opens, EMAs, Standard Deviations, Fib Numbers, and Fib Levels.
Script Overview:
First we look at the price action found on the Daily chart to create a set of zones using Fibs and Standard Deviations thats serves as our gauge on how far the price will move on any given day. Then, we create another set of zones ("intraday" zones if you will) that are built on much faster price action and relevant to the chart time period that is selected. These zones are also created using a combination of Fibs and Standard Deviations. From here, we compare the intraday price action with these two zones and look for areas where we feel overbought or oversold conditions are forming to create the bullish or bearish signals provided by the indicator.
Script Shortcomings:
Due to the fact this script is looking for breaks in trends, or trend reversals, it is subject to high risk especially in times of strong market trends where it could experience repeated failed signals. We recommend using this script in combination with other forms of TA for additional confluence as well as general market awareness that may influence trends and market behavior.
Script Access:
Please PM us to obtain information about accessing this script, or view our profile for contact information.

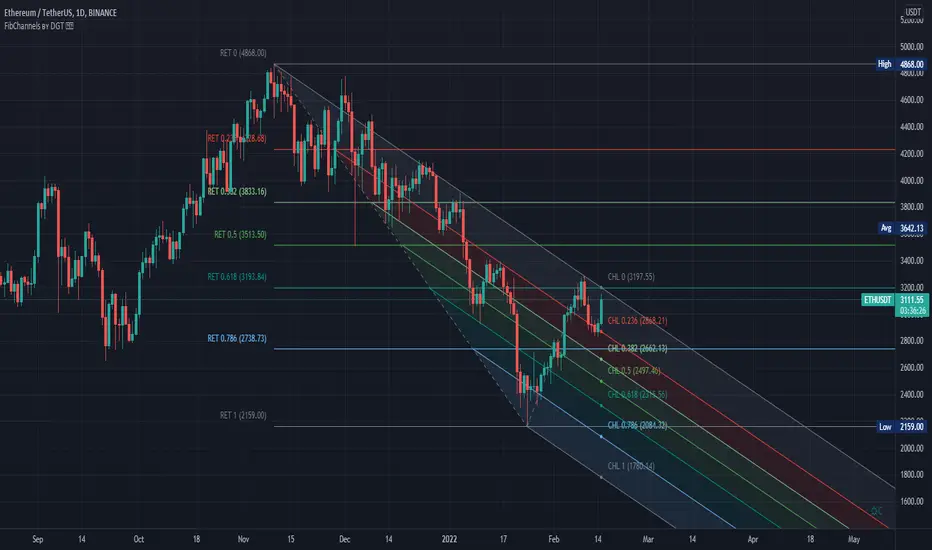
Auto Fib Channels by DGTThe Fibonacci Channel is a technical analysis tool that is used to estimate support and resistance levels based on the Fibonacci numbers. It is a variation of the Fibonacci retracement tool, except with the channel the lines run diagonally rather than horizontally.
This study will automatically place the channels where the levels indicate future areas of support and resistance
For further details please refer to education post
Nobody appears to know whether Fibonacci tools work because markets exhibit some form of natural pattern or because many investors use Fibonacci ratios to predict price movements, making them a self-fulfilling prophecy.
█ Study OPTIONS
Auto Fibonacci Channels , the main aim of the study
- Pivot threshold can be adjusted via “Deviation” and “Depth” input options
- Historical Channels / Retracements option will allow plotting of Channels on previous pivot high/lows
- Ability to set ALERTs for the Channel Levels
- Channel Labels displays the price of the line at the last bar, the price value will be updated in each new bar
Auto Fib Retracement – This is the build-in study of TradingView, customized to be in-line with Fibonacci Channels
- Pivot threshold can be adjusted via “Deviation” and “Depth” input options
- Historical Channels / Retracements option will allow plotting of Retracements on previous pivot high/lows
- Ability to set ALERTs for the Retracement Levels
Zig Zag – Derived from build-in Auto Fib Retracement with some customization options.
Disclaimer :
Trading success is all about following your trading strategy and the indicators should fit within your trading strategy, and not to be traded upon solely
The script is for informational and educational purposes only. Use of the script does not constitute professional and/or financial advice. You alone have the sole responsibility of evaluating the script output and risks associated with the use of the script. In exchange for using the script, you agree not to hold dgtrd TradingView user liable for any possible claim for damages arising from any decision you make based on use of the script
DMI+ADX w/ Slope Colour & Fib LevelsThis is a DMI+ADX with colours based on the slope of the plot, with Fibonacci levels.
It makes it easier to see what is happening with a quick glance. I have also added Fib levels as an experiment, but when doing some backtesting they seem to line up reasonably well with past price movements. They can be used to see possible reversal areas, or as thresholds to gauge how strong the trend is. Fibs play a big role in the markets for some reason and I have seen them applied to more than PA with good results, but I know it will not fit into every strategy. The more standard settings for the thresholds are 25,50,75 and you can change them to those if you want, but I suggest taking a look at the Fib version first.
The ADX smoothing is set up for Crypto trading on Mid to High TFs. If you are trading sub 1hour charts I would suggest changing it to 3-4. If you are trading traditional markets it is probably a good idea to have it set somewhere between 6-14 (default is 14), but I am not a professional so please do your own testing and research.
Colours:
ADX going up = Green
ADX going down = Red
DMI+ going up = Bright Aqua
DMI+ going down = Turquoise / Dark Aqua
DMI- going up = Bright Purple
DMI- going down = Dark Purple
(if someone finds a better colour system please let me know as it is tricky to get it looking good without being unicorn puke)
This is my first script and I am just beginning to learn PineScript so somethings may have been done in an unorthodox manner but I believe everything is working as it should, however, I am happy to make any improvements. I'm interested in what people think of the Fib levels on this indicator and would love to hear people opinions and results in the comments.

bg_FibCastVersion 1.0
A simple script to place horizontal lines where fib levels are, over a given period of candles, on a specified or charted time-frame. Includes the option to fib-retrace a "sub-zone" or the space between Fibonacci levels.
In The Depicted Example Above:
- Large white Fibonacci Lines from 377 Daily Candle Range, Gray "Sub-Fib" levels are plotted in "Zone 4" of the 377 1D Fib. Re-trace. (Zone 4 is between the 0.5 and 0.618, Zone 3 is between 0.618 and 0.786, etc.)
- Optional 1.618 Fib Extension is available for the main Fibonacci indicator, but is not shown here (Disabled/Hidden).
- Supports multiple time-frames, which is also depicted above. (377 Daily Candles used on 12-Hour chart.)

GoTiT|Simple Auto Fib v1.0Simple Auto Fib!
Notes:
1. Always set the trend manually! Don't rely on the auto trend detection.
2. The first parameter Length sets the number of candles back (left) to search for highs and lows from the current candle.
3. The High Offset parameter sets the number of candles back (left) to ignore/skip before searching for highs.
4. The Low Offset parameter sets the number of candles back (left) to ignore/skip before searching for lows.
5. The offset parameters change the behavior of the Length parameter.
Example 1:
Length = 100
High Offset = 0
Low Offset = 0
This is the default behavior, and the search for highs and lows occurs on the last 100 candles.
Example 2:
Length = 50
High Offset = 20 (Ignore the last 20 candles, and search for highs starting at candle 21 to 71 (or 50 candles back)
Low Offset = 15 (Ignore the last 15 candles, and search for lows starting at candle 16 to 66 (or 50 candles back)
In example 2, search starts on candle 21 for highs, and candle 16 for lows and extends 50 candles further back from there.
6. The Trend Detection parameter sets the number of candles back (left) to use in the trend calculations. Larger values give better "marco trend" detection. Smaller values give better "micro trend" detection. See note #1.
7. The white fib line is fib0. Assuming you correctly set the trend manually (or the trend is auto detected correctly), in a downtrend fib0 should be bellow the red fib line, and in an uptrend fib0 should be above the red fib line.

HI-LOW fibThis model show the price and its relation to fib levels in a diffrent way
also easy to put inside other indicator like rsi ,dmi stoch etc ...
the lines represents the fib level and the price will go from low to high fib and vice versa
so it a different way to look on the fibs in a graph

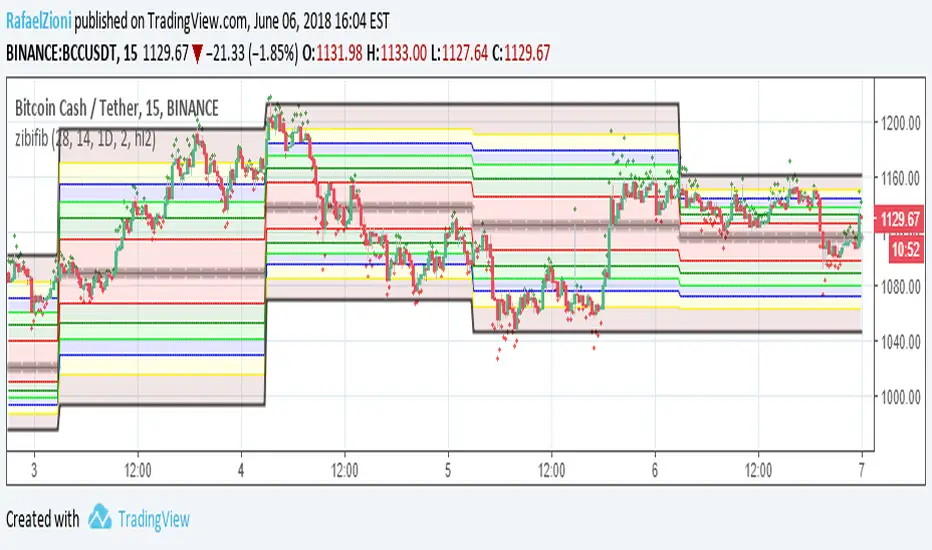
zibi fib smart way to use daily fib the idea based on using zibi indicator which is hipotecal price based on volume and to apply it to daily fib chart. zibi is preeceding the real price candle as it sense the volume changes not the actual price. buy is when zibi bellow -100 and sell when zibi above +100 . can be set to any fib that you choose. signal is easy to set via trading view. also the movment of zibi will tell you where the price will go as volume preceds price:)
the daily fib based on the work of justuncle
SMC Fib Range Signals [@gyanapravah]SMC Fib Range Signals
This indicator blends Smart Money Concepts (SMC) with a Range Filter Trend System and Fibonacci Retracement & Extensions to generate high-probability automated Buy/Sell signals.
Designed to avoid noise and focus on market structure + trend + price confluence, this tool is ideal for:
1. Intraday traders
2. Swing traders
3. Index & stock traders
4. Crypto & Forex traders
CORE FEATURES
Range Filter Trend Detection
Smooth adaptive filter identifies true trend direction
Visual confirmation:
🟢 Green filter = bullish pressure
🔴 Red filter = bearish pressure
🟡 Yellow filter = neutral
Upper & Lower Bands act as dynamic support/resistance zones
Smart Money Order Blocks (SMC)
Automatically detects important pivot highs & lows
Marks:
OB High → supply / resistance zone
OB Low → demand / support zone
Continuously tracks latest OB levels for live price interaction
Fibonacci Engine
Detects the current swing zone and plots:
Retracement levels
0.236 – 0.382 – 0.500 – 0.618 – 0.786 (editable)
Extension targets
1.272 – 1.618
All levels update dynamically on new market structure and pivots.
SIGNAL ENGINE
This indicator generates signals from three independent confirmation systems:
BUY SIGNALS trigger when:
1. Trend flips bullish (price crosses above the Filter)
2.Bullish trend + price reacts near:
Order Block support
Fibonacci 0.382 / 0.618 levels
Bounce from the Lower Band with trend support
All setups require volume confirmation to filter fake breakouts.
SELL SIGNALS trigger when:
1. Trend flips bearish (price crosses below the Filter)
2. Bearish trend + price reacts near:
Order Block resistance
Fibonacci 0.382 / 0.618 levels
Rejection from the Upper Band with trend support
ALERTS READY
Two built-in alerts:
BUY Alert — fires on bullish signal
SELL Alert — fires on bearish signal
INPUT SETTINGS
Trend Engine
1.Source
2.Sampling Period
3.Range Multiplier
Smart Money
Pivot detection sensitivity (Left / Right bars)
Fibonacci
1.Swing lookback length
2.Editable Fib retracement and extension values
3.Toggle show/hide Fib levels
BEST USE CASE
Works extremely well on:
⏱️ 3M – 15M Intraday scalping
⏱️ 30M – 1H positional entries
⏱️ 4H – D1 swing trading
Tested on:
NIFTY / BANKNIFTY / FINNIFTY
Stocks
Crypto
Forex
DISCLAIMER
This indicator is for educational purposes only.
It does NOT guarantee profits.
Always use:
Proper risk management
Stop-loss rules
Your own confirmation before entering trades.
AUTHOR
Built & shared by @gyanapravah (Odisha, India)
Open-source for learning and community improvement.

Metallic Retracement LevelsThere's something that's always bothered me about how traders use Fibonacci retracements. Everyone treats the golden ratio like it's the only game in town, but mathematically speaking, it's completely arbitrary. The golden ratio is just the first member of an infinite family of metallic means, and there's no particular reason why 1.618 should be special for markets when we have the silver ratio at 2.414, the bronze ratio at 3.303, and literally every other metallic mean extending to infinity. We just picked one and decided it was magical.
The metallic means are a sequence of mathematical constants that generalize the golden ratio. They're defined by the equation x² = kx + 1, where k is any positive integer. When k equals 1, you get the golden ratio. When k equals 2, you get the silver ratio. When k equals 3, you get bronze, and so on forever. Each metallic mean generates its own set of ratios through successive powers, just like how the golden ratio gives you 0.618, 0.382, 0.236 and so forth. The silver ratio produces a completely different set of retracement levels, as does bronze, as does any arbitrary metallic number you want to choose.
This indicator calculates these metallic means using the standard alpha and beta formulas. For any metallic number k, alpha equals (k + sqrt(k² + 4)) / 2, and we generate retracement ratios by raising alpha to various negative powers. The script algorithmically generates these levels instead of hardcoding them, which is how it should have been done from the start. It's genuinely silly that most fib tools just hardcode the ratios when the math to generate them is straightforward. Even worse, traditional fib retracements use 0.5 as a level, which isn't even a fibonacci ratio. It's just thrown in there because it seems like it should be important.
The indicator works by first detecting swing points using the Sylvain Zig-Zag . The zig-zag identifies significant price swings by combining percentage change with ATR adjustments, filtering out noise and connecting major pivot points. This is what drives the retracement levels. Once a new swing is confirmed, the script calculates the range between the last two pivot points and generates metallic retracement levels from the most recent swing low or high.
You can adjust which metallic number to use (golden, silver, bronze, or any positive integer), control how many power ratios to display above and below the 1.0 level, and set how many complete retracement cycles you want drawn. The levels extend from the swing point and show you where price might react based on whichever metallic mean you've selected. The zig-zag settings let you tune the sensitivity of swing detection through ATR period, ATR multiplier, percentage reversal, and additional absolute or tick-based reversal values.
What this really demonstrates is that retracement analysis is more flexible than most traders realize. There's no mathematical law that says markets must respect the golden ratio over any other metallic mean. They're all valid mathematical constructs with the same kind of recursive properties. By making this tool, I wanted to highlight that using fibonacci retracements involves an arbitrary choice, and maybe that choice should be more deliberate or at least tested against alternatives. You can experiment with different metallic numbers and see which ones seem to work better for your particular market or timeframe, or just use this to understand that the standard fib levels everyone uses aren't as fundamental as they appear.

Uncharted Territory Fibs📘 Uncharted Territory Fibs
Advanced Fibonacci Projection & Confluence Indicator
(Protected Source)
🧭 Overview
Uncharted Territory Fibs is a next-generation Fibonacci projection system designed for identifying high-probability confluence zones when price enters uncharted territory — areas beyond previous highs or lows.
It automatically detects valid swing pivots, determines trend bias, and plots Fibonacci extensions and projections with built-in cluster logic to highlight the single most powerful confluence level.
⚙️ Core Features
Automatic Trend Bias:
Determines direction using either manual Up/Down selection or EMA-based “Auto” bias detection.
Swing-Based Anchoring:
Uses confirmed pivot highs and lows (non-repainting) to define valid swing legs for Fibonacci mapping.
Fibonacci Extensions & Projections:
Extensions: 1.272, 1.618, 2.618, 4.236
Projections (symmetry): 1.0 and 1.618
These levels map both impulse continuation and symmetry targets.
Cluster Engine:
Groups nearby Fibonacci levels within a user-defined tolerance, identifies the zone with the highest confluence, and designates it as the Prime Level.
Secondary targets are spaced apart for cleaner visualization.
Smart Visualization:
Lines are anchored directly to the last confirmed swing pivot.
Fixed-length projection (default 20 bars) ensures levels stay visually stable.
Labels display exact price and ratio type.
Optional price-scale markers and alert triggers.
Alerts Built-In:
“Near Prime Confluence” alert when price approaches key zone.
“Cross Prime Confluence” alert when price breaks through the zone.
🎯 How to Use
Apply on higher-timeframe charts (4H, Daily, or Weekly recommended).
Choose bias mode: Auto, Uptrend, or Downtrend.
Adjust swing sensitivity (pivot left/right bars).
Toggle which Fibonacci ratios to include.
Tune cluster tolerance and spacing to refine precision.
Watch for Prime Confluence zones forming above or below structure — potential reversal or breakout targets.
Set alerts for automated notifications near critical levels.
💡 Why It’s Different
Unlike basic Fibonacci tools that simply project multiple overlapping lines, Uncharted Territory Fibs performs real-time mathematical clustering to isolate the most statistically dense confluence level — simplifying complex multi-leg Fibonacci relationships into a single actionable zone.
The result: fewer lines, higher confidence, and cleaner market structure visualization when price explores new highs or lows.
🔐 Protected Source Notice
This indicator is released as a Protected Script to preserve proprietary clustering and swing-selection logic.
All calculations, alerts, and visuals are fully functional for users, while the underlying algorithm remains secured.
This complies with TradingView’s publishing standards for unique and non-trivial closed-source scripts.
⚠️ Disclaimer
This tool is for educational and analytical purposes only.
It does not provide financial advice or guarantee performance.
Always perform your own analysis and manage risk accordingly.
🏷 Credits
Concept inspired by Carolyn Boroden’s Fibonacci work and expanded with custom clustering logic and pivot-anchoring methodology for high-timeframe projection analysis.

Fibonacci Sequence Moving Average [BackQuant]Fibonacci Sequence Moving Average with Adaptive Oscillator
1. Overview
The Fibonacci Sequence Moving Average indicator is a two‑part trading framework that combines a custom moving average built from the famous Fibonacci number set with a fully featured oscillator, normalisation engine and divergence suite. The moving average half delivers an adaptive trend line that respects natural market rhythms, while the oscillator half translates that trend information into a bounded momentum stream that is easy to read, easy to compare across assets and rich in confluence signals. Everything from weighting logic to colour palettes can be customised, so the tool comfortably fits scalpers zooming into one‑minute candles as well as position traders running multi‑month trend following campaigns.
2. Core Calculation
Fibonacci periods – The default length array is 5, 8, 13, 21, 34. A single multiplier input lets you scale the whole family up or down without breaking the golden‑ratio spacing. For example a multiplier of 3 yields 15, 24, 39, 63, 102.
Component averages – Each period is passed through Simple Moving Average logic to produce five baseline curves (ma1 through ma5).
Weighting methods – You decide how those five values are blended:
• Equal weighting treats every curve the same.
• Linear weighting applies factors 1‑to‑5 so the slowest curve counts five times as much as the fastest.
• Exponential weighting doubles each step for a fast‑reacting yet still smooth line.
• Fibonacci weighting multiplies each curve by its own period value, honouring the spirit of ratio mathematics.
Smoothing engine – The blended average is then smoothed a second time with your choice of SMA, EMA, DEMA, TEMA, RMA, WMA or HMA. A short smoothing length keeps the result lively, while longer lengths create institution‑grade glide paths that act like dynamic support and resistance.
3. Oscillator Construction
Once the smoothed Fib MA is in place, the script generates a raw oscillator value in one of three flavours:
• Distance – Percentage distance between price and the average. Great for mean‑reversion.
• Momentum – Percentage change of the average itself. Ideal for trend acceleration studies.
• Relative – Distance divided by Average True Range for volatility‑aware scaling.
That raw series is pushed through a look‑back normaliser that rescales every reading into a fixed −100 to +100 window. The normalisation window defaults to 100 bars but can be tightened for fast markets or expanded to capture long regimes.
4. Visual Layer
The oscillator line is gradient‑coloured from deep red through sky blue into bright green, so you can spot subtle momentum shifts with peripheral vision alone. There are four horizontal guide lines: Extreme Bear at −50, Bear Threshold at −20, Bull Threshold at +20 and Extreme Bull at +50. Soft fills above and below the thresholds reinforce the zones without cluttering the chart.
The smoothed Fib MA can be plotted directly on price for immediate trend context, and each of the five component averages can be revealed for educational or research purposes. Optional bar‑painting mirrors oscillator polarity, tinting candles green when momentum is bullish and red when momentum is bearish.
5. Divergence Detection
The script automatically looks for four classes of divergences between price pivots and oscillator pivots:
Regular Bullish, signalling a possible bottom when price prints a lower low but the oscillator prints a higher low.
Hidden Bullish, often a trend‑continuation cue when price makes a higher low while the oscillator slips to a lower low.
Regular Bearish, marking potential tops when price carves a higher high yet the oscillator steps down.
Hidden Bearish, hinting at ongoing downside when price posts a lower high while the oscillator pushes to a higher high.
Each event is tagged with an ℝ or ℍ label at the oscillator pivot, colour‑coded for clarity. Look‑back distances for left and right pivots are fully adjustable so you can fine‑tune sensitivity.
6. Alerts
Five ready‑to‑use alert conditions are included:
• Bullish when the oscillator crosses above +20.
• Bearish when it crosses below −20.
• Extreme Bullish when it pops above +50.
• Extreme Bearish when it dives below −50.
• Zero Cross for momentum inflection.
Attach any of these to TradingView notifications and stay updated without staring at charts.
7. Practical Applications
Swing trading trend filter – Plot the smoothed Fib MA on daily candles and only trade in its direction. Enter on oscillator retracements to the 0 line.
Intraday reversal scouting – On short‑term charts let Distance mode highlight overshoots beyond ±40, then fade those moves back to mean.
Volatility breakout timing – Use Relative mode during earnings season or crypto news cycles to spot momentum surges that adjust for changing ATR.
Divergence confirmation – Layer the oscillator beneath price structure to validate double bottoms, double tops and head‑and‑shoulders patterns.
8. Input Summary
• Source, Fibonacci multiplier, weighting method, smoothing length and type
• Oscillator calculation mode and normalisation look‑back
• Divergence look‑back settings and signal length
• Show or hide options for every visual element
• Full colour and line width customisation
9. Best Practices
Avoid using tiny multipliers on illiquid assets where the shortest Fibonacci window may drop under three bars. In strong trends reduce divergence sensitivity or you may see false counter‑trend flags. For portfolio scanning set oscillator to Momentum mode, hide thresholds and colour bars only, which turns the indicator into a heat‑map that quickly highlights leaders and laggards.
10. Final Notes
The Fibonacci Sequence Moving Average indicator seeks to fuse the mathematical elegance of the golden ratio with modern signal‑processing techniques. It is not a standalone trading system, rather a multi‑purpose information layer that shines when combined with market structure, volume analysis and disciplined risk management. Always test parameters on historical data, be mindful of slippage and remember that past performance is never a guarantee of future results. Trade wisely and enjoy the harmony of Fibonacci mathematics in your technical toolkit.
