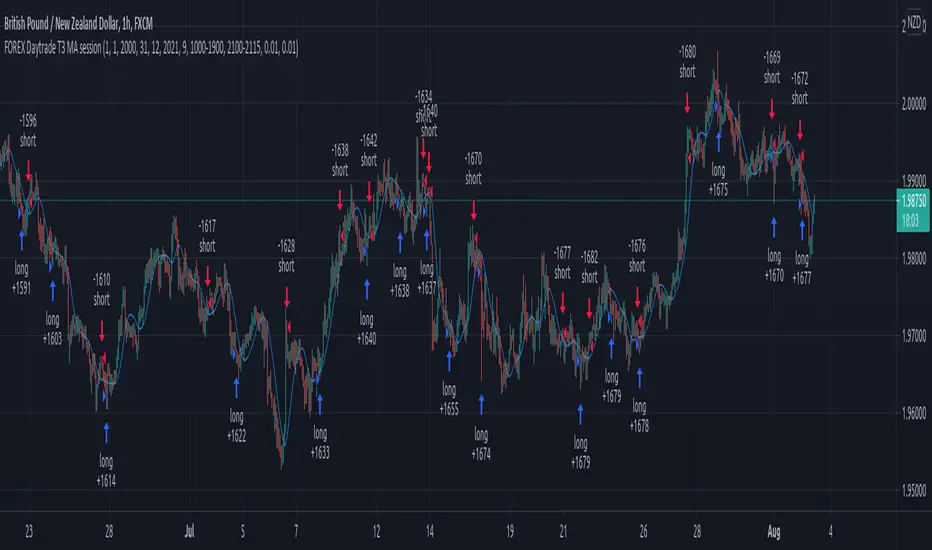
Forex Daytrade T3 MA sessionThis is a simple yet very efficient daytrading strategy for most crosses pairs, like EUR/NZD, EUR/AUD , GBP/NZD, GBP/AUD and so on.
It tends to works best with 1h and 15 min time frame charts.
Its components are :
Entry time = session that we want to trade, where we can combine for example half of London and all of NY using an hour system.
T3 Moving average
Price action.
Rules for entry
For long , we are during the hours we want to trade, current close is price is above previous high and at the same time is above moving average
For short , we are during the hours we want to trade, current close is price is below previous low and at the same time is below moving average
Rules for exit
We exit when either the opposite condition is triggered, if the hours of trading are off or based on a percentage TP/SL system movement.
For this example we use 1% movement both for TP and SL
If you have any questions, let me know !
Cerca negli script per "forex"
Forex Strong Weak Analysis
Forex Strong/Weak Analysis
Derived from Dennis3450 thread on babypips.com - See thread here: forums.babypips.com
Synopsis: This script compares the current price to the 200 period simple moving average on the 4-hour chart of the seven major Japanese Yen currency pairs and plots the results in order to determine their relative strength.

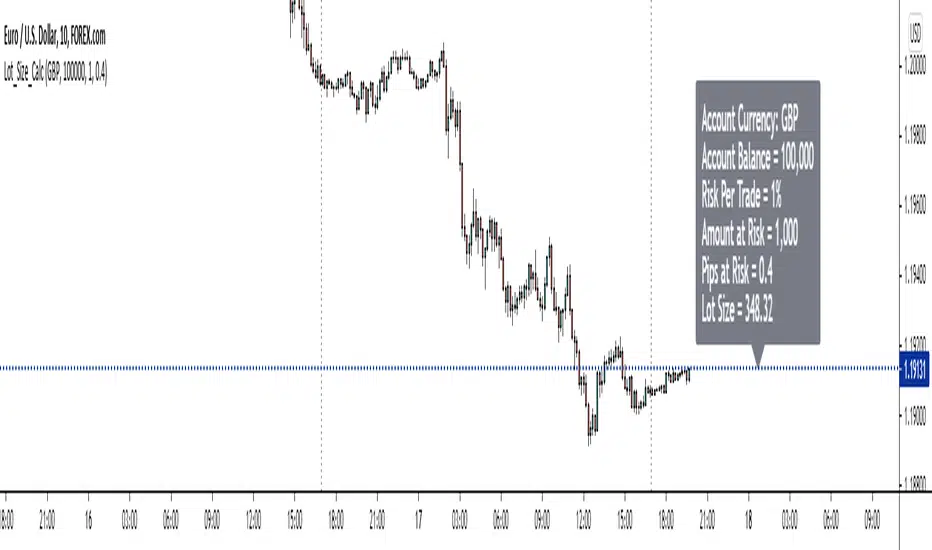
Forex Position Size CalculatorThe purpose of this position size calculator is to assist fellow traders in their position size calculations straight from tradingview without having to rely on other apps or websites.
Account balance in the 8 major currency pairs are also available as an input option (i.e. if the account balance is based in pounds, dollars, euros, it can be selected).
Right now this only works on the 28 forex cross currency pairs. At a later date, the indicator will be updated to handle exotic pairs, commodities, and gold.
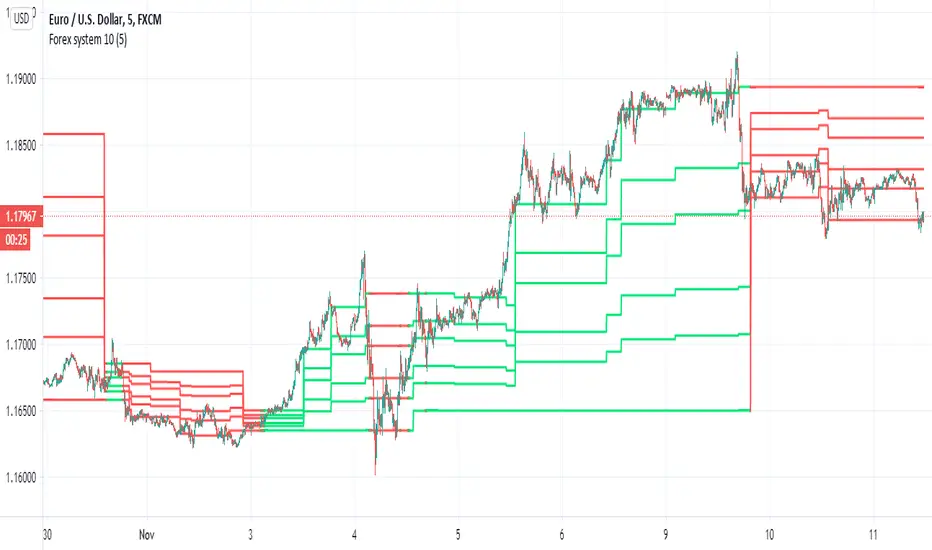
Forex system 10This is old method I used in the past for forex
can be apply to any time frame . can be apply to any asset
all you have to do is to follow the colors (red =sell, green=buy)
the system is my modification to fibs system in order to make it more accurate
here is example of setting for 5 min chart
the color determine by cross of the median of high and low
the script try to give us more accurate levels of resistance and support levels especially when we do it in lower TF
the Min is the control need to be same or higher then chart
60 min chart for example
gold 60 min
btc
another forex example 15 min
here 60 min TF on 5 min chart on crypto link
Forex Session Breaks DST AWARE!There seems to be no open source forex trading session DST (Daylight Savings Time) aware scripts which I think is absurd. This amazing community deserves better. So I adapted some code by icostan adding DST capabilities.
Original code by icostan here
I added DST code. Warning may not be perfect yet. Could be a bug or two. It only supports 3 major sessions right now but you can add your own rules for the other timezones by copying my logic.
It is open source so please add the other sessions and regions as needed and update me please.

Forex Market OpenThis script is to highlight the first candle of weekly forex market open. Only works at UTC-4 Exchange.


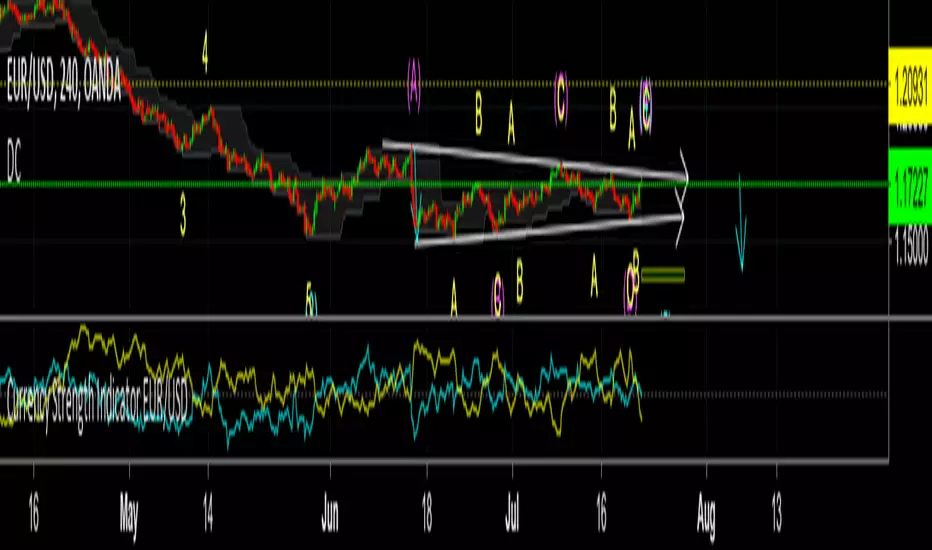
forex dema rsiSo how to use this system
since in forex one currency is dependent on the other currency we can make nice prediction using this dependency
here i put DEMA RSI
one will show you the current asset , the other one will be the oposite
so if the graph is JPY /USD , the oppsite need to be USD/JPY
put the TF either on the sametime of the graph or higher
if you want to change pairs -just in symbol change it to what you looking (the opposite ) and upload the script to see difference
here 15 min graph of USD/EURO pairs
and 4 hour graph of same pair

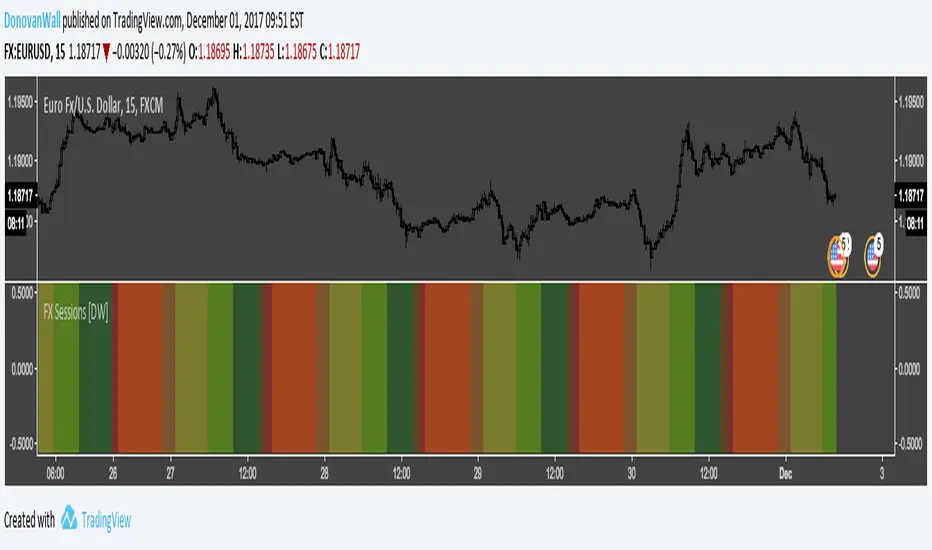
Forex Daily Trading Sessions [DW]This is a simple study designed to highlight the daily forex market sessions. Use it to identify the best sessions to trade your security in.
Forex session - Opening Range- Jayy fixed updatedOpening Range (OR) for Forex 24 hour regular session. This is not for regular market day sessions addressed in a separate script.
This script fixes four issues:
syntax error when code compiles
messed up opening range the day after a holiday Monday
flaky plotting of the opening range and targets that required page reloading
TradingView problems with starting forex session at 1700 hours EST/EDT when using certain securities eg FX_IDC currently (Jan 2017)
Additions in his code are more options for trading range
Time compensation option for some securities that incorrectly start sessions at 1200 hrs instead of 1700 hrs NY time
- this glitch is likely temporary but present when this script update was created
More opening range time period choices
Opening Range Targets:
Opening Range Targets as per Leaf_West
Targets are set at 127% , 162%, 200 %, 262 %, 362%, 423%, 685%, 1109% and 1794% and this can be traded intraday using methods described here charts-by-leaf.com I also have some Leaf West PDFs that describe how the targets are set and how they are traded. There are others that use opening range.
The Time Session Glitch and the Fix:
The script will correctly default to 1700 hrs to 1700hrs EDT/EST session for FXCM.
Strangely some securities appear to erroneously start their session at 1200 hrs ie. My guess is that they are somehow tied to GMT+0 instead of New York time (GMT+5). See this for yourself by selecting EURUSD using the FXCM exchange (FX:EURUSD) and then EURUSD from the IDC exchange (FX_IDC:EURUSD). The FX-IDC session opening range starts 5 hours
before it actually should at 1700 hrs EDT/EST. To correct for this I have implemented an automatic fix (default) and a user selected "5 hour time shift adjust. ment needed on some securities".
There is also a 4 hour time shift button which might be necessary when New York reverts from Eastern Standard Time
to Eastern Daylight Time (1 hour difference) in March (and then back again in November). In the default auto adjust mode you will need to select the 1 hour time shift. That is if this glitch still exists at that time.
I have looked at other scripts, other than my own and where the script is available, that need to use information about the opening bar and all have the same time shift issue
What are the choices for Opening Range?
The dialogue box offers the standard TradingView options.
Also where you see Pick Opening Range 1 to 12 hours , SET TO 0 To USE LINE ABOVE TO DETERMINE OR LENGTH
As the note says a number other than 0 will override the standard options from the line above
The dialogue box below in offers choices by hours 1 to 12. A number greater than 12 will still only give
720 minutes (12 hours) for the length of Opening Range.
What sessions within the FOREX time-frame are available?
The default is 1700 hours to 1700 hours EST/EDT
Check any one (only one) of the time periods to change the opening range period to suit.
New York opens at 8:00 am to 5:00 pm EST (EDT)
Tokyo opens at 7:00 pm to 4:00 am EST (EDT)
Sydney opens at 5:00 pm to 2:00 am EST (EDT)
London opens at 3:00 am to 12:00 noon EST (EDT)
There is a build your own session (click the button to select)
The two lines for inputting session times are almost identical except that the second line starts the be the same as each other.
The default for the build your own session is 2200 hours to 2200 hours. As of the time of publishing this plots EURUSD FX-IDC just right. The GMT+5 and GMT+4 do not apply to this selection.
See my comments above on this strange aberration.
The script originated from work done by Chris Moody. It has changed significantly but there are remnants of that script lurking within.
Script is free to all - that way you can see what is inside
Cheers Jayy

Big Shadow by Walter Peters v1.1Version 1.1 is here!
This is an indicator for the Big Shadow (engulfing candle) that Walter Peters teaches in his course (fxjake.com) and book "Naked Forex". I have really been diving into this one and back testing it like crazy. The results have been great and I will be publishing them on the nakedforexnow.com forum soon since it probably isn't appropriate to do it here.
If you like it, please reach out to me @fredferrell on the forum. I would love to discuss back testing results with other traders.

Daily Levels Percentual [TOLK] Settings Crypto and ForexPercentage zones refer to specific areas or bands on the price chart of a financial asset that are bounded by percentages of change relative to a reference point, such as the opening price or a reference value from a previous move.
These zones are useful for identifying support and resistance levels, predicting possible price reversals, or setting price targets. For example, on a price chart, you can create percentage zones to observe how the price behaves when it reaches 1%, 2%, 5%, 10%, etc., above or below a certain point.
These zones can be used in conjunction with other technical analysis tools, such as Fibonacci, moving averages, or volume analysis, to improve decision-making in trading strategies.
The default indicator levels are as follows:
SETTINGS Crypto:
Crypto Level 1 > 1.0%
Crypto Level 2 > 1.618%
Crypto Level 3 > 2.0%
Crypto Level 4 > 2.618%
Crypto Level 5 > 3.618%
Crypto Level 6 > 4.618%
Crypto Level 7 > 5.0%
Crypto Level 8 > 7.618%
Crypto Level 9 > 10.0%
Crypto Level 10 > 12.618%
Crypto Level 11 > 13.618%
Crypto Level 12 > 15%
Crypto Level 13 > 17.618%
Crypto Level 14 > 20%
SETTINGS Forex:
Forex Level 1 > 0.10%
Forex Level 2 > 0.1618%
Forex Level 3 > 0.20%
Forex Level 4 > 0.2618%
Forex Level 5 > 0.3618%
Forex Level 6 > 0.4618%
Forex Level 7 > 0.50%
Forex Level 8 > 0.7618%
Forex Level 9 > 1.0%
Forex Level 10 > 1.2618%
Forex Level 11 > 1.3618%
Forex Level 12 > 1.50%
Forex Level 13 > 1.7618%
Forex Level 14 > 2.0%
Percentage Levels This approach helps identify critical price levels where the asset may encounter support or resistance, making it easier to make trading decisions based on price movement patterns.

Three Bar Exit Trailing Stop - Naked Forex: Price ActionThree Bar Exit Trailing Stop - Naked Forex: Exit indicator based on price action. The naked trader locks in profit by trailing the stop loss behind the lowest low of the last three candlesticks (for buy trades) or above the highest high of the last three candlesticks (For sell trades)

Cowabunga System from babypips.comPlease do read the information below as well, especially if you are new to Forex.
The Cowabunga System is a type of Mechanical Trading System that filters trades based on the trend of the 4 hour chart with EMAs and some other familiar indicators (RSI, Stochastics and MACD) while entering trades base on 15 minute chart.
I have coded (quite amateurishly) the basic system onto a 15 minute chart (the 4 hour settings are coded as well). The author says the system is to be traded off the 15 minute chart with the 4 hour chart only as a reference for trend direction.
4 Hour Chart Settings
5 EMA
10 EMA
Stochastics (10,3,3)
RSI (9)
Then we move onto the 15 minute chart, where he gives us the trade entry rules.
15 Minute Chart Settings
5 EMA
10 EMA
Stochastics (10,3,3)
RSI (9)
MACD (12,26,9)
Entry Rules - long entry rules used, obviously reverse these for shorting.
1. EMA must cross above the 10 EMA.
2. RSI must be greater than 50 and not overbought.
3. Stochastic must be headed up and not be in overbought territory.
4. MACD histogram must go from negative to positive OR be negative and start to increase in value.
What I did.
1. Set the RSI and Stochastic levels to avoid entries when they indicate overbought conditions for long and oversold conditions for short (80 and 20 levels).
2. Users can input specific times they want to backtest.
3. User's can configure profit targets, trailing stops and stops. Default is set it to was 100 pips profit target with a 40 pip trailing stop. (Note, when you are changing these values, please note that each pip is worth 10, so 100 pips is entered as 1000.)
The Cowabunga System from babypips.com is another popular and active system. The author, Pip Surfer, continues to post wins and losses with this system. It shows there is a lot of honesty and integrity with this system if the author keeps up to date even 10 years later and is not afraid of sharing the times the system causes losses.
As an example of this, here is post he shared just last week . It's almost like a journal, he gives specific times and reasons why he entered, lets the readers know when he was stopped out, etc. I think that what he does is equally important as his system.
To read more about this system, visit the thread on babypips.com, click here.

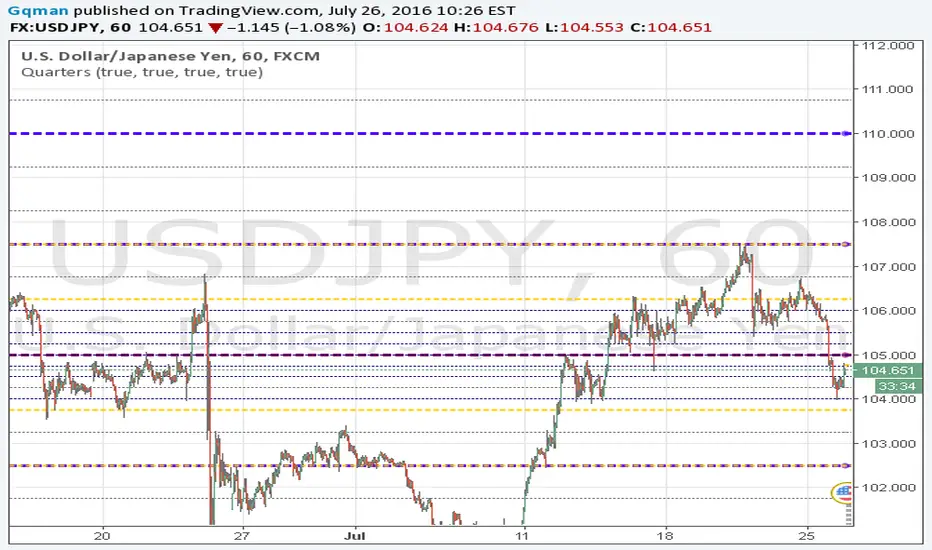
Quarters v2Quarters Theory v2
Quarters Theory automatically plotted for you on your chart. This theory is primary on forex pairs. Major quarters, Minor quarters, quarters, and hesitation zones all plotting. Please refer to the inputs on their color. (still having a fill issues with the hesitation zone)
Auto Position CalculatorA position sizing tool that automatically detects the instrument you're trading and calculates the correct position size based on your risk parameters.
What It Does
This indicator calculates how many contracts, lots, or shares to trade based on your account size, risk percentage, and stop loss distance. It auto-detects the instrument type and adjusts the point/pip value accordingly.
Supported Instruments
Futures: NQ, MNQ, ES, MES, YM, MYM, RTY, M2K, CL, MCL, GC, MGC
Forex: All major pairs (USD, EUR, GBP, JPY, etc.)
Index CFDs: NAS100, US500, US30, GER40, UK100
Metals: XAU, XAG
Crypto and Stocks: Automatic detection
How to Use
Set your account size and risk % in settings
Click the settings icon and place Entry, Stop Loss, and Take Profit on the chart
The position size and risk calculations appear automatically
Levels auto-reset at your chosen session (Asia, London, or New York open)
Limitations
CFD and forex pip values assume standard lot sizing - your broker may differ
Auto-detection relies on ticker naming conventions, which vary by broker/data feed
Session reset times are based on ET (Eastern Time)

Smart MACD Volume Trader# Smart MACD Volume Trader
## Overview
Smart MACD Volume Trader is an enhanced momentum indicator that combines the classic MACD (Moving Average Convergence Divergence) oscillator with an intelligent high-volume filter. This combination significantly reduces false signals by ensuring that trading signals are only generated when price momentum is confirmed by substantial volume activity.
The indicator supports over 24 different instruments including major and exotic forex pairs, precious metals (gold and silver), energy commodities (crude oil, natural gas), and industrial metals (copper). For forex and commodity traders, the indicator automatically maps to CME and COMEX futures contracts to provide accurate institutional-grade volume data.
## Originality and Core Concept
Traditional MACD indicators generate signals based solely on price momentum, which can result in numerous false signals during low-activity periods or ranging markets. This indicator addresses this critical weakness by introducing a volume confirmation layer with automatic institutional volume integration.
**What makes this approach original:**
- Signals are triggered only when MACD crossovers coincide with elevated volume activity
- Implements a lookback mechanism to detect volume spikes within recent bars
- Automatically detects and maps 24+ forex pairs and commodities to their corresponding CME and COMEX futures contracts
- Provides real institutional volume data for forex pairs where spot volume is unreliable
- Combines two independent market dimensions (price momentum and volume) into a single, actionable signal
- Includes intelligent asset detection that works across multiple exchanges and ticker formats
**The underlying principle:** Volume validates price movement. When institutional money enters the market, it creates volume signatures. By requiring high volume confirmation and using actual institutional volume data from futures markets, this indicator filters out weak price movements and focuses on trades backed by genuine market participation. The automatic futures mapping ensures that forex and commodity traders always have access to the most accurate volume data available, without manual configuration.
## How It Works
### MACD Component
The indicator calculates MACD using standard methodology:
1. **Fast EMA (default: 12 periods)** - Tracks short-term price momentum
2. **Slow EMA (default: 26 periods)** - Tracks longer-term price momentum
3. **MACD Line** - Difference between Fast EMA and Slow EMA
4. **Signal Line (default: 9-period SMA)** - Smoothed average of MACD line
**Crossover signals:**
- **Bullish:** MACD line crosses above Signal line (momentum turning positive)
- **Bearish:** MACD line crosses below Signal line (momentum turning negative)
### Volume Filter Component
The volume filter adds an essential confirmation layer:
1. **Volume Moving Average** - Calculates exponential MA of volume (default: 20 periods)
2. **High Volume Threshold** - Multiplies MA by ratio (default: 2.0x or 200%)
3. **Volume Detection** - Identifies bars where current volume exceeds threshold
4. **Lookback Period** - Checks if high volume occurred in recent bars (default: 5 bars)
**Signal logic:**
- Buy/Sell signals only trigger when BOTH conditions are met:
- MACD crossover/crossunder occurs
- High volume detected within lookback period
### Automatic CME Futures Integration
For forex traders, spot FX volume data can be unreliable or non-existent. This indicator solves this problem by automatically detecting forex pairs and mapping them to corresponding CME futures contracts with real institutional volume data.
**Supported Major Forex Pairs (7):**
- EURUSD → CME:6E1! (Euro FX Futures)
- GBPUSD → CME:6B1! (British Pound Futures)
- AUDUSD → CME:6A1! (Australian Dollar Futures)
- USDJPY → CME:6J1! (Japanese Yen Futures)
- USDCAD → CME:6C1! (Canadian Dollar Futures)
- USDCHF → CME:6S1! (Swiss Franc Futures)
- NZDUSD → CME:6N1! (New Zealand Dollar Futures)
**Supported Exotic Forex Pairs (4):**
- USDMXN → CME:6M1! (Mexican Peso Futures)
- USDRUB → CME:6R1! (Russian Ruble Futures)
- USDBRL → CME:6L1! (Brazilian Real Futures)
- USDZAR → CME:6Z1! (South African Rand Futures)
**Supported Cross Pairs (6):**
- EURJPY → CME:6E1! (Uses Euro Futures)
- GBPJPY → CME:6B1! (Uses British Pound Futures)
- EURGBP → CME:6E1! (Uses Euro Futures)
- AUDJPY → CME:6A1! (Uses Australian Dollar Futures)
- EURAUD → CME:6E1! (Uses Euro Futures)
- GBPAUD → CME:6B1! (Uses British Pound Futures)
**Supported Precious Metals (2):**
- Gold (XAUUSD, GOLD) → COMEX:GC1! (Gold Futures)
- Silver (XAGUSD, SILVER) → COMEX:SI1! (Silver Futures)
**Supported Energy Commodities (3):**
- WTI Crude Oil (USOIL, WTIUSD) → NYMEX:CL1! (Crude Oil Futures)
- Brent Oil (UKOIL) → NYMEX:BZ1! (Brent Crude Futures)
- Natural Gas (NATGAS) → NYMEX:NG1! (Natural Gas Futures)
**Supported Industrial Metals (1):**
- Copper (COPPER) → COMEX:HG1! (Copper Futures)
**How the automatic detection works:**
The indicator intelligently identifies the asset type by analyzing:
1. Exchange name (FX, OANDA, TVC, COMEX, NYMEX, etc.)
2. Currency pair pattern (6-letter codes like EURUSD, GBPUSD)
3. Commodity identifiers (XAU for gold, XAG for silver, OIL for crude)
When a supported instrument is detected, the indicator automatically switches to the corresponding futures contract for volume analysis. For stocks, cryptocurrencies, and other assets, the indicator uses the native volume data from the current chart.
**Visual feedback:**
An information table appears in the top-right corner of the MACD pane showing:
- Current chart symbol
- Exchange name
- Currency pair or asset name
- Volume source being used (highlighted in orange for futures, yellow for native volume)
- Current high volume status
This provides complete transparency about which data source the indicator is using for its volume analysis.
## How to Use
### Basic Setup
1. Add the indicator to your chart
2. The indicator displays in a separate pane (MACD) and overlay (signals/volume bars)
3. Default settings work well for most assets, but can be customized
### Signal Interpretation
### Visual Signals
**Visual Signals:**
- **Green "BUY" label** - Bullish MACD crossover confirmed by high volume
- **Red "SELL" label** - Bearish MACD crossunder confirmed by high volume
- **Green/Red candles** - Highlight bars with volume exceeding the threshold
- **Light green/red background** - Emphasizes signal bars on the chart
**Information Table:**
A detailed information table appears in the top-right corner of the MACD pane, providing real-time transparency about the indicator's operation:
- **Chart:** Current symbol being analyzed
- **Exchange:** The exchange or data feed being used
- **Pair:** The currency pair or asset name extracted from the ticker
- **Volume From:** The actual symbol used for volume analysis
- Orange color indicates CME or COMEX futures are being used (automatic institutional volume)
- Yellow color indicates native volume from the chart symbol is being used
- Hover tooltip shows whether automatic futures mapping is active
- **High Volume:** Current status showing YES (green) when volume exceeds threshold, NO (gray) otherwise
This table ensures complete transparency and allows you to verify that the correct volume source is being used for your analysis.
**Volume Analysis:**
- Gray histogram bars = Normal volume
- Red histogram bars = High volume (exceeds threshold)
- Green line = Volume moving average baseline
**MACD Analysis:**
- Blue line = MACD line (momentum indicator)
- Orange line = Signal line (trend confirmation)
- Gray dotted line = Zero line (bullish above, bearish below)
### Parameter Customization
**MACD Parameters:**
- Adjust Fast/Slow EMA lengths for different sensitivities
- Shorter periods = More signals, faster response
- Longer periods = Fewer signals, less noise
**Volume Parameters:**
- **Volume MA Period:** Higher values smooth volume analysis
- **High Volume Ratio:** Lower values (1.5x) = More signals; Higher values (3.0x) = Fewer, stronger signals
- **Volume Lookback Bars:** Controls how recent the volume spike must be
**Direction Filters:**
- **Only Buy Signals:** Enables long-only strategy mode
- **Only Sell Signals:** Enables short-only strategy mode
### Alert Configuration
The indicator includes three alert types:
1. **Buy Signal Alert** - Triggers when bullish signal appears
2. **Sell Signal Alert** - Triggers when bearish signal appears
3. **High Volume Alert** - Triggers when volume exceeds threshold
To set up alerts:
1. Click the indicator name → "Add alert on Smart MACD Volume Trader"
2. Select desired alert condition
3. Configure notification method (popup, email, webhook, etc.)
## Trading Strategy Guidelines
### Best Practices
**Recommended markets:**
- Liquid stocks (large-cap, high daily volume)
- Major forex pairs (EURUSD, GBPUSD, USDJPY, AUDUSD, USDCAD, USDCHF, NZDUSD)
- Exotic forex pairs (USDMXN, USDRUB, USDBRL, USDZAR)
- Cross pairs (EURJPY, GBPJPY, EURGBP, AUDJPY, EURAUD, GBPAUD)
- Precious metals (Gold, Silver with automatic COMEX futures mapping)
- Energy commodities (Crude Oil, Natural Gas with automatic NYMEX futures mapping)
- Industrial metals (Copper with automatic COMEX futures mapping)
- Major cryptocurrency pairs
- Index futures and ETFs
**Timeframe recommendations:**
- **Day trading:** 5-minute to 15-minute charts
- **Swing trading:** 1-hour to 4-hour charts
- **Position trading:** Daily charts
**Risk management:**
- Use signals as entry confirmation, not standalone strategy
- Combine with support/resistance levels
- Consider overall market trend direction
- Always use stop-loss orders
### Strategy Examples
**Trend Following Strategy:**
1. Identify overall trend using higher timeframe (e.g., daily chart)
2. Trade only in trend direction
3. Use "Only Buy" filter in uptrends, "Only Sell" in downtrends
4. Enter on signal, exit on opposite signal or at resistance/support
**Volume Breakout Strategy:**
1. Wait for consolidation period (low volume, tight MACD range)
2. Enter when signal appears with high volume (confirms breakout)
3. Target previous swing highs/lows
4. Stop loss below/above recent consolidation
**Forex Scalping Strategy (with automatic CME futures):**
1. The indicator automatically detects forex pairs and uses CME futures volume
2. Trade during active sessions only (use session filter)
3. Focus on quick profits (10-20 pips)
4. Exit at opposite signal or profit target
**Commodities Trading Strategy (Gold, Silver, Oil):**
1. The indicator automatically maps to COMEX and NYMEX futures contracts
2. Trade during high-liquidity sessions (overlap of major markets)
3. Use the high volume confirmation to identify institutional entry points
4. Combine with key support and resistance levels for entries
5. Monitor the information table to confirm futures volume is being used (orange color)
6. Exit on opposite MACD signal or at predefined profit targets
## Why This Combination Works
### The Volume Advantage
Studies consistently show that price movements accompanied by high volume are more likely to continue, while low-volume movements often reverse. This indicator leverages this principle by requiring volume confirmation.
**Key benefits:**
1. **Reduced False Signals:** Eliminates MACD whipsaws during low-volume consolidation
2. **Confirmation Bias:** Two independent indicators (price momentum + volume) agreeing
3. **Institutional Alignment:** High volume often indicates institutional participation
4. **Trend Validation:** Volume confirms that price momentum has "conviction"
### Statistical Edge
By combining two uncorrelated signals (MACD crossovers and volume spikes), the indicator creates a higher-probability setup than either signal alone. The lookback mechanism ensures signals aren't missed if volume spike slightly precedes the MACD cross.
## Supported Exchanges and Automatic Detection
The indicator includes intelligent asset detection that works across multiple exchanges and ticker formats:
**Forex Exchanges (Automatic CME Mapping):**
- FX (TradingView forex feed)
- OANDA
- FXCM
- SAXO
- FOREXCOM
- PEPPERSTONE
- EASYMARKETS
- FX_IDC
**Commodity Exchanges (Automatic COMEX/NYMEX Mapping):**
- TVC (TradingView commodity feed)
- COMEX (directly)
- NYMEX (directly)
- ICEUS
**Other Asset Classes (Native Volume):**
- Stock exchanges (NASDAQ, NYSE, AMEX, etc.)
- Cryptocurrency exchanges (BINANCE, COINBASE, KRAKEN, etc.)
- Index providers (SP, DJ, etc.)
The detection algorithm analyzes three factors:
1. Exchange prefix in the ticker symbol
2. Pattern matching for currency pairs (6-letter codes)
3. Commodity identifiers in the symbol name
This ensures accurate automatic detection regardless of which data feed or exchange you use for charting. The information table in the top-right corner always displays which volume source is being used, providing complete transparency.
## Technical Details
**Calculations:**
- MACD Fast MA: EMA(close, fastLength)
- MACD Slow MA: EMA(close, slowLength)
- MACD Line: Fast MA - Slow MA
- Signal Line: SMA(MACD Line, signalLength)
- Volume MA: Exponential MA of volume
- High Volume: Current volume >= Volume MA × Ratio
**Signal logic:**
```
Buy Signal = (MACD crosses above Signal) AND (High volume in last N bars)
Sell Signal = (MACD crosses below Signal) AND (High volume in last N bars)
```
## Parameters Reference
| Parameter | Default | Description |
|-----------|---------|-------------|
| Volume Symbol | Blank | Manual override for volume source (leave blank for automatic detection) |
| Use CME Futures | False | Legacy option (automatic detection is now built-in) |
| Alert Session | 1530-2200 | Active session time range for alerts |
| Timezone | UTC+1 | Timezone for alert sessions |
| Volume MA Period | 20 | Number of periods for volume moving average |
| High Volume Ratio | 2.0 | Volume threshold multiplier (2.0 = 200% of average) |
| Volume Lookback | 5 | Number of bars to check for high volume confirmation |
| MACD Fast Length | 12 | Fast EMA period for MACD calculation |
| MACD Slow Length | 26 | Slow EMA period for MACD calculation |
| MACD Signal Length | 9 | Signal line SMA period |
| Only Buy | False | Filter to show only bullish signals |
| Only Sell | False | Filter to show only bearish signals |
| Show Signals | True | Display buy and sell labels on chart |
## Optimization Tips
**For volatile markets (crypto, small caps):**
- Increase High Volume Ratio to 2.5-3.0
- Reduce Volume Lookback to 3-4 bars
- Consider faster MACD settings (8, 17, 9)
**For stable markets (large-cap stocks, bonds):**
- Decrease High Volume Ratio to 1.5-1.8
- Increase Volume MA Period to 30-50
- Use standard MACD settings
**For forex (with automatic CME futures):**
- The indicator automatically uses CME futures when forex pairs are detected
- Set appropriate trading session based on your timezone
- Use Volume Lookback of 5-7 bars
- Consider session-based alerts only
- Monitor the information table to verify correct futures mapping
**For commodities (Gold, Silver, Oil, Copper):**
- The indicator automatically maps to COMEX and NYMEX futures
- Increase High Volume Ratio to 2.0-2.5 for metals
- Use slightly higher Volume MA Period (25-30) for smoother analysis
- Trade during active market hours for best volume data
- The information table will show the futures contract being used (orange highlight)
## Limitations and Considerations
**What this indicator does NOT do:**
- Does not predict future price direction
- Does not guarantee profitable trades
- Does not replace proper risk management
- Does not work well in extremely low-volume conditions
**Market conditions to avoid:**
- Pre-market and after-hours sessions (low volume)
- Major news events (volatile, unpredictable volume)
- Holidays and low-liquidity periods
- Extremely low float stocks
## Conclusion
Smart MACD Volume Trader represents a significant evolution of the traditional MACD indicator by combining volume confirmation with automatic institutional volume integration. This dual-confirmation approach significantly improves signal quality by filtering out low-conviction price movements and ensuring traders work with accurate volume data.
The indicator's automatic detection and mapping system supports over 24 instruments across forex, commodities, and metals markets. By intelligently switching to CME and COMEX futures contracts when appropriate, the indicator provides forex and commodity traders with the same quality of volume data that stock traders naturally have access to.
This indicator is particularly valuable for traders who want to:
- Align their entries with institutional money flow
- Avoid getting trapped in false breakouts
- Trade forex pairs with reliable volume data
- Access accurate volume information for gold, silver, and energy commodities
- Combine momentum and volume analysis in a single, streamlined tool
Whether you are day trading stocks, swing trading forex pairs, or positioning in commodities markets, this indicator provides a robust framework for identifying high-probability momentum trades backed by genuine institutional participation. The automatic futures mapping works seamlessly across all supported instruments, requiring no manual configuration or expertise in futures markets.
---
## Support and Updates
This indicator is actively maintained and updated based on user feedback and market conditions. For questions about implementation or custom modifications, please use the comments section below.
**Disclaimer:** This indicator is for educational and informational purposes only. Past performance does not guarantee future results. Always conduct your own analysis and risk management before trading.

AI Trading Alerts v6 — SL/TP + Confidence + Panel (Fixed)Overview
This Pine Script is designed to identify high-probability trading opportunities in Forex, commodities, and crypto markets. It combines EMA trend filters, RSI, and Stochastic RSI, with automatic stop-loss (SL) & take-profit (TP) suggestions, and provides a confidence panel to quickly assess the trade setup strength.
It also includes TradingView alert conditions so you can set up notifications for Long/Short setups and EMA crosses.
⚙️ Features
EMA Trend Filter
Uses EMA 50, 100, 200 for trend confirmation.
Bull trend = EMA50 > EMA100 > EMA200
Bear trend = EMA50 < EMA100 < EMA200
RSI Filter
Bullish trades require RSI > 50
Bearish trades require RSI < 50
Stochastic RSI Filter
Prevents entries during overbought/oversold extremes.
Bullish entry only if %K and %D < 80
Bearish entry only if %K and %D > 20
EMA Proximity Check
Price must be near EMA50 (within ATR × adjustable multiplier).
Signals
Continuation Signals:
Long if all bullish conditions align.
Short if all bearish conditions align.
Cross Events:
Long Cross when price crosses above EMA50 in bull trend.
Short Cross when price crosses below EMA50 in bear trend.
Automatic SL/TP Suggestions
SL size adjusts depending on asset:
Gold/Silver (XAU/XAG): 5 pts
Bitcoin/Ethereum: 100 pts
FX pairs (default): 20 pts
TP = SL × Risk:Reward ratio (default 1:2).
Confidence Score (0–4)
Based on conditions met (trend, RSI, Stoch, EMA proximity).
Labels:
Strongest (4/4)
Strong (3/4)
Medium (2/4)
Low (1/4)
Visual Panel on Chart
Shows ✅/❌ for each condition (trend, RSI, Stoch, EMA proximity, signal now).
Confidence row with color-coded strength.
Alerts
Long Setup
Short Setup
Long Cross
Short Cross
🖥️ How to Use
1. Add the Script
Open TradingView → Pine Editor.
Paste the full script.
Click Add to chart.
Save as "AI Trading Alerts v6 — SL/TP + Confidence + Panel".
2. Configure Inputs
EMA Lengths: Default 50/100/200 (works well for swing trading).
RSI Length: 14 (standard).
Stochastic Length/K/D: Default 14/3/3.
Risk:Reward Ratio: Default 2.0 (can change to 1.5, 3.0, etc.).
EMA Proximity Threshold: Default 0.20 × ATR (adjust to be stricter/looser).
3. Read the Panel
Top-right of chart, you’ll see ✅ or ❌ for:
Trend → Are EMAs aligned?
RSI → Above 50 (bull) or below 50 (bear)?
Stoch OK → Not extreme?
Near EMA50 → Close enough to EMA50?
Above/Below OK → Price position vs. EMA50 matches trend?
Signal Now → Entry triggered?
Confidence row:
🟢 Green = Strongest
🟩 Light green = Strong
🟧 Orange = Medium
🟨 Yellow = Low
⬜ Gray = None
4. Alerts Setup
Go to TradingView Alerts (⏰ icon).
Choose the script under “Condition”.
Select alert type:
Long Setup
Short Setup
Long Cross
Short Cross
Set notification method (popup, sound, email, mobile).
Click Create.
Now TradingView will notify you automatically when signals appear.
5. Example Workflow
Wait for Confidence = Strong/Strongest.
Check if market session supports volatility (e.g., XAU in London/NY).
Review SL/TP suggestions:
Long → Entry: current price, SL: close - risk_pts, TP: close + risk_pts × RR.
Short → Entry: current price, SL: close + risk_pts, TP: close - risk_pts × RR.
Adjust based on your own price action analysis.
📊 Best Practices
Use on H1 + D1 combo → align higher timeframe bias with intraday entries.
Risk only 1–2% of account per trade (position sizing required).
Filter with market sessions (Asia, Europe, US).
Strongest signals work best with trending pairs (e.g., XAUUSD, USDJPY, BTCUSD).

Correlation HeatMap [TradingFinder] Sessions Data Science Stats🔵 Introduction
n financial markets, correlation describes the statistical relationship between the price movements of two assets and how they interact over time. It plays a key role in both trading and investing by helping analyze asset behavior, manage portfolio risk, and understand intermarket dynamics. The Correlation Heatmap is a visual tool that shows how the correlation between multiple assets and a central reference asset (the Main Symbol) changes over time.
It supports four market types forex, stocks, crypto, and a custom mode making it adaptable to different trading environments. The heatmap uses a color-coded grid where warmer tones represent stronger negative correlations and cooler tones indicate stronger positive ones. This intuitive color system allows traders to quickly identify when assets move together or diverge, offering real-time insights that go beyond traditional correlation tables.
🟣 How to Interpret the Heatmap Visually ?
Each cell represents the correlation between the main symbol and one compared asset at a specific time.
Warm colors (e.g. red, orange) suggest strong negative correlation as one asset rises, the other tends to fall.
Cool colors (e.g. blue, green) suggest strong positive correlation both assets tend to move in the same direction.
Lighter shades indicate weaker correlations, while darker shades indicate stronger correlations.
The heatmap updates over time, allowing users to detect changes in correlation during market events or trading sessions.
One of the standout features of this indicator is its ability to overlay global market sessions such as Tokyo, London, New York, or major equity opens directly onto the heatmap timeline. This alignment lets traders observe how correlation structures respond to real-world session changes. For example, they can spot when assets shift from being inversely correlated to moving together as a new session opens, potentially signaling new momentum or macro flow. The customizable symbol setup (including up to 20 compared assets) makes it ideal not only for forex and crypto traders but also for multi-asset and sector-based stock analysis.
🟣 Use Cases and Advantages
Analyze sector rotation in equities by tracking correlation to major indices like SPX or DJI.
Monitor altcoin behavior relative to Bitcoin to find early entry opportunities in crypto markets.
Detect changes in currency alignment with DXY across trading sessions in forex.
Identify correlation breakdowns during market volatility, signaling possible new trends.
Use correlation shifts as confirmation for trade setups or to hedge multi-asset exposure
🔵 How to Use
Correlation is one of the core concepts in financial analysis and allows traders to understand how assets behave in relation to one another. The Correlation Heatmap extends this idea by going beyond a simple number or static matrix. Instead, it presents a dynamic visual map of how correlations shift over time.
In this indicator, a Main Symbol is selected as the reference point for analysis. In standard modes such as forex, stocks, or crypto, the symbol currently shown on the main chart is automatically used as the main symbol. This allows users to begin correlation analysis right away without adjusting any settings.
The horizontal axis of the heatmap shows time, while the vertical axis lists the selected assets. Each cell on the heatmap shows the correlation between that asset and the main symbol at a given moment.
This approach is especially useful for intermarket analysis. In forex, for example, tracking how currency pairs like OANDA:EURUSD EURUSD, FX:GBPUSD GBPUSD, and PEPPERSTONE:AUDUSD AUDUSD correlate with TVC:DXY DXY can give insight into broader capital flow.
If these pairs start showing increasing positive correlation with DXY say, shifting from blue to light green it could signal the start of a new phase or reversal. Conversely, if negative correlation fades gradually, it may suggest weakening relationships and more independent or volatile movement.
In the crypto market, watching how altcoins correlate with Bitcoin can help identify ideal entry points in secondary assets. In the stock market, analyzing how companies within the same sector move in relation to a major index like SP:SPX SPX or DJ:DJI DJI is also a highly effective technique for both technical and fundamental analysts.
This indicator not only visualizes correlation but also displays major market sessions. When enabled, this feature helps traders observe how correlation behavior changes at the start of each session, whether it's Tokyo, London, New York, or the opening of stock exchanges. Many key shifts, breakouts, or reversals tend to happen around these times, and the heatmap makes them easy to spot.
Another important feature is the market selection mode. Users can switch between forex, crypto, stocks, or custom markets and see correlation behavior specific to each one. In custom mode, users can manually select any combination of symbols for more advanced or personalized analysis. This makes the heatmap valuable not only for forex traders but also for stock traders, crypto analysts, and multi-asset strategists.
Finally, the heatmap's color-coded design helps users make sense of the data quickly. Warm colors such as red and orange reflect stronger negative correlations, while cool colors like blue and green represent stronger positive relationships. This simplicity and clarity make the tool accessible to both beginners and experienced traders.
🔵 Settings
Correlation Period: Allows you to set how many historical bars are used for calculating correlation. A higher number means a smoother, slower-moving heatmap, while a lower number makes it more responsive to recent changes.
Select Market: Lets you choose between Forex, Stock, Crypto, or Custom. In the first three options, the chart’s active symbol is automatically used as the Main Symbol. In Custom mode, you can manually define the Main Symbol and up to 20 Compared Symbols.
Show Open Session: Enables the display of major trading sessions such as Tokyo, London, New York, or equity market opening hours directly on the timeline. This helps you connect correlation shifts with real-world market activity.
Market Mode: Lets you select whether the displayed sessions relate to the forex or stock market.
🔵 Conclusion
The Correlation Heatmap is a robust and flexible tool for analyzing the relationship between assets across different markets. By tracking how correlations change in real time, traders can better identify alignment or divergence between symbols and gain valuable insights into market structure.
Support for multiple asset classes, session overlays, and intuitive visual cues make this one of the most effective tools for intermarket analysis.
Whether you’re looking to manage portfolio risk, validate entry points, or simply understand capital flow across markets, this heatmap provides a clear and actionable perspective that you can rely on.

RiskCalc FX & GoldRiskCalc FX & Gold is a multi-market position sizing tool designed to help you manage risk quickly and accurately. With this script, simply enter your account capital, the percentage of risk you wish to take, and your stop in ticks. Depending on the selected market—Forex or XAUUSD—the script automatically adjusts its calculations:
Forex: Assumes 1 lot equals 100,000 units.
XAUUSD: Assumes 1 lot equals 100 ounces.
The script calculates your risk in dollars and, using a fixed value of 1 USD per tick per lot, determines the ideal position size in both lots and total contracts. Results are displayed in a clear, centralized table at the top of the chart for real-time decision-making.
Perfect for traders operating across multiple markets who need an automated and consistent approach to risk management.

GRID EXTENSIONGRID EXTENSION
Overview
The GRID EXTENSION is a simple grid-based indicator for TradingView, built with Pine Script v6. It plots horizontal price levels starting from a user-defined anchor price, with spacing set by a tick increment. Use it to identify key support, resistance, or price zones on charts for Crypto, Forex, or Futures.
Key Features
Custom Grid Levels: Plot up to 22 levels (e.g., 0, 0.25, 1.25, -2.50) with options to show/hide, set values, and choose colors.
Market-Specific Tick Increments: Select your asset type (Crypto, Forex, Futures) and choose from a range of tick increments tailored for each market:
Crypto: 1 to 5000 ticks (e.g., 100 ticks = $0.001 on ADA/USD, 5000 ticks = $50 on BTC/USD).
Forex: 5 to 5000 ticks (e.g., 100 ticks = 1 pip on EUR/USD, 5000 ticks = 50 pips).
Futures: 1 to 2500 ticks (e.g., 25 ticks = 6.25 points on E-mini S&P 500, $312.50 per contract).
Visual Options:
Extend lines to the right.
Show price and level labels (as values or percentages).
Place labels on the left or right.
Adjust background transparency for filled areas between levels.
How to Use
Set Asset Type: Choose "Crypto," "Forex," or "Futures" to match your chart.
Set Anchor Price: Enter a starting price for the grid.
Pick Tick Increment: Select a tick increment from the dropdown, following the guidance for your asset type (see Key Features).
Customize Levels: Turn levels on/off, set values, and pick colors.
Add to Chart: Apply the indicator to see the grid on your chart.
Tips
Use levels to mark support/resistance zones for entries or exits.
Extend lines to project future price zones.
Choose smaller increments (e.g., 5 ticks) for scalping, or larger ones (e.g., 1000 ticks) for swing trading.
Combine with indicators like moving averages for better signals.
Settings
Asset Type: Select "Crypto," "Forex," or "Futures" (default: "Crypto").
Anchor Price: Starting price for the grid (default: 0.0).
Tick Increment: Space between levels (options: 1, 5, 10, 25, 50, 100, 250, 500, 1000, 2500, 5000). Choose based on asset type.
Extend Right: Extend lines to the right (default: true).
Show Prices: Show price labels (default: true).
Show Levels: Show level values or percentages (default: true).
Format: Display levels as "Values" or "Percent" (default: "Values").
Labels Position: Place labels on "Left" or "Right" (default: "Left").
Background Transparency: Set transparency for filled areas (default: 100, range 0-100).
Level Options: Enable/disable levels, set values, and choose colors.
Notes
Set the anchor price to a key level (like a recent high or low) for best results.
Check the tick increment tooltip to ensure the spacing suits your market type.
Works on any chart, best for clear price trends or ranges.
Acknowledgments
Made with Pine Script v6 for TradingView. This is v1.0—feedback welcome for future updates!

Live Economic CalendarLive Economic Calendar
This TradingView indicator provides real-time economic news events directly on your charts, helping traders stay informed about key market-moving data. Built on the original Forex Factory utility by toodegrees, this version enhances functionality with customizable alerts and improved visualizations.
Key Features:
Real-Time Economic News: Displays upcoming economic events from Forex Factory, categorized by impact level (High, Medium, Low, Holiday).
Custom Alerts: Set alerts before and after news events to stay prepared for market volatility.
Timezone Adjustments: Adjust news event times to match your local timezone for accurate scheduling.
Currency-Specific News: Automatically filters news based on the currency pair you’re viewing, with manual options for specific currencies.
Flexible Display Options: Choose to display news for today, this week, or a custom period. Customize labels, lines, and tables directly on the chart.
Impact Visualization: Visual cues (lines, labels, background shading) for different impact levels to highlight significant market events.
Credits:
• Original Forex Factory Utility by toodegrees
• Alerts and enhancements by Nachodog
This Pine Script™ code is licensed under the Mozilla Public License 2.0: mozilla.org
