Daytrade Forex Scalper TwinPulse Auction Timer IndicatorWhat this indicator is
TwinPulse Auction Timer is a multi component execution aid designed for liquid markets. It looks for two families of opportunities
Breakouts that leave a compression area after a fresh sweep
Reversals that trigger after a sweep with strong wick polarity
It does not try to predict future prices. It measures present auction conditions with transparent rules and shows you when those conditions align. You get a simple table that says LONG SHORT or WAIT, optional session shading, clean entry and exit level visuals, and alerts you can wire to your workflow.
Why it is different
Most tools show a single signal. TwinPulse combines several independent signals into an Edge Score that you can tune. The components are
• Pulse. A signed measure of wick asymmetry with candle body direction
• Compression. Current true range compared with an average range
• Sweep timer. Bars elapsed since the most recent sweep of a prior high or low
• Bias. Direction of a higher timeframe candle
• Regime. Efficiency ratio and the relation of micro to macro volatility
• Location. Distance from the daily anchored VWAP
• Session. London and New York filter by time windows
Each component is visible in the inputs and in the table so you can understand why a suggestion appears. The script uses request.security() with lookahead off in all calls so it does not peek into the future. Shapes may move while a bar is open since price is still forming. They stop moving when the bar closes.
What you will see on the chart
• L and S shapes on entry bars
• An Exit shape at the price where a stop or the runner target would have been hit
• Four horizontal lines while a trade is active
Entry
Stop
TP1 at one R
TP2 at the runner target expressed in R
• Labels anchored to each line so you can instantly read Entry SL TP1 and TP2 with current values
• Optional shading during your session windows
• Optional daily VWAP line
The table in the top right shows
Action LONG SHORT IN LONG IN SHORT or WAIT
Session ON or OFF
Bias UP DOWN or FLAT
Pulse value
Compression value
Edge L percent and Edge S percent
How it works in detail
Pulse
For each bar the script measures up wick minus down wick divided by range and multiplies that by the sign of the candle body. The result is averaged with pulse_len. Positive numbers indicate aggressive buying. Negative numbers indicate aggressive selling. You control the minimum absolute value with pulse_thr.
Compression
Compression is the ratio of current range to an average range. You can choose the range basis. HL SMA uses simple high minus low smoothed by range_len. ATR uses classic True Range smoothed by atr_len. Values below comp_thr indicate a coil.
Sweeps and the timer
A sweep occurs when price trades beyond the highest high or lowest low seen in the previous sweep_len bars. A strict sweep requires a close back inside that prior range. The timer measures how many bars have elapsed since the last sweep. Breakout setups require the timer to exceed timer_thr.
Bias on a confirmation timeframe
A higher timeframe candle is read with confirm_tf. If close is above open bias is UP. If close is below open bias is DOWN. This keeps breakouts aligned with the prevailing drift.
Regime filters
Efficiency ratio measures the straight line change over the sum of absolute bar to bar changes over er_len. It rises in trendy conditions and falls in noise. Minimum efficiency is controlled by er_min.
Micro to macro volatility ratio compares a short lookback average range with a longer lookback average range using your chosen basis. For breakouts you usually want micro volatility to be near or above macro hence mvr_min. For reversals you often want micro volatility that is not overheated relative to macro hence mvr_max_rev.
VWAP distance gate
Daily anchored VWAP is rebuilt from the open of each session. The script computes the absolute distance from VWAP in units of your average range and requires that distance to exceed vwap_dist_thr when use_vwap_gate is true. This keeps entries away from the mean.
Edge Score
Each gate contributes a weight that you control. The script sums weights of the satisfied gates and divides by the sum of all weights to produce an Edge percent for long and an Edge percent for short. You can then require a minimum Edge percent using edge_min_pct. This turns the indicator into a step by step checklist that you can tune to your taste.
Using the indicator step by step
Choose markets and timeframes
The logic is designed for liquid instruments. Major currency pairs, index futures and cash index CFDs, and the most liquid crypto pairs work well. On intraday use one to fifteen minutes for signals and fifteen to sixty minutes for confirmation. On swing use one hour to one day for signals and one day for confirmation.
Decide on entry mode
Breakouts require a compression area and a sweep timer. Reversals require a strict sweep and a strong pulse. If you are unsure leave the default which allows both.
Pick a range basis
For FX and crypto HL SMA is often stable. For indices and single name equities with gaps ATR can adapt better. If results look too reactive increase the window. If results are too slow reduce it.
Tune regime filters
If you trade trend continuation raise er_min and mvr_min. If you trade counter rotation lower them and rely on the reversal path with the strict sweep condition.
Set the VWAP gate
Enabling it helps you avoid entries at the mean. Push the threshold higher on range bound days. Reduce it in strong trend days.
Table driven decision
Watch Action and the Edge percents. If the script says WAIT you can read Pulse and Compression to see what is missing. Often the best trades appear when both Edge percents are well separated and your session switch is ON.
Use the visuals
When a suggestion triggers you will see entry stop and targets. You can mirror the levels in your own workflow or use alerts.
Consider bar close
Signals are computed in real time. For a strict process you can wait until the bar closes to reduce noise.
Inputs explained with quick guidance
Setup
Signal TF chooses where the logic is computed. Leave blank to use the chart.
Confirm TF sets the higher timeframe for bias.
Session filter restricts signals to the London and New York windows you specify.
Invert flips long and short. It is useful on inverse instruments.
Logic options
Entry mode allows Breakouts Reversals or Both.
Average range basis selects HL SMA or ATR.
ATR length is used when ATR is selected.
Pulse source can be Regular OHLC or Heikin Ashi. Heikin Ashi smooths noisy series, but the script still runs on regular bars and you should publish and use it on standard candles to respect the platform guidance.
Core numeric settings
Sweep lookback controls the size of the liquidity pool targeted by the sweep condition.
Pulse window smooths the wick polarity measure.
Average range window controls your base range when you use HL SMA.
Pulse threshold sets the minimum polarity required.
Compression threshold sets the maximum current range relative to average to consider the market coiled.
Expansion timer bars sets how much time has passed since the last sweep before you allow a breakout.
Regime filters
Efficiency ratio length and minimum value keep you out of aimless drift.
Micro and Macro range lengths feed the micro to macro ratio.
Minimum micro to macro for breakouts and maximum micro to macro for reversals steer the two entry families.
VWAP gate and distance threshold keep you away from the mean.
Levels and trade management visuals
Runner target in R sets TP2 as a multiple of initial risk.
Stop distance as average range multiple sets initial risk size for the visuals.
Move stop to entry after one R touch turns on break even logic once price has traveled one risk unit.
Trail buffer as R fraction uses the last sweep as an anchor and keeps a dynamic stop at a chosen fraction of R beyond it.
Cooldown after exit prevents immediate re entries.
Edge Score
Weights for pulse compression timer bias efficiency ratio micro to macro VWAP gate and session let you align the checklist with your style.
Minimum Edge percent to suggest applies a final filter to LONG or SHORT suggestions.
UI
Table and markers switch the compact dashboard and the shapes.
TP and SL lines and labels draw and name each level.
TP1 partial label percent is printed in the TP1 label for clarity.
Session shading helps with focus.
Daily VWAP line is optional.
Alerts
The script provides alerts for Long Short Exit and for Edge percent crossing the threshold on either side. Use them to drive notifications or to sync with webhooks and your broker integration. Alerts trigger in real time and will repaint during a bar. For conservative use trigger on bar close.
Recommended presets
Intraday trend continuation
Confirm TF fifteen minutes
Entry mode Breakouts
Range basis HL SMA
Pulse threshold near 0.10
Compression threshold near 0.60
Timer around 18
Minimum efficiency ratio near 0.20
Minimum micro to macro near 1.00
VWAP gate enabled with distance near 0.35
Edge minimum 50 or higher
Intraday mean reversion at sweeps
Entry mode Reversals
Pulse source Regular OHLC
Compression threshold can be a little higher
Maximum micro to macro near 1.60
Efficiency ratio minimum lower near 0.12
VWAP gate enabled
Edge minimum 40 to 60
Swing trend continuation
Signal TF one hour
Confirm TF one day
Range basis ATR
ATR length around 14
Average range window 20 to 30
Efficiency ratio minimum near 0.18
Micro to macro windows 12 and 60
Edge minimum 50 to 70
These are starting points only. Your instrument and timeframe will require small adjustments.
Limitations and honest warnings
No indicator is perfect. TwinPulse will mark attractive conditions that do not always lead to profitable trades. During economic releases or very thin liquidity the assumptions behind compression and sweeps may fail. In strong gap environments the HL SMA basis may lag while ATR may overreact. Heikin Ashi pulse can help in choppy markets but it will lag during sharp reversals. Session times use the exchange time of your chart. If you switch symbol or exchange verify the windows.
Edge percent is not a probability of profit. It is the fraction of satisfied gates with your chosen weights. Two traders can set different weights and see different Edge readings on the same bar. That is the design. The score is a guide that helps you act with discipline.
This indicator does not place orders or manage real risk. The lines and labels show a model entry a model stop and two model targets built from the average range at entry and from recent swing points. Use them as references and not as hard rules. Always test on historical data and demo first. Past results do not guarantee anything in the future.
Credits and originality
All code in this publication is original and written for this indicator. The concept of the efficiency ratio originates from Perry Kaufman. The use of a daily anchored volume weighted average price is a standard industry tool. The specific combination of pulse from wick polarity strict sweep timing compression and the tunable Edge Score is unique to this script at the time of publication. If you reuse parts of the open source code in your own work remember to credit the author and contribute meaningful improvements.
How to read the table at a glance
Action reflects your current state.
IN LONG or IN SHORT appears while a trade is active.
LONG or SHORT appears when conditions for entry are met and the Edge threshold is satisfied.
WAIT appears when at least one gate is missing.
Session shows ON during your chosen windows.
Bias shows the color of the confirmation candle.
Pulse is the smoothed polarity number.
Comp shows current range divided by the average range. Values below one mean compression.
Edge L percent and Edge S percent show the long and short checklists as percents.
Final thoughts
Markets move because orders accumulate at certain prices and at certain times. The indicator tries to measure two things that often matter at those turning points. One is the existence of a hidden imbalance revealed by wick polarity and by sweeps of prior extremes. The other is the presence of energy stored in a coil that can release in the direction of a drift. Neither force guarantees profit. Together they can improve your selection and your timing.
Use the defaults for a few days so you learn the personality of the signals. After that adjust one group at a time. Start with the session filter and the Edge threshold. Then tune compression and the timer. Finally adjust the regime filters. Keep notes. You will learn which weights matter for your market and timeframe. The result is a process you can apply with consistency.
Disclaimer
This script and description are for education and analysis. They are not investment advice and they do not promise future results. Use at your own risk. Test thoroughly on historical data and in simulation before considering any live use.
Cerca negli script per "forex"

Twisted Forex's Doji + Area StrategyTitle
Twisted Forex’s Doji + Area Strategy
Description
What this strategy does
This strategy looks for doji candles forming inside or near supply/demand areas . Areas are built from swing pivots and sized with ATR, then tracked for retests (“confirmations”). When a doji prints close to an area and quality checks pass, the strategy places a trade with the stop beyond the doji and a configurable R:R target.
How areas (zones) are built
• Swings are detected with a user-set pivot length.
• Each swing spawns a horizontal area centered at the pivot price with half-height = zoneHalfATR × ATR .
• Duplicates are de-duplicated by center distance (ATR-scaled).
• Areas fade when broken beyond a buffer or after an optional age (expiry).
• Retests are recorded when price touches and then bounces away from the area; repeated reactions increase the zone’s “strength”.
Signal logic (summary)
Doji detection: strict or loose body criteria with optional minimum wick fractions and ATR-scaled minimum range.
Proximity: price must be inside/near a supply or demand area (proxATR × ATR).
Side resolution: overlap is resolved by (a) which side price penetrates more, (b) fast/slow EMA trend, or (c) nearest distance. Optional “previous candle flip” can bias long after a bearish candle and short after a bullish one.
Optional 1-bar confirmation: the bar after the doji must close away from the area by confirmATR × ATR .
Quality filter (Off/Soft/Strict): four checks—(i) wick rejection past the edge, (ii) doji closes in an edge “band” of the area, (iii) fresh touch (cooldown), (iv) approach impulse over a short lookback. In Strict , thresholds auto-tighten.
Orders & exits
• Long: stop below doji low minus buffer; Short: above doji high plus buffer.
• Target = rrMultiple × risk distance .
• Pyramiding is off by default.
Position sizing
You can size from the script or from Strategy Properties:
• Script-driven (default): set Position sizing = “Risk % of equity” and choose riskPercent (e.g., 1.0%). The script applies safe floors/rounding (FX micro-lots by default) so quantity never rounds to zero.
• Properties-driven : toggle Use TV Properties → Order size ON, then pick “Percent of equity” in Properties (e.g., 1%). The header includes safe defaults so trades still place.
Key inputs to explore
• Zone building : pivotLen, zoneHalfATR, minDepartureATR, expiryBars, breakATR, leftBars, dedupeATR.
• Doji & proximity : strictDoji, dojiBodyFrac, minWickFrac, minRangeATR, proxATR, minBarsBetween.
• Overlap resolution : usePenetration, useTrend (EMA 21/55), “previous candle flip”, needNextBarConf & confirmATR.
• Quality : qualityMode (Off/Soft/Strict), minQualPass/kStrict, wickPenATR, edgeBandFrac, approachLookback, approachMinATR, freshTouchBars.
• Zone strength gating : minStrengthSoft / minStrengthStrict.
• HTF confluence (optional) : useHTFTrend (HTF EMA 34/89) and/or useHTFZoneProx (HTF swing bands).
Tips to make it cleaner / higher quality
• Turn needNextBarConf ON and use confirmATR = 0.10–0.15 .
• Increase approachMinATR (e.g., 0.35–0.45) to require a stronger pre-touch impulse.
• Raise minStrengthSoft/Strict (e.g., 4–6) so only well-reacted zones can signal.
• Use signalsOnlyConfirmed ON if you prefer trades only from zones with retests (the script falls back gracefully when none exist yet).
• Nudge proxATR to 0.5–0.6 to demand tighter proximity to the level.
• Optional: enable useHTFTrend to filter counter-trend setups.
Default settings used in this publication
• Initial capital: 100,000 (illustrative).
• Slippage: 1 tick; Commission: 0% (you can raise commission if you prefer—spread is partly modeled by slippage).
• Sizing: Risk % of equity via inputs; riskPercent = 1.0% ; FX uses micro-lot floors by default.
• Quality: Off by default (Soft/Strict available).
• HTF trend gate: Off by default.
Backtesting notes
For a meaningful sample size, test on liquid symbols/timeframes that yield 100+ trades (e.g., majors on 5–15m over 1–2 years). Backtests are modelled and broker costs/spread vary—validate on your feed and forward-test.
How to read the chart
Shaded bands are supply (above) and demand (below). Brighter bands are the nearest K per side (visual aid). BUY/SELL labels mark entries; colored dots show entry/SL/TP levels. You can hide zones or unconfirmed zones for a cleaner view.
Disclaimer
This is educational material, not financial advice. Trading involves risk. Always test and size responsibly.

BOCS Channel Scalper Indicator - Mean Reversion Alert System# BOCS Channel Scalper Indicator - Mean Reversion Alert System
## WHAT THIS INDICATOR DOES:
This is a mean reversion trading indicator that identifies consolidation channels through volatility analysis and generates alert signals when price enters entry zones near channel boundaries. **This indicator version is designed for manual trading with comprehensive alert functionality.** Unlike automated strategies, this tool sends notifications (via popup, email, SMS, or webhook) when trading opportunities occur, allowing you to manually review and execute trades. The system assumes price will revert to the channel mean, identifying scalp opportunities as price reaches extremes and preparing to bounce back toward center.
## INDICATOR VS STRATEGY - KEY DISTINCTION:
**This is an INDICATOR with alerts, not an automated strategy.** It does not execute trades automatically. Instead, it:
- Displays visual signals on your chart when entry conditions are met
- Sends customizable alerts to your device/email when opportunities arise
- Shows TP/SL levels for reference but does not place orders
- Requires you to manually enter and exit positions based on signals
- Works with all TradingView subscription levels (alerts included on all plans)
**For automated trading with backtesting**, use the strategy version. For manual control with notifications, use this indicator version.
## ALERT CAPABILITIES:
This indicator includes four distinct alert conditions that can be configured independently:
**1. New Channel Formation Alert**
- Triggers when a fresh BOCS channel is identified
- Message: "New BOCS channel formed - potential scalp setup ready"
- Use this to prepare for upcoming trading opportunities
**2. Long Scalp Entry Alert**
- Fires when price touches the long entry zone
- Message includes current price, calculated TP, and SL levels
- Notification example: "LONG scalp signal at 24731.75 | TP: 24743.2 | SL: 24716.5"
**3. Short Scalp Entry Alert**
- Fires when price touches the short entry zone
- Message includes current price, calculated TP, and SL levels
- Notification example: "SHORT scalp signal at 24747.50 | TP: 24735.0 | SL: 24762.75"
**4. Any Entry Signal Alert**
- Combined alert for both long and short entries
- Use this if you want a single alert stream for all opportunities
- Message: "BOCS Scalp Entry: at "
**Setting Up Alerts:**
1. Add indicator to chart and configure settings
2. Click the Alert (⏰) button in TradingView toolbar
3. Select "BOCS Channel Scalper" from condition dropdown
4. Choose desired alert type (Long, Short, Any, or Channel Formation)
5. Set "Once Per Bar Close" to avoid false signals during bar formation
6. Configure delivery method (popup, email, webhook for automation platforms)
7. Save alert - it will fire automatically when conditions are met
**Alert Message Placeholders:**
Alerts use TradingView's dynamic placeholder system:
- {{ticker}} = Symbol name (e.g., NQ1!)
- {{close}} = Current price at signal
- {{plot_1}} = Calculated take profit level
- {{plot_2}} = Calculated stop loss level
These placeholders populate automatically, creating detailed notification messages without manual configuration.
## KEY DIFFERENCE FROM ORIGINAL BOCS:
**This indicator is designed for traders seeking higher trade frequency.** The original BOCS indicator trades breakouts OUTSIDE channels, waiting for price to escape consolidation before entering. This scalper version trades mean reversion INSIDE channels, entering when price reaches channel extremes and betting on a bounce back to center. The result is significantly more trading opportunities:
- **Original BOCS**: 1-3 signals per channel (only on breakout)
- **Scalper Indicator**: 5-15+ signals per channel (every touch of entry zones)
- **Trade Style**: Mean reversion vs trend following
- **Hold Time**: Seconds to minutes vs minutes to hours
- **Best Markets**: Ranging/choppy conditions vs trending breakouts
This makes the indicator ideal for active day traders who want continuous alert opportunities within consolidation zones rather than waiting for breakout confirmation. However, increased signal frequency also means higher potential commission costs and requires disciplined trade selection when acting on alerts.
## TECHNICAL METHODOLOGY:
### Price Normalization Process:
The indicator normalizes price data to create consistent volatility measurements across different instruments and price levels. It calculates the highest high and lowest low over a user-defined lookback period (default 100 bars). Current close price is normalized using: (close - lowest_low) / (highest_high - lowest_low), producing values between 0 and 1 for standardized volatility analysis.
### Volatility Detection:
A 14-period standard deviation is applied to the normalized price series to measure price deviation from the mean. Higher standard deviation values indicate volatility expansion; lower values indicate consolidation. The indicator uses ta.highestbars() and ta.lowestbars() to identify when volatility peaks and troughs occur over the detection period (default 14 bars).
### Channel Formation Logic:
When volatility crosses from a high level to a low level (ta.crossover(upper, lower)), a consolidation phase begins. The indicator tracks the highest and lowest prices during this period, which become the channel boundaries. Minimum duration of 10+ bars is required to filter out brief volatility spikes. Channels are rendered as box objects with defined upper and lower boundaries, with colored zones indicating entry areas.
### Entry Signal Generation:
The indicator uses immediate touch-based entry logic. Entry zones are defined as a percentage from channel edges (default 20%):
- **Long Entry Zone**: Bottom 20% of channel (bottomBound + channelRange × 0.2)
- **Short Entry Zone**: Top 20% of channel (topBound - channelRange × 0.2)
Long signals trigger when candle low touches or enters the long entry zone. Short signals trigger when candle high touches or enters the short entry zone. Visual markers (arrows and labels) appear on chart, and configured alerts fire immediately.
### Cooldown Filter:
An optional cooldown period (measured in bars) prevents alert spam by enforcing minimum spacing between consecutive signals. If cooldown is set to 3 bars, no new long alert will fire until 3 bars after the previous long signal. Long and short cooldowns are tracked independently, allowing both directions to signal within the same period.
### ATR Volatility Filter:
The indicator includes a multi-timeframe ATR filter to avoid alerts during low-volatility conditions. Using request.security(), it fetches ATR values from a specified timeframe (e.g., 1-minute ATR while viewing 5-minute charts). The filter compares current ATR to a user-defined minimum threshold:
- If ATR ≥ threshold: Alerts enabled
- If ATR < threshold: No alerts fire
This prevents notifications during dead zones where mean reversion is unreliable due to insufficient price movement. The ATR status is displayed in the info table with visual confirmation (✓ or ✗).
### Take Profit Calculation:
Two TP methods are available:
**Fixed Points Mode**:
- Long TP = Entry + (TP_Ticks × syminfo.mintick)
- Short TP = Entry - (TP_Ticks × syminfo.mintick)
**Channel Percentage Mode**:
- Long TP = Entry + (ChannelRange × TP_Percent)
- Short TP = Entry - (ChannelRange × TP_Percent)
Default 50% targets the channel midline, a natural mean reversion target. These levels are displayed as visual lines with labels and included in alert messages for reference when manually placing orders.
### Stop Loss Placement:
Stop losses are calculated just outside the channel boundary by a user-defined tick offset:
- Long SL = ChannelBottom - (SL_Offset_Ticks × syminfo.mintick)
- Short SL = ChannelTop + (SL_Offset_Ticks × syminfo.mintick)
This logic assumes channel breaks invalidate the mean reversion thesis. SL levels are displayed on chart and included in alert notifications as suggested stop placement.
### Channel Breakout Management:
Channels are removed when price closes more than 10 ticks outside boundaries. This tolerance prevents premature channel deletion from minor breaks or wicks, allowing the mean reversion setup to persist through small boundary violations.
## INPUT PARAMETERS:
### Channel Settings:
- **Nested Channels**: Allow multiple overlapping channels vs single channel
- **Normalization Length**: Lookback for high/low calculation (1-500, default 100)
- **Box Detection Length**: Period for volatility detection (1-100, default 14)
### Scalping Settings:
- **Enable Long Scalps**: Toggle long alert generation on/off
- **Enable Short Scalps**: Toggle short alert generation on/off
- **Entry Zone % from Edge**: Size of entry zone (5-50%, default 20%)
- **SL Offset (Ticks)**: Distance beyond channel for stop (1+, default 5)
- **Cooldown Period (Bars)**: Minimum spacing between alerts (0 = no cooldown)
### ATR Filter:
- **Enable ATR Filter**: Toggle volatility filter on/off
- **ATR Timeframe**: Source timeframe for ATR (1, 5, 15, 60 min, etc.)
- **ATR Length**: Smoothing period (1-100, default 14)
- **Min ATR Value**: Threshold for alert enablement (0.1+, default 10.0)
### Take Profit Settings:
- **TP Method**: Choose Fixed Points or % of Channel
- **TP Fixed (Ticks)**: Static distance in ticks (1+, default 30)
- **TP % of Channel**: Dynamic target as channel percentage (10-100%, default 50%)
### Appearance:
- **Show Entry Zones**: Toggle zone labels on channels
- **Show Info Table**: Display real-time indicator status
- **Table Position**: Corner placement (Top Left/Right, Bottom Left/Right)
- **Long Color**: Customize long signal color (default: darker green for readability)
- **Short Color**: Customize short signal color (default: red)
- **TP/SL Colors**: Customize take profit and stop loss line colors
- **Line Length**: Visual length of TP/SL reference lines (5-200 bars)
## VISUAL INDICATORS:
- **Channel boxes** with semi-transparent fill showing consolidation zones
- **Colored entry zones** labeled "LONG ZONE ▲" and "SHORT ZONE ▼"
- **Entry signal arrows** below/above bars marking long/short alerts
- **TP/SL reference lines** with emoji labels (⊕ Entry, 🎯 TP, 🛑 SL)
- **Info table** showing channel status, last signal, entry/TP/SL prices, risk/reward ratio, and ATR filter status
- **Visual confirmation** when alerts fire via on-chart markers synchronized with notifications
## HOW TO USE:
### For 1-3 Minute Scalping with Alerts (NQ/ES):
- ATR Timeframe: "1" (1-minute)
- ATR Min Value: 10.0 (for NQ), adjust per instrument
- Entry Zone %: 20-25%
- TP Method: Fixed Points, 20-40 ticks
- SL Offset: 5-10 ticks
- Cooldown: 2-3 bars to reduce alert spam
- **Alert Setup**: Configure "Any Entry Signal" for combined long/short notifications
- **Execution**: When alert fires, verify chart visuals, then manually place limit order at entry zone with provided TP/SL levels
### For 5-15 Minute Day Trading with Alerts:
- ATR Timeframe: "5" or match chart
- ATR Min Value: Adjust to instrument (test 8-15 for NQ)
- Entry Zone %: 20-30%
- TP Method: % of Channel, 40-60%
- SL Offset: 5-10 ticks
- Cooldown: 3-5 bars
- **Alert Setup**: Configure separate "Long Scalp Entry" and "Short Scalp Entry" alerts if you trade directionally based on bias
- **Execution**: Review channel structure on alert, confirm ATR filter shows ✓, then enter manually
### For 30-60 Minute Swing Scalping with Alerts:
- ATR Timeframe: "15" or "30"
- ATR Min Value: Lower threshold for broader market
- Entry Zone %: 25-35%
- TP Method: % of Channel, 50-70%
- SL Offset: 10-15 ticks
- Cooldown: 5+ bars or disable
- **Alert Setup**: Use "New Channel Formation" to prepare for setups, then "Any Entry Signal" for execution alerts
- **Execution**: Larger timeframes allow more analysis time between alert and entry
### Webhook Integration for Semi-Automation:
- Configure alert webhook URL to connect with platforms like TradersPost, TradingView Paper Trading, or custom automation
- Alert message includes all necessary order parameters (direction, entry, TP, SL)
- Webhook receives structured data when signal fires
- External platform can auto-execute based on alert payload
- Still maintains manual oversight vs full strategy automation
## USAGE CONSIDERATIONS:
- **Manual Discipline Required**: Alerts provide opportunities but execution requires judgment. Not all alerts should be taken - consider market context, trend, and channel quality
- **Alert Timing**: Alerts fire on bar close by default. Ensure "Once Per Bar Close" is selected to avoid false signals during bar formation
- **Notification Delivery**: Mobile/email alerts may have 1-3 second delay. For immediate execution, use desktop popups or webhook automation
- **Cooldown Necessity**: Without cooldown, rapidly touching price action can generate excessive alerts. Start with 3-bar cooldown and adjust based on alert volume
- **ATR Filter Impact**: Enabling ATR filter dramatically reduces alert count but improves quality. Track filter status in info table to understand when you're receiving fewer alerts
- **Commission Awareness**: High alert frequency means high potential trade count. Calculate if your commission structure supports frequent scalping before acting on all alerts
## COMPATIBLE MARKETS:
Works on any instrument with price data including stock indices (NQ, ES, YM, RTY), individual stocks, forex pairs (EUR/USD, GBP/USD), cryptocurrency (BTC, ETH), and commodities. Volume-based features are not included in this indicator version. Multi-timeframe ATR requires higher-tier TradingView subscription for request.security() functionality on timeframes below chart timeframe.
## KNOWN LIMITATIONS:
- **Indicator does not execute trades** - alerts are informational only; you must manually place all orders
- **Alert delivery depends on TradingView infrastructure** - delays or failures possible during platform issues
- **No position tracking** - indicator doesn't know if you're in a trade; you must manage open positions independently
- **TP/SL levels are reference only** - you must manually set these on your broker platform; they are not live orders
- **Immediate touch entry can generate many alerts** in choppy zones without adequate cooldown
- **Channel deletion at 10-tick breaks** may be too aggressive or lenient depending on instrument tick size
- **ATR filter from lower timeframes** requires TradingView Premium/Pro+ for request.security()
- **Mean reversion logic fails** in strong breakout scenarios - alerts will fire but trades may hit stops
- **No partial closing capability** - full position management is manual; you determine scaling out
- **Alerts do not account for gaps** or overnight price changes; morning alerts may be stale
## RISK DISCLOSURE:
Trading involves substantial risk of loss. This indicator provides signals for educational and informational purposes only and does not constitute financial advice. Past performance does not guarantee future results. Mean reversion strategies can experience extended drawdowns during trending markets. Alerts are not guaranteed to be profitable and should be combined with your own analysis. Stop losses may not fill at intended levels during extreme volatility or gaps. Never trade with capital you cannot afford to lose. Consider consulting a licensed financial advisor before making trading decisions. Always verify alerts against current market conditions before executing trades manually.
## ACKNOWLEDGMENT & CREDITS:
This indicator is built upon the channel detection methodology created by **AlgoAlpha** in the "Smart Money Breakout Channels" indicator. Full credit and appreciation to AlgoAlpha for pioneering the normalized volatility approach to identifying consolidation patterns. The core channel formation logic using normalized price standard deviation is AlgoAlpha's original contribution to the TradingView community.
Enhancements to the original concept include: mean reversion entry logic (vs breakout), immediate touch-based alert generation, comprehensive alert condition system with customizable notifications, multi-timeframe ATR volatility filtering, cooldown period for alert management, dual TP methods (fixed points vs channel percentage), visual TP/SL reference lines, and real-time status monitoring table. This indicator version is specifically designed for manual traders who prefer alert-based decision making over automated execution.

BOCS AdaptiveBOCS Adaptive Strategy - Automated Volatility Breakout System
WHAT THIS STRATEGY DOES:
This is an automated trading strategy that detects consolidation patterns through volatility analysis and executes trades when price breaks out of these channels. Take-profit and stop-loss levels are calculated dynamically using Average True Range (ATR) to adapt to current market volatility. The strategy closes positions partially at the first profit target and exits the remainder at the second target or stop loss.
TECHNICAL METHODOLOGY:
Price Normalization Process:
The strategy begins by normalizing price to create a consistent measurement scale. It calculates the highest high and lowest low over a user-defined lookback period (default 100 bars). The current close price is then normalized using the formula: (close - lowest_low) / (highest_high - lowest_low). This produces values between 0 and 1, allowing volatility analysis to work consistently across different instruments and price levels.
Volatility Detection:
A 14-period standard deviation is applied to the normalized price series. Standard deviation measures how much prices deviate from their average - higher values indicate volatility expansion, lower values indicate consolidation. The strategy uses ta.highestbars() and ta.lowestbars() functions to track when volatility reaches peaks and troughs over the detection length period (default 14 bars).
Channel Formation Logic:
When volatility crosses from a high level to a low level, this signals the beginning of a consolidation phase. The strategy records this moment using ta.crossover(upper, lower) and begins tracking the highest and lowest prices during the consolidation. These become the channel boundaries. The duration between the crossover and current bar must exceed 10 bars minimum to avoid false channels from brief volatility spikes. Channels are drawn using box objects with the recorded high/low boundaries.
Breakout Signal Generation:
Two detection modes are available:
Strong Closes Mode (default): Breakout occurs when the candle body midpoint math.avg(close, open) exceeds the channel boundary. This filters out wick-only breaks.
Any Touch Mode: Breakout occurs when the close price exceeds the boundary.
When price closes above the upper channel boundary, a bullish breakout signal generates. When price closes below the lower boundary, a bearish breakout signal generates. The channel is then removed from the chart.
ATR-Based Risk Management:
The strategy uses request.security() to fetch ATR values from a specified timeframe, which can differ from the chart timeframe. For example, on a 5-minute chart, you can use 1-minute ATR for more responsive calculations. The ATR is calculated using ta.atr(length) with a user-defined period (default 14).
Exit levels are calculated at the moment of breakout:
Long Entry Price = Upper channel boundary
Long TP1 = Entry + (ATR × TP1 Multiplier)
Long TP2 = Entry + (ATR × TP2 Multiplier)
Long SL = Entry - (ATR × SL Multiplier)
For short trades, the calculation inverts:
Short Entry Price = Lower channel boundary
Short TP1 = Entry - (ATR × TP1 Multiplier)
Short TP2 = Entry - (ATR × TP2 Multiplier)
Short SL = Entry + (ATR × SL Multiplier)
Trade Execution Logic:
When a breakout occurs, the strategy checks if trading hours filter is satisfied (if enabled) and if position size equals zero (no existing position). If volume confirmation is enabled, it also verifies that current volume exceeds 1.2 times the 20-period simple moving average.
If all conditions are met:
strategy.entry() opens a position using the user-defined number of contracts
strategy.exit() immediately places a stop loss order
The code monitors price against TP1 and TP2 levels on each bar
When price reaches TP1, strategy.close() closes the specified number of contracts (e.g., if you enter with 3 contracts and set TP1 close to 1, it closes 1 contract). When price reaches TP2, it closes all remaining contracts. If stop loss is hit first, the entire position exits via the strategy.exit() order.
Volume Analysis System:
The strategy uses ta.requestUpAndDownVolume(timeframe) to fetch up volume, down volume, and volume delta from a specified timeframe. Three display modes are available:
Volume Mode: Shows total volume as bars scaled relative to the 20-period average
Comparison Mode: Shows up volume and down volume as separate bars above/below the channel midline
Delta Mode: Shows net volume delta (up volume - down volume) as bars, positive values above midline, negative below
The volume confirmation logic compares breakout bar volume to the 20-period SMA. If volume ÷ average > 1.2, the breakout is classified as "confirmed." When volume confirmation is enabled in settings, only confirmed breakouts generate trades.
INPUT PARAMETERS:
Strategy Settings:
Number of Contracts: Fixed quantity to trade per signal (1-1000)
Require Volume Confirmation: Toggle to only trade signals with volume >120% of average
TP1 Close Contracts: Exact number of contracts to close at first target (1-1000)
Use Trading Hours Filter: Toggle to restrict trading to specified session
Trading Hours: Session input in HHMM-HHMM format (e.g., "0930-1600")
Main Settings:
Normalization Length: Lookback bars for high/low calculation (1-500, default 100)
Box Detection Length: Period for volatility peak/trough detection (1-100, default 14)
Strong Closes Only: Toggle between body midpoint vs close price for breakout detection
Nested Channels: Allow multiple overlapping channels vs single channel at a time
ATR TP/SL Settings:
ATR Timeframe: Source timeframe for ATR calculation (1, 5, 15, 60, etc.)
ATR Length: Smoothing period for ATR (1-100, default 14)
Take Profit 1 Multiplier: Distance from entry as multiple of ATR (0.1-10.0, default 2.0)
Take Profit 2 Multiplier: Distance from entry as multiple of ATR (0.1-10.0, default 3.0)
Stop Loss Multiplier: Distance from entry as multiple of ATR (0.1-10.0, default 1.0)
Enable Take Profit 2: Toggle second profit target on/off
VISUAL INDICATORS:
Channel boxes with semi-transparent fill showing consolidation zones
Green/red colored zones at channel boundaries indicating breakout areas
Volume bars displayed within channels using selected mode
TP/SL lines with labels showing both price level and distance in points
Entry signals marked with up/down triangles at breakout price
Strategy status table showing position, contracts, P&L, ATR values, and volume confirmation status
HOW TO USE:
For 2-Minute Scalping:
Set ATR Timeframe to "1" (1-minute), ATR Length to 12, TP1 Multiplier to 2.0, TP2 Multiplier to 3.0, SL Multiplier to 1.5. Enable volume confirmation and strong closes only. Use trading hours filter to avoid low-volume periods.
For 5-15 Minute Day Trading:
Set ATR Timeframe to match chart or use 5-minute, ATR Length to 14, TP1 Multiplier to 2.0, TP2 Multiplier to 3.5, SL Multiplier to 1.2. Volume confirmation recommended but optional.
For Hourly+ Swing Trading:
Set ATR Timeframe to 15-30 minute, ATR Length to 14-21, TP1 Multiplier to 2.5, TP2 Multiplier to 4.0, SL Multiplier to 1.5. Volume confirmation optional, nested channels can be enabled for multiple setups.
BACKTEST CONSIDERATIONS:
Strategy performs best during trending or volatility expansion phases
Consolidation-heavy or choppy markets produce more false signals
Shorter timeframes require wider stop loss multipliers due to noise
Commission and slippage significantly impact performance on sub-5-minute charts
Volume confirmation generally improves win rate but reduces trade frequency
ATR multipliers should be optimized for specific instrument characteristics
COMPATIBLE MARKETS:
Works on any instrument with price and volume data including forex pairs, stock indices, individual stocks, cryptocurrency, commodities, and futures contracts. Requires TradingView data feed that includes volume for volume confirmation features to function.
KNOWN LIMITATIONS:
Stop losses execute via strategy.exit() and may not fill at exact levels during gaps or extreme volatility
request.security() on lower timeframes requires higher-tier TradingView subscription
False breakouts inherent to breakout strategies cannot be completely eliminated
Performance varies significantly based on market regime (trending vs ranging)
Partial closing logic requires sufficient position size relative to TP1 close contracts setting
RISK DISCLOSURE:
Trading involves substantial risk of loss. Past performance of this or any strategy does not guarantee future results. This strategy is provided for educational purposes and automated backtesting. Thoroughly test on historical data and paper trade before risking real capital. Market conditions change and strategies that worked historically may fail in the future. Use appropriate position sizing and never risk more than you can afford to lose. Consider consulting a licensed financial advisor before making trading decisions.
ACKNOWLEDGMENT & CREDITS:
This strategy is built upon the channel detection methodology created by AlgoAlpha in the "Smart Money Breakout Channels" indicator. Full credit and appreciation to AlgoAlpha for pioneering the normalized volatility approach to identifying consolidation patterns and sharing this innovative technique with the TradingView community. The enhancements added to the original concept include automated trade execution, multi-timeframe ATR-based risk management, partial position closing by contract count, volume confirmation filtering, and real-time position monitoring.

Intrabar Volume Delta — RealTime + History (Stocks/Crypto/Forex)Intrabar Volume Delta Grid — RealTime + History (Stocks/Crypto/Forex)
# Short Description
Shows intrabar Up/Down volume, Delta (absolute/relative) and UpShare% in a compact grid for both real-time and historical bars. Includes an MTF (M1…D1) dashboard, contextual coloring, density controls, and alerts on Δ and UpShare%. Smart historical splitting (“History Mode”) for Crypto/Futures/FX.
---
# What it does (Quick)
* **UpVol / DownVol / Δ / UpShare%** — visualizes order-flow inside each candle.
* **Real-time** — accumulates intrabar volume live by tick-direction.
* **History Mode** — splits Up/Down on closed bars via simple or range-aware logic.
* **MTF Dashboard** — one table view across M1, M5, M15, M30, H1, H4, D1 (Vol, Up/Down, Δ%, Share, Trend).
* **Contextual opacity** — stronger signals appear bolder.
* **Label density** — draw every N-th bar and limit to last X bars for performance.
* **Alerts** — thresholds for |Δ|, Δ%, and UpShare%.
---
# How it works (Real-Time vs History)
* **Real-time (open bar):** volume increments into **UpVolRT** or **DownVolRT** depending on last price move (↑ goes to Up, ↓ to Down). This approximates live order-flow even when full tick history isn’t available.
* **History (closed bars):**
* **None** — no split (Up/Down = 0/0). Safest for equities/indices with unreliable tick history.
* **Approx (Close vs Open)** — all volume goes to candle direction (green → Up 100%, red → Down 100%). Fast but yields many 0/100% bars.
* **Price Action Based** — splits by Close position within High-Low range; strength = |Close−mid|/(High−Low). Above mid → more Up; below mid → more Down. Falls back to direction if High==Low.
* **Auto** — **Stocks/Index → None**, **Crypto/Futures/FX → Approx**. If you see too many 0/100 bars, switch to **Price Action Based**.
---
# Rows & Meaning
* **Volume** — total bar volume (no split).
* **UpVol / DownVol** — directional intrabar volume.
* **Delta (Δ)** — UpVol − DownVol.
* **Absolute**: raw units
* **Relative (Δ%)**: Δ / (Up+Down) × 100
* **Both**: shows both formats
* **UpShare%** — UpVol / (Up+Down) × 100. >50% bullish, <50% bearish.
* Helpful icons: ▲ (>65%), ▼ (<35%).
---
# MTF Dashboard (🔧 Enable Dashboard)
A single table with **Vol, Up, Down, Δ%, Share, Trend (🔼/🔽/⏭️)** for selected timeframes (M1…D1). Great for a fast “panorama” read of flow alignment across horizons.
---
# Inputs (Grouped)
## Display
* Toggle rows: **Volume / Up / Down / Delta / UpShare**
* **Delta Display**: Absolute / Relative / Both
## Realtime & History
* **History Mode**: Auto / None / Approx / Price Action Based
* **Compact Numbers**: 1.2k, 1.25M, 3.4B…
## Theme & UI
* **Theme Mode**: Auto / Light / Dark
* **Row Spacing**: vertical spacing between rows
* **Top Row Y**: moves the whole grid vertically
* **Draw Guide Lines**: faint dotted guides
* **Text Size**: Tiny / Small / Normal / Large
## 🔧 Dashboard Settings
* **Enable Dashboard**
* **📏 Table Text Size**: Tiny…Huge
* **🦓 Zebra Rows**
* **🔲 Table Border**
## ⏰ Timeframes (for Dashboard)
* **M1…D1** toggles
## Contextual Coloring
* **Enable Contextual Coloring**: opacity by signal strength
* **Δ% cap / Share offset cap**: saturation caps
* **Min/Max transparency**: solid vs faint extremes
## Label Density & Size
* **Show every N-th bar**: draw labels only every Nth bar
* **Limit to last X bars**: keep labels only in the most recent X bars
## Colors
* Up / Down / Text / Guide
## Alerts
* **Delta Threshold (abs)** — |Δ| in volume units
* **UpShare > / <** — bullish/bearish thresholds
* **Enable Δ% Alert**, **Δ% > +**, **Δ% < −** — relative delta levels
---
# How to use (Quick Start)
1. Add the indicator to your chart (overlay=false → separate pane).
2. **History Mode**:
* Crypto/Futures/FX → keep **Auto** or switch to **Price Action Based** for richer history.
* Stocks/Index → prefer **None** or **Price Action Based** for safer splits.
3. **Label Density**: start with **Limit to last X bars = 30–150** and **Show every N-th bar = 2–4**.
4. **Contextual Coloring**: keep on to emphasize strong Δ% / Share moves.
5. **Dashboard**: enable and pick only the TFs you actually use.
6. **Alerts**: set thresholds (ideas below).
---
# Alerts (in TradingView)
Add alert → pick this indicator → choose any of:
* **Delta exceeds threshold** (|Δ| > X)
* **UpShare above threshold** (UpShare% > X)
* **UpShare below threshold** (UpShare% < X)
* **Relative Delta above +X%**
* **Relative Delta below −X%**
**Starter thresholds (tune per symbol & TF):**
* **Crypto M1/M5**: Δ% > +25…35 (bullish), Δ% < −25…−35 (bearish)
* **FX (tick volume)**: UpShare > 60–65% or < 40–35%
* **Stocks (liquid)**: set **Absolute Δ** by typical volume scale (e.g., 50k / 100k / 500k)
---
# Notes by Market Type
* **Crypto/Futures**: 24/7 and high liquidity — **Price Action Based** often gives nicer history splits than Approx.
* **Forex (FX)**: TradingView volume is typically **tick volume** (not true exchange volume). Treat Δ/Share as tick-based flow, still very useful intraday.
* **Stocks/Index**: historical tick detail can be limited. **None** or **Price Action Based** is a safer default. If you see too many 0/100% shares, switch away from Approx.
---
# “All Timeframes” accuracy
* Works on **any TF** (M1 → D1/W1).
* **Real-time accuracy** is strong for the open bar (live accumulation).
* **Historical accuracy** depends on your **History Mode** (None = safest, Approx = fastest/simplest, Price Action Based = more nuanced).
* The MTF dashboard uses `request.security` and therefore follows the same logic per TF.
---
# Trade Ideas (Use-Cases)
* **Scalping (M1–M5)**: a spike in Δ% + UpShare>65% + rising total Vol → momentum entries.
* **Intraday (M5–M30–H1)**: when multiple TFs show aligned Δ%/Share (e.g., M5 & M15 bullish), join the trend.
* **Swing (H4–D1)**: persistent Δ% > 0 and UpShare > 55–60% → structural accumulation bias.
---
# Advantages
* **True-feeling live flow** on the open bar.
* **Adaptable history** (three modes) to match data quality.
* **Clean visual layout** with guides, compact numbers, contextual opacity.
* **MTF snapshot** for quick bias read.
* **Performance controls** (last X bars, every N-th bar).
---
# Limitations & Care
* **FX uses tick volume** — interpret Δ/Share accordingly.
* **History Mode is an approximation** — confirm with trend/structure/liquidity context.
* **Illiquid symbols** can produce noisy or contradictory signals.
* **Too many labels** can slow charts → raise N, lower X, or disable guides.
---
# Best Practices (Checklist)
* Crypto/Futures: prefer **Price Action Based** for history.
* Stocks: **None** or **Price Action Based**; be cautious with **Approx**.
* FX: pair Δ% & UpShare% with session context (London/NY) and volatility.
* If labels overlap: tweak **Row Spacing** and **Text Size**.
* In the dashboard, keep only the TFs you actually act on.
* Alerts: start around **Δ% 25–35** for “punchy” moves, then refine per asset.
---
# FAQ
**1) Why do some closed bars show 0%/100% UpShare?**
You’re on **Approx** history mode. Switch to **Price Action Based** for smoother splits.
**2) Δ% looks strong but price doesn’t move — why?**
Δ% is an **order-flow** measure. Price also depends on liquidity pockets, sessions, news, higher-timeframe structure. Use confirmations.
**3) Performance slowdown — what to do?**
Lower **Limit to last X bars** (e.g., 30–100), increase **Show every N-th bar** (2–6), or disable **Draw Guide Lines**.
**4) Dashboard values don’t “match” the grid exactly?**
Dashboard is multi-TF via `request.security` and follows the history logic per TF. Differences are normal.
---
# Short “Store” Marketing Blurb
Intrabar Volume Delta Grid reveals the order-flow inside every candle (Up/Down, Δ, UpShare%) — live and on history. With smart history splitting, an MTF dashboard, contextual emphasis, and flexible alerts, it helps you spot momentum and bias across Crypto, Forex (tick volume), and Stocks. Tidy labels and compact numbers keep the panel readable and fast.

Killzone za Forex - @mladja123This indicator marks the Kill Zones for Forex pairs, identifying the most active trading sessions and price areas with increased volatility. It allows traders to focus on high-probability trading windows, improving timing for entries, exits, and trade management in the Forex market.

Standardized Cumulative Deltas [LuxAlgo]The Standardized Cumulative Deltas tool allows traders to compare the cumulative standardized open-close difference for up to 10 different tickers, allowing them to visualize the general sentiment for all selected tickers.
These results allow the construction of two areas showing the average or extreme bullish and bearish cumulative change for all enabled tickers, providing a summarized view of the overall ticker group sentiment.
🔶 USAGE
This tool is meant to give a full picture of the individuals and/or overall selected tickers, and unlike classical indicators, the displayed series of values is not meant to be directly interpreted over time.
Given the selected lookback period, a majority of observations being above 0 indicate an overall bullish market for the asset.
By default, the auto lookback period feature is enabled, allowing the tool to use all the visible bars for its calculations. Traders can also set the lookback period manually. The above chart uses a fixed lookback period of 500.
Up to 10 tickers can be used. While major cryptocurrencies are set by default, the users can set a specific basket of assets, such as US equities, forex pairs, commodities, etc.
🔹 Densities
The provided areas, here called densities, can be used to get an overall sentiment of the selected tickers. The upper density (bullish) processes positive deltas, while the lower one (bearish) processes negative ones.
Interpretation is subject to the selected "Density Mode".
Average: Densities track the average bullish/bearish cumulative deltas for the selected tickers. For example, a more prominent bullish density would indicate that, on average, cumulative deltas were positive across the tickers.
Envelope: Densities track the extreme values made by bullish/bearish cumulative deltas for the selected tickers. Here, a more prominent density would indicate more volatile bullish/bearish movements, depending on the density.
🔹 Dashboard
The tool features a dashboard with active tickers and their respective colors for traders' convenience.
🔶 DETAILS
🔹 Densities
Densities are obtained by applying a forward-backward exponential moving average on the average, or the highest/lowest cumulative series, depending on the selected Density Mode.
The resulting densities are smoothed by the "Smoothing" parameter located in the Settings panel, with higher values returning smoother envelopes with less variability.
Do note that the smoothing method used here is subject to repainting.
🔶 SETTINGS
Lookback: Select the lookback period and enable/disable the Auto Lookback feature
Tickers: Enable/disable and select up to 10 tickers and their colors
Density Mode: Determine how densities are calculated
🔹 Dashboard
Show Dashboard: Enable/disable the dashboard
Position: Select the dashboard position
Size: Select the dashboard size
🔹 Style
Density: Enable/disable the density areas
Bullish Density: Select the color of the top density area
Bearish Density: Select the color of the bottom density area
Smoothing: Select the smoothing constant for the EMA calculation

Current Bar Pips — Upper Right Quick pip counter for Forex pairs. Adds an indicator to top right to show the current candle's pip count in red if negative, green if positive. It will also show the total range of pips for the candle from wick to wick.
Dual Custom Index with SpreadDual Custom Index with Spread
Create powerful custom indices from any instruments and analyze their relative strength dynamics
Overview
This advanced indicator allows you to build two completely customizable indices from your choice of instruments and analyze their spread relationship. Perfect for inter-market analysis, sector rotation strategies, currency strength comparisons, and sophisticated relative performance studies.
Key Features
🔧 Fully Customizable Index Construction
Build each index from up to 6 instruments with individual weightings
Enable/disable instruments on the fly without losing settings
Automatic weight validation ensures mathematically accurate calculations
Invert functionality for instruments that move opposite to index strength
📊 Advanced ADX-Based Methodology
Uses sophisticated ADX +DI/-DI directional bias calculations
Normalized bias calculation for consistent scaling across different instruments
Optimized default settings for intraday trading with full customization options
Professional-grade smoothing and filtering options
📈 Dual Analysis Modes
Difference Mode: Shows absolute strength difference (Index1 - Index2)
Ratio Mode: Shows relative performance ratio (Index1 / Index2)
Additional spread smoothing for cleaner signals
🎨 Professional Display Options
Custom labels with full color, size, and positioning control
Dynamic "Follow Line" labels that move with your data
Static corner positioning for reference displays
Clean error messaging and validation feedback
Use Cases
Gold Trading: Create gold strength vs USD strength indices for precise market timing
Sector Analysis: Compare technology vs financial sector strength for rotation strategies
Currency Strength: Build custom currency baskets for advanced forex analysis
Commodity Spreads: Analyze relative strength between different commodity groups
Regional Markets: Compare strength between different geographical market indices
Crypto Analysis: Track relative performance between different cryptocurrency sectors
Technical Specifications
Instruments per Index: Up to 6 with individual enable/disable
Weight Validation: Automatic 100% total weight enforcement
Calculation Method: ADX-based directional bias with trend strength weighting
Smoothing Options: Multiple levels of customizable smoothing
Error Handling: Professional validation with clear user feedback
Optimization Tips
Intraday Trading: Use DI Length 3-7 for faster response
Daily Analysis: Use DI Length 10-14 for smoother signals
Noisy Markets: Increase Final Smoothing for cleaner signals
Trending Markets: Lower smoothing values for faster reaction
Perfect for traders who need sophisticated inter-market analysis tools beyond standard indicators. Whether you're analyzing gold vs dollar dynamics, sector rotation opportunities, or custom currency strength relationships, this indicator provides institutional-grade analysis capabilities with complete customization flexibility.

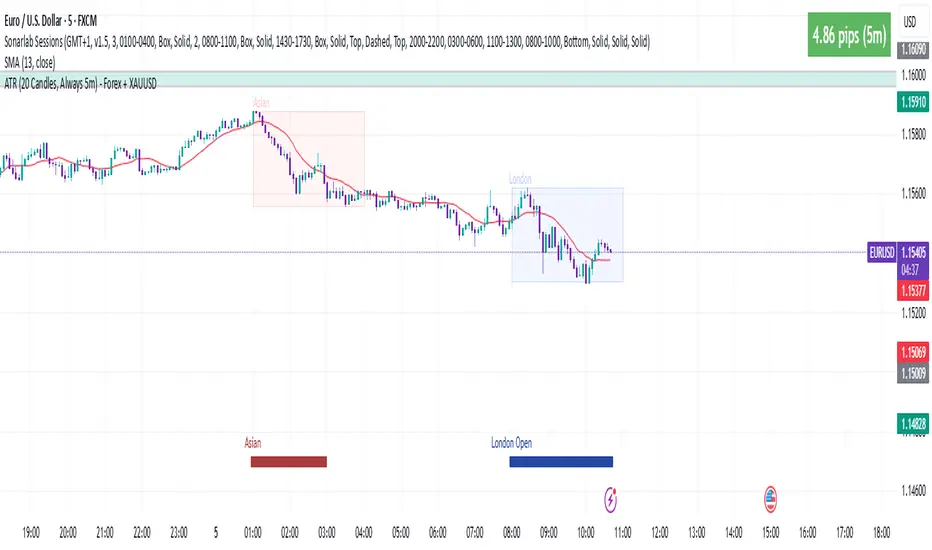
ATR 5 min- FOREX + XAUThis indicator displays the Average True Range (ATR) over the last 20 candles, calculated using the 5-minute timeframe, regardless of the chart timeframe you're currently viewing.
It supports:
All major forex pairs
XAUUSD (Gold), with ATR displayed in full dollars
Key Features
Always reflects 5-minute volatility
Accurate pip scaling:
JPY pairs = 1 pip = 0.01
Other forex pairs = 1 pip = 0.0001
XAUUSD = 1 pip = 1.00 (i.e., full dollar)
Clean and minimal top-right table display
Automatically adapts based on the instrument you're viewing
Helps traders gauge recent market volatility across timeframes
This is an ideal tool for scalpers, intraday traders, or swing traders who want to monitor short-term volatility conditions from any timeframe view.
Advanced Forex Currency Strength Meter
# Advanced Forex Currency Strength Meter
🚀 The Ultimate Currency Strength Analysis Tool for Forex Traders
This sophisticated indicator measures and compares the relative strength of major currencies (EUR, GBP, USD, JPY, CHF, CAD, AUD, NZD) to help you identify the strongest and weakest currencies in real-time, providing clear trading signals based on currency strength differentials.
## 📊 What This Indicator Does
The Advanced Forex Currency Strength Meter analyzes currency relationships across 28+ major forex pairs and 8 currency indices to determine which currencies are gaining or losing strength. Instead of relying on individual pair analysis, this tool gives you a bird's-eye view of the entire forex market, helping you:
Identify the strongest and weakest currencies at any given time
Find high-probability trading opportunities by pairing strong vs weak currencies
Avoid ranging markets by detecting when currencies have similar strength
Get clear LONG/SHORT/NEUTRAL signals for your current trading pair
Optimize your trading strategy based on your preferred timeframe and holding period
## ⚙️ How The Indicator Works
### Dual Calculation Method
The indicator uses a sophisticated dual approach for maximum accuracy:
Pairs-Based Analysis: Calculates currency strength from 28+ major forex pairs (EURUSD, GBPUSD, USDJPY, etc.)
Index-Based Analysis: Incorporates official currency indices (DXY, EXY, BXY, JXY, CXY, AXY, SXY, ZXY)
Weighted Combination: Blends both methods using smart weighting for enhanced accuracy
### Smart Auto-Optimization System
The indicator automatically adjusts its parameters based on your chart timeframe and intended holding period:
The system recognizes that scalping requires different sensitivity than swing trading, automatically optimizing lookback periods, analysis timeframes, signal thresholds, and index weights.
### Strength Calculation Process
Fetches price data from multiple timeframes using optimized tuple requests
Calculates percentage change over the specified lookback period
Optionally normalizes by ATR (Average True Range) to account for volatility differences
Combines pair-based and index-based calculations using dynamic weighting
Generates relative strength by comparing base currency vs quote currency
Produces clear trading signals when strength differential exceeds threshold
## 🎯 How To Use The Indicator
### Quick Start
Add the indicator to any forex pair chart
Enable 🧠 Smart Auto-Optimization (recommended for beginners)
Watch for LONG 🚀 signals when the relative strength line is green and above threshold
Watch for SHORT 🐻 signals when the relative strength line is red and below threshold
Avoid trading during NEUTRAL ⚪ periods when currencies have similar strength
Note: This is highly recommended to couple this indicator with fundamental analysis and use it as an extra signal.
### 📋 Parameters Reference
#### 🤖 Smart Settings
🧠 Smart Auto-Optimization: (Default: Enabled) Automatically optimizes all parameters based on chart timeframe and trading style
#### ⚙️ Manual Override
These settings are only active when Smart Auto-Optimization is disabled:
Manual Lookback Period: (Default: 14) Number of periods to analyze for strength calculation
Manual ATR Period: (Default: 14) Period for ATR normalization calculation
Manual Analysis Timeframe: (Default: 240) Higher timeframe for strength analysis
Manual Index Weight: (Default: 0.5) Weight given to currency indices vs pairs (0.0 = pairs only, 1.0 = indices only)
Manual Signal Threshold: (Default: 0.5) Minimum strength differential required for trading signals
#### 📊 Display
Show Signal Markers: (Default: Enabled) Display triangle markers when signals change
Show Info Label: (Default: Enabled) Show comprehensive information label with current analysis
#### 🔍 Analysis
Use ATR Normalization: (Default: Enabled) Normalize strength calculations by volatility for fairer comparison
#### 💰 Currency Indices
💰 Use Currency Indices: (Default: Enabled) Include all 8 currency indices in strength calculation for enhanced accuracy
#### 🎨 Colors
Strong Currency Color: (Default: Green) Color for positive/strong signals
Weak Currency Color: (Default: Red) Color for negative/weak signals
Neutral Color: (Default: Gray) Color for neutral conditions
Strong/Weak Backgrounds: Background colors for clear signal visualization
### 🧠 Smart Optimization Profiles
The indicator automatically selects optimal parameters based on your chart timeframe:
#### ⚡ Scalping Profile (1M-5M Charts)
For positions held for a few minutes:
Lookback: 5 periods (fast/sensitive)
Analysis Timeframe: 15 minutes
Index Weight: 20% (favor pairs for speed)
Signal Threshold: 0.3% (sensitive triggers)
#### 📈 Intraday Profile (10M-1H Charts)
For positions held for a few hours:
Lookback: 12 periods (balanced sensitivity)
Analysis Timeframe: 4 hours
Index Weight: 40% (balanced approach)
Signal Threshold: 0.4% (moderate sensitivity)
#### 📊 Swing Profile (4H-Daily Charts)
For positions held for a few days:
Lookback: 21 periods (stable analysis)
Analysis Timeframe: Daily
Index Weight: 60% (favor indices for stability)
Signal Threshold: 0.5% (conservative triggers)
#### 📆 Position Profile (Weekly+ Charts)
For positions held for a few weeks:
Lookback: 30 periods (long-term view)
Analysis Timeframe: Weekly
Index Weight: 70% (heavily favor indices)
Signal Threshold: 0.6% (very conservative)
### Entry Timing
Wait for clear LONG 🚀 or SHORT 🐻 signals
Avoid trading during NEUTRAL ⚪ periods
Look for signal confirmations on multiple timeframes
### Risk Management
Stronger signals (higher relative strength values) suggest higher probability trades
Use appropriate position sizing based on signal strength
Consider the trading style profile when setting stop losses and take profits
💡 Pro Tip: The indicator works best when combined with your existing technical analysis. Use currency strength to identify which pairs to trade, then use your favorite technical indicators to determine when to enter and exit.
## 🔧 Key Features
28+ Forex Pairs Analysis: Comprehensive coverage of major currency relationships
8 Currency Indices Integration: DXY, EXY, BXY, JXY, CXY, AXY, SXY, ZXY for enhanced accuracy
Smart Auto-Optimization: Automatically adapts to your trading style and timeframe
ATR Normalization: Fair comparison across different currency pairs and volatility levels
Real-Time Signals: Clear LONG/SHORT/NEUTRAL signals with visual markers
Performance Optimized: Efficient tuple-based data requests minimize external calls
User-Friendly Interface: Simplified settings with comprehensive tooltips
Multi-Timeframe Support: Works on any timeframe from 1-minute to monthly charts
Transform your forex trading with the power of currency strength analysis! 🚀

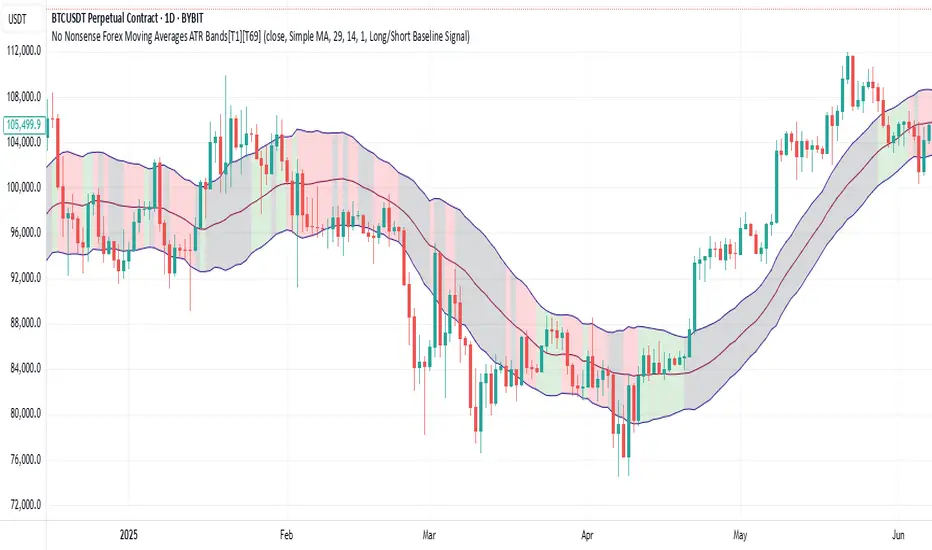
No Nonsense Forex Moving Averages ATR Bands[T1][T69]🔍 Overview
This indicator implements a No Nonsense Forex-style Baseline combined with ATR Bands, built using the moving_averages_library by Teyo69. It plots a configurable moving average and dynamically adjusts upper/lower ATR bands for trade zone detection and baseline confirmation.
✨ Features
30+ Moving Average types
ATR bands to define dynamic trade zones
Visual background highlighting for trade signals
Supports both "Within Range" and "Baseline Bias" display modes
Clean, minimal overlay with effective zone coloring
⚙️ How to Use
Choose MA Type: Select the baseline logic (SMA, EMA, HMA, etc.)
Configure ATR Bands: Adjust the ATR length and multiplier
Select Background Mode:
Within Range: Yellow = price inside band, Gray = outside
Long/Short Baseline Signal: Green = price above baseline, Red = below
Trade Setup:
Use the baseline for trend direction
Wait for confirmation or avoidance when price is outside the band
🛠 Configuration
Source: Price source for MA
MA Type: Any supported MA from the library
MA Length: Number of bars for smoothing
ATR Length: Period for Average True Range
ATR Multiplier: Width of the bands
Background Signal Mode: Choose visual signal type
⚠️ Limitations
Works with one MA at a time
Requires the moving_averages_library imported
Does not include confirmation or exit logic — use with full NNFX stack
💡 Tips
Combine with Volume or Confirmation indicators for NNFX strategy
Use adaptive MAs like KAMA, JMA, or VIDYA for dynamic baselines
Adjust ATR settings based on asset volatility
📘 Credits
Library: Teyo69/moving_averages_library/1
Inspired by: No Nonsense Forex (VP) Baseline + ATR Band methodology & MigthyZinger
Williams VIX For Bottoms [DCD]Williams VIX Original - Authentic Volatility Fear Gauge
What This Indicator Does
The Williams VIX Fix measures market fear by calculating how far current lows deviate from recent highs, identifying potential market bottoms during high volatility periods. This implementation provides Larry Williams' original formula in its purest form.
How It Works
Core Formula:
VIX Fix = ((Highest High over 22 periods - Current Low) / Highest High over 22 periods) × 100
The calculation process:
Measures Relative Distance: Compares current low to highest high over lookback period
Converts to Percentage: Normalizes values for cross-market comparison
Applies Statistical Analysis: Uses Bollinger Bands (2 std dev) around VIX Fix values
Filters with Percentiles: 85th percentile threshold removes noise
Signal Generation
Green Flash Signals trigger when either condition is met:
VIX Fix exceeds upper Bollinger Band (2 standard deviations above 20-period MA)
VIX Fix exceeds Range High (85th percentile of recent values)
This dual-condition approach reduces false signals while capturing genuine volatility spikes.
What Makes This Original
Pure Formula Implementation: Uses Williams' exact original calculation without modifications
Dual Confirmation System: Combines Bollinger Bands with percentile analysis
Professional Visualization: Histogram display, background highlighting, and live value table
Comprehensive Alerts: Signal start/end notifications plus Green Flash alerts
How to Use
Primary Purpose: Spot high-probability reversal zones during market fear climaxes
Signal Interpretation:
Green triangle + background highlight = High volatility reversal zone
Higher VIX Fix values = Stronger fear/better reversal potential
Use with price action confirmation for best results
Optimal Settings:
Timeframes: 4H, Daily, Weekly
Markets: All (stocks, crypto, forex, commodities)
Combine with support levels and candlestick patterns
Key Parameters:
VIX Fix Length (22): Lookback period for highest high
Std Dev Multiplier (2.0): Bollinger Band sensitivity
Percentile High (0.85): Only top 15% of readings trigger signals
The VIX Fix excels at identifying market fear climaxes that coincide with significant price bottoms, making it valuable for swing traders seeking high-probability entries during market stress.

Session Status Table📌 Session Status Table
Session Status Table is an indicator that displays the real-time status of the four major trading sessions:
* 🇯🇵 Asia (Tokyo)
* 🇬🇧 London
* 🇺🇸 New York AM
* 🇺🇸 New York PM
It shows which sessions are currently open, how much time remains until they open or close, and optionally sends alerts in advance.
🧩 Features:
* Real-time session table — shows the status of each session on the chart.
* Color-coded statuses:
* 🟢 Green – Session is open
* 🔴 Red – Session is closed
* ⚪ Gray – Weekend
* Countdown timers until session open or close.
* User alerts — receive a notification a custom number of minutes before a session starts.
⚙️ Customization:
* Table position — fully configurable.
* Session colors — customizable for open, closed, and weekend states.
* Session labels — customizable with icons.
* Notifications:
* Enabled through TradingView's Alerts panel.
* User-defined lead time before session opens.
🕒 Time Zones:
All times are calculated in UTC to ensure consistency across different markets and regions, avoiding discrepancies from time zones and daylight saving time.
🚨 How to enable alerts:
1. Open the "Alerts" panel in TradingView.
2. Click "Create Alert".
3. In the condition dropdown, choose "Session Status Table".
4. Set to any alert() trigger.
5. Save — you'll be notified a set number of minutes before each session begins.
ℹ️ Technical Notes:
* Built with Pine Script version 6.
* Logically divided into clear sections: inputs, session calculations, table rendering, and alerts.
* Optimized for performance and reliability on all timeframes.
Ideal for traders who use session activity in their strategies — especially in Forex, crypto, and futures markets.

FX Fix with Adjustable TimezoneFX Fix Time Highlighter
This indicator visually highlights candlesticks at a user-defined time and timezone to help traders easily identify when the FX fix occurs. Simply set your preferred timezone and the exact time you want to mark on the chart, and the indicator will automatically highlight the corresponding candlesticks.
Ideal for forex traders who want a clear visual reference of the FX fix window, aiding in analysis of price behavior during this key market event.
Features:
Customizable timezone selection
Adjustable highlight time (hour and minute)
Automatic candlestick highlighting at the chosen time
Supports all timeframes
Use this tool to better understand market dynamics around the FX fix and improve your trading decisions.

Session-Based Sentiment Oscillator [TradeDots]Track, analyze, and monitor market sentiment across global trading sessions with this advanced multi-session sentiment analysis tool. This script provides session-specific sentiment readings for Asian (Tokyo), European (London), and US (New York) markets, combining price action, volume analysis, and volatility factors into a comprehensive sentiment oscillator. It is an original indicator designed to help traders understand regional market psychology and capitalize on cross-session sentiment shifts directly on TradingView.
📝 HOW IT WORKS
1. Multi-Component Sentiment Engine
Price Action Momentum : Calculates normalized price movement relative to recent trading ranges, providing directional sentiment readings.
Volume-Weighted Analysis : When volume data is available, incorporates volume flow direction to validate price-based sentiment signals.
Volatility-Adjusted Factors : Accounts for changing market volatility conditions by comparing current ATR against historical averages.
Weighted Combination : Merges all components using optimized weightings (Price: 1.0, Volume: 0.3, Volatility: 0.2) for balanced sentiment readings.
2. Session-Segregated Tracking
Automatic Session Detection : Precisely identifies active trading sessions based on user-configured time parameters.
Independent Calculations : Maintains separate sentiment accumulation for each major session, updated only during respective active hours.
Historical Preservation : Stores session-specific sentiment values even when sessions are closed, enabling cross-session comparison.
Real-Time Updates : Continuously processes sentiment during active sessions while preserving inactive session data.
3. Cross-Session Transition Analysis
Sentiment Differential Detection : Monitors sentiment changes when transitioning between trading sessions.
Configurable Thresholds : Generates signals only when sentiment shifts exceed user-defined minimum thresholds.
Directional Signals : Provides distinct bullish and bearish transition alerts with visual markers.
Smart Filtering : Applies smoothing algorithms to reduce false signals from minor sentiment variations.
⚙️ KEY FEATURES
1. Session-Specific Dashboard
Real-Time Status Display : Shows current session activity (ACTIVE/CLOSED) for all three major sessions.
Sentiment Percentages : Displays precise sentiment readings as percentages for easy interpretation.
Strength Classification : Automatically categorizes sentiment as HIGH (>50%), MEDIUM (20-50%), or LOW (<20%).
Customizable Positioning : Place dashboard in any corner with adjustable size options.
2. Advanced Signal Generation
Transition Alerts : Triangle markers indicate significant sentiment shifts between sessions.
Extreme Conditions : Diamond markers highlight overbought/oversold threshold breaches.
Configurable Sensitivity : Adjust signal thresholds from 0.05 to 0.50 based on trading style.
Alert Integration : Built-in TradingView alert conditions for automated notifications.
3. Forex Currency Strength Analysis
Base/Quote Decomposition : For forex pairs, separates sentiment into individual currency strength components.
Major Currency Support : Analyzes USD, EUR, GBP, JPY, CHF, CAD, AUD, NZD strength relationships.
Relative Strength Display : Shows which currency is driving pair movement during active sessions.
4. Visual Enhancement System
Session Background Colors : Distinct background shading for each active trading session.
Overbought/Oversold Zones : Configurable extreme sentiment level visualization with colored zones.
Multi-Timeframe Compatibility : Works across all timeframes while maintaining session accuracy.
Customizable Color Schemes : Full color customization for dashboard, signals, and plot elements.
🚀 HOW TO USE IT
1. Add the Script
Search for "Session-Based Sentiment Oscillator " in the Indicators tab or manually add it to your chart. The indicator will appear in a separate pane below your main chart.
2. Configure Session Times
Asian Session : Set Tokyo market hours (default: 00:00-09:00) based on your chart timezone.
European Session : Configure London market hours (default: 07:00-16:00) for European analysis.
US Session : Define New York market hours (default: 13:00-22:00) for American markets.
Timezone Adjustment : Ensure session times match your broker's specifications and account for daylight saving changes.
3. Optimize Analysis Parameters
Sentiment Period : Choose 5-50 bars (default: 14) for sentiment calculation lookback period.
Smoothing Settings : Select 1-10 bars smoothing (default: 3) with SMA, EMA, or RMA options.
Component Selection : Enable/disable volume analysis, price action, and volatility factors based on available data.
Signal Sensitivity : Adjust threshold from 0.05-0.50 (default: 0.15) for transition signal generation.
4. Interpret Readings and Signals
Positive Values : Indicate bullish sentiment for the active session.
Negative Values : Suggest bearish sentiment conditions.
Dashboard Status : Monitor which session is currently active and their respective sentiment strengths.
Transition Signals : Watch for triangle markers indicating significant cross-session sentiment changes.
Extreme Alerts : Note diamond markers when sentiment reaches overbought (>70%) or oversold (<-70%) levels.
5. Set Up Alerts
Configure TradingView alerts for:
- Bullish session transitions
- Bearish session transitions
- Overbought condition alerts
- Oversold condition alerts
❗️LIMITATIONS
1. Data Dependency
Volume Requirements : Volume-based analysis only functions when volume data is provided by your broker. Many forex brokers do not supply reliable volume data.
Price Action Focus : In absence of volume data, sentiment calculations rely primarily on price movement and volatility factors.
2. Session Time Sensitivity
Manual Adjustment Required : Session times must be manually updated for daylight saving time changes.
Broker Variations : Different brokers may have slightly different session definitions requiring time parameter adjustments.
3. Ranging Market Limitations
Trend Bias : Sentiment calculations may be less reliable during extended sideways or low-volatility market conditions.
Lag Consideration : As with all sentiment indicators, readings may lag during rapid market transitions.
4. Regional Market Focus
Major Session Coverage : Designed primarily for major global sessions; may not capture sentiment from smaller regional markets.
Weekend Gaps : Does not account for weekend gap effects on sentiment calculations.
⚠️ RISK DISCLAIMER
Trading and investing carry significant risk and can result in financial loss. The "Session-Based Sentiment Oscillator " is provided for informational and educational purposes only. It does not constitute financial advice.
- Always conduct your own research and analysis
- Use proper risk management and position sizing in all trades
- Past sentiment patterns do not guarantee future market behavior
- Combine this indicator with other technical and fundamental analysis tools
- Consider overall market context and your personal risk tolerance
This script is an original creation by TradeDots, published under the Mozilla Public License 2.0.
Session-based sentiment analysis should be used as part of a comprehensive trading strategy. No single indicator can predict market movements with certainty. Exercise proper risk management and maintain realistic expectations about indicator performance across varying market conditions.

5-Day APM for Forex PairsThis script calculates the 5-Day Average Pip Movement (APM) for major Forex pairs.
It displays the average daily range (in pips) over the past 5 trading days using true high-low price movement.
The script is optimized for clarity and minimalism — showing a single floating label on the main chart for pairs like GBPUSD, USDJPY, EURUSD, etc.
Automatically adjusts pip calculation for JPY pairs (×100) and other pairs (×10000).
✅ Great for identifying high-volatility vs low-volatility conditions
✅ Clean design with no clutter
✅ Only works on major FX pairs (whitelisted)
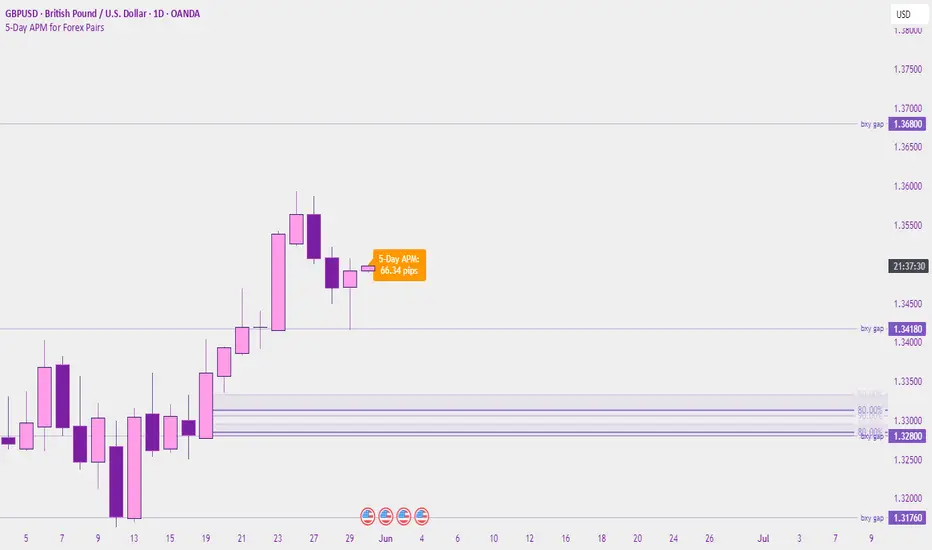
ATR Volatility giua64ATR Volatility giua64 – Smart Signal + VIX Filter
📘 Script Explanation (in English)
Title: ATR Volatility giua64 – Smart Signal + VIX Filter
This script analyzes market volatility using the Average True Range (ATR) and compares it to its moving average to determine whether volatility is HIGH, MEDIUM, or LOW.
It includes:
✅ Custom or preset configurations for different asset classes (Forex, Indices, Gold, etc.).
✅ An optional external volatility index input (like the VIX) to refine directional bias.
✅ A directional signal (LONG, SHORT, FLAT) based on ATR strength, direction, and external volatility conditions.
✅ A clean visual table showing key values such as ATR, ATR average, ATR %, VIX level, current range, extended range, and final signal.
This tool is ideal for traders looking to:
Monitor the intensity of price movements
Filter trading strategies based on volatility conditions
Identify momentum acceleration or exhaustion
⚙️ Settings Guide
Here’s a breakdown of the user inputs:
🔹 ATR Settings
Setting Description
ATR Length Number of periods for ATR calculation (default: 14)
ATR Smoothing Type of moving average used (RMA, SMA, EMA, WMA)
ATR Average Length Period for the ATR moving average baseline
🔹 Asset Class Preset
Choose between:
Manual – Define your own point multiplier and thresholds
Forex (Pips) – Auto-set for FX markets (high precision)
Indices (0.1 Points) – For index instruments like DAX or S&P
Gold (USD) – Preset suitable for XAU/USD
If Manual is selected, configure:
Setting Description
Points Multiplier Multiplies raw price ranges into useful units (e.g., 10 for Gold)
Low Volatility Threshold Threshold to define "LOW" volatility
High Volatility Threshold Threshold to define "HIGH" volatility
🔹 Extended Range and VIX
Setting Description
Timeframe for Extended High/Low Used to compare larger price ranges (e.g., Daily or Weekly)
External Volatility Index (VIX) Symbol for a volatility index like "VIX" or "EUVI"
Low VIX Threshold Below this level, VIX is considered "low" (default: 20)
High VIX Threshold Above this level, VIX is considered "high" (default: 30)
🔹 Table Display
Setting Description
Table Position Where the visual table appears on the chart (e.g., bottom_center, top_left)
Show ATR Line on Chart Whether to display the ATR line directly on the chart
✅ Signal Logic Summary
The script determines the final signal based on:
ATR being above or below its average
ATR rising or falling
ATR percentage being significant (>2%)
VIX being high or low
Conditions Signal
ATR rising + high volatility + low VIX LONG
ATR falling + high volatility + high VIX SHORT
ATR flat or low volatility or low %ATR FLAT

Intraday Pivot Highs & Lows (Asia London NY)Intraday Pivot Highs & Lows (Asia London NY)
Script Description
This TradingView indicator is optimized for Forex, scalping, intraday, and day trading strategies. It accurately plots Pivot Points and levels, high/low, support and resistance levels. These are clearly identified to aid the trader during killzone sessions and session opens. Ideal for scalp trading, intraday sessions, and leveraging SMT (Smart Money Techniques). Utilize these Price Levels effectively during London Open, NY Open, and the Asia Session, utilizing Market Structure to pinpoint key levels and reversal zones for successful trading. Improve your Trade Setups, recognize reliable Chart Patterns, identify critical Price Pivots, and trade confidently off Institutional Levels.
This script marks the intraday pivot highs, lows and midpoints retracement levels for
Asia
London
New York
It also plots the previous day's high, low, midpoint, and 0.618 Fibonacci retracement levels, providing traders with critical price reference points for making intraday trading decisions.
Originality & Usefulness
This indicator uniquely integrates pivot calculations across three major Forex sessions (Asia, London, NY), clearly delineating session boundaries.
It enhances visibility by using distinct styling
solid for New York
dashed for London
dotted lines for Asia
And colour co-ordinated labeling, improving traders' ability to identify important intraday price action zones efficiently. Unlike standard pivot indicators, this script emphasizes session-specific trading dynamics.
### Key Features ###
Session-Based Levels: Automatically plots high, low, midpoint, and Fibonacci (.618) levels for each major session (Asia, London, NY).
Distinct Visual Cues: Lines and labels use session-specific styles and colors to easily differentiate between sessions.
Previous Day Reference: Clearly plots and labels yesterday's high, low, midpoint, and Fibonacci levels.
Flexible Visibility: Traders can set timeframe visibility to maintain clean charts on higher timeframes.
### How It Works
At the start of next day's session, previous session lines are cleared, ensuring the chart remains uncluttered.
High, low, midpoint, and Fibonacci retracement levels (.618) are dynamically calculated and displayed at the close of each session.
All session levels remain visible until the start of the next respective session, providing continuous actionable insights.
Trading Application:
Session highs and lows act as strong intraday support and resistance zones.
Midpoints and Fibonacci levels are effective for identifying potential reversal zones and retracements.
Daily levels provide a broader context, useful for gauging intraday volatility and range.
### Limitations and Considerations ##
Best used on liquid assets with clear session-based price action, such as Forex major pairs, if used on indexes make sure they contain 24 hour price action not just New York session.
This indicator is designed to streamline intraday trading by clearly marking essential pivot points and session-based levels, significantly improving traders' market context and decision-making accuracy. Can be used to enhance SMT decision making when scalping killzones.

TrendTwisterV1.5 (Forex Ready + Indicators)A Precision Trend-Following TradingView Strategy for Forex**
HullShiftFX is a Pine Script strategy for TradingView that combines the power of the **Hull Moving Average (HMA)** and a **shifted Exponential Moving Average (EMA)** with multi-layered momentum filters including **RSI** and **dual Stochastic Oscillators**.
It’s designed for traders looking to catch high-probability breakouts with tight risk management and visual clarity.
Chart settings:
1. Select "Auto - Fits data to screen"
2. Please Select "Scale Price Chart Only" (To make the chart not squished)
### ✅ Entry Conditions
**Long Position:**
- Price closes above the 12-period Hull Moving Average.
- Price closes above the 5-period EMA shifted forward by 2 bars.
- RSI is above 50.
- Stochastic Oscillator (12,3,3) %K is above 50.
- Stochastic Oscillator (5,3,3) %K is above 50.
- Hull MA crosses above the shifted EMA.
**Short Position:**
- Price closes below the 12-period Hull Moving Average.
- Price closes below the 5-period EMA shifted forward by 2 bars.
- RSI is below 50.
- Stochastic Oscillator (12,3,3) %K is below 50.
- Stochastic Oscillator (5,3,3) %K is below 50.
- Hull MA crosses below the shifted EMA.
---
## 📉 Risk Management
- **Stop Loss:** Set at the low (for long) or high (for short) of the previous 2 candles.
- **Take Profit:** Calculated at a risk/reward ratio of **1.65x** the stop loss distance.
---
## 📊 Indicators Used
- **Hull Moving Average (12)**
- **Exponential Moving Average (5) **
- **Relative Strength Index (14)**
- **Stochastic Oscillators:**
- %K (12,3,3)
- %K (5,3,3)

Multiple MAsHere's a well-written description in English for your "Multiple MAs" indicator that you can use when publishing on TradingView. It’s concise, professional, and highlights the key features of the indicator while explaining its purpose for traders.
---
### Multiple MAs Indicator
#### Overview
The **Multiple MAs** indicator is a versatile and straightforward tool designed to help traders visualize price trends using multiple Simple Moving Averages (SMAs) on a single chart. By plotting six SMAs with customizable lengths (MA5, MA10, MA20, MA50, MA100, and MA200), this indicator provides a clear view of short-term, medium-term, and long-term trends, making it ideal for trend-following strategies, crossover analysis, and identifying potential support/resistance levels.
#### Features
- **Customizable MA Lengths**: Adjust the periods of all six moving averages (MA5, MA10, MA20, MA50, MA100, MA200) to suit your trading style and timeframe.
- **Distinct Visuals**: Each MA is plotted with a unique color and line width for easy identification:
- MA5 (Dodger Blue, 1px)
- MA10 (Green, 1px)
- MA20 (Red, 2px)
- MA50 (Purple, 3px)
- MA100 (Gray, 3px)
- MA200 (White, 3px)
- **Overlay on Price Chart**: The indicator overlays directly on the price chart, allowing for seamless integration with other technical analysis tools.
- **High Precision**: Displays values with 8-decimal precision, ensuring accuracy for assets with small price movements (e.g., forex pairs or cryptocurrencies).
#### How to Use
1. **Trend Identification**: Use the longer MAs (e.g., MA100, MA200) to determine the overall trend direction. If the price is above these MAs, the trend is likely bullish; if below, it’s likely bearish.
2. **Crossover Signals**: Look for crossovers between shorter MAs (e.g., MA5 crossing MA20) for potential entry or exit signals. For example:
- A bullish signal occurs when a shorter MA crosses above a longer MA.
- A bearish signal occurs when a shorter MA crosses below a longer MA.
3. **Support and Resistance**: MAs often act as dynamic support or resistance levels. Watch for price reactions around these lines, especially the MA50, MA100, and MA200.
4. **Divergence Analysis**: Compare the slope of different MAs to identify potential trend reversals or weakening momentum.
#### Settings
- **MA5 Length**: Default is 5 bars.
- **MA10 Length**: Default is 10 bars.
- **MA20 Length**: Default is 20 bars.
- **MA50 Length**: Default is 50 bars.
- **MA100 Length**: Default is 100 bars.
- **MA200 Length**: Default is 200 bars.
#### Best Practices
- **Timeframe**: This indicator works on any timeframe but is particularly effective on daily, 4-hour, and 1-hour charts for swing trading or trend-following strategies.
- **Combine with Other Tools**: Pair the Multiple MAs with other indicators like RSI, MACD, or volume analysis to confirm signals and avoid false breakouts.
- **Adjust for Volatility**: For highly volatile assets, consider increasing the MA lengths to reduce noise and focus on broader trends.
#### Notes
- The indicator is lightweight and optimized for performance, ensuring it runs smoothly even on lower timeframes.
- Colors and line widths are pre-set for clarity but can be customized in the indicator settings if needed.
#### Credits
Created by kosar_v. Feedback and suggestions are welcome to improve this tool for the TradingView community!

Volume Profile & Smart Money Explorer🔍 Volume Profile & Smart Money Explorer: Decode Institutional Footprints
Master the art of institutional trading with this sophisticated volume analysis tool. Track smart money movements, identify peak liquidity windows, and align your trades with major market participants.
🌟 Key Features:
📊 Triple-Layer Volume Analysis
• Total Volume Patterns
• Directional Volume Split (Up/Down)
• Institutional Flow Detection
• Real-time Smart Money Tracking
• Historical Pattern Recognition
⚡ Smart Money Detection
• Institutional Trade Identification
• Large Block Order Tracking
• Smart Money Concentration Periods
• Whale Activity Alerts
• Volume Threshold Analysis
📈 Advanced Profiling
• Hourly Volume Distribution
• Directional Bias Analysis
• Liquidity Heat Maps
• Volume Pattern Recognition
• Custom Threshold Settings
🎯 Strategic Applications:
Institutional Trading:
• Track Big Player Movements
• Identify Accumulation/Distribution
• Follow Smart Money Flow
• Detect Institutional Trading Windows
• Monitor Block Orders
Risk Management:
• Identify High Liquidity Windows
• Avoid Thin Market Periods
• Optimize Position Sizing
• Track Market Participation
• Monitor Volume Quality
Market Analysis:
• Volume Pattern Recognition
• Smart Money Flow Analysis
• Liquidity Window Identification
• Institutional Activity Cycles
• Market Depth Analysis
💡 Perfect For:
• Professional Traders
• Volume Profile Traders
• Institutional Traders
• Risk Managers
• Algorithmic Traders
• Smart Money Followers
• Day Traders
• Swing Traders
📊 Key Metrics:
• Normalized Volume Profiles
• Institutional Thresholds
• Directional Volume Split
• Smart Money Concentration
• Historical Patterns
• Real-time Analysis
⚡ Trading Edge:
• Trade with Institution Flow
• Identify Optimal Entry Points
• Recognize Distribution Patterns
• Follow Smart Money Positioning
• Avoid Thin Markets
• Capitalize on Peak Liquidity
🎓 Educational Value:
• Understand Market Structure
• Learn Volume Analysis
• Master Institutional Patterns
• Develop Market Intuition
• Track Smart Money Flow
🛠️ Customization:
• Adjustable Time Windows
• Flexible Volume Thresholds
• Multiple Timeframe Analysis
• Custom Alert Settings
• Visual Preference Options
Whether you're tracking institutional flows in crypto markets or following smart money in traditional markets, the Volume Profile & Smart Money Explorer provides the deep insights needed to trade alongside the biggest players.
Transform your trading from retail guesswork to institutional precision. Know exactly when and where smart money moves, and position yourself ahead of major market shifts.
#VolumeProfile #SmartMoney #InstitutionalTrading #MarketAnalysis #TradingView #VolumeAnalysis #CryptoTrading #ForexTrading #TechnicalAnalysis #Trading #PriceAction #MarketStructure #OrderFlow #Liquidity #RiskManagement #TradingStrategy #DayTrading #SwingTrading #AlgoTrading #QuantitativeTrading

Nef33 Forex & Crypto Trading Signals PRO
1. Understanding the Indicator's Context
The indicator generates signals based on confluence (trend, volume, key zones, etc.), but it does not include predefined SL or TP levels. To establish them, we must:
Use dynamic or static support/resistance levels already present in the script.
Incorporate volatility (such as ATR) to adjust the levels based on market conditions.
Define a risk/reward ratio (e.g., 1:2).
2. Options for Determining SL and TP
Below, I provide several ideas based on the tools available in the script:
Stop Loss (SL)
The SL should protect you from adverse movements. You can base it on:
ATR (Volatility): Use the smoothed ATR (atr_smooth) multiplied by a factor (e.g., 1.5 or 2) to set a dynamic SL.
Buy: SL = Entry Price - (atr_smooth * atr_mult).
Sell: SL = Entry Price + (atr_smooth * atr_mult).
Key Zones: Place the SL below a support (for buys) or above a resistance (for sells), using Order Blocks, Fair Value Gaps, or Liquidity Zones.
Buy: SL below the nearest ob_lows or fvg_lows.
Sell: SL above the nearest ob_highs or fvg_highs.
VWAP: Use the daily VWAP (vwap_day) as a critical level.
Buy: SL below vwap_day.
Sell: SL above vwap_day.
Take Profit (TP)
The TP should maximize profits. You can base it on:
Risk/Reward Ratio: Multiply the SL distance by a factor (e.g., 2 or 3).
Buy: TP = Entry Price + (SL Distance * 2).
Sell: TP = Entry Price - (SL Distance * 2).
Key Zones: Target the next resistance (for buys) or support (for sells).
Buy: TP at the next ob_highs, fvg_highs, or liq_zone_high.
Sell: TP at the next ob_lows, fvg_lows, or liq_zone_low.
Ichimoku: Use the cloud levels (Senkou Span A/B) as targets.
Buy: TP at senkou_span_a or senkou_span_b (whichever is higher).
Sell: TP at senkou_span_a or senkou_span_b (whichever is lower).
3. Practical Implementation
Since the script does not automatically draw SL/TP, you can:
Calculate them manually: Observe the chart and use the levels mentioned.
Modify the code: Add SL/TP as labels (label.new) at the moment of the signal.
Here’s an example of how to modify the code to display SL and TP based on ATR with a 1:2 risk/reward ratio:
Modified Code (Signals Section)
Find the lines where the signals (trade_buy and trade_sell) are generated and add the following:
pinescript
// Calculate SL and TP based on ATR
atr_sl_mult = 1.5 // Multiplier for SL
atr_tp_mult = 3.0 // Multiplier for TP (1:2 ratio)
sl_distance = atr_smooth * atr_sl_mult
tp_distance = atr_smooth * atr_tp_mult
if trade_buy
entry_price = close
sl_price = entry_price - sl_distance
tp_price = entry_price + tp_distance
label.new(bar_index, low, "Buy: " + str.tostring(math.round(bull_conditions, 1)), color=color.green, textcolor=color.white, style=label.style_label_up, size=size.tiny)
label.new(bar_index, sl_price, "SL: " + str.tostring(math.round(sl_price, 2)), color=color.red, textcolor=color.white, style=label.style_label_down, size=size.tiny)
label.new(bar_index, tp_price, "TP: " + str.tostring(math.round(tp_price, 2)), color=color.blue, textcolor=color.white, style=label.style_label_up, size=size.tiny)
if trade_sell
entry_price = close
sl_price = entry_price + sl_distance
tp_price = entry_price - tp_distance
label.new(bar_index, high, "Sell: " + str.tostring(math.round(bear_conditions, 1)), color=color.red, textcolor=color.white, style=label.style_label_down, size=size.tiny)
label.new(bar_index, sl_price, "SL: " + str.tostring(math.round(sl_price, 2)), color=color.red, textcolor=color.white, style=label.style_label_up, size=size.tiny)
label.new(bar_index, tp_price, "TP: " + str.tostring(math.round(tp_price, 2)), color=color.blue, textcolor=color.white, style=label.style_label_down, size=size.tiny)
Code Explanation
SL: Calculated by subtracting/adding sl_distance to the entry price (close) depending on whether it’s a buy or sell.
TP: Calculated with a double distance (tp_distance) for a 1:2 risk/reward ratio.
Visualization: Labels are added to the chart to display SL (red) and TP (blue).
4. Practical Strategy Without Modifying the Code
If you don’t want to modify the script, follow these steps manually:
Entry: Take the trade_buy or trade_sell signal.
SL: Check the smoothed ATR (atr_smooth) on the chart or calculate a fixed level (e.g., 1.5 times the ATR). Also, review nearby key zones (OB, FVG, VWAP).
TP: Define a target based on the next key zone or multiply the SL distance by 2 or 3.
Example:
Buy at 100, ATR = 2.
SL = 100 - (2 * 1.5) = 97.
TP = 100 + (2 * 3) = 106.
5. Recommendations
Test in Demo: Apply this logic in a demo account to adjust the multipliers (atr_sl_mult, atr_tp_mult) based on the market (forex or crypto).
Combine with Zones: If the ATR-based SL is too wide, use the nearest OB or FVG as a reference.
Risk/Reward Ratio: Adjust the TP based on your tolerance (1:1, 1:2, 1:3)
