Fractals with Flexible Visuals and Auto HTFPurpose:
This indicator displays fractals, including significant ones, with enhanced visual
flexibility and new visualization modes.
Functionality:
- Regular Fractals of Current Timeframe: **
Displays standard fractals based on the current chart timeframe.
- Significant Fractals: **
Recognizes significant fractals through a combination of apexes from the current
timeframe and a higher timeframe (HTF).
- Fractal Filtering: **
- Please note that this option makes some fractals dissapear, but someone finds this
to be useful.
- Fractal filtering has been made separate for Regular and Significant fractals.
- HH/LL Labels: **
HH/LL and LH/HL labels are now available separately for Regular and Significant
fractals.
- Automatic HTF Switching for Significant Fractals:
Added automatic HTF thresholds, removing the need to set HTF manually when changing
the chart's timeframe.
- Marker Relocation Modes:
- Mode 0:0
The fractal appears on the bar when it is recognized, not where it forms. This
mode assists traders who want to observe recognition in real-time when developing
strategies with fractals.
- Mode 1:1
The fractal appears on the previous bar when it is recognized, not where it forms.
- Mode 2:2 (General)
The fractal appears two bars back, where it is recognized, not when.
- Other additional Modes for Significant Fractals:
May be good for experimenting with Significant fractals. The first number
indicates bars back for the current timeframe; the second number indicates
bars back for the higher timeframe.
Other modes may assist with additional filtering or be suitable for specific
pairs or timeframes.
- Visual Adjustments:
Added user settings to customize visuals according to preferences.
Acknowledgment:
This indicator's functionality has been refactored from Fractals V9 by Ricardo
Santos (with gratitude to him):
()
'RSFractals' is not used as a name prefix, reflecting that this version lacks the
Zigzag and Pattern functionalities present in 'RSFractals'. If the original author
prefers a different naming convention, they may contact me, and I will gladly make
the adjustment.
Cerca negli script per "fractals"

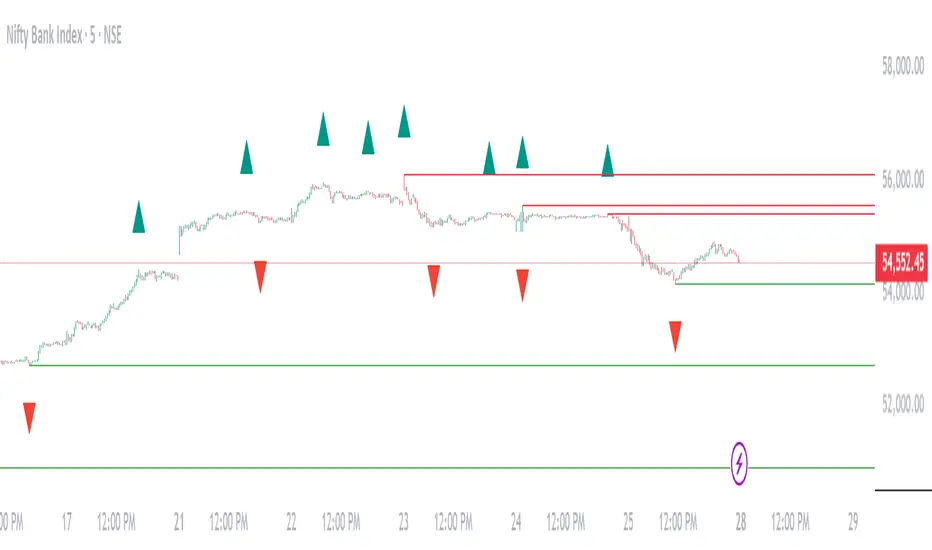
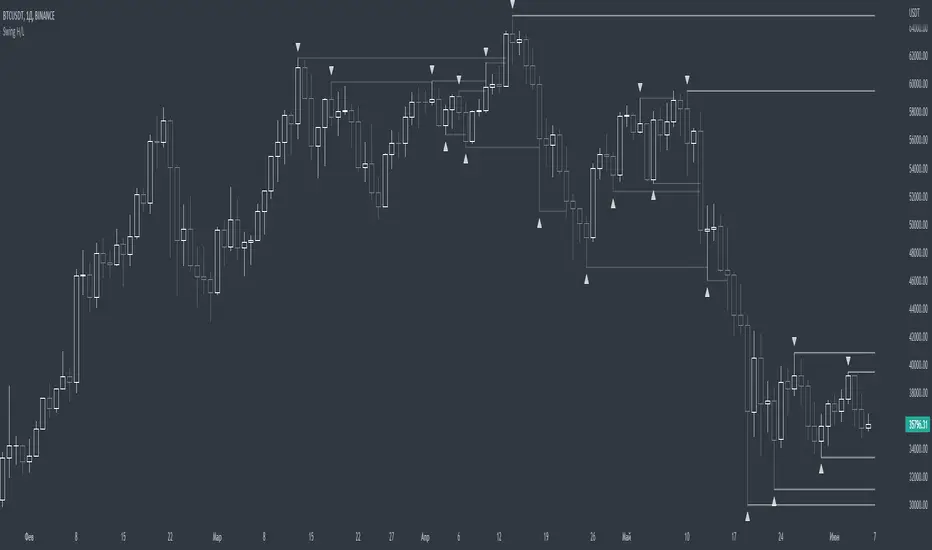
Fractals Trend [BigBeluga]🔵 OVERVIEW
Fractals Trend is a trend-following overlay that leverages fractal swing points to define dynamic support and resistance zones. By storing and averaging recent high and low fractals, it determines trend direction and plots a smooth band that flips depending on market bias—displaying support during uptrends and resistance during downtrends .
🔵 CONCEPTS
Fractal Swings: Fractals are identified using a customizable length. A high fractal forms when the current high is the highest in a range; a low fractal when the current low is the lowest.
Fractal Memory: The indicator keeps a rolling window of recent high and low fractals inside arrays, limited by the user-defined storage quantity.
switch
upperF => FracrtalsUpper.push(high )
lowerF => FracrtalsLower.push(low )
FracrtalsUpper.size() > fCount => FracrtalsUpper.shift()
FracrtalsLower.size() > fCount => FracrtalsLower.shift()
Trend Detection: Price crossing above the average, min/max or median high fractals signals an uptrend; crossing below average, min/max or median low fractals signals a downtrend.
Dynamic Band Plotting: Depending on the trend, the script plots the average of either the upper or lower fractals as a trailing support or resistance line.
Visual Confirmation: Fractal labels appear as triangle markers at highs and lows, providing additional structural context.
🔵 FEATURES
Automatically detects high and low fractals using customizable length.
Stores a defined number of fractals to smooth out noise and reduce false signals.
Flips trend bias dynamically with colored band and smooth transitions.
Plots fractal-based support in bullish trends, resistance in bearish trends.
Triangle markers show real-time fractal highs and lows.
Fully configurable visuals, color themes, and fractal detection logic.
Clean, non-intrusive overlay that works on any market or timeframe.
🔵 HOW TO USE
Use the colored band as a directional filter: green = uptrend (support), orange = downtrend (resistance).
Combine with entry signals or break/retest strategies when price approaches the band.
Use triangle markers to confirm structural swing points.
Adjust Fractals Length to tune sensitivity—shorter values detect quicker shifts, longer values reduce noise.
Change the fractal bands type to adapt trend detection to different market conditions.
Use in conjunction with momentum or volume tools for confluence.
🔵 CONCLUSION
Fractals Trend offers a lightweight, intuitive way to track market bias using price structure alone. Its smart switching logic and clean visuals make it a powerful tool for trend traders seeking structure-based dynamic S/R—without laggy moving averages or overcomplicated signals.

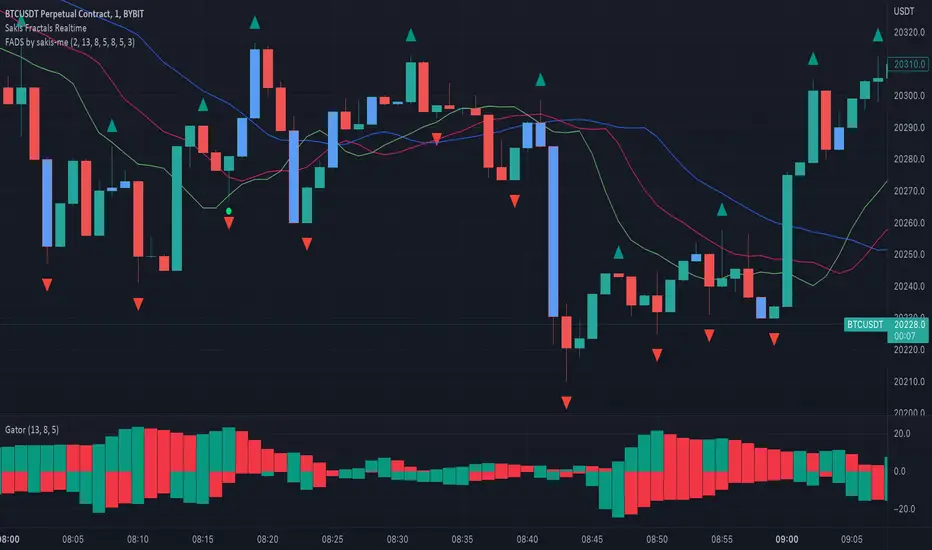
Fractals + Alligator + Divergent Bars + Squat BarsFractals + Alligator + Divergent Bars + Squat Bars Williams Indicators
All combined in one
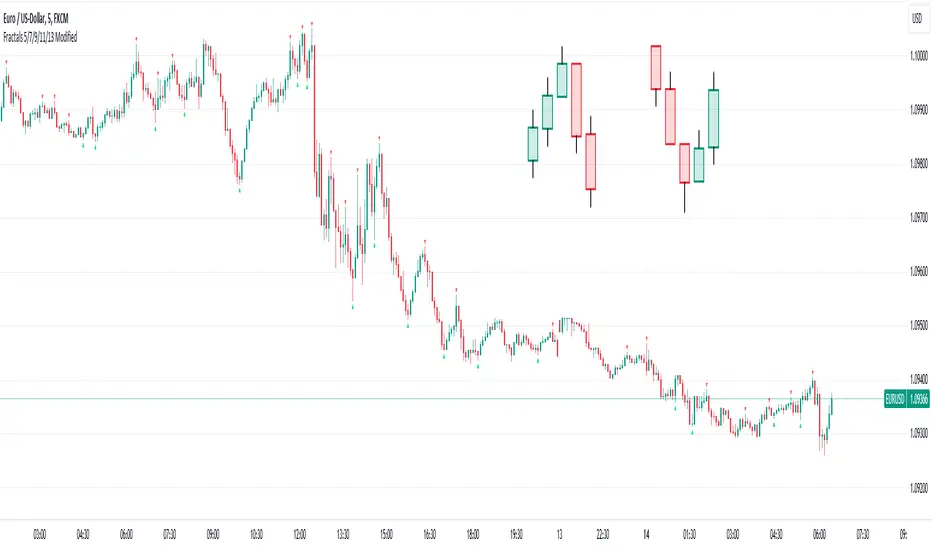
Fractals 5/7/9/11/13 ModifiedDescription:
The Modified Fractals Indicator is designed to help traders identify specific fractal patterns on a chart. Unlike traditional Williams Fractals, this indicator focuses on highlighting two distinct types of fractals:
- UpFractals: These fractals are identified when each preceding candle has a higher high than the one before it, and each succeeding candle has a higher high than the one following it.
- DownFractals: Conversely, DownFractals are detected when each preceding candle has a lower low than the one before it, and each succeeding candle has a lower low than the one following it.
This unique approach sets it apart from standard Fractal indicators.
Features:
1. Originality and Uniqueness: This indicator employs a distinctive algorithm to detect and display modified fractals, providing a fresh perspective on price reversals.
2. Customizable Parameters: Users can fine-tune the indicator to their trading strategy by adjusting the candle count and arrow size.
3. Easy-to-Understand Chart: The Modified Fractals Indicator is designed to provide clear and easily identifiable signals on your chart, enhancing your trading experience.
4. User-Friendly Interface: This indicator is user-friendly and can be easily integrated into your TradingView setup.
How it Works:
The Modified Fractals Indicator scans the price action on your chart and identifies specific fractal patterns based on the criteria mentioned above for both UpFractals and DownFractals.
Usage:
- Add the Modified Fractals Indicator to your TradingView chart.
- Customize the settings, including the candle count and arrow size, to align with your trading strategy.
- Observe the chart for the appearance of UpFractals and DownFractals as marked by the indicator's arrows.
- Use the signals provided by the indicator to inform your trading decisions, such as potential entry or exit points.
Please note that this Modified Fractals Indicator offers a unique approach to fractal analysis, focusing on specific price patterns that differ from traditional Williams Fractals. It provides traders with an additional tool for identifying potential trend reversals and market opportunities.
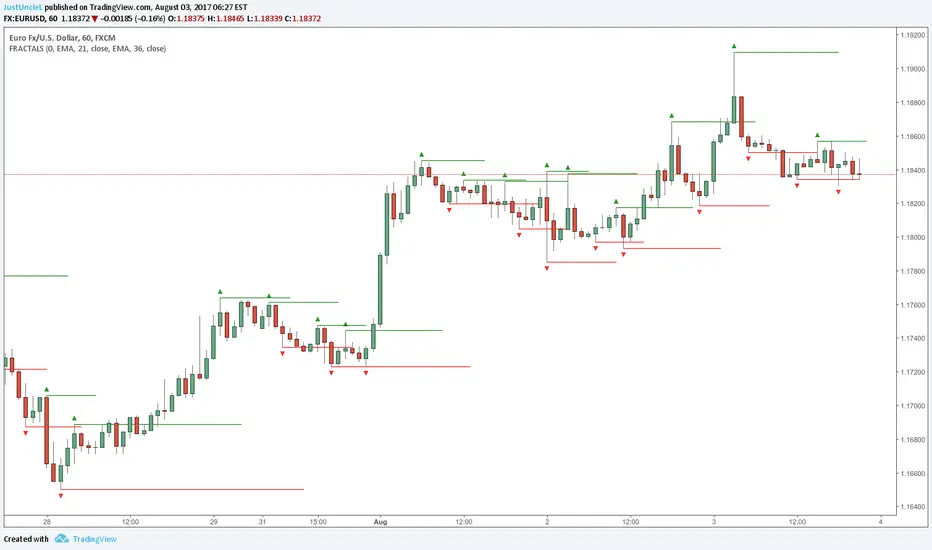
Fractals and Levels by JustUncleLEven though there are a many other Fractal and Level indicators, this indicator has some unique features. The indicator will display Fractals, fractal levels and HH/LL points, they will only be drawn after they have completed. Also the indicator has options to :
Show Ideal Fractals Only.
Use Renko Style Fractals, where open/close values are used instead of high/low to find Fractals. This is used to show the correct Fractals when Renko Wicks are enabled.
Has an optional Filter to only display Fractals that are above/below a MA Ribbon.
References:
This code is based on Fractal Levels V8 by RicardoSantos
This is a Renko Chart with "Renko Style Fractals" enabled, notice that the wicks are ignored and only the true Bricks are used for Fractals:
Fractals PivotsWhich trader does not know pivots? There are a lot of varieties of pivots indicators of which some are a default on most trading platforms. So what better way to challenge yourself then to create your own kind of pivots. Let's welcome the idea of Fractal Pivots.
Williams Fractal or fractals is a technical analysis indicator introduced by the famous trader Bill Williams in his book ‘Trading Chaos’. He developed it on the basis of the Chaos Theory and trading psychology. The indicator is centred around the idea that there is repetition in price behaviour and fractals can provide an insight into those repetitive patterns.
How does the indicator turn these into pivot lines?
The user will set a time period in which the script will look for fractals. It will then remember all the fractals that happen during that time period.
Let's say you are trading the hourly chart with a weekly pivot setting like in the chart this script is published on. The script will highling the 1h fractals that are happening. Then the next week it will use these exact fractals from previous week to draw the pivot lines.
Another example here is an 8h chart. Look how it uses the previous week fractals this week.
Let me know if you find a very great fractal length+timeframe setting where the levels really get respected. I would really appreciate that.

Fractals + FVG [Combined]Звісно, ось варіант опису англійською, який можна використати для публікації індикатора в TradingView.
Description
This script combines two powerful and widely-used trading concepts into a single, comprehensive indicator: Bill Williams Fractals with dynamic support/resistance lines and Fair Value Gaps (FVG) based on the popular logic from LuxAlgo.
The goal is to provide a cleaner chart by merging two essential tools, allowing traders to analyze market structure and imbalances simultaneously.
Features
1. Williams Fractals with Invalidation Lines
This part of the indicator identifies classic Bill Williams fractals and enhances them with a unique visualization feature.
Fractal Detection: Automatically identifies both bullish (bottom) and bearish (top) fractals. You can choose between a 3-bar or 5-bar pattern in the settings.
Dynamic S/R Lines: A horizontal line is automatically drawn from every confirmed fractal, acting as a potential support or resistance level.
Automatic Invalidation: A line is considered "invalidated" or breached when the body of a candle closes past it. When this happens, the line stops extending, changes its color to the "invalidated" color, and remains on the chart as a historical reference. This provides a clear, objective signal that a level has been broken.
Customization: You can fully customize the colors for the support, resistance, and invalidated lines to match your chart theme.
2. Fair Value Gaps (FVG) / Imbalance
This module incorporates the robust FVG detection logic from LuxAlgo to automatically identify and display market imbalances.
FVG Detection: Highlights bullish and bearish Fair Value Gaps on the chart with colored boxes, representing inefficiencies in price delivery.
Automatic Mitigation: The FVG boxes are automatically removed from the chart once the price has "mitigated" or filled the gap, keeping your workspace clean and focused on active imbalances.
Multi-Timeframe (MTF): You can set the indicator to find and display FVGs from a higher timeframe directly on your current chart.
Dashboard: An optional on-screen dashboard provides a quick summary of the total count of bullish/bearish FVGs and the percentage that have been mitigated.
Full Customization: Control the colors of FVG boxes, extend their length, and configure other visual style settings.
How to Use
Fractal Lines: Use the active support and resistance lines as key levels for potential bounces or breaks. A line's invalidation can serve as confirmation of a shift in market structure.
FVG Zones: Fair Value Gaps often act as "magnets" for price. Use these zones as potential targets for your trades or as areas of interest for entries when price retraces to fill the imbalance.
Combined Strategy: The true power of this indicator comes from combining both concepts. For example, a bullish FVG forming near a key fractal support level can create a high-probability confluence zone for a long entry. Similarly, a break and invalidation of a fractal resistance line might signal that price is heading towards the next bearish FVG above.
This indicator is a tool for analysis and should be used in conjunction with your own trading strategy and risk management rules.

Fractals ROC AlertI am playing William's Fractals and got an idea to calculate each fractal's strength by these rules:
- downFractal. FractalROC = (close - lowest(n+1))/(open【2*n】-lowest(n+1))
- upFractal FractalROC = (highest(n+1)-close)/(highest(n+1)-open【2*n】)
And set up a level to filter small fractals.
Bigger FractalROC, Stronger trend

Fractals & SweepThe Fractals & Sweep indicator is designed to identify key market structure points (fractals) and detect potential liquidity sweeps around those areas. It visually highlights both Bill Williams fractals and regular fractals, and alerts the user when the market sweeps liquidity above or below the most recent fractal levels.
Fractal Recognition:
Detects both bullish (low) and bearish (high) fractals on the price chart.
Users can choose between:
Bill Williams fractal logic (default), or
Regular fractal logic (when the “Filter Bill Williams Fractals” option is enabled).
Fractals are plotted directly on the chart as red downward triangles for highs and green upward triangles for lows.
Fractal Tracking:
The indicator stores the most recent high and low fractal levels to serve as reference points for potential sweep detection.
Sweep Detection:
A bearish sweep is triggered when the price wicks above the last fractal high but closes below it — suggesting a liquidity grab above resistance.
A bullish sweep is triggered when the price wicks below the last fractal low but closes above it — suggesting a liquidity grab below support.
When a sweep occurs, the indicator draws a horizontal line from the previous fractal point to the current bar.
Alert System:
Custom alerts notify the trader when a bearish sweep or bullish sweep occurs, allowing for timely reactions to potential reversals or liquidity traps.

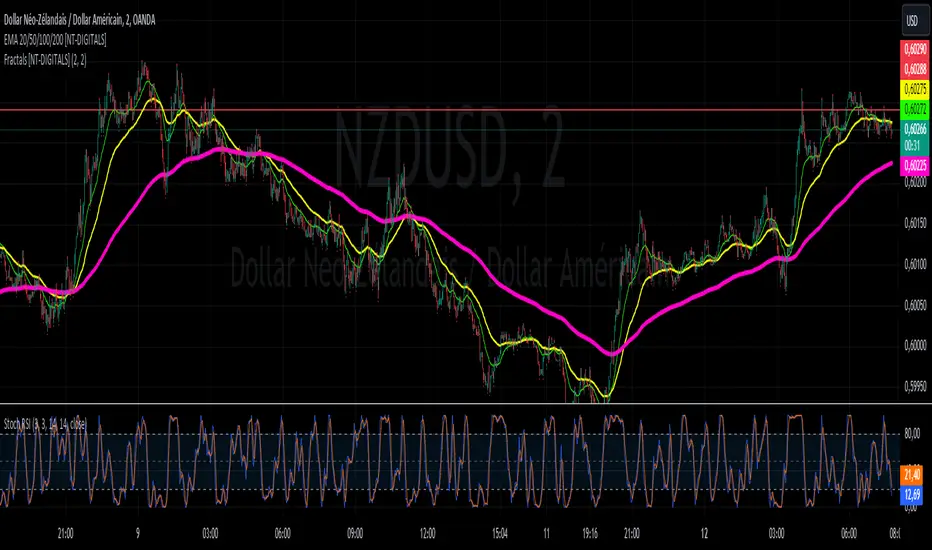
Fractals [NT-DIGITALS]Description:
The Fractals Detector indicator in Pine Script version 5 identifies potential turning points using specific candlestick patterns. Fractals are significant in technical analysis as they indicate potential highs or lows in price. A fractal high forms when the highest price of a candlestick is surrounded by two lower highs on either side. Conversely, a fractal low forms when the lowest price of a candlestick is surrounded by two higher lows on either side.
Features:
Detects fractal highs and lows on the chart.
Customizable parameters for the number of bars to the left and right required to form a fractal.
Displays distinct symbols for fractal highs (red upward arrows) and fractal lows (green downward arrows).
Parameters:
Bars to the Left: Number of bars to the left to form a fractal (default: 2).
Bars to the Right: Number of bars to the right to form a fractal (default: 2).
Usage:
This indicator is useful for traders looking to identify potential turning points in prices. Fractals can serve as entry or exit points based on the detected reversals.Description:
The Fractals Detector indicator in Pine Script version 5 identifies potential turning points using specific candlestick patterns. Fractals are significant in technical analysis as they indicate potential highs or lows in price. A fractal high forms when the highest price of a candlestick is surrounded by two lower highs on either side. Conversely, a fractal low forms when the lowest price of a candlestick is surrounded by two higher lows on either side.
Features:
Detects fractal highs and lows on the chart.
Customizable parameters for the number of bars to the left and right required to form a fractal.
Displays distinct symbols for fractal highs (red upward arrows) and fractal lows (green downward arrows).
Parameters:
Bars to the Left: Number of bars to the left to form a fractal (default: 2).
Bars to the Right: Number of bars to the right to form a fractal (default: 2).
Usage:
This indicator is useful for traders looking to identify potential turning points in prices. Fractals can serve as entry or exit points based on the detected reversals.
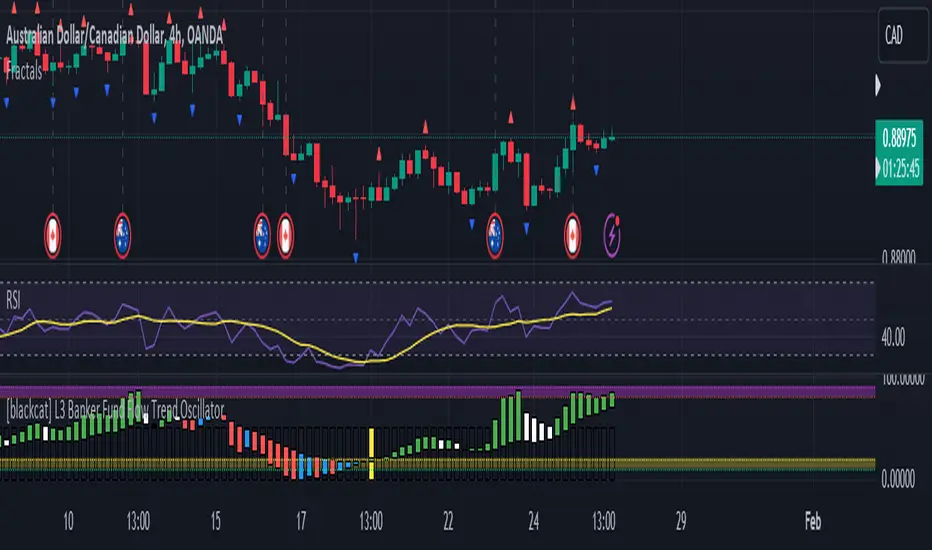
Fractals and Pattern MandelbrotThis indicator show classic fractals and patterns of force long or short if they are on the top or on the low of a x candles, so they try to anticipate the inversion of the trend.
The purple arrow indicate the fractals and the blue indicate the pattern for the inversion of the trend.
For the targets and the stop we need to use Fibonacci extentions modificate with this values:
-1.64
-0.64
1.5563
2.422
3.5699
4.669
5.8664
9.1299
14.208
and use this A,B,C points:
For long positions A is the LAST RED CLOSE, B is the GREEN CLOSE just before the blue arrow, C is B.
the -1.64 is the stop loss, if price close under that
the -0.64 is the best level to enter long
For short positions A is the LAST GREEN CLOSE, B is the RED CLOSE just before the blue arrow, C is B.
the -1.64 is the stop loss, if price close above that
the -0.64 is the best level to enter short

Fractals with HH/LLStandard fractals indicator with an additional signal to show if it was higher than the last "up" or lower than the last "down"
A blue dot indicates the higher/lower fractal.
Working on an update to add a counting feature which will indicate when a certain number of higher highs from a given starting point has been achived.

Fractals | Swing Points | Highs & Lows | Custom PeriodsSimple script which marks out key swing highs & lows.
One of the only indicators I have on the chart most days
- perfect for naked charting
- quickly helps you to visually identify key areas of interest
An extension of Bill Williams fractals
- aka short term swing points
Allows you to filter for only the most prominent swing points
- you can even overlay multiple swingpoint filters in different colours (as per example chart)
The number ( Fractal Periods) is simply:
- the number of less prominent points either side of your swing high/low
- example shown on the chart
Otherwise make a fist
- look at your 5 knuckles
- swing high is your middle knuckle
- 2 lower points either side
Bill Williams Original Fractal:
Fractal Periods = 2
Your Fractal Period for Filtering:
3, 4, 5, 30, 365, etc
Allows you to find swing points down to:
Fractal Periods = 1
Simple, easy, shared to enjoy =)

Fractals V9 ModifiedSo taking Ricardo Santos script for fractals V9 -I change the time function of the high TF fractal to non repainting one
adding daily fib levels
This hybrid seems to look nice . I have to admit that all credit to Ricardo Santos for his exelent script.
thi work it hybrid work and not so much original work....
The main improvment is the signals which are not reapinting as we remove security from that.
Security function exist for daily fib but it has nothing to do wih signal generation so i did not touch it

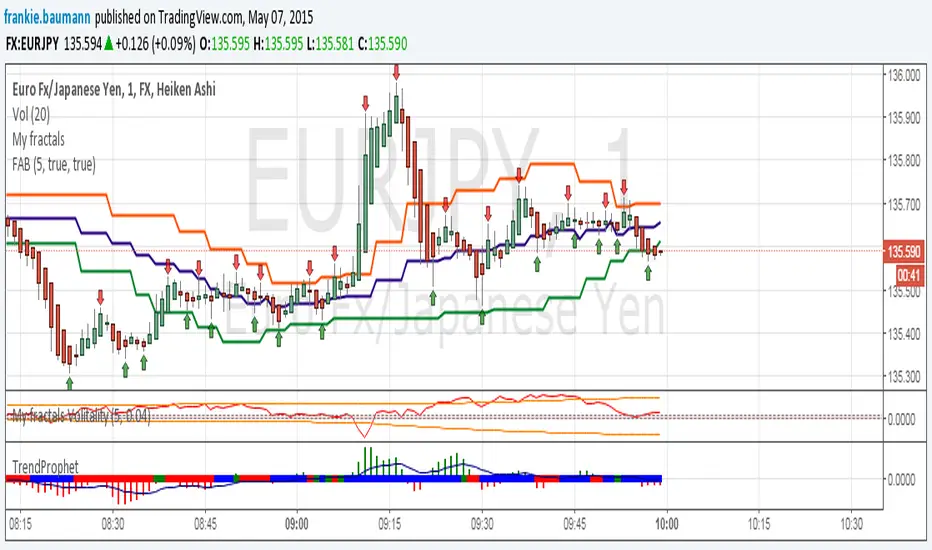
Fractals average breakout [FB]My first indicator.
A simple average of last 1 to 10 fractals (top and bottom)
Trade breakouts of top or bottom lines.
Feel free to use and experiment with.
Frank Baumann
Auto Trendline Indicator (based on fractals)A tool that automatically draws out trend lines by connecting the most recent fractals.
Description:
The process of manual drawing out trend lines is highly subjective. Many times, we don’t trade what we see, but what we “want to see”. As a result, we draw lines pointing to the direction that we wishfully want price to move towards. While there are no right/wrong ways to draw trend lines, there are, however, systematic/unsystematic ways to draw trend lines. This tool will systematically draw out trend lines based on fractals.
Additional feature:
This tool will also plot out symbols (default symbol “X”) to signify points of crossings. This can be useful for traders considering to use trend lines as part of their trading strategies.
Here is an interesting observation on the price actions of NASDAQ futures on a 5 second chart during regular trading hours on July 14, 2022.
It’s a phenomenon. People like to see straight lines connecting HL/LH, etc., so it's possible for the market as a whole to psychologically react to these lines. However, it is important to note that is is impossible to predict the direction of price. In the case above, price could have tanked below auto-drawn trend line. Fractal based trend lines should only be taken as references and regarded as price levels. No studies have ever proven that the slope of trend lines can indicate price's future direction.
More about fractals:
To understand more about fractals:
www.investopedia.com
www.tradingview.com
Contrary to what it sounds like, fractal in "technical analysis" does not refer to the recursive self-repeating patterns that appear in nature, such as the mesmerizing patterns found in snowflakes. The Fractal Markets Hypothesis claims that market prices exhibit fractal properties over time. Assuming this assertion to be true, then fractals can be used a tool to represent the chaotic movements of price is a simplified manner.
The purpose of this exercise is to take a tool that is readily available (ie. in this case, TradingView’s built-in fractals tool), and to create a newer tool based on it.
Parameters:
Fractal period (denoted as ‘n’ in code): It is the number of bars bounding a high/low point that must be lower/higher than it, respectively, in order for fractal to be considered valid. Period ‘n’ can be adjusted in this tool. Traditionally, chartists pick the value of 5. The longer it is, the less noise seen on the chart, and the pivot point may also be exhibited in higher timeframes. The drawback is that it will increase the period of lag, and it will take more bars to confirm the printed fractal.
Others: Intuitive parameters such as whether to draw historical trend lines, what color to use, which way to extend the lines, and whether or not to show points of crossings.

Fractal Trail [UAlgo]The Fractal Trail is designed to identify and utilize Williams fractals as dynamic trailing stops. This tool serves traders by marking key fractal points on the chart and leveraging them to create adaptive stop-loss trails, enhancing risk management and trade decision-making.
Williams fractals are pivotal in identifying potential reversals and critical support/resistance levels. By plotting fractals dynamically and providing configurable options, this indicator allows for personalized adjustments based on the trader's strategy.
This script integrates both visual fractal markers and adjustable trailing stops, offering insights into market trends while catering to a wide variety of trading styles and timeframes.
🔶 Key Features
Williams Fractals Identification: The indicator marks Williams Fractals on the chart, which are significant highs and lows within a specified range. These fractals are crucial for identifying potential reversal points in the market.
Dynamic Trailing Stops: The indicator generates dynamic trailing stops based on the identified fractals. These stops adjust automatically as new fractals are formed, providing a responsive and adaptive approach to risk management.
Fractal Range: Users can specify the number of bars to the left and right for analyzing fractals, allowing for flexibility in identifying significant price points.
Trail Buffer Percentage: A percentage-based safety margin can be added between the fractal price and the trailing stop, providing additional control over risk management.
Trail Invalidation Source: Users can choose whether the trailing stop flips based on candle closing prices or the extreme points (high/low) of the candles.
Alerts and Notifications: The indicator provides alerts for when the price crosses the trailing stops, as well as when new Williams Fractals are confirmed. These alerts can be customized to fit the trader's notification preferences.
🔶 Interpreting the Indicator
Fractal Markers: The triangles above and below the bars indicate Williams Fractals. These markers help traders identify potential reversal points in the market.
Trailing Stops: The dynamic trailing stops are plotted as lines on the chart. These lines adjust based on the latest identified fractals, providing a visual representation of potential support and resistance levels.
Fill Colors: The optional fill colors between the trailing stops and the price action help traders quickly identify the current trend and potential pullback zones.
🔶 Disclaimer
Use with Caution: This indicator is provided for educational and informational purposes only and should not be considered as financial advice. Users should exercise caution and perform their own analysis before making trading decisions based on the indicator's signals.
Not Financial Advice: The information provided by this indicator does not constitute financial advice, and the creator (UAlgo) shall not be held responsible for any trading losses incurred as a result of using this indicator.
Backtesting Recommended: Traders are encouraged to backtest the indicator thoroughly on historical data before using it in live trading to assess its performance and suitability for their trading strategies.
Risk Management: Trading involves inherent risks, and users should implement proper risk management strategies, including but not limited to stop-loss orders and position sizing, to mitigate potential losses.
No Guarantees: The accuracy and reliability of the indicator's signals cannot be guaranteed, as they are based on historical price data and past performance may not be indicative of future results.

Fractal Breakout Trend Following StrategyOverview
The Fractal Breakout Trend Following Strategy is a trend-following system which utilizes the Willams Fractals and Alligator to execute the long trades on the fractal's breakouts which have a high probability to be the new uptrend phase beginning. This system also uses the normalized Average True Range indicator to filter trades after a large moves, because it's more likely to see the trend continuation after a consolidation period. Strategy can execute only long trades.
Unique Features
Trend and volatility filtering system: Strategy uses Williams Alligator to filter the counter-trend fractals breakouts and normalized Average True Range to avoid the trades after large moves, when volatility is high
Configurable Trading Periods: Users can tailor the strategy to specific market windows, adapting to different market conditions.
Flexible Risk Management: Users can choose the stop-loss percent (by default = 3%) for trades, but strategy also has the dynamic stop-loss level using down fractals.
Methodology
The strategy places stop order at the last valid fractal breakout level. Validity of this fractal is defined by the Williams Alligator indicator. If at the moment of time when price breaking the last fractal price is higher than Alligator's teeth line (8 period SMA shifted 5 bars in the future) this is a valid breakout. Moreover strategy has the additional volatility filtering system using normalized ATR. It calculates the average normalized ATR for last user-defined number of bars and if this value lower than the user-defined threshold value the long trade is executed.
When trade is opened, script places the stop loss at the price higher of two levels: user defined stop-loss from the position entry price or down fractal validation level. The down fractal is valid with the rule, opposite as the up fractal validation. Price shall break to the downside the last down fractal below the Willians Alligator's teeth line.
Strategy has no fixed take profit. Exit level changes with the down fractal validation level. If price is in strong uptrend trade is going to be active until last down fractal is not valid. Strategy closes trade when price hits the down fractal validation level.
Risk Management
The strategy employs a combined approach to risk management:
It allows positions to ride the trend as long as the price continues to move favorably, aiming to capture significant price movements. It features a user-defined stop-loss parameter to mitigate risks based on individual risk tolerance. By default, this stop-loss is set to a 3% drop from the entry point, but it can be adjusted according to the trader's preferences.
Justification of Methodology
This strategy leverages Williams Fractals to open long trade when price has broken the key resistance level to the upside. This resistance level is the last up fractal and is shall be broken above the Williams Alligator's teeth line to be qualified as the valid breakout according to this strategy. The Alligator filtering increases the probability to avoid the false breakouts against the current trend.
Moreover strategy has an additional filter using Average True Range(ATR) indicator. If average value of ATR for the last user-defined number of bars is lower than user-defined threshold strategy can open the long trade according to open trade condition above. The logic here is following: we want to open trades after period of price consolidation inside the range because before and after a big move price is more likely to be in sideways, but we need a trend move to have a profit.
Another one important feature is how the exit condition is defined. On the one hand, strategy has the user-defined stop-loss (3% below the entry price by default). It's made to give users the opportunity to restrict their losses according to their risk-tolerance. On the other hand, strategy utilizes the dynamic exit level which is defined by down fractal activation. If we assume the breaking up fractal is the beginning of the uptrend, breaking down fractal can be the start of downtrend phase. We don't want to be in long trade if there is a high probability of reversal to the downside. This approach helps to not keep open trade if trend is not developing and hold it if price continues going up.
Backtest Results
Operating window: Date range of backtests is 2023.01.01 - 2024.05.01. It is chosen to let the strategy to close all opened positions.
Commission and Slippage: Includes a standard Binance commission of 0.1% and accounts for possible slippage over 5 ticks.
Initial capital: 10000 USDT
Percent of capital used in every trade: 30%
Maximum Single Position Loss: -3.19%
Maximum Single Profit: +24.97%
Net Profit: +3036.90 USDT (+30.37%)
Total Trades: 83 (28.92% win rate)
Profit Factor: 1.953
Maximum Accumulated Loss: 963.98 USDT (-8.29%)
Average Profit per Trade: 36.59 USDT (+1.12%)
Average Trade Duration: 72 hours
These results are obtained with realistic parameters representing trading conditions observed at major exchanges such as Binance and with realistic trading portfolio usage parameters.
How to Use
Add the script to favorites for easy access.
Apply to the desired timeframe and chart (optimal performance observed on 4h and higher time frames and the BTC/USDT).
Configure settings using the dropdown choice list in the built-in menu.
Set up alerts to automate strategy positions through web hook with the text: {{strategy.order.alert_message}}
Disclaimer:
Educational and informational tool reflecting Skyrex commitment to informed trading. Past performance does not guarantee future results. Test strategies in a simulated environment before live implementation

Fractal Support and Resistance [BigBeluga]🔵 OVERVIEW
The Fractal Support and Resistance indicator automatically identifies high-probability support and resistance zones based on repeated fractal touches. When a defined number of fractal highs or lows cluster around the same price zone, the indicator plots a clean horizontal level and shaded zone, helping traders visualize structurally important areas where price may react.
🔵 CONCEPTS
Fractal Points: Swing highs and lows based on user-defined left and right range (length). A valid fractal forms only when the center candle is higher or lower than its neighbors.
Zone Validation: A level is only confirmed when the price has printed the specified number of fractals (e.g., 3) within a narrow ATR-defined range.
Dynamic Zone Calculation: The plotted level can be based on the average of clustered fractals or on the extreme value (min or max), depending on the user’s choice.
Support/Resistance Zones: Once a zone is validated, a horizontal line and shaded box are drawn and automatically extended into the future until new valid clusters form.
Auto-Clean & Reactivity: Each zone persists until replaced by a new fractal cluster, ensuring the chart remains uncluttered and adaptive.
🔵 FEATURES
Detects swing fractals using adjustable left/right range.
Confirms zones when a defined number of fractals occur near the same price.
Plots horizontal level and shaded box for visual clarity.
Choice between average or min/max logic for level calculation.
Distinct color inputs for support (green) and resistance (orange) zones.
Adaptive auto-extension keeps valid zones projected into the future.
Displays optional triangle markers above/below bars where fractals form.
Clean design optimized for structural S/R analysis.
🔵 HOW TO USE
Use support zones (from low fractals) to look for potential long entries or bounce points .
Use resistance zones (from high fractals) to look for short setups or rejections .
Adjust the Fractals Qty to make zones more or less strict—e.g., 3 for higher reliability, 2 for quicker responsiveness.
Combine with liquidity indicators or break/retest logic to validate zone strength.
Toggle between average and min/max mode to fit your style (average for balance, extremes for aggression).
🔵 CONCLUSION
Fractal Support and Resistance offers a robust way to identify hidden levels that the market respects repeatedly. By requiring multiple fractal confirmations within a zone, it filters out noise and highlights clean structural areas of interest. This tool is ideal for traders who want automatic, adaptive, and reliable S/R levels grounded in raw market structure.

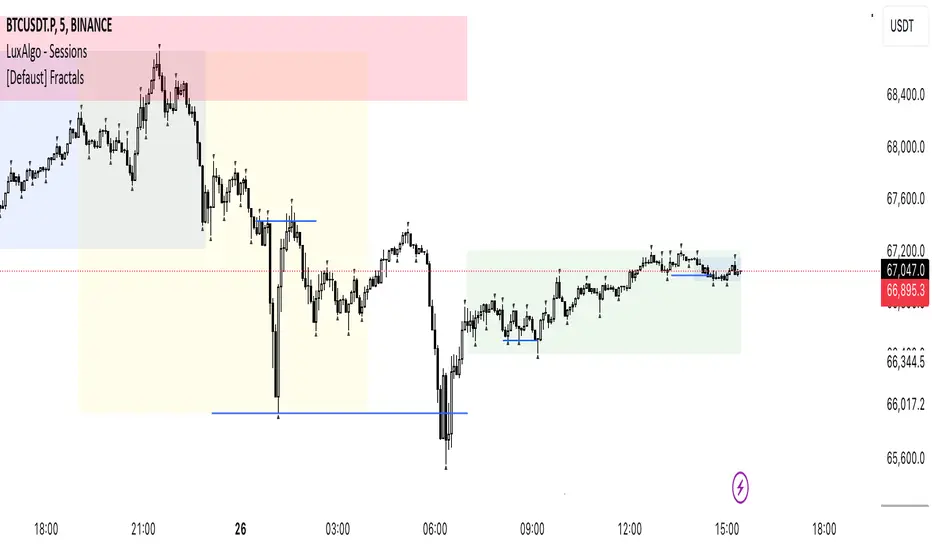
[Defaust] Fractals Fractals Indicator
Overview
The Fractals Indicator is a technical analysis tool designed to help traders identify potential reversal points in the market by detecting fractal patterns. This indicator is a fork of the original fractals indicator, with adjustments made to the plotting for enhanced visual clarity and usability.
What Are Fractals?
In trading, a fractal is a pattern consisting of five consecutive bars (candlesticks) that meet specific conditions:
Up Fractal (Potential Sell Signal): Occurs when a high point is surrounded by two lower highs on each side.
Down Fractal (Potential Buy Signal): Occurs when a low point is surrounded by two higher lows on each side.
Fractals help traders identify potential tops and bottoms in the market, signaling possible entry or exit points.
Features of the Indicator
Customizable Periods (n): Allows you to define the number of periods to consider when detecting fractals, offering flexibility to adapt to different trading strategies and timeframes.
Enhanced Plotting Adjustments: This fork introduces adjustments to the plotting of fractal signals for better visual representation on the chart.
Visual Signals: Plots up and down triangles on the chart to signify down fractals (potential bullish signals) and up fractals (potential bearish signals), respectively.
Overlay on Chart: The fractal signals are overlaid directly on the price chart for immediate visualization.
Adjustable Precision: You can set the precision of the plotted values according to your needs.
Pine Script Code Explanation
Below is the Pine Script code for the Fractals Indicator:
//@version=5 indicator(" Fractals", shorttitle=" Fractals", format=format.price, precision=0, overlay=true)
// User input for the number of periods to consider for fractal detection n = input.int(title="Periods", defval=2, minval=2)
// Initialize flags for up fractal detection bool upflagDownFrontier = true bool upflagUpFrontier0 = true bool upflagUpFrontier1 = true bool upflagUpFrontier2 = true bool upflagUpFrontier3 = true bool upflagUpFrontier4 = true
// Loop through previous and future bars to check conditions for up fractals for i = 1 to n // Check if the highs of previous bars are less than the current bar's high upflagDownFrontier := upflagDownFrontier and (high < high ) // Check various conditions for future bars upflagUpFrontier0 := upflagUpFrontier0 and (high < high ) upflagUpFrontier1 := upflagUpFrontier1 and (high <= high and high < high ) upflagUpFrontier2 := upflagUpFrontier2 and (high <= high and high <= high and high < high ) upflagUpFrontier3 := upflagUpFrontier3 and (high <= high and high <= high and high <= high and high < high ) upflagUpFrontier4 := upflagUpFrontier4 and (high <= high and high <= high and high <= high and high <= high and high < high )
// Combine the flags to determine if an up fractal exists flagUpFrontier = upflagUpFrontier0 or upflagUpFrontier1 or upflagUpFrontier2 or upflagUpFrontier3 or upflagUpFrontier4 upFractal = (upflagDownFrontier and flagUpFrontier)
// Initialize flags for down fractal detection bool downflagDownFrontier = true bool downflagUpFrontier0 = true bool downflagUpFrontier1 = true bool downflagUpFrontier2 = true bool downflagUpFrontier3 = true bool downflagUpFrontier4 = true
// Loop through previous and future bars to check conditions for down fractals for i = 1 to n // Check if the lows of previous bars are greater than the current bar's low downflagDownFrontier := downflagDownFrontier and (low > low ) // Check various conditions for future bars downflagUpFrontier0 := downflagUpFrontier0 and (low > low ) downflagUpFrontier1 := downflagUpFrontier1 and (low >= low and low > low ) downflagUpFrontier2 := downflagUpFrontier2 and (low >= low and low >= low and low > low ) downflagUpFrontier3 := downflagUpFrontier3 and (low >= low and low >= low and low >= low and low > low ) downflagUpFrontier4 := downflagUpFrontier4 and (low >= low and low >= low and low >= low and low >= low and low > low )
// Combine the flags to determine if a down fractal exists flagDownFrontier = downflagUpFrontier0 or downflagUpFrontier1 or downflagUpFrontier2 or downflagUpFrontier3 or downflagUpFrontier4 downFractal = (downflagDownFrontier and flagDownFrontier)
// Plot the fractal symbols on the chart with adjusted plotting plotshape(downFractal, style=shape.triangleup, location=location.belowbar, offset=-n, color=color.gray, size=size.auto) plotshape(upFractal, style=shape.triangledown, location=location.abovebar, offset=-n, color=color.gray, size=size.auto)
Explanation:
Input Parameter (n): Sets the number of periods for fractal detection. The default value is 2, and it must be at least 2 to ensure valid fractal patterns.
Flag Initialization: Boolean variables are used to store intermediate conditions during fractal detection.
Loops: Iterate through the specified number of periods to evaluate the conditions for fractal formation.
Conditions:
Up Fractals: Checks if the current high is greater than previous highs and if future highs are lower or equal to the current high.
Down Fractals: Checks if the current low is lower than previous lows and if future lows are higher or equal to the current low.
Flag Combination: Logical and and or operations are used to combine the flags and determine if a fractal exists.
Adjusted Plotting:
The plotting of fractal symbols has been adjusted for better alignment and visual clarity.
The offset parameter is set to -n to align the plotted symbols with the correct bars.
The color and size have been fine-tuned for better visibility.
How to Use the Indicator
Adding the Indicator to Your Chart
Open TradingView:
Go to TradingView.
Access the Chart:
Click on "Chart" to open the main charting interface.
Add the Indicator:
Click on the "Indicators" button at the top.
Search for " Fractals".
Select the indicator from the list to add it to your chart.
Configuring the Indicator
Periods (n):
Default value is 2.
Adjust this parameter based on your preferred timeframe and sensitivity.
A higher value of n considers more bars for fractal detection, potentially reducing the number of signals but increasing their significance.
Interpreting the Signals
– Up Fractal (Downward Triangle): Indicates a potential price reversal to the downside. May be used as a signal to consider exiting long positions or tightening stop-loss orders.
– Down Fractal (Upward Triangle): Indicates a potential price reversal to the upside. May be used as a signal to consider entering long positions or setting stop-loss orders for short positions.
Trading Strategy Suggestions
Up Fractal Detection:
The high of the current bar (n) is higher than the highs of the previous two bars (n - 1, n - 2).
The highs of the next bars meet certain conditions to confirm the fractal pattern.
An up fractal symbol (downward triangle) is plotted above the bar at position n - n (due to the offset).
Down Fractal Detection:
The low of the current bar (n) is lower than the lows of the previous two bars (n - 1, n - 2).
The lows of the next bars meet certain conditions to confirm the fractal pattern.
A down fractal symbol (upward triangle) is plotted below the bar at position n - n.
Benefits of Using the Fractals Indicator
Early Signals: Helps in identifying potential reversal points in price movements.
Customizable Sensitivity: Adjusting the n parameter allows you to fine-tune the indicator based on different market conditions.
Enhanced Visuals: Adjustments to plotting improve the clarity and readability of fractal signals on the chart.
Limitations and Considerations
Lagging Indicator: Fractals require future bars to confirm the pattern, which may introduce a delay in the signals.
False Signals: In volatile or ranging markets, fractals may produce false signals. It's advisable to use them in conjunction with other analysis tools.
Not a Standalone Tool: Fractals should be part of a broader trading strategy that includes other indicators and fundamental analysis.
Best Practices for Using This Indicator
Combine with Other Indicators: Use in combination with trend indicators, oscillators, or volume analysis to confirm signals.
Backtesting: Before applying the indicator in live trading, backtest it on historical data to understand its performance.
Adjust Periods Accordingly: Experiment with different values of n to find the optimal setting for the specific asset and timeframe you are trading.
Disclaimer
The Fractals Indicator is intended for educational and informational purposes only. Trading involves significant risk, and you should be aware of the risks involved before proceeding. Past performance is not indicative of future results. Always conduct your own analysis and consult with a professional financial advisor before making any investment decisions.
Credits
This indicator is a fork of the original fractals indicator, with adjustments made to the plotting for improved visual representation. It is based on standard fractal patterns commonly used in technical analysis and has been developed to provide traders with an effective tool for detecting potential reversal points in the market.
Swing PointsEnglish:
The indicator shows the fractals where stop-losses may be located and can be used to trade from their taking.
You can adjust the length of the fractal (the number of bars with which it is surrounded on both sides, to confirm the validity).
You can also display lines from fractal points for clarity.
To keep the chart clean, you can enable deletion of already taken fractals.
Example of use with deleted fractals and without lines:
Русский:
Индикатор показывает фракталы где могут находиться стоп-лоссы и его можно использовать для торговли от их снятия.
Можно настраивать длину фрактала (количество баров, которыми он окружен с обеих сторон, для подтверждения валидности).
Так же можно выводить линии от фрактальных точек для наглядности.
Для сохранения чистоты графика можно включить удаление уже снятых фракталов.
Пример использования с удалением снятых фракталов и без линий:
Williams Fractals Dynamic Horizontal LinesWilliams Fractals with Dynamic Horizontal Lines
Overview
This script identifies Williams Fractals (support and resistance points) on any chart and automatically draws horizontal lines at those fractal levels.
The lines extend right and disappear when price breaks them — giving a clean and real-time view of key support and resistance levels.
Features
Detects upward fractals (potential resistances).
Detects downward fractals (potential supports).
Draws horizontal lines at each fractal point.
Automatically deletes a line when:
Price closes above a resistance.
Price closes below a support.
Clean and lightweight — minimal performance impact.
Inputs
Setting Description Default
Periods (n) Number of candles on each side required to confirm a fractal (minimum 2). 2
How It Works
Fractal Detection:
An up fractal is confirmed when a candle has the highest high compared to its neighbors.
A down fractal is confirmed when a candle has the lowest low compared to its neighbors.
Custom logic supports different "ties" — not just strict greater-than or less-than comparisons.
Drawing Lines:
When an up fractal is detected → a red horizontal resistance line is drawn.
When a down fractal is detected → a green horizontal support line is drawn.
Lines are drawn starting at the fractal candle and extend right across the chart.
Dynamic Line Deletion:
Every new candle is checked:
If high > resistance line → delete that resistance line.
If low < support line → delete that support line.
Only unbroken lines are kept on the chart, providing live, updated support/resistance zones.
Visual Elements
Up Fractal: 🡅 Triangular marker (teal color) above the fractal candle.
Down Fractal: 🡇 Triangular marker (red color) below the fractal candle.
Resistance Line: Red horizontal line.
Support Line: Green horizontal line.
Technical Details
Version: Pine Script v6
Arrays Used:
To store and manage active lines (line arrays).
To track the price associated with each line (float arrays).
Error Handling:
Backward iteration is handled using a while loop instead of a for loop to comply with Pine Script restrictions.
Offset Handling:
Fractal markers are plotted with an offset of -n bars for visual alignment.
Possible Enhancements (Future Ideas)
Sensitivity Settings: Allow a small margin (buffer) to define breakouts.
Extend Options: Let users choose between extending "infinite" or "limited" bars.
Custom Alerts: Generate alerts when fractal levels are broken.
Multi-timeframe Support: Detect fractals from higher timeframes on lower timeframe charts.
Example Usage
Swing Trading:
Use the fractal lines to identify and react to key breakouts or breakdowns dynamically.
Intraday Trading:
Spot live support/resistance on smaller timeframes for quick trades.
Trend Reversal Spotting:
Notice when a major fractal level is broken, possibly indicating trend changes.
Example Visual — Williams Fractals Dynamic Lines
Price Chart View:
What This Diagram Shows:
▲ Up Fractals:
Form resistance lines.
Line extends until price breaks above it.
▼ Down Fractals:
Form support lines.
Line extends until price breaks below it.
Lines are removed from the chart as soon as broken.
📈 Real Chart Example
Here's a rough idea how it will look live on your TradingView chart:
Feature Visual
Up Fractal 🔺 Green triangle above bar
Resistance Line ➖ Horizontal red line across the chart
Down Fractal 🔻 Red triangle below bar
Support Line ➖ Horizontal green line across the chart
Line Break 🚫 Line disappears when price crosses