Intrinsic Event (Multi DC OS)Overview
This indicator implements an event-based approach to analyze price movements in the foreign exchange market, inspired by the intrinsic time framework introduced in Fractals and Intrinsic Time - A Challenge to Econometricians by U. A. Müller et al. (1995). It identifies significant price events using an intrinsic time perspective and supports multi-agent analysis to reflect the heterogeneous nature of financial markets. The script plots these events as lines and labels on the chart, offering a visual tool for traders to understand market dynamics at different scales.
Key Features
Intrinsic Events : The indicator detects directional change (DC) and overshoot (OS) events based on user-defined thresholds (delta), aligning with the paper’s concept of intrinsic time (Section 6). Intrinsic time redefines time based on market activity, expanding during volatile periods and contracting during inactive ones, rather than relying on a physical clock.
Multi-Agent Analysis : Supports up to five agents, each with its own threshold and color settings, reflecting the heterogeneous market hypothesis (Section 5). This allows the indicator to capture the perspectives of market participants with different time horizons, such as short-term FX dealers and long-term central banks.
How It Works
Intrinsic Events Detection : The script identifies two types of events using intrinsic time principles:
Directional Change (DC) : Triggered when the price reverses by the threshold (delta) against the current trend (e.g., a drop by delta in an uptrend signals a "Down DC").
Overshoot (OS) : Occurs when the price continues in the trend direction by the threshold (e.g., a rise by delta in an uptrend signals an "Up OS").
DC events are plotted as solid lines, and OS events as dashed lines, with labels like "Up DC" or "OS Down" for clarity. The label style adjusts based on the trend to ensure visibility.
Multi-Agent Setup : Each agent operates independently with its own threshold, mimicking market participants with varying time horizons (Section 5). Smaller thresholds detect frequent, short-term events, while larger thresholds capture broader, long-term movements.
Settings
Each agent can be configured with:
Enable Agent : Toggle the agent on or off.
Threshold (%) : The percentage threshold (delta) for detecting DC and OS events (default values: 0.1%, 0.2%, 0.5%, 1%, 2% for agents 1–5).
Up Mode Color : Color for lines and labels in up mode (DC events).
Down Mode Color : Color for lines and labels in down mode (OS events).
Usage Notes
This indicator is designed for the foreign exchange market, leveraging its high liquidity, as noted in the paper (Section 1). Adjust the threshold values based on the instrument’s volatility—higher volatility leads to more intrinsic events (Section 4). It can be adapted to other markets where event-based analysis applies.
Reference
The methodology is based on:
Fractals and Intrinsic Time - A Challenge to Econometricians by U. A. Müller, M. M. Dacorogna, R. D. Davé, O. V. Pictet, R. B. Olsen, and J. R. Ward (June 28, 1995). Olsen & Associates Preprint.
Cerca negli script per "fractals"

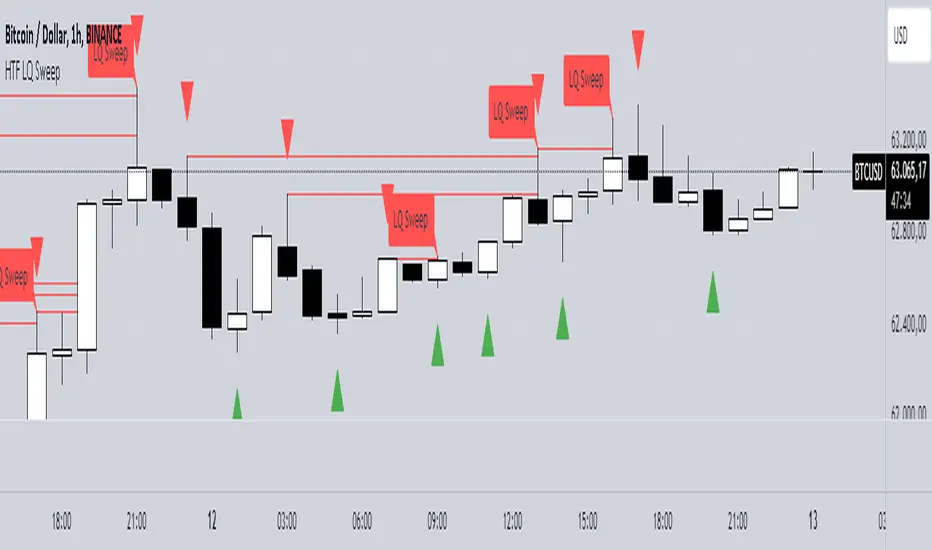
HTF LQ SweepThe following script recognises QL sweeps in the desired time frame with alarm function!
Theory:
There is liquidity above highs and below lows. If this is tapped and the market reacts strongly immediately, the probability of a reversal is greatly increased! In the chart, this is defined in such a way that a candle has its wicks BELOW the old low, but the close is ABOVE the old low. the same applies to the high, of course!
In such a case we have an "LQ Sweep"
How does the script work?
Williams 3 fractals are used as a basis. These are meaningful as lows or highs. Whenever a fractal is created, the price level is saved.
This means that not only the last fractal is relevant, but all historical fractals as long as they have not been reached!
If a candle reaches the level, but shows a rejection and closes within the level again, we have our "LQ Sweep" setup.
In the script you can select the timeframe in which the market has to be analysed. When the QL sweep occurs, an alert is triggered. This saves a lot of time because you can analyse different markets in different timeframes at the same time!
Each QL Sweep is marked in the chart when we are in the selected timeframe. These can also be deactivated so that only the last sweep is displayed.
Benefits for the trader:
An LQ sweep is a nice confirmation for a reversal.
If we have such an LQ sweep, we can wait in the lower timeframe for further confirmation, such as a structural break, to position our entries there.
The alarm function saves us a lot of time and we only go to the chart when a potential setup has been created.
You can set different time frames in the script: The selected time frame is then scanned and sends a signal when the event occurs.
Butterfly Harmonic Pattern [TradingFinder] Harmonic Detector🔵 Introduction
The Butterfly Harmonic Pattern is a sophisticated and highly regarded tool in technical analysis, utilized by traders to identify potential reversal points in the financial markets. This pattern is distinguished by its reliance on Fibonacci ratios and geometric configurations, which aid in predicting price movements with remarkable precision.
The origin of the Butterfly Harmonic Pattern can be traced back to the pioneering work of Bryce Gilmore, who is credited with discovering this pattern. Gilmore's extensive research and expertise in Fibonacci ratios laid the groundwork for the identification and application of this pattern in technical analysis.
The Butterfly pattern, like other harmonic patterns, is based on the principle that market movements are not random but follow specific structures and ratios.
The pattern is characterized by a distinct "M" shape in bullish scenarios and a "W" shape in bearish scenarios, each indicating a potential reversal point. These formations are identified by specific Fibonacci retracement and extension levels, making the Butterfly pattern a powerful tool for traders seeking to capitalize on market turning points.
The precise nature of the Butterfly pattern allows for the accurate prediction of target prices and the establishment of strategic entry and exit points, making it an indispensable component of a trader's analytical arsenal.
Bullish :
Bearish :
🔵 How to Use
Like other harmonic patterns, the Butterfly pattern is categorized based on how it forms at the end of an uptrend or downtrend. Unlike the Gartley and Bat patterns, the Butterfly pattern, similar to the Crab pattern, forms outside the wave 3 range at the end of a rally.
🟣 Types of Butterfly Harmonic Patterns
🟣 Bullish Butterfly Pattern
This pattern forms at the end of a downtrend and leads to a trend reversal from a downtrend to an uptrend.
🟣 Bearish Butterfly Pattern
In contrast to the Bullish Butterfly pattern, this pattern forms at the end of an uptrend and warns analysts of a trend reversal to a downtrend. In this case, traders are encouraged to shift their trading stance from buy trades to sell trades.
Advantages and Limitations of the Butterfly Pattern in Technical Analysis :
The Butterfly pattern is considered one of the precise and stable tools in financial market analysis. However, it is always important to pay special attention to the advantages and limitations of each pattern.
Here, we review the advantages and disadvantages of using the Butterfly harmonic pattern :
The main advantage of the Butterfly pattern is providing very accurate signals.
Using Fibonacci golden ratios and geometric rules, the Butterfly pattern identifies patterns accurately and systematically. (This high accuracy significantly helps investors in making trading decisions.)
Identifying this pattern requires expertise and experience in technical analysis.
Recognizing the Butterfly pattern might be complex for beginner traders. (Correct identification of the pattern necessitates mastery over geometric principles and Fibonacci ratios.)
The Butterfly harmonic pattern might issue false trading signals. (Traders usually combine the Butterfly pattern with other technical tools to confirm buy and sell signals.)
🔵 Setting
🟣 Logical Setting
ZigZag Pivot Period : You can adjust the period so that the harmonic patterns are adjusted according to the pivot period you want. This factor is the most important parameter in pattern recognition.
Show Valid Forma t: If this parameter is on "On" mode, only patterns will be displayed that they have exact format and no noise can be seen in them. If "Off" is, the patterns displayed that maybe are noisy and do not exactly correspond to the original pattern.
Show Formation Last Pivot Confirm : if Turned on, you can see this ability of patterns when their last pivot is formed. If this feature is off, it will see the patterns as soon as they are formed. The advantage of this option being clear is less formation of fielded patterns, and it is accompanied by the latest pattern seeing and a sharp reduction in reward to risk.
Period of Formation Last Pivot : Using this parameter you can determine that the last pivot is based on Pivot period.
🟣 Genaral Setting
Show : Enter "On" to display the template and "Off" to not display the template.
Color : Enter the desired color to draw the pattern in this parameter.
LineWidth : You can enter the number 1 or numbers higher than one to adjust the thickness of the drawing lines. This number must be an integer and increases with increasing thickness.
LabelSize : You can adjust the size of the labels by using the "size.auto", "size.tiny", "size.smal", "size.normal", "size.large" or "size.huge" entries.
🟣 Alert Setting
Alert : On / Off
Message Frequency : This string parameter defines the announcement frequency. Choices include: "All" (activates the alert every time the function is called), "Once Per Bar" (activates the alert only on the first call within the bar), and "Once Per Bar Close" (the alert is activated only by a call at the last script execution of the real-time bar upon closing). The default setting is "Once per Bar".
Show Alert Time by Time Zone : The date, hour, and minute you receive in alert messages can be based on any time zone you choose. For example, if you want New York time, you should enter "UTC-4". This input is set to the time zone "UTC" by default.

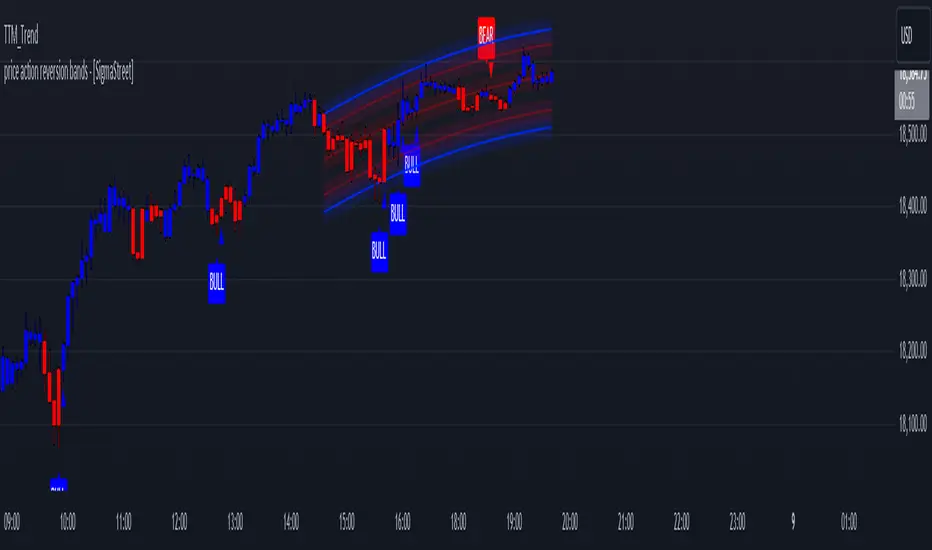
price action reversion bands - [SigmaStreet]█ OVERVIEW
The "Price Action Reversion Bands" is designed to help traders identify potential reversal zones through the integration of polynomial regression, fractal analysis, and pinbar detection. This tool overlays directly onto the price chart, providing dynamic visual cues and signals for market reversals. Its unique synthesis of these methodologies offers traders a powerful, multifaceted approach to market analysis.
█ CONCEPTS
Polynomial Regression Bands:
What It Does:
Models the main trend using a polynomial equation to create a middle trend line with dynamic support and resistance bands.
How It Works:
Calculates polynomial coefficients to plot a regression line and adjusts the bands according to market volatility and conditions.
Fibonacci Retracement Levels:
What It Does:
Provides additional lines inside the regression bands at key Fibonacci ratios to identify potential support and resistance areas.
How It Works:
Calculates retracement levels by identifying high and low points over the same period used to calculate the regression bands, applying Fibonacci ratios to these points.
Fractal Analysis:
What It Does: Identifies natural resistance and support levels, indicating potential reversal zones.
How It Works: Detects fractals based on a specific pattern of price action, using Williams Fractal methodology.
Pinbar Detection:
What It Does: Signals potential price reversals through pinbar candlestick patterns.
How It Works: Analyzes
candlesticks to identify pinbars which show a rejection of prices, suggesting possible reversals.
█ ORIGINALITY AND USEFULNESS
The price action reversion bands distinguishes itself through its innovative integration of several advanced analytical methods, providing traders with a holistic view of potential market reversals:
Unique Combination:
While many tools use these techniques in isolation, this indicator synergistically combines polynomial regression, Fibonacci retracement levels, fractal analysis, and pinbar detection. This multi-faceted approach allows traders to assess strength, potential reversal zones, and price rejection more effectively than using traditional single-method indicators.
Advanced Polynomial Regression Application:
Unlike standard regression tools that offer static insights, this indicator dynamically adjusts its regression bands based on real-time market volatility, providing a more accurate reflection of market conditions.
Enhanced Signal Reliability:
By using fractals and pinbars in conjunction to validate each other, the indicator significantly increases the reliability of its reversal signals. This dual-validation method filters out less probable signals, focusing on high-probability trading opportunities.
Customization and Flexibility:
It offers unprecedented customization options, allowing traders to fine-tune the tool according to their trading style and market conditions. Traders can adjust the polynomial degree, the sensitivity of the Fibonacci retracements, and even the definition of what constitutes a significant pinbar, making it highly adaptable to various trading scenarios.
Educational Value:
The indicator not only aids in trading but also serves as an educational tool that helps traders understand the interaction between different types of market analysis techniques. This contributes to a deeper knowledge base and better trading decisions over time.
These distinctive features make the "Price Action Reversion Bands - " not just another indicator but a comprehensive trading tool that enhances decision-making through a well-rounded analysis of market dynamics.
█ HOW TO USE
Installation and Setup:
Apply the indicator to your TradingView chart from the "Indicators" menu.
Select either polynomial regression or Fibonacci retracement as the basis for the bands through the indicator settings.
Reading the Indicator:
Monitor the approach of price to the upper and lower bands which indicate potential reversal zones.
Look for fractal and pinbar formations near these bands for additional signal confirmation.
Customization:
Adjust settings such as the polynomial degree, data window length, and engagement zones to tailor the bands to your trading style.
Modify visual aspects like color and line type for better clarity and personal preference.
█ FEATURES
Dynamic Adjustment:
Bands adjust in real-time based on incoming price data and selected settings.
Multiple Analysis Techniques: Combines several analytical techniques to provide a comprehensive view of potential market movements. The integration of polynomial regression with Fibonacci levels, supplemented by fractal and pinbar analysis, marks this tool as particularly innovative, offering a level of synthesis that enhances predictive accuracy and usability.
User-Friendly Customization: Allows for extensive customization to suit individual trading strategies and preferences.
█ LIMITATIONS
Market Dependency:
Performance may vary significantly across different markets and conditions.
Parameter Sensitivity: Requires fine-tuning of parameters to ensure optimal performance, which might demand a steep learning curve for new users.
█ NOTES
For best results, combine this tool with other forms of analysis, such as fundamental analysis and other technical indicators, to confirm signals and enhance decision-making.
█ THANKS
Special thanks to the PineCoders community the Pine Coders themselves for their foundational contributions to the concepts used in this script. Their pioneering work in the fields of technical analysis and Pine Script development has been invaluable. This script is a testament to the collaborative spirit of the TradingView developer community, integrating analytical techniques with innovative approaches to offer a tool that is both modern and cutting-edge.
Correct Fractal Swings by CRYPTOFORThis indicator adjusts and enhances the normal 3-fractal swing. The author of this definition, uncle_travis, takes into account swings with the absorption of 3 candles and uses them as structure points.

Advanced Volatility-Adjusted Momentum IndexAdvanced Volatility-Adjusted Momentum Index (AVAMI)
The AVAMI is a powerful and versatile trading index which enhances the traditional momentum readings by introducing a volatility adjustment. This results in a more nuanced interpretation of market momentum, considering not only the rate of price changes but also the inherent volatility of the asset.
Settings and Parameters:
Momentum Length: This parameter sets the number of periods used to calculate the momentum, which is essentially the rate of change of the asset's price. A shorter length value means the momentum calculation will be more sensitive to recent price changes. Conversely, a longer length will yield a smoother and more stabilized momentum value, thereby reducing the impact of short-term price fluctuations.
Volatility Length: This parameter is responsible for determining the number of periods to be considered in the calculation of standard deviation of returns, which acts as the volatility measure. A shorter length will result in a more reactive volatility measure, while a longer length will produce a more stable, but less sensitive measure of volatility.
Smoothing Length: This parameter sets the number of periods used to apply a moving average smoothing to the AVAMI and its signal line. The purpose of this is to minimize the impact of volatile periods and to make the indicator's lines smoother and easier to interpret.
Lookback Period for Scaling: This is the number of periods used when rescaling the AVAMI values. The rescaling process is necessary to ensure that the AVAMI values remain within a consistent and interpretable range over time.
Overbought and Oversold Levels: These levels are thresholds at which the asset is considered overbought (potentially overvalued) or oversold (potentially undervalued), respectively. For instance, if the AVAMI exceeds the overbought level, traders may consider it as a possible selling opportunity, anticipating a price correction. Conversely, if the AVAMI falls below the oversold level, it could be seen as a buying opportunity, with the expectation of a price bounce.
Mid Level: This level represents the middle ground between the overbought and oversold levels. Crossing the mid-level line from below can be perceived as an increasing bullish momentum, and vice versa.
Show Divergences and Hidden Divergences: These checkboxes give traders the option to display regular and hidden divergences between the AVAMI and the asset's price. Divergences are crucial market structures that often signal potential price reversals.
Index Logic:
The AVAMI index begins with the calculation of a simple rate of change momentum indicator. This raw momentum is then adjusted by the standard deviation of log returns, which acts as a measure of market volatility. This adjustment process ensures that the resulting momentum index encapsulates not only the speed of price changes but also the market's volatility context.
The raw AVAMI is then smoothed using a moving average, and a signal line is generated as an exponential moving average (EMA) of this smoothed AVAMI. This signal line serves as a trigger for potential trading signals when crossed by the AVAMI.
The script also includes an algorithm to identify 'fractals', which are distinct price patterns that often act as potential market reversal points. These fractals are utilized to spot both regular and hidden divergences between the asset's price and the AVAMI.
Application and Strategy Concepts:
The AVAMI is a versatile tool that can be integrated into various trading strategies. Traders can utilize the overbought and oversold levels to identify potential reversal points. The AVAMI crossing the mid-level line can signify a change in market momentum. Additionally, the identification of regular and hidden divergences can serve as potential trading signals:
Regular Divergence: This happens when the asset's price records a new high/low, but the AVAMI fails to follow suit, suggesting a possible trend reversal. For instance, if the asset's price forms a higher high but the AVAMI forms a lower high, it's a regular bearish divergence, indicating potential price downturn.
Hidden Divergence: This is observed when the price forms a lower high/higher low, but the AVAMI forms a higher high/lower low, suggesting the continuation of the prevailing trend. For example, if the price forms a lower low during a downtrend, but the AVAMI forms a higher low, it's a hidden bullish divergence, signaling the potential continuation of the downtrend.
As with any trading tool, the AVAMI should not be used in isolation but in conjunction with other technical analysis tools and within the context of a well-defined trading plan.

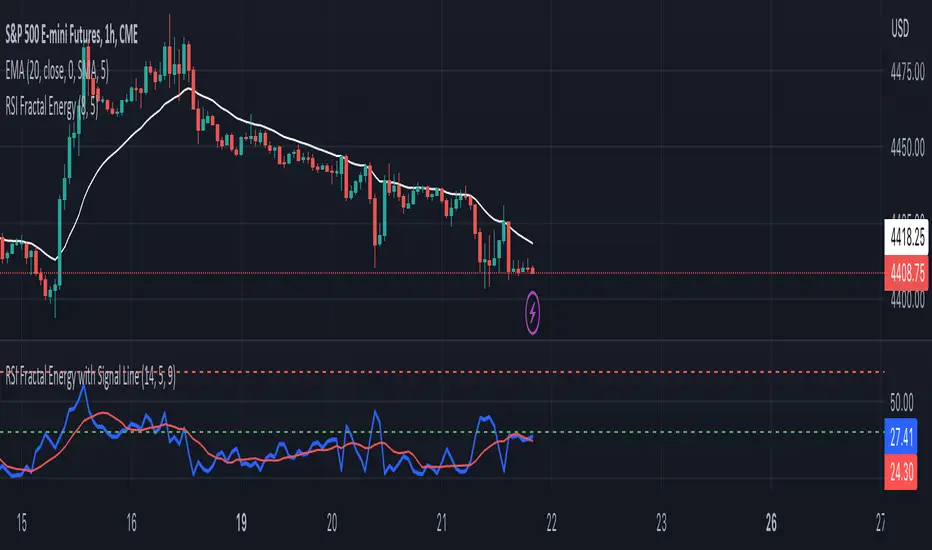
RSI Fractal Energy with Signal LineHere is my second script.
Introducing the RSI Fractal Energy Indicator.
This incorporates the Relative-Strength Index and Fractal Energy as the name implies.
This will help the trader identify:
1. Trend Strength: The higher the value of the indicator can indicate the strength of the trend and vice versa.
2. Reversal points: If the indicator is showing weakness and the market is making higher highs and lower lows this can indicate a reversal is possible.
3. Overbought and Oversold conditions: This indicator is currently set to 30(Oversold) and 70(Overbought), but this can be changed in the source code.
I also added a signal line to provide bullish/bearish crossovers.
I use this indicator on the 1 hr chart, but it can be used on any time frame.
Please let me know if you have any questions, comments, or concerns. Always open to learning more.
I will also provide updates as I continue to use my indicators.
Happy trading!
Alpha Fractal BandsWilliams fractals are remarkable support and resistance levels used by many traders. However, it can sometimes be challenging to use them frequently and get confirmation from other oscillators and indicators. With the new "Alpha Fractal Bands", a unique blend of Williams Fractals and Bollinger Bands emerges, offering a fresh perspective. Extremes can be utilized as price reversals or for taking profits. I look forward to hearing your thoughts. Best regards... Happy trading!
An easy solution for long positions is to:
Identify a bullish trend or a potential entry point for a long position.
Set a stop-loss order to limit potential losses if the trade goes against you.
Determine a target price or take-profit level to lock in profits.
Consider using technical indicators or analysis tools to confirm the strength of the bullish trend.
Regularly monitor the trade and make necessary adjustments based on market conditions.
An easy solution for short positions could be to follow these steps:
Identify a bearish trend or a potential entry point for a short position.
Set a stop-loss order to limit potential losses if the trade goes against you.
Determine a target price or take-profit level to lock in profits.
Consider using technical indicators or analysis tools to confirm the strength of the bearish trend.
Regularly monitor the trade and make necessary adjustments based on market conditions.
Remember, it's important to conduct thorough research and analysis before entering any trade and to manage your risk effectively.
To stay updated with the content, don't forget to follow and engage with it on TV, my friends. Remember to leave comments as well :)

Musashi_Fractal_Dimension === Musashi-Fractal-Dimension ===
This tool is part of my research on the fractal nature of the markets and understanding the relation between fractal dimension and chaos theory.
To take full advantage of this indicator, you need to incorporate some principles and concepts:
- Traditional Technical Analysis is linear and Euclidean, which makes very difficult its modeling.
- Linear techniques cannot quantify non-linear behavior
- Is it possible to measure accurately a wave or the surface of a mountain with a simple ruler?
- Fractals quantify what Euclidean Geometry can’t, they measure chaos, as they identify order in apparent randomness.
- Remember: Chaos is order disguised as randomness.
- Chaos is the study of unstable aperiodic behavior in deterministic non-linear dynamic systems
- Order and randomness can coexist, allowing predictability.
- There is a reason why Fractal Dimension was invented, we had no way of measuring fractal-based structures.
- Benoit Mandelbrot used to explain it by asking: How do we measure the coast of Great Britain?
- An easy way of getting the need of a dimension in between is looking at the Koch snowflake.
- Market prices tend to seek natural levels of ranges of balance. These levels can be described as attractors and are determinant.
Fractal Dimension Index ('FDI')
Determines the persistence or anti-persistence of a market.
- A persistent market follows a market trend. An anti-persistent market results in substantial volatility around the trend (with a low r2), and is more vulnerable to price reversals
- An easy way to see this is to think that fractal dimension measures what is in between mainstream dimensions. These are:
- One dimension: a line
- Two dimensions: a square
- Three dimensions: a cube.
--> This will hint you that at certain moment, if the market has a Fractal Dimension of 1.25 (which is low), the market is behaving more “line-like”, while if the market has a high Fractal Dimension, it could be interpreted as “square-like”.
- 'FDI' is trend agnostic, which means that doesn't consider trend. This makes it super useful as gives you clean information about the market without trying to include trend stuff.
Question: If we have a game where you must choose between two options.
1. a horizontal line
2. a vertical line.
Each iteration a Horizontal Line or a Square will appear as continuation of a figure. If it that iteration shows a square and you bet vertical you win, same as if it is horizontal and it is a line.
- Wouldn’t be useful to know that Fractal dimension is 1.8? This will hint square. In the markets you can use 'FD' to filter mean-reversal signals like Bollinger bands, stochastics, Regular RSI divergences, etc.
- Wouldn’t be useful to know that Fractal dimension is 1.2? This will hint Line. In the markets you can use 'FD' to confirm trend following strategies like Moving averages, MACD, Hidden RSI divergences.
Calculation method:
Fractal dimension is obtained from the ‘hurst exponent’.
'FDI' = 2 - 'Hurst Exponent'
Musashi version of the Classic 'OG' Fractal Dimension Index ('FDI')
- By default, you get 3 fast 'FDI's (11,12,13) + 1 Slow 'FDI' (21), their interaction gives useful information.
- Fast 'FDI' cross will give you gray or red dots while Slow 'FDI' cross with the slowest of the fast 'FDI's will give white and orange dots. This are great to early spot trend beginnings or trend ends.
- A baseline (purple) is also provided, this is calculated using a 21 period Bollinger bands with 1.618 'SD', once calculated, you just take midpoint, this is the 'TDI's (Traders Dynamic Index) way. The indicator will print purple dots when Slow 'FDI' and baseline crosses, I see them as Short-Term cycle changes.
- Negative slope 'FDI' means trending asset.
- Positive most of the times hints correction, but if it got overextended it might hint a rocket-shot.
TDI Ranges:
- 'FDI' between 1.0≤ 'FDI' ≤1.4 will confirm trend following continuation signals.
- 'FDI' between 1.6≥ 'FDI' ≥2.0 will confirm reversal signals.
- 'FDI' == 1.5 hints a random unpredictable market.
Fractal Attractors
- As you must know, fractals tend orbit certain spots, this are named Attractors, this happens with any fractal behavior. The market of course also shows them, in form of Support & Resistance, Supply Demand, etc. It’s obvious they are there, but now we understand that they’re not linear, as the market is fractal, so simple trendline might not be the best tool to model this.
- I’ve noticed that when the Musashi version of the 'FDI' indicator start making a cluster of multicolor dots, this end up being an attractor, I tend to draw a rectangle as that area as price tend to come back (I still researching here).
Extra useful stuff
- Momentum / speed: Included by checking RSI Study in the indicator properties. This will add two RSI’s (9 and a 7 periods) plus a baseline calculated same way as explained for 'FDI'. This gives accurate short-term trends. It also includes RSI divergences (regular and hidden), deactivate with a simple check in the RSI section of the properties.
- BBWP (Bollinger Bands with Percentile): Efficient way of visualizing volatility as the percentile of Bollinger bands expansion. This line varies color from Iced blue when low volatility and magma red when high. By default, comes with the High vols deactivated for better view of 'FDI' and RSI while all studies are included. DDWP is trend agnostic, just like 'FDI', which make it very clean at providing information.
- Ultra Slow 'FDI': I noticed that while using BBWP and RSI, the indicator gets overcrowded, so there is the possibility of adding only one 'FDI' + its baseline.
Final Note: I’ve shown you few ways of using this indicator, please backtest before using in real trading. As you know trading is more about risk and trade management than the strategy used. This still a work in progress, I really hope you find value out of it. I use it combination with a tool named “Musashi_Katana” (also found in TradingView).
Best!
Musashi

Immediate Trend - VHXIMMEDIATE TREND - VULNERABLE_HUMAN_X
This indicator is used to identify the immediate trend in the market.
When a Short Term High (STH) is engulfed and closed above, we consider that as a bullish trend.
And Similarly, when a Short Term Low (STL) is engulfed and closed below, we consider that as a bullish trend.
STH - A candle that is higher than the one candle towards it's left and one candle towards it's right.
STL - A candle that is lower than the one candle towards it's left and one candle towards it's right.
HOW TO USE:
1. Do not take trades purely based on the immediate trend showcased by the indicator. Rather, use them as confluence with your trading strategy.
2. When you are expecting price to reverse at your point of interest (Denamd/Supply zone), this indicator can help you predict the reversal by showcasing the current trend.
3. Using this indicator you can travel the trend as long as there is a change of trend predicted by this indicator.

Event Locator BasicUsable under any conditions and in all markets, the 'event locator' provides a foundational layer for any count-based trading strategy or system. This specific installment color codes events - all down events are green, up events are blue, double-marked events are red, and smooth events are gray. It also wraps the price sequence in a 3-d line landscape plot - providing a visual using lines that are event sensitive. Though events are sometimes referred to as 'fractals,' this is not a fractal tool. These marks are based on 3 candles, not 5 as is common with the Bill Williams fractal scripts. Every countable event on the chart will be marked using this tool. Really, Elliott Wave should have told you about this... (because you can't legitimately count w/o it)
//This indicator was originally a mod of the 'Williams Fractals' indicator - modified by Erek A.D., Nov. 2017
//It was rewritten from the ground up by 'Brobear' in Sept./Oct. 2018
//This code marks 'rough' AND 'smooth' EVENTS in price flow
//EVENTS are naturally created in markets when SEPARATION occurs at candle tips
//SEPARATION happens when a high is flanked by lower highs or a low is flanked by higher lows
//EVENT LOCATORS like this provide an objective foundation for counting price movement

EneX SignalEneX is signal that give recommendation signals for entry and exit on spot market. This indicators not suitable for leverage trading in futures market.
EneX signal consider several indicators and has entry and exit rules.
EneX signal is suitable for investors who believe in trend following strategy (disclaimer on).
This script composed by Yohan Naftali for educational purpose only. Reader who will use this signal must do own research.
Indicator and Plot Involved
1. Williams Fractals with default periods = 2
2. William Alligator Indicators with default simple moving average 8, 13, and 21
3. Exponential Moving Averages with default value EMA 50, 100, and 200
4. Relative Strength Index with default overbought level = 80 and oversold level = 20
5. Williams Fractals are joined to create support and resistance line and fill area between support and resistance lines.
Entry signal conditions
1. Entry on Weakness when bullish fractal appear on n/2 period
2. Entry when price break resistance line
All entry condition must above EMA and alligator signal and not in overbought RSI
Exit signal conditions
1. Lowest price is below Exponential Moving Average
2. Lowest price is below William alligator lines
You can easily find entry and exit points by using Entry (E), Exit(X) signals
How to use
1. Monitor chart and wait until E or X signals
2. Entry if Entry Signal (E) appear (green colored label)
3. Exit if Exit Signal (X) appear (red colored label)
4. Change indicators setting when necessary
Best Practice
1. Entry only when entry signal (E) appear
2. Never entry when price below William alligator signal
3. Exit when exit signal (X) appear
4. Not exit when exit signal appear when you believe or you have information that price will be rebound
5. Exit if you believe that current price meet your target price
6. Always wise when use EneX signals
Disclaimer
Do your own research and consider fundamental price of asset.
The indicators provided on this script is for educational purposes only.
Author does not offer advisory or brokerage services, nor does it recommend or advise users to buy or sell particular stocks or securities.
Please examined script and give feedback for further improvement.

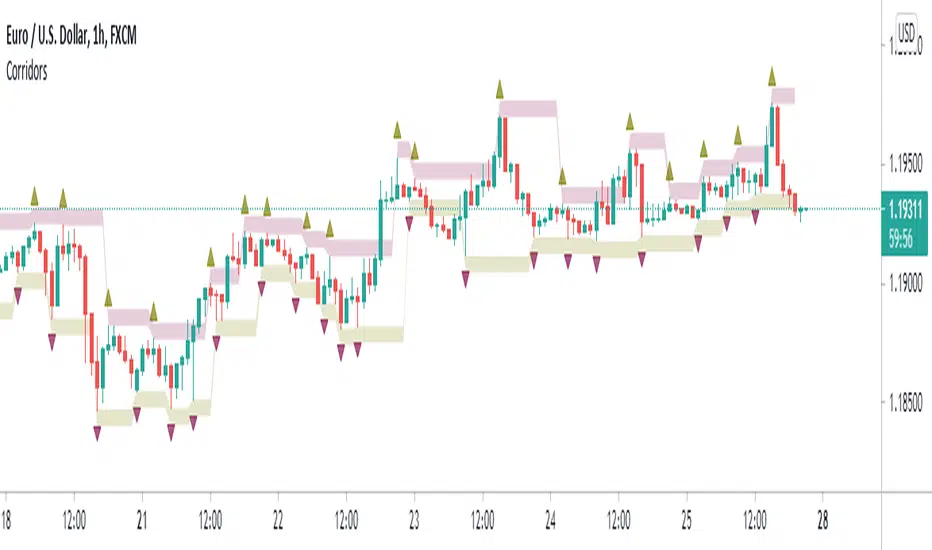
STP Fractal CorridorsFractal Corridors is a lagging channel connecting Fractal highs and lows each with added/substracted pre-set value.
It is inspired and designed for Vladimir Poltoratskiy's trading style with his ST patterns (book: Forex Strategy: ST Patterns Trading Manual).
This uses fractals with one candle lower/higher on each side as in the book.
You may choose to disable fractals and view the channel only.
Good luck trading!

Fractal CorridorsFractal Corridors is a lagging channel connecting Fractal highs and lows each with added/substracted pre-set value.
It is inspired and designed for Vladimir Poltoratskiy's trading style with his ST patterns (book: Forex Strategy: ST Patterns Trading Manual).
However, to keep the charts clearer, I used William's Fractals that require two previous and following candles to be higher/lower opposed to just one as described in the book.
You may choose to disable fractals and view the channel only.
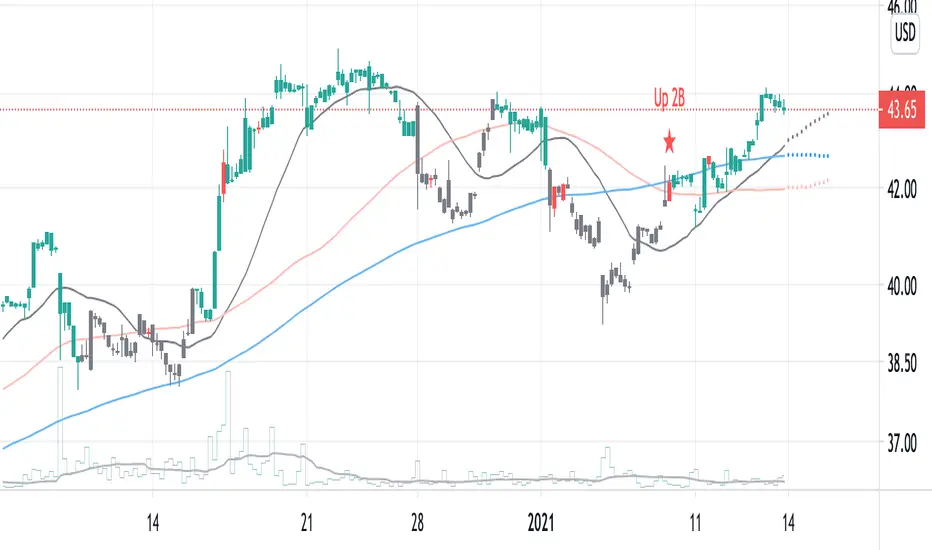
2B detector betaIdentifying a trend reversal is practically tricky, given that price movement is somewhat unpredictable and mostly obeys a power law. In which the price difference is primarily out of normal distribution. According to Benoit Mandelbrot, the price distribution follows an alpha-stable distribution with α equal to 1.7.
Real data observation suggests that stock prices do not follow the Random Walk Hypothesis or Brownian motion. Instead, they follow a fractal pattern. Fractals exhibit similar patterns at different scales called self-similarity. Using this character, one can develop fractal patterns to identify local highs and local lows.
This indicator identifies the reversal signal so-called 2B base on the following logic:
1. Identify local highs and local lows with fractals
2. Define relative positions of those local highs and lows (ABC and 2B)
3. Define the local range of ABC and B
Disclaimer: This indicator is only for research purposes. Please do not take it as investing or trading advice.
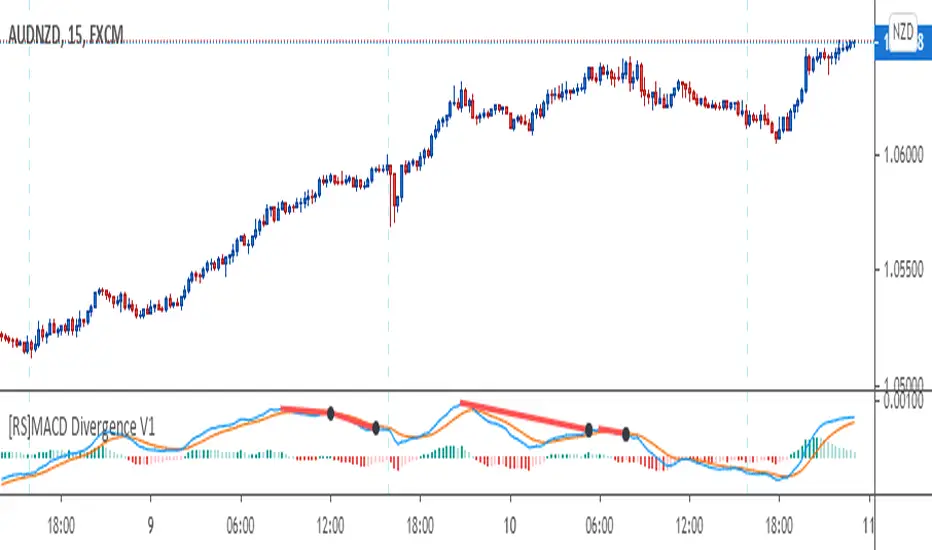
[RS]MACD Divergence V1This oscilator was created by Ricardo Santos using MACD's histogram as the series to find low and high fractals and from there find and plot divergences.
I just modified it a little bit to make it to look more like the MACD public library indicator and use the actual MACD series (instead of the histogram) to find the fractals and from there plot divergences.
I did this to make it easier for me and other fellow students of a Forex school where we use these type of divergences to find patterns.
Deep_Fractal_Signals_and_Rubber_Band_TradesThis indicator is based on Williams Fractals and the TopDog Trading "Rubber Band Trade"
The Deep Fractal Signals are triangles that indicate the price is forming a pattern of decreasing lows in a down trend (orange) or, increasing highs in an up trend (green).
The triangles are placed above or below the last bar of the pattern, unlike Fractals which are drawn 2 candles prior to the current candle, and are re-painted on the chart.
When the triangle is indicated above the moving average in a down trend (blue), or below the moving average in an up trend (yellow), this is a Rubber Band Trade.
When the slope of the moving average is less than the Gain set by the user, or are counter-trend, the triangles are plotted in silver.
When used in conjunction with the Power Analyzer indicator, a signal to the long side should be taken when the Power Analyzer momentum indicator is at a cycle low. Similarly, a signal to the short side should be taken when the indicator is at a cycle high.
The first, second or third signal in a new trend have the highest probability of a follow through.
The indicator sometimes gives a false signal at the very end of the trend, just before the market reverses. This is an attempt by the Market Makers to persuade traders that the trend will continue.
Please leave a comment and "Like" this indicator if you find it useful.
FX Engineering

Ichimoku ++ public v0.9Description:
The intention of this script is to build/provide a kind of work station / work bench for analysing markets and especially Bitcoin . Another goal is to get maximum market information while maintaining a good chart overview. A chart overloaded with indicators is useless because it obscures the view of the chart as the most important indicator. The chart should be clear and market structure should be easy to see. In addition, some indicator signals can be activated to better assess the quality of signals from the past. The chart environment or the chart context is important for the quality of a signal.
The intention of this script is not to teach someone how to trade or how to use these Indicators but to provide a tool to analyse markets better and to help to draw conclusions of market behaviour in a higher quality.
A general advise:
Use the included indicators and signals in a confluent way to get stoploss, buy and sell entry points. SR clusters can be identified for use in conjunction with fractals as entry and exit pints. My other scripts can also help. Prefer 4 hours, daily and a longer time frame. There is no "Holy Grail" :).
If someone is new to trading you should learn about the indicators first. Definitely learn about Ichimoku Cloud Indicator.
Integrated indicators are:
Ichimoku Cloud and signals
Parabolic SAR and signal
ATR stop
Bollinger Bands
EMA / SMA and background color as signal
Williams Fractals and signal
Puell Multiple signal

Phicube EMASAR ( EMA Support and Resistance )Indicator based on the Concept created by Bo Williams. But unlike the original that uses MIMAs, EMAs are used here.
Exponential moving averages will be shown according to fractal alignment, in order to show the important support and resistance levels ( SAR ).
When the fractals are aligned to become support,
we will have the EMA in the graph with a bright color.
When the fractals are aligned to become resistance, we will have EMA in the graph with a matte color.
Available exponential moving averages: 17,34,72,144,305,610,1292 and 2584
____________________________________________________//_____________________________________________________________________
Indicador baseado no Conceito criado pelo Bo Williams. Mas diferente do original que utiliza MIMAs, aqui é utilizado EMAs.
As médias móveis exponenciais serão mostradas de acordo com o alinhamento dos fractais, com objetivo de mostrar os níveis importantes
de suporte e resistência( SAR ).
Quando estiver com os fractais alinhados virando suporte, teremos no gráfico a EMA com uma cor em tom brilhante.
Quando estiver com os fractais alinhados virando resistência, teremos no gráfico a EMA com uma cor em tom fosco.
Médias móveis exponenciais disponíveis: 17,34,72,144,305,610,1292 e 2584

Fractal Breakout StrategyFractal
A type of pattern used in technical analysis to predict a reversal in the current trend. A fractal pattern consists of five bars and is identified when the price meets the following characteristics:
1. A shift from a downtrend to an uptrend occurs when the lowest bar is located in the middle of the pattern and two bars with successively higher lows are positioned around it.
2. A shift from an uptrend to a downtrend occurs when the highest bar is located in the middle of the pattern and two bars with successively lower highs are positioned around it.

Trend-Following Combo-SuperTrend, EMA, Aroon, DMI, Laguerre RSIThis is a trend-following indicator which condenses two SuperTrend indicators -- one based on analysis over a shorter period of time (1.5, 7), and one based on analysis over a longer period of time (1.65, 100) -- into a single indicator which appears on your chart only when both the shorter- and longer-term analysis indicates a "SuperTrend" in the same direction.
Additionally, potential trade entry indicators are displayed in the form of up and down arrows when (by default) three of the following five indicators suggest that the market is trending in the same direction as both the shorter- and longer-term SuperTrend indicators:
EMA Crossover (8, 15)
Aroon Indicator (8)
Aroon Oscillator (8)
Directional Movement Index (DI +/-) (8)
Laguerre RSI (13)
You may update the parameters of any of the indicators to match your own preferences.
Additionally, you may also adjust the "Threshold" of indicators that must be in agreement with the SuperTrend to show a potential trade entry arrow. Bear in mind that if you set the Indicator Threshold too low, you will see more frequent trade entry arrows, many of which will not be profitable if taken. Similarly, set this value too high, and you will see fewer trade entry arrows that may not appear until after most of the "juice" in the trend has evaporated. Ideal values for the threshold seem to be between 2-4, depending on the symbol you are trading.
The following image shows all of the indicators referenced above on a 5-minute chart of the SPY during a single trading day:
And, here is the same period of time showing only the Trend-Following Combo indicator with default settings:
This indicator would not have been possible save for work contributed by the following:
SuperTrend by Rajandran R
Aroon w/ crossovers highlighted by seiglerj
Aroon Oscillator by jcrewolinsky
Directional Movement Index by TradingView
Laguerre RSI (Self Adjusting Alpha with Fractals Energy) by everget

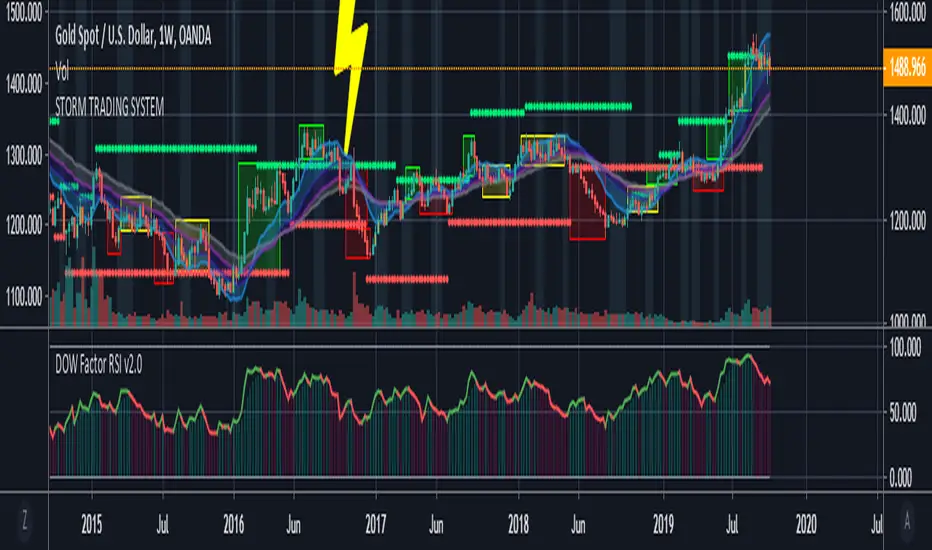
Storm Trading System This script is inspired by the following :
Fractal Dow RSI Support and Resistance ;
Moving Average Clouds ;
Let's start.
This command is based on a fun description of where we are.
Technical analysis methods are likened to a storm.
Clouds as moving average,risk factor as lightning,
fractals were taken as green and red rain.
In this system:
4 Exponential Moving Averages, ( EMA15, EMA30 , EMA45 , EMA60 ),
interpretation of my own work, Dow Factor RSI, as Fractal Support and Resistance,
interpretation of my own work , DVOG Risk Factor : with changeable background and bar color.
Fractal support resistance level codes do not belong to me.
So I'm not putting a license.
But the other codes are my labor.
Consider the risk factor not as a stop, but as a region of high attention.
It is a warning before hard movements.
And watch out for turbulence in the clouds :)
The regions above and below the clouds are major trend zones, which may take a long time.
Guide the fractals in these areas.
It allows you to comment on this and tons of similar things.
And you see where you are in the big trade from a different perspective.
Repaint issue :
Firstly our source is close . Repaint will only cause the following issue and solution:
There may be a time difference between countries as the dow factor depends on the indexes.
Do not use a low graph time frame in stocks.
Volume-supported Fractal SRModified version of SynapticEX's Volume-supported Fractal S/R with EMA instead of SMA, pinescript 4 port, and EMA20/EMA50 defaults for support and resistance.
EMA20 = red/green
EMA50 = orange/yellow
