FVG Toolkit V2 (MTF + Backtest)FVG Toolkit V2 is a clean, multi-timeframe Fair Value Gap (FVG) indicator built for discretionary traders who want clarity, flexibility, and the ability to properly backtest.
This tool was designed specifically to solve common issues with FVG indicators—limited history, lack of timeframe control, and excessive chart clutter—while staying true to how institutional-style traders analyze price.
Key Features:
Multi-Timeframe Fair Value Gaps
Display FVGs from multiple timeframes on a single chart
Supports 5m, 15m, 30m, 1H, 4H, and Daily
Each timeframe can be turned on or off independently
Adjustable Backtesting Lookback
Choose how far back FVGs are displayed (in days)
Default set to 30 days for meaningful backtesting
Helps traders study historical reactions without overwhelming the chart
Custom Timeframe Labels
Each FVG is labeled directly on the chart
Rename timeframe labels in settings (e.g., “30m Bias”, “HTF Daily”, “5m Execution”)
Makes multi-timeframe analysis clear and intuitive
Unfilled & Inverted FVG Logic
Optional setting to show only unfilled FVGs
Optional inverted FVGs once a gap is fully filled
Helps identify potential support/resistance flips and reaction zones
Chart-Timeframe Visualization
All FVGs are drawn on the active chart timeframe
Ideal for execution on 1m, 5m, and 15m charts
Keeps higher-timeframe context visible without switching charts
Who This Indicator Is For:
Traders using Fair Value Gaps as reaction zones
ICT-style and price-action traders
Forex, Futures, and Indices traders
Traders who want clean charts and real backtesting, not repainting signals
Best Use Cases:
Higher-timeframe bias with 30m, 1H, 4H, or Daily FVGs
Execution on 5m or 15m charts
Studying which timeframes’ FVGs are respected by specific instruments
Backtesting FVG behavior across different markets (e.g., USDJPY vs Gold)
Cerca negli script per "fvg"

FVG MagicFVG Magic — Fair Value Gaps with Smart Mitigation, Inversion & Auto-Clean-up
FVG Magic finds every tradable Fair Value Gap (FVG), shows who powered it, and then manages each gap intelligently as price interacts with it—so your chart stays actionable and clean.
Attribution
This tool is inspired by the idea popularized in “Volumatic Fair Value Gaps ” by BigBeluga (licensed CC BY-NC-SA 4.0). Credit to BigBeluga for advancing FVG visualization in the community.
Important: This is a from-scratch implementation—no code was copied from the original. I expanded the concept substantially with a different detection stack, a gap state machine (ACTIVE → 50% SQ → MITIGATED → INVERSED), auto-clean up rules, lookback/nearest-per-side pruning, zoom-proof volume meters, and timeframe auto-tuning for 15m/H1/H4.
What makes this version more accurate
Full-coverage detection (no “missed” gaps)
Default ICT-minimal rule (Bullish: low > high , Bearish: high < low ) catches all valid 3-candle FVGs.
Optional Strict filter (stricter structure checks) for traders who prefer only “clean” gaps.
Optional size percentile filter—off by default so nothing is hidden unless you choose to filter.
Correct handling of confirmations (wick vs close)
Mitigation Source is user-selectable: high/low (wick-based) or close (strict).
This avoids false “misses” when you expect wick confirmations (50% or full fill) but your logic required closes.
State-aware labelling to prevent misleading data
The Bull%/Bear% meter is shown only while a gap is ACTIVE.
As soon as a gap is 50% SQ, MITIGATED, or INVERSED, the meter is hidden and replaced with a clear tag—so you never read stale participation stats.
Robust zoom behaviour
The meter uses a fixed bar-width (not pixels), so it stays proportional and readable at any zoom level.
Deterministic lifecycle (no stale boxes)
Remove on 50% SQ (instant or delayed).
Inversion window after first entry: if price enters but doesn’t invert within N bars, the box auto-removes once fully filled.
Inversion clean up: after a confirmed flip, keep for N bars (context) then delete (or 0 = immediate).
Result: charts auto-maintain themselves and never “lie” about relevance.
Clarity near current price
Nearest-per-side (keep N closest bullish & bearish gaps by distance to the midpoint) focuses attention where it matters without altering detection accuracy.
Lookback (bars) ensures reproducible behaviour across accounts with different data history.
Timeframe-aware defaults
Sensible auto-tuning for 15m / H1 / H4 (right-extension length, meter width, inversion windows, clean up bars) to reduce setup friction and improve consistency.
What it does (under the hood)
Detects FVGs using ICT-minimal (default) or a stricter rule.
Samples volume from a 10× lower timeframe to split participation into Bull % / Bear % (sum = 100%).
Manages each gap through a state machine:
ACTIVE → 50% SQ (midline) → MITIGATED (full) → INVERSED (SR flip after fill).
Auto-clean up keeps only relevant levels, per your rules.
Dashboard (top-right) displays counts by side and the active state tags.
How to use it
First run (show everything)
Use Strict FVG Filter: OFF
Enable Size Filter (percentile): OFF
Mitigation Source: high/low (wick-based) or close (stricter), as you prefer.
Remove on 50% SQ: ON, Delay: 0
Read the context
While ACTIVE, use the Bull%/Bear% meter to gauge demand/supply behind the impulse that created the gap.
Confluence with your HTF structure, sessions, VWAP, OB/FVG, RSI/MACD, etc.
Trade interactions
50% SQ: often the highest-quality interaction; if removal is ON, the box clears = “job done.”
Full mitigation then rejection through the other side → tag changes to INVERSED (acts like SR). Keep for N bars, then auto-remove.
Keep the chart tidy (optional)
If too busy, enable Size Filter or set Nearest per side to 2–4.
Use Lookback (bars) to make behaviour consistent across symbols and histories.
Inputs (key ones)
Use Strict FVG Filter: OFF(default)/ON
Enable Size Filter (percentile): OFF(default)/ON + threshold
Mitigation Source: high/low or close
Remove on 50% SQ + Delay
Inversion window after entry (bars)
Remove inversed after (bars)
Lookback (bars), Nearest per side (N)
Right Extension Bars, Max FVGs, Meter width (bars)
Colours: Bullish, Bearish, Inversed fill
Suggested defaults (per TF)
15m: Extension 50, Max 12, Inversion window 8, Clean up 8, Meter width 20
H1: Extension 25, Max 10, Inversion window 6, Clean up 6, Meter width 15
H4: Extension 15, Max 8, Inversion window 5, Clean up 5, Meter width 10
Notes & edge cases
If a wick hits 50% or the far edge but state doesn’t change, you’re likely on close mode—switch to high/low for wick-based behaviour.
If a gap disappears, it likely met a clean up condition (50% removal, inversion window, inversion clean up, nearest-per-side, lookback, or max-cap).
Meters are hidden after ACTIVE to avoid stale percentages.

FVG, Swing, Target, D/W/M High Low Detector Basic by Trader Riaz"FVG, Swing, Target, D/W/M High Low Detector Basic by Trader Riaz " is a powerful TradingView indicator designed to enhance your trading strategy by identifying key market structures and levels. This all-in-one tool detects Fair Value Gaps (FVGs), Swing Highs/Lows, and previous Day, Previous Week, and Previous Month Highs/Lows, helping traders make informed decisions with ease.
Key Features:
Bullish & Bearish FVG Detection: Highlights Fair Value Gaps with customizable colors, labels, and extension options.
Swing Highs & Lows: Automatically detects and marks Swing Highs and Lows with adjustable display settings and extensions.
Next Target Levels: Identifies potential price targets based on market direction (rising or falling).
Daily, Weekly, and Monthly High/Low Levels: Displays previous day, week, and month highs/lows with customizable colors.
Customizable Settings: Fully adjustable inputs for colors, number of levels to display, and extension periods.
Clean Visuals: Intuitive and non-intrusive design with dashed lines, labels, and tooltips for better chart readability.
This indicator is ideal for traders looking to identify key price levels, improve market structure analysis, and enhance their trading strategies.
Happy Trading,
Trader Riaz

FVG Premium [no1x]█ OVERVIEW
This indicator provides a comprehensive toolkit for identifying, visualizing, and tracking Fair Value Gaps (FVGs) across three distinct timeframes (current chart, a user-defined Medium Timeframe - MTF, and a user-defined High Timeframe - HTF). It is designed to offer traders enhanced insight into FVG dynamics through detailed state monitoring (formation, partial fill, full mitigation, midline touch), extensive visual customization for FVG representation, and a rich alert system for timely notifications on FVG-related events.
█ CONCEPTS
This indicator is built upon the core concept of Fair Value Gaps (FVGs) and their significance in price action analysis, offering a multi-layered approach to their detection and interpretation across different timeframes.
Fair Value Gaps (FVGs)
A Fair Value Gap (FVG), also known as an imbalance, represents a range in price delivery where one side of the market (buying or selling) was more aggressive, leaving an inefficiency or an "imbalance" in the price action. This concept is prominently featured within Smart Money Concepts (SMC) and Inner Circle Trader (ICT) methodologies, where such gaps are often interpreted as footprints left by "smart money" due to rapid, forceful price movements. These methodologies suggest that price may later revisit these FVG zones to rebalance a prior inefficiency or to seek liquidity before continuing its path. These gaps are typically identified by a three-bar pattern:
Bullish FVG : This is a three-candle formation where the second candle shows a strong upward move. The FVG is the space created between the high of the first candle (bottom of FVG) and the low of the third candle (top of FVG). This indicates a strong upward impulsive move.
Bearish FVG : This is a three-candle formation where the second candle shows a strong downward move. The FVG is the space created between the low of the first candle (top of FVG) and the high of the third candle (bottom of FVG). This indicates a strong downward impulsive move.
FVGs are often watched by traders as potential areas where price might return to "rebalance" or find support/resistance.
Multi-Timeframe (MTF) Analysis
The indicator extends FVG detection beyond the current chart's timeframe (Low Timeframe - LTF) to two higher user-defined timeframes: Medium Timeframe (MTF) and High Timeframe (HTF). This allows traders to:
Identify FVGs that might be significant on a broader market structure.
Observe how FVGs from different timeframes align or interact.
Gain a more comprehensive perspective on potential support and resistance zones.
FVG State and Lifecycle Management
The indicator actively tracks the lifecycle of each detected FVG:
Formation : The initial identification of an FVG.
Partial Fill (Entry) : When price enters but does not completely pass through the FVG. The indicator updates the "current" top/bottom of the FVG to reflect the filled portion.
Midline (Equilibrium) Touch : When price touches the 50% level of the FVG.
Full Mitigation : When price completely trades through the FVG, effectively "filling" or "rebalancing" the gap. The indicator records the mitigation time.
This state tracking is crucial for understanding how price interacts with these zones.
FVG Classification (Large FVG)
FVGs can be optionally classified as "Large FVGs" (LV) if their size (top to bottom range) exceeds a user-defined multiple of the Average True Range (ATR) for that FVG's timeframe. This helps distinguish FVGs that are significantly larger relative to recent volatility.
Visual Customization and Information Delivery
A key concept is providing extensive control over how FVGs are displayed. This control is achieved through a centralized set of visual parameters within the indicator, allowing users to configure numerous aspects (colors, line styles, visibility of boxes, midlines, mitigation lines, labels, etc.) for each timeframe. Additionally, an on-chart information panel summarizes the nearest unmitigated bullish and bearish FVG levels for each active timeframe, providing a quick glance at key price points.
█ FEATURES
This indicator offers a rich set of features designed to provide a highly customizable and comprehensive Fair Value Gap (FVG) analysis experience. Users can tailor the FVG detection, visual representation, and alerting mechanisms across three distinct timeframes: the current chart (Low Timeframe - LTF), a user-defined Medium Timeframe (MTF), and a user-defined High Timeframe (HTF).
Multi-Timeframe FVG Detection and Display
The core strength of this indicator lies in its ability to identify and display FVGs from not only the current chart's timeframe (LTF) but also from two higher, user-selectable timeframes (MTF and HTF).
Timeframe Selection: Users can specify the exact MTF (e.g., "60", "240") and HTF (e.g., "D", "W") through dedicated inputs in the "MTF (Medium Timeframe)" and "HTF (High Timeframe)" settings groups. The visibility of FVGs from these higher timeframes can be toggled independently using the "Show MTF FVGs" and "Show HTF FVGs" checkboxes.
Consistent Detection Logic: The FVG detection logic, based on the classic three-bar imbalance pattern detailed in the 'Concepts' section, is applied consistently across all selected timeframes (LTF, MTF, HTF)
Timeframe-Specific Visuals: Each timeframe's FVGs (LTF, MTF, HTF) can be customized with unique colors for bullish/bearish states and their mitigated counterparts. This allows for easy visual differentiation of FVGs originating from different market perspectives.
Comprehensive FVG Visualization Options
The indicator provides extensive control over how FVGs are visually represented on the chart for each timeframe (LTF, MTF, HTF).
FVG Boxes:
Visibility: Main FVG boxes can be shown or hidden per timeframe using the "Show FVG Boxes" (for LTF), "Show Boxes" (for MTF/HTF) inputs.
Color Customization: Colors for bullish, bearish, active, and mitigated FVG boxes (including Large FVGs, if classified) are fully customizable for each timeframe.
Box Extension & Length: FVG boxes can either be extended to the right indefinitely ("Extend Boxes Right") or set to a fixed length in bars ("Short Box Length" or "Box Length" equivalent inputs).
Box Labels: Optional labels can display the FVG's timeframe and fill percentage on the box. These labels are configurable for all timeframes (LTF, MTF, and HTF). Please note: If FVGs are positioned very close to each other on the chart, their respective labels may overlap. This can potentially lead to visual clutter, and it is a known behavior in the current version of the indicator.
Box Borders: Visibility, width, style (solid, dashed, dotted), and color of FVG box borders are customizable per timeframe.
Midlines (Equilibrium/EQ):
Visibility: The 50% level (midline or EQ) of FVGs can be shown or hidden for each timeframe.
Style Customization: Width, style, and color of the midline are customizable per timeframe. The indicator tracks if this midline has been touched by price.
Mitigation Lines:
Visibility: Mitigation lines (representing the FVG's opening level that needs to be breached for full mitigation) can be shown or hidden for each timeframe. If shown, these lines are always extended to the right.
Style Customization: Width, style, and color of the mitigation line are customizable per timeframe.
Mitigation Line Labels: Optional price labels can be displayed on mitigation lines, with a customizable horizontal bar offset for positioning. For optimal label placement, the following horizontal bar offsets are recommended: 4 for LTF, 8 for MTF, and 12 for HTF.
Persistence After Mitigation: Users can choose to keep mitigation lines visible even after an FVG is fully mitigated, with a distinct color for such lines. Importantly, this option is only effective if the general setting 'Hide Fully Mitigated FVGs' is disabled, as otherwise, the entire FVG and its lines will be removed upon mitigation.
FVG State Management and Behavior
The indicator tracks and visually responds to changes in FVG states.
Hide Fully Mitigated FVGs: This option, typically found in the indicator's general settings, allows users to automatically remove all visual elements of an FVG from the chart once price has fully mitigated it. This helps maintain chart clarity by focusing on active FVGs.
Partial Fill Visualization: When price enters an FVG, the indicator offers a dynamic visual representation: the portion of the FVG that has been filled is shown as a "mitigated box" (typically with a distinct color), while the original FVG box shrinks to clearly highlight the remaining, unfilled portion. This two-part display provides an immediate visual cue about how much of the FVG's imbalance has been addressed and what potential remains within the gap.
Visual Filtering by ATR Proximity: To help users focus on the most relevant price action, FVGs can be dynamically hidden if they are located further from the current price than a user-defined multiple of the Average True Range (ATR). This behavior is controlled by the "Filter Band Width (ATR Multiple)" input; setting this to zero disables the filter entirely, ensuring all detected FVGs remain visible regardless of their proximity to price.
Alternative Usage Example: Mitigation Lines as Key Support/Resistance Levels
For traders preferring a minimalist chart focused on key Fair Value Gap (FVG) levels, the indicator's visualization settings can be customized to display only FVG mitigation lines. This approach leverages these lines as potential support and resistance zones, reflecting areas where price might revisit to address imbalances.
To configure this view:
Disable FVG Boxes: Turn off "Show FVG Boxes" (for LTF) or "Show Boxes" (for MTF/HTF) for the desired timeframes.
Hide Midlines: Disable the visibility of the 50% FVG Midlines (Equilibrium/EQ).
Ensure Mitigation Lines are Visible: Keep "Mitigation Lines" enabled.
Retain All Mitigation Lines:
Disable the "Hide Fully Mitigated FVGs" option in the general settings.
Enable the feature to "keep mitigation lines visible even after an FVG is fully mitigated". This ensures lines from all FVGs (active or fully mitigated) remain on the chart, which is only effective if "Hide Fully Mitigated FVGs" is disabled.
This setup offers:
A Decluttered Chart: Focuses solely on the FVG opening levels.
Precise S/R Zones: Treats mitigation lines as specific points for potential price reactions.
Historical Level Analysis: Includes lines from past, fully mitigated FVGs for a comprehensive view of significant price levels.
For enhanced usability with this focused view, consider these optional additions:
The on-chart Information Panel can be activated to display a quick summary of the nearest unmitigated FVG levels.
Mitigation Line Labels can also be activated for clear price level identification. A customizable horizontal bar offset is available for positioning these labels; for example, offsets of 4 for LTF, 8 for MTF, and 12 for HTF can be effective.
FVG Classification (Large FVG)
This feature allows for distinguishing FVGs based on their size relative to market volatility.
Enable Classification: Users can enable "Classify FVG (Large FVG)" to identify FVGs that are significantly larger than average.
ATR-Based Threshold: An FVG is classified as "Large" if its height (price range) is greater than or equal to the Average True Range (ATR) of its timeframe multiplied by a user-defined "Large FVG Threshold (ATR Multiple)". The ATR period for this calculation is also configurable.
Dedicated Colors: Large FVGs (both bullish/bearish and active/mitigated) can be assigned unique colors, making them easily distinguishable on the chart.
Panel Icon: Large FVGs are marked with a special icon in the Info Panel.
Information Panel
An on-chart panel provides a quick summary of the nearest unmitigated FVG levels.
Visibility and Position: The panel can be shown/hidden and positioned in any of the nine standard locations on the chart (e.g., Top Right, Middle Center).
Content: It displays the price levels of the nearest unmitigated bullish and bearish FVGs for LTF, MTF (if active), and HTF (if active). It also indicates if these nearest FVGs are Large FVGs (if classification is enabled) using a selectable icon.
Styling: Text size, border color, header background/text colors, default text color, and "N/A" cell background color are customizable.
Highlighting: Background and text colors for the cells displaying the overall nearest bullish and bearish FVG levels (across all active timeframes) can be customized to draw attention to the most proximate FVG.
Comprehensive Alert System
The indicator offers a granular alert system for various FVG-related events, configurable for each timeframe (LTF, MTF, HTF) independently. Users can enable alerts for:
New FVG Formation: Separate alerts for new bullish and new bearish FVG formations.
FVG Entry/Partial Fill: Separate alerts for price entering a bullish FVG or a bearish FVG.
FVG Full Mitigation: Separate alerts for full mitigation of bullish and bearish FVGs.
FVG Midline (EQ) Touch: Separate alerts for price touching the midline of a bullish or bearish FVG.
Alert messages are detailed, providing information such as the timeframe, FVG type (bull/bear, Large FVG), relevant price levels, and timestamps.
█ NOTES
This section provides additional information regarding the indicator's usage, performance considerations, and potential interactions with the TradingView platform. Understanding these points can help users optimize their experience and troubleshoot effectively.
Performance and Resource Management
Maximum FVGs to Track : The "Max FVGs to Track" input (defaulting to 25) limits the number of FVG objects processed for each category (e.g., LTF Bullish, MTF Bearish). Increasing this value significantly can impact performance due to more objects being iterated over and potentially drawn, especially when multiple timeframes are active.
Drawing Object Limits : To manage performance, this script sets its own internal limits on the number of drawing objects it displays. While it allows for up to approximately 500 lines (max_lines_count=500) and 500 labels (max_labels_count=500), the number of FVG boxes is deliberately restricted to a maximum of 150 (max_boxes_count=150). This specific limit for boxes is a key performance consideration: displaying too many boxes can significantly slow down the indicator, and a very high number is often not essential for analysis. Enabling all visual elements for many FVGs across all three timeframes can cause the indicator to reach these internal limits, especially the stricter box limit
Optimization Strategies : To help you manage performance, reduce visual clutter, and avoid exceeding drawing limits when using this indicator, I recommend the following strategies:
Maintain or Lower FVG Tracking Count: The "Max FVGs to Track" input defaults to 25. I find this value generally sufficient for effective analysis and balanced performance. You can keep this default or consider reducing it further if you experience performance issues or prefer a less dense FVG display.
Utilize Proximity Filtering: I suggest activating the "Filter Band Width (ATR Multiple)" option (found under "General Settings") to display only those FVGs closer to the current price. From my experience, a value of 5 for the ATR multiple often provides a good starting point for balanced performance, but you should feel free to adjust this based on market volatility and your specific trading needs.
Hide Fully Mitigated FVGs: I strongly recommend enabling the "Hide Fully Mitigated FVGs" option. This setting automatically removes all visual elements of an FVG from the chart once it has been fully mitigated by price. Doing so significantly reduces the number of active drawing objects, lessens computational load, and helps maintain chart clarity by focusing only on active, relevant FVGs.
Disable FVG Display for Unused Timeframes: If you are not actively monitoring certain higher timeframes (MTF or HTF) for FVG analysis, I advise disabling their display by unchecking "Show MTF FVGs" or "Show HTF FVGs" respectively. This can provide a significant performance boost.
Simplify Visual Elements: For active FVGs, consider hiding less critical visual elements if they are not essential for your specific analysis. This could include box labels, borders, or even entire FVG boxes if, for example, only the mitigation lines are of interest for a particular timeframe.
Settings Changes and Platform Limits : This indicator is comprehensive and involves numerous calculations and drawings. When multiple settings are changed rapidly in quick succession, it is possible, on occasion, for TradingView to issue a "Runtime error: modify_study_limit_exceeding" or similar. This can cause the indicator to temporarily stop updating or display errors.
Recommended Approach : When adjusting settings, it is advisable to wait a brief moment (a few seconds) after each significant change. This allows the indicator to reprocess and update on the chart before another change is made
Error Recovery : Should such a runtime error occur, making a minor, different adjustment in the settings (e.g., toggling a checkbox off and then on again) and waiting briefly will typically allow the indicator to recover and resume correct operation. This behavior is related to platform limitations when handling complex scripts with many inputs and drawing objects.
Multi-Timeframe (MTF/HTF) Data and Behavior
HTF FVG Confirmation is Essential: : For an FVG from a higher timeframe (MTF or HTF) to be identified and displayed on your current chart (LTF), the three-bar pattern forming the FVG on that higher timeframe must consist of fully closed bars. The indicator does not draw speculative FVGs based on incomplete/forming bars from higher timeframes.
Data Retrieval and LTF Processing: The indicator may use techniques like lookahead = barmerge.lookahead_on for timely data retrieval from higher timeframes. However, the actual detection of an FVG occurs after all its constituent bars on the HTF have closed.
Appearance Timing on LTF (1 LTF Candle Delay): As a natural consequence of this, an FVG that is confirmed on an HTF (i.e., its third bar closes) will typically become visible on your LTF chart one LTF bar after its confirmation on the HTF.
Example: Assume an FVG forms on a 30-minute chart at 15:30 (i.e., with the close of the 30-minute bar that covers the 15:00-15:30 period). If you are monitoring this FVG on a 15-minute chart, the indicator will detect this newly formed 30-minute FVG while processing the data for the 15-minute bar that starts at 15:30 and closes at 15:45. Therefore, the 30-minute FVG will become visible on your 15-minute chart at the earliest by 15:45 (i.e., with the close of that relevant 15-minute LTF candle). This means the HTF FVG is reflected on the LTF chart with a delay equivalent to one LTF candle.
FVG Detection and Display Logic
Fair Value Gaps (FVGs) on the current chart timeframe (LTF) are detected based on barstate.isconfirmed. This means the three-bar pattern must be complete with closed bars before an FVG is identified. This confirmation method prevents FVGs from being prematurely identified on the forming bar.
Alerts
Alert Setup : To receive alerts from this indicator, you must first ensure you have enabled the specific alert conditions you are interested in within the indicator's own settings (see 'Comprehensive Alert System' under the 'FEATURES' section). Once configured, open TradingView's 'Create Alert' dialog. In the 'Condition' tab, select this indicator's name, and crucially, choose the 'Any alert() function call' option from the dropdown list. This setup allows the indicator to trigger alerts based on the precise event conditions you have activated in its settings
Alert Frequency : Alerts are designed to trigger once per bar close (alert.freq_once_per_bar_close) for the specific event.
User Interface (UI) Tips
Settings Group Icons: In the indicator settings menu, timeframe-specific groups are marked with star icons for easier navigation: 🌟 for LTF (Current Chart Timeframe), 🌟🌟 for MTF (Medium Timeframe), and 🌟🌟🌟 for HTF (High Timeframe).
Dependent Inputs: Some input settings are dependent on others being enabled. These dependencies are visually indicated in the settings menu using symbols like "↳" (dependent setting on the next line), "⟷" (mutually exclusive inline options), or "➜" (directly dependent inline option).
Settings Layout Overview: The indicator settings are organized into logical groups for ease of use. Key global display controls – such as toggles for MTF FVGs, HTF FVGs (along with their respective timeframe selectors), and the Information Panel – are conveniently located at the very top within the '⚙️ General Settings' group. This placement allows for quick access to frequently adjusted settings. Other sections provide detailed customization options for each timeframe (LTF, MTF, HTF), specific FVG components, and alert configurations.
█ FOR Pine Script® CODERS
This section provides a high-level overview of the FVG Premium indicator's internal architecture, data flow, and the interaction between its various library components. It is intended for Pine Script™ programmers who wish to understand the indicator's design, potentially extend its functionality, or learn from its structure.
System Architecture and Modular Design
The indicator is architected moduarly, leveraging several custom libraries to separate concerns and enhance code organization and reusability. Each library has a distinct responsibility:
FvgTypes: Serves as the foundational data definition layer. It defines core User-Defined Types (UDTs) like fvgObject (for storing all attributes of an FVG) and drawSettings (for visual configurations), along with enumerations like tfType.
CommonUtils: Provides utility functions for common tasks like mapping user string inputs (e.g., "Dashed" for line style) to their corresponding Pine Script™ constants (e.g., line.style_dashed) and formatting timeframe strings for display.
FvgCalculations: Contains the core logic for FVG detection (both LTF and MTF/HTF via requestMultiTFBarData), FVG classification (Large FVGs based on ATR), and checking FVG interactions with price (mitigation, partial fill).
FvgObject: Implements an object-oriented approach by attaching methods to the fvgObject UDT. These methods manage the entire visual lifecycle of an FVG on the chart, including drawing, updating based on state changes (e.g., mitigation), and deleting drawing objects. It's responsible for applying the visual configurations defined in drawSettings.
FvgPanel: Manages the creation and dynamic updates of the on-chart information panel, which displays key FVG levels.
The main indicator script acts as the orchestrator, initializing these libraries, managing user inputs, processing data flow between libraries, and handling the main event loop (bar updates) for FVG state management and alerts.
Core Data Flow and FVG Lifecycle Management
The general data flow and FVG lifecycle can be summarized as follows:
Input Processing: User inputs from the "Settings" dialog are read by the main indicator script. Visual style inputs (colors, line styles, etc.) are consolidated into a types.drawSettings object (defined in FvgTypes). Other inputs (timeframes, filter settings, alert toggles) control the behavior of different modules. CommonUtils assists in mapping some string inputs to Pine constants.
FVG Detection:
For the current chart timeframe (LTF), FvgCalculations.detectFvg() identifies potential FVGs based on bar patterns.
For MTF/HTF, the main indicator script calls FvgCalculations.requestMultiTFBarData() to fetch necessary bar data from higher timeframes, then FvgCalculations.detectMultiTFFvg() identifies FVGs.
Newly detected FVGs are instantiated as types.fvgObject and stored in arrays within the main script. These objects also undergo classification (e.g., Large FVG) by FvgCalculations.
State Update & Interaction: On each bar, the main indicator script iterates through active FVG objects to manage their state based on price interaction:
Initially, the main script calls FvgCalculations.fvgInteractionCheck() to efficiently determine if the current bar's price might be interacting with a given FVG.
If a potential interaction is flagged, the main script then invokes methods directly on the fvgObject instance (e.g., updateMitigation(), updatePartialFill(), checkMidlineTouch(), which are part of FvgObject).
These fvgObject methods are responsible for the detailed condition checking and the actual modification of the FVG's state. For instance, the updateMitigation() and updatePartialFill() methods internally utilize specific helper functions from FvgCalculations (like checkMitigation() and checkPartialMitigation()) to confirm the precise nature of the interaction before updating the fvgObject’s state fields (such as isMitigated, currentTop, currentBottom, or isMidlineTouched).
Visual Rendering:
The FvgObject.updateDrawings() method is called for each fvgObject. This method is central to drawing management; it creates, updates, or deletes chart drawings (boxes, lines, labels) based on the FVG's current state, its prev_* (previous bar state) fields for optimization, and the visual settings passed via the drawSettings object.
Information Panel Update: The main indicator script determines the nearest FVG levels, populates a panelData object (defined in FvgPanelLib), and calls FvgPanel.updatePanel() to refresh the on-chart display.
Alert Generation: Based on the updated FVG states and user-enabled alert settings, the main indicator script constructs and triggers alerts using Pine Script's alert() function."
Key Design Considerations
UDT-Centric Design: The fvgObject UDT is pivotal, acting as a stateful container for all information related to a single FVG. Most operations revolve around creating, updating, or querying these objects.
State Management: To optimize drawing updates and manage FVG lifecycles, fvgObject instances store their previous bar's state (e.g., prevIsVisible, prevCurrentTop). The FvgObject.updateDrawings() method uses this to determine if a redraw is necessary, minimizing redundant drawing calls.
Settings Object: A drawSettings object is populated once (or when inputs change) and passed to drawing functions. This avoids repeatedly reading numerous input() values on every bar or within loops, improving performance.
Dynamic Arrays for FVG Storage: Arrays are used to store collections of fvgObject instances, allowing for dynamic management (adding new FVGs, iterating for updates).

FVG Detector LibraryLibrary "FVG Detector Library"
🔵 Introduction
To save time and improve accuracy in your scripts for identifying Fair Value Gaps (FVGs), you can utilize this library. Apart from detecting and plotting FVGs, one of the most significant advantages of this script is the ability to filter FVGs, which you'll learn more about below. Additionally, the plotting of each FVG continues until either a new FVG occurs or the current FVG is mitigated.
🔵 Definition
Fair Value Gap (FVG) refers to a situation where three consecutive candlesticks do not overlap. Based on this definition, the minimum conditions for detecting a fair gap in the ascending scenario are that the minimum price of the last candlestick should be greater than the maximum price of the third candlestick, and in the descending scenario, the maximum price of the last candlestick should be smaller than the minimum price of the third candlestick.
If the filter is turned off, all FVGs that meet at least the minimum conditions are identified. This mode is simplistic and results in a high number of identified FVGs.
If the filter is turned on, you have four options to filter FVGs :
1. Very Aggressive : In addition to the initial condition, another condition is added. For ascending FVGs, the maximum price of the last candlestick should be greater than the maximum price of the middle candlestick. Similarly, for descending FVGs, the minimum price of the last candlestick should be smaller than the minimum price of the middle candlestick. In this mode, a very small number of FVGs are eliminated.
2. Aggressive : In addition to the conditions of the Very Aggressive mode, in this mode, the size of the middle candlestick should not be small. This mode eliminates more FVGs compared to the Very Aggressive mode.
3. Defensive : In addition to the conditions of the Very Aggressive mode, in this mode, the size of the middle candlestick should be relatively large, and most of it should consist of the body. Also, for identifying ascending FVGs, the second and third candlesticks must be positive, and for identifying descending FVGs, the second and third candlesticks must be negative. In this mode, a significant number of FVGs are eliminated, and the remaining FVGs have a decent quality.
4. Very Defensive : In addition to the conditions of the Defensive mode, the first and third candlesticks should not resemble very small-bodied doji candlesticks. In this mode, the majority of FVGs are filtered out, and the remaining ones are of higher quality.
By default, we recommend using the Defensive mode.
🔵 How to Use
🟣 Parameters
To utilize this library, you need to provide four input parameters to the function.
"FVGFilter" determines whether you wish to apply a filter on FVGs or not. The possible inputs for this parameter are "On" and "Off", provided as strings.
"FVGFilterType" determines the type of filter to be applied to the found FVGs. These filters include four modes: "Very Defensive", "Defensive", "Aggressive", and "Very Aggressive", respectively exhibiting decreasing sensitivity and indicating a higher number of Fair Value Gaps (FVG).
The parameter "ShowDeFVG" is a Boolean value defined as either "true" or "false". If this value is "true", FVGs are shown during the Bullish Trend; however, if it is "false", they are not displayed.
The parameter "ShowSuFVG" is a Boolean value defined as either "true" or "false". If this value is "true", FVGs are displayed during the Bearish Trend; however, if it is "false", they are not displayed.
FVGDetector(FVGFilter, FVGFilterType, ShowDeFVG, ShowSuFVG)
Parameters:
FVGFilter (string)
FVGFilterType (string)
ShowDeFVG (bool)
ShowSuFVG (bool)
🟣 Import Library
You can use the "FVG Detector" library in your script using the following expression:
import TFlab/FVGDetectorLibrary/1 as FVG
🟣 Input Parameters
The descriptions related to the input parameters were provided in the "Parameter" section. In this section, for your convenience, the code related to the inputs is also included, and you can copy and paste it into your script.
PFVGFilter = input.string('On', 'FVG Filter', )
PFVGFilterType = input.string('Defensive', 'FVG Filter Type', )
PShowDeFVG = input.bool(true, ' Show Demand FVG')
PShowSuFVG = input.bool(true, ' Show Supply FVG')
🟣 Call Function
You can copy the following code into your script to call the FVG function. This code is based on the naming conventions provided in the "Input Parameter" section, so if you want to use exactly this code, you should have similar parameter names or have copied the "Input Parameter" values.
FVG.FVGDetector(PFVGFilter, PFVGFilterType, PShowDeFVG, PShowSuFVG)

FVG Price & Volume Graph [LuxAlgo]The FVG Price & Volume Graph tool plot recently detected fair value gaps relative to the volume traded within their area during their formation. This allows us to effectively visualize significant fair value gaps caused by high liquidity.
The indicator also returns levels from the fair value gaps areas average with the highest associated volume.
Do note that the indicator can consider the chart's visible range when being computed, which will recalculate the indicator when the chart's visible range changes.
🔶 USAGE
Fair Value Gaps (FVG) are core price action concepts occurring when the disparity between supply and demand is significant. Price has a tendency to come back to those areas and mitigating them, that is filling them.
The provided tools allow for effective visualization of both FVG's area's height as well as the volume originating from their creation, which is defined by the total traded volume located within the FVG during its creation. FVG's with more associated volume are displayed to the rightmost of the chart.
Users can determine the amount of most recent FVG's to display from the "Display Amount" setting. Disabling the "Consider Mitigation" setting will return mitigated FVGs in the plot, which can be useful to know where most FVGs were located.
We can use the area average of the FVGs with the most associated volume as potential support/resistance levels. Users can extend more FVG's averages by increasing the "Highest Volume Averages" setting.
🔹 Visualizing Volume/Price Relationships of FVG's
A linear regression is fit between FVG's areas average and their associated volume, with this linear regression helping us see where FVG's with specific volume might be located in the future based on existing FVG's.
Note that FVG's do not tend to exhibit linear relationships with their associated volume, the provided linear regression can give a general sense of tendency, but nothing necessarily accurate.
🔶 DETAILS
🔹 Intrabar Data TF
Given a formation of three candles causing an FVG, the volume traded within that FVG area is obtained by looking at the lower timeframe intrabar candles located within the intermediary candle of the formation. The volume of the intrabar candles located within the FVG areas is added up to obtain the associated volume of the FVG.
Using a lower "Intrabar Data TF" allows obtaining more precise volume results, at the cost of computation time and data availability (if there is a high difference between the "Intrabar Data TF" and the chart TF then less FVG can have their associated volume calculated due to Tradingview limitations).
🔹 Display
Users have access to multiple graphical settings affecting how the indicator is displayed.
The "Graph Resolution" setting determines the length of the X axis, with higher values returning more precise results on the location of FVGs over the X axis. Users can also control the number of labels displayed on the X-axis using the numerical input to the right of "Show X-Axis Labels".
Additionally, users can color FVG areas using a gradient relative to the size of the area, or the volume associated with the FVG.
🔶 SETTINGS
Display Amount: Amount of most recent FVGs to display.
Highest Volume Averages: Amount of FVG averages levels with the highest volume to display and extend.
Consider Mitigation: Only display unmitigated FVGs.
Filter FVGs Outside Visible Range: Only display FVGs areas that are located within the user chart visible range.
Intrabar Data TF: Timeframe used to obtain intrabar data. Should be lower than the user chart timeframe.

FVG & IFVG ICT [TradingFinder] Inversion Fair Value Gap Signal🔵 Introduction
🟣 Fair Value Gap (FVG)
To spot a Fair Value Gap (FVG) on a chart, you need to perform a detailed candle-by-candle analysis.
Here’s the process :
Focus on Candles with Large Bodies : Identify a candle with a substantial body and examine it alongside the preceding candle.
Check Surrounding Candles : The candles immediately before and after the central candle should have long shadows.
Ensure No Overlap : The bodies of the candles before and after the central candle should not overlap with the body of the central candle.
Determine the FVG Range : The gap between the shadows of the first and third candles forms the FVG range.
🟣 ICT Inversion Fair Value Gap (IFVG)
An ICT Inversion Fair Value Gap, also known as a reverse FVG, is a failed fair value gap where the price does not respect the gap. An IFVG forms when a fair value gap fails to hold the price and the price moves beyond it, breaking the fair value gap.
This marks the initial shift in price momentum. Typically, when the price moves in one direction, it respects the fair value gaps and continues its trend.
However, if a fair value gap is violated, it acts as an inversion fair value gap, indicating the first change in price momentum, potentially leading to a short-term reversal or a subsequent change in direction.
🟣 Bullish Inversion Fair Value Gap (Bullish IFVG)
🟣 Bearish Inversion Fair Value Gap (Bearish IFVG)
🔵 How to Use
🟣 Identify an Inversion Fair Value Gap
To identify an IFVG, you first need to recognize a fair value gap. Just as fair value gaps come in two types, inversion fair value gaps also fall into two categories:
🟣 Bullish Inversion Fair Value Gap
A bullish IFVG is essentially a bearish fair value gap that is invalidated by the price closing above it.
Here’s how to identify it :
Identify a bearish fair value gap.
When the price closes above this bearish fair value gap, it transforms into a bullish inversion fair value gap.
This gap acts as support for the price and drives it upwards, indicating a reduction in sellers' strength and an initial shift in momentum towards buyers.
🟣 Bearish Inversion Fair Value Gap
A bearish IFVG is primarily a bullish fair value gap that fails to hold the price, with the price closing below it.
Here’s how to identify it :
Identify a bullish fair value gap.
When the price closes below this gap, it becomes a bearish inversion fair value gap.
This gap acts as resistance for the price, pushing it downwards. A bearish inversion fair value gap signifies a decrease in buyers' momentum and an increase in sellers' strength.
🔵 Setting
🟣 Global Setting
Show All FVG : If it is turned off, only the last FVG will be displayed.
S how All Inversion FVG : If it is turned off, only the last FVG will be displayed.
FVG and IFVG Validity Period (Bar) : You can specify the maximum time the FVG and the IFVG remains valid based on the number of candles from the origin.
Switching Colors Theme Mode : Three modes "Off", "Light" and "Dark" are included in this parameter. "Light" mode is for color adjustment for use in "Light Mode".
"Dark" mode is for color adjustment for use in "Dark Mode" and "Off" mode turns off the color adjustment function and the input color to the function is the same as the output color.
🟣 Logic Setting
FVG Filter
When utilizing FVG filtering, the number of identified FVG areas undergoes refinement based on a specified algorithm. This process helps to focus on higher quality signals and eliminate noise.
Here are the types of FVG filters available :
Very Aggressive Filter : Introduces an additional condition to the initial criteria. For an upward FVG, the highest price of the last candle must exceed the highest price of the middle candle. Similarly, for a downward FVG, the lowest price of the last candle should be lower than the lowest price of the middle candle. This mode minimally filters out FVGs.
Aggressive Filter : Builds upon the Very Aggressive mode by considering the size of the middle candle. It ensures the middle candle is not too small, thereby eliminating more FVGs compared to the Very Aggressive mode.
Defensive Filter : In addition to the conditions of the Very Aggressive mode, the Defensive mode incorporates criteria regarding the size and structure of the middle candle. It requires the middle candle to have a substantial body, with specific polarity conditions for the second and third candles relative to the first candle's direction. This mode filters out a significant number of FVGs, focusing on higher-quality signals.
Very Defensive Filter : Further refines filtering by adding conditions that the first and third candles should not be small-bodied doji candles. This stringent mode eliminates the majority of FVGs, retaining only the highest quality signals.
Mitigation Level FVG and IFVG : Its inputs are one of "Proximal", "Distal" or "50 % OB" modes, which you can enter according to your needs. The "50 % OB" line is the middle line between distal and proximal.
🟣 Display Setting
Show Bullish FVG : Enables the display of demand-related boxes, which can be toggled on or off.
Show Bearish FVG : Enables the display of supply-related boxes along the path, which can also be toggled on or off.
Show Bullish IFVG : Enables the display of demand-related boxes, which can be toggled on or off.
Show Bearish IFVG : Enables the display of supply-related boxes along the path, which can also be toggled on or off.
🟣 Alert Setting
Alert FVG Mitigation : If you want to receive the alert about FVG's mitigation after setting the alerts, leave this tick on. Otherwise, turn it off.
Alert Inversion FVG Mitigation : If you want to receive the alert about Inversion FVG's mitigation after setting the alerts, leave this tick on. Otherwise, turn it off.
Message Frequency : This parameter, represented as a string, determines the frequency of announcements. Options include: 'All' (triggers the alert every time the function is called), 'Once Per Bar' (triggers the alert only on the first call within the bar), and 'Once Per Bar Close' (activates the alert only during the final script execution of the real-time bar upon closure). The default setting is 'Once per Bar'.
Show Alert time by Time Zone : The date, hour, and minute displayed in alert messages can be configured to reflect any chosen time zone. For instance, if you prefer London time, you should input 'UTC+1'. By default, this input is configured to the 'UTC' time zone.
Display More Info : The 'Display More Info' option provides details regarding the price range of the order blocks (Zone Price), along with the date, hour, and minute. If you prefer not to include this information in the alert message, you should set it to 'Off'.

FVG Channel [LuxAlgo]The FVG Channel indicator displays a channel constructed from the averages of unmitigated historical fair value gaps (FVG), allowing to identify trends and potential reversals in the market.
Users can control the amount of FVGs to consider for the calculation of the channels, as well as their degree of smoothness through user settings.
🔶 USAGE
The FVG Channel is constructed by averaging together recent unmitigated Bullish FVGs (contributing to the creation of the upper bands), and Bearish unmitigated FVGs (contributing to the creation of the lower bands) within a lookback determined by the user. A higher lookback will return longer-term indications from the indicator.
The channel includes 5 bands, with one upper and one lower outer extremities, as well as an inner series of values determined using the Fibonacci ratios (respectively 0.786, 0.5, 0.236) from the channel's outer extremities.
An uptrend can be identified by price holding above the inner upper band (obtained from the 0.786 ratio), this band can also provide occasional support when the price retraces to it while in an uptrend.
Breaking below the inner upper band with an unwillingness to reach above again is a clear sign of hesitation in the market and can be indicative of an upcoming consolidation or reversal.
This can directly be applied to downtrends as well, below are examples displaying both scenarios.
Uptrend Example:
Downtrend Example:
🔹 Breakout Levels
When the price mitigates all FVGs in a single direction except for 1, the indicator will display a "Breakout Level". This is the level that price will need to cross in order for all FVGs in that direction to be mitigated, because of this they can also be aptly called "Last Stand Levels".
These levels can be considered as potential support and resistance levels, however, should always be monitored for breakouts since a substantial push above or below these points would indicate strong momentum.
🔹 Signals
The indicator includes Bullish and Bearish Signals, these signals fire when all FVGs for a single direction have been mitigated and an engulfing candle occurs in the opposite direction. These are reversal signals and should be used alongside other indicators to appropriately manage risk.
Note: When all FVGs in a single direction have been mitigated, the candles will change colors accordingly.
🔶 DETAILS
The script uses a typical identification method for FVGs. Once identified, the script collects and stores the mitigation levels of the respective bullish and bearish FVGs:
For Bullish FVGs this is the bottom of the FVG.
For Bearish FVGs this is the top of the FVG.
The data is managed to only consider a specific amount of FVG mitigation levels, determined by the set "Unmitigated FVG Lookback". If an FVG is mitigated, it frees up a spot in the memory for a new FVG, however, if the memory is full, the oldest will be deleted.
The averages displayed (Channel Upper and Lower) are created from 2 calculation steps, the first step involves taking the raw average of the FVG mitigation levels, and the second step applies a simple moving average (SMA) smoothing of the precedent obtained averages.
Note: To view the mitigation levels average obtained in the first step, the "Smoothing Length" can be set to 1.
🔶 SETTINGS
Unmitigated FVG Lookback: Sets the maximum number of Unmitigated FVG mitigation levels that the script will use to calculate the channel.
Smoothing Length: Sets the smoothing length for the channel to reduce noise from the raw data.

FVG Detector [TradingFinder] Fair Value Gap-Imbalance-Mitigated🔵 Introduction
When the market makes a strong move in the form of a "Marubozu" or "Spike" candlestick and consecutive candles move without a retracement, the maximum place where a "FVG" or "Fair Value Gap" is created.
🔵 Definition
To describe this precisely, whenever a move occurs where the current candle does not cover the body of the previous and subsequent candles, a fair value gap is created.
Important : The significant point is that, because there is no equilibrium between buyers and sellers in these conditions, and market power is in the hands of buyers or sellers, the market is likely to move towards these areas.
An example of "FVG" in a price increase where we expect buying on the return to it.
An example of "FVG" in a downward trend where the market will move towards it in a downward direction.
🔵 How to Use
🟣 Bearish FVG
In a downward trend, "orange boxes" are drawn, which are the same and can act as "support" zones along the downward path, and we expect the price to continue its downward trend on return.
🟣 Bullish FVG
In an upward trend, "green boxes" are drawn, which are . They act exactly like support in the upward path, and we expect the price to continue its upward trend on return.
🟣 Auxiliary Definitions
Imbalance : As mentioned above, market power is in the hands of one of the two sides, buyers or sellers, and a non-equilibrium zone is created. It may be completed in whole or in part in subsequent price movements.
Mitigated : If the price returns to the "FVG" area and fills it, we call it "Mitigated," and most "pending" or "profit and loss limits" positions are executed. We will not have a specific reaction on the return of the price.
🔵 Settings
Very Aggressive : In addition to the initial condition, another condition is added. For an upward FVG, the maximum price of the last candle should be larger than the middle candle's maximum price. Similarly, for a downward FVG, the minimum price of the last candle should be smaller than the middle candle's minimum price. In this mode, a very small number of FVGs are eliminated.
Aggressive : In addition to the conditions of the Very Aggressive mode, in this mode, the size of the middle candle should not be small. In this mode, a larger number of FVGs are eliminated.
Defensive : In addition to the conditions of the Very Aggressive mode, in this mode, the size of the middle candle should be relatively large, and the majority of it should be made up of the body. Additionally, to identify upward FVGs, the second and third candles must be positive, and to identify downward FVGs, the second and third candles must be negative. In this mode, a large number of FVGs are eliminated, leaving only those with suitable quality.
Very Defensive : In addition to the conditions of the Defensive mode, the first and third candles should not be very small-bodied doji candles. In this mode, the majority of FVGs are filtered out, leaving only the highest quality ones.
🔵 Features
Show Demand FVG : Displays demand-related boxes, which can be "off" and "on."
Show Supply FVG : Displays supply-related boxes along the path, and can be turned "off" and "on."
🔵 Indicator Advantages
In this indicator, I have implemented 4 types of "filters" that allow you to select one based on the trading symbol, timeframe, etc. From "Very Aggressive" to "Very Defensive" mode, it is possible to select.
In most indicators, all FVGs are displayed, and the chart becomes full of lines. But this unique feature allows the trader to manage the drawing of boxes.

FVG Volume Profile [ChartPrime]⯁ OVERVIEW
FVG Volume Profile is a smart volume analysis tool that identifies Fair Value Gaps (FVGs) and overlays a volume profile inside each gap using data from lower timeframes. The indicator automatically selects the best time resolution or allows for manual control, giving traders deeper insight into the volume structure within each imbalance. POC levels and total volumes gives a full microstructure view inside every FVG.
⯁ KEY FEATURES
Fair Value Gap Detection (Bullish & Bearish)
Detects price gaps where inefficiency exists using a 3-bar structure.
-Bullish Gaps: Low > High with confirming middle bar.
-Bearish Gaps: High < Low with confirming middle bar.
Only significant gaps (filtered by standard deviation) are plotted to avoid noise.
Multi-Timeframe Volume Profiling
Pulls granular candle and volume data from a lower timeframe —
In Auto Mode, uses a resolution ~10x lower than the current chart.
In Manual Mode, lets the user select a custom timeframe.
This ensures accurate intra-gap volume distribution.
Dynamic Volume Binning
Each FVG is divided into vertical volume bins based on the Resolution input.
Each bin displays relative volume intensity as a horizontal box, scaled by percentage of the max bin volume.
Point of Control (PoC) Line & Label
The bin with the maximum volume inside each FVG is marked with:
A horizontal line (PoC) extending from the left to right side.
A label showing the absolute volume of that bin.
Color-coded to match bullish or bearish FVGs.
Total Volume Label Inside FVG
Each FVG displays the total volume sum from its profile:
For bullish FVGs , shown in the bottom-right corner.
For bearish FVGs , shown in the top-right corner.
Auto-Removal of Invalid Gaps
If price fully closes the gap (crosses its bounds), the FVG, profile, and PoC are deleted automatically.
This keeps the chart clean and focused only on active zones.
Toggleable Volume Profile Display
User can show or hide the volume profiles within FVGs using the "Display" toggle under the "FVG Volume Profile" group.
Only the PoC and FVG boxes remain visible if toggled off.
Volume Resolution Customization
Control the number of bins used for each FVG profile.
Higher resolution = more bins and finer volume analysis. (default 15)
Auto Timeframe Validation Warning
If the selected lower timeframe isn’t actually lower than the chart's, the script shows a visible warning label prompting adjustment.
Helps prevent calculation errors.
⯁ USAGE
Use this tool to identify active imbalance zones (FVGs) with embedded volume context.
Look for PoC positioning inside gaps — near top may indicate absorption or reversal zones.
Combine with price action at the PoC level for precision entries.
Hide volume profile for a cleaner view while retaining key POC and FVG boxes.
Use resolution controls to zoom into fine-grained profiles inside large gaps.
Consider Auto mode for seamless multi-timeframe analysis, or switch to Manual for full control.
⯁ CONCLUSION
FVG Volume Profile transforms raw imbalance detection into actionable insight by embedding lower-timeframe volume structure inside each Fair Value Gap. With PoC highlights, total volume labels, and customizable bin resolution, this indicator is essential for traders who want to understand not just where the gap is — but what volume did inside it .

FVG Breakaway/3rd Candle (Arjo) [MK]Simple script to identify FVGs (Fair Value Gaps) on the current chart timeframe. The script differs from other FVG indicators on the Tradingview platform by using Arjos 3rd candle rule to identify which gaps are 'Breakway Gaps' and which Gaps are likely to be returned to.
NOTE: As with all 'trading rules' this theory is not 100% accurate.
default settings:
Breakaway Gaps = YELLOW
Gaps that price may return to = GREEN
Mitigated Gaps = 100% TRANSPARENT
What is a FVG:
A FVG is a price area defined by a 3 candle pattern. For a bullish FVG, the low of the 3rd candle must be higher than the high of the 1st candle. This then leaves an area that is drawn as in the example below:
A bearish FVG is defined by the high of the 3rd candle being lower than the low of the 1st candle, as shown in the example below:
FVGs can act like magnets where price will either retrace to or reach for, therefore they can be used as entry points and also for take profit target levels.
If for example, a trader would like to use an FVG for an entry, it would be useful to know which FVGs are more likely for price to re-enter and which FVG will be left un-touched. FVGs that are likely to be left un-touched by price are called 'Breakaway Gaps'.
How do we define a 'Breakaway Gap':
First we identify FVGs using the rules stated above, then we look to see where the 3rd candle closed in relation to the 2nd candle. For a bullish 'Breakaway Gap' we want to see the 3rd candle close above the high of the 2nd candle. An example of a bullish Breakaway Gap is shown in the example below:
A bearish 'Breakaway Gap' is defined by the close of the 3rd candle being lower than the low of the 2nd candle. An example is shown below:
How do we define an FVG that price may return to:
Any gap that does not meet the above rules for a 'Breakway Gap' is therefore considered an FVG that price may return to. So for a bullish FVG that price may return to we would look to see if the close of the 3rd candle is above the high of the 2nd candle. If it is not above the high of the 2nd candle then it more likely that price will retrace into the FVG before continuing higher. An example is shown below:
A bearish gap that price may return to is defined by the close of the 3rd candle not being lower than the low of the 2nd candle. An example is shown below:
The indicator is based on the teachings of 'Arjo'. Note: breakaway gaps will only remain 'breakaway' until a liquidity level is reached. Breakaways therefore do not remain 'breakaway' forever. Users of the indicators must fully comprehend this theory before using the indicator with live markets.
Users of the script should be fully aware of this concept and also have conducted thorough backtesting using a large data set before using this indicator with live accounts.

FVG Positioning Average [LuxAlgo]The FVG Positioning Average indicator aims to uncover potential price levels of interest by averaging together recent Fair Value Gap (FVG) initiation levels.
This indicator is grounded in the theory that significant buying or selling activity is the primary catalyst for creating FVGs.
By averaging together the prices where each FVG initiated, we may potentially reveal where major participants are positioned.
🔶 USAGE
By analyzing the average price of bullish or bearish FVGs, users can identify potential support or resistance areas where the larger participants may re-enter or defend their positions.
These areas could be used to adjust entries and exits or assist with risk management such as take-profit or stop-loss levels.
The indicator displays 2 lines, the Bull Average and the Bear Average.
The Bull Average is only displayed when the price holds above the bull Average.
The Bear Average is only displayed when the price holds below the bear average.
When only one average is displayed alone, this level is seen as support or resistance, it is anticipated that this level would be defended for the current trend to stay valid.
When both averages are displayed simultaneously, it can be interpreted as one side attempting to take over the trend.
The movements and reactions during these attempts can be analyzed to provide helpful information about where the price might be headed.
Possible outcomes:
Trend Confirmation/Re-Entry (From Weak Attempts)
Trend Reversal (Creating Support or Resistance)
Consolidation (Oscillating between/around Bull & Bear Averages)
🔶 DETAILS
🔹 Lookback Types
This indicator includes 2 lookback types:
Bar Count: Uses Bars to determine what data to include. This type can be utilized for averages that are more locally relevant to the current chart data.
FVG Count: Uses a specific # of FVGs for calculations. This type can be utilized for a continuous & consistent view, typically relevant with longer term analysis.
Note: When using bar lookback, if no data is in range, no lines will be displayed.
Below is an example of the 'FVG Count' Display.
🔹 Initiation Levels
Initiation Levels are the specific price points where each FVG starts, these are the last points the price was traded at before creating the gap.
Bull Initiation Level: Lowest Point (Bottom) of FVG
Bear Initiation Level: Highest Point (Top) of FVG
🔹 FVG Display
Each FVG being used for the current calculation of averages is displayed on the chart for reference.
Note: If you prefer to not display the FVGs, they can be toggled off in the settings, uncheck "Show FVGs on Chart".
🔶 Settings
FVG Lookback: As mentioned above in the 'Lookback Types', this sets the number of FVGs or Bars to use for consideration.
Lookback Type: As also mentioned above in 'Lookback Types', this determines the method of lookback to be used.
ATR Multiplier: The FVGs are required to have a Greater Width than (ATR * Multiplier) in order to be used for calculations. This allows you to focus on the data being considered if needed.

FVG (ICT) with Swing LevelsThis indicator, called "Fair Value Gaps (ICT) with Swing Levels", overlays on the main chart and does the following:
Initial Setup:
It defines user-adjustable parameters:
lookback: Lookback period to keep FVGs visible.
swingPeriod: Period for calculating swing highs and lows.
bullColor and bearColor: Colors for bullish and bearish FVGs.
Fair Value Gaps (FVGs) Detection:
Uses a function to identify FVGs by comparing candle high and low prices.
A bullish FVG forms when the low of two candles ago is higher than the high of the current candle.
A bearish FVG forms when the high of two candles ago is lower than the low of the current candle.
Swing Levels Calculation:
Calculates swing highs and lows over the specified period.
These swing levels define the current market range.
Current Range Verification:
Implements a function to check if an FVG is within the range defined by swing levels.
This ensures only the most relevant FVGs for the current market situation are displayed.
FVG Drawing:
When it detects an FVG (bullish or bearish) within the current range, it draws a box on the chart.
Boxes extend from the bar where the FVG formed to the current bar.
Bullish FVGs are drawn in green and bearish in red (colors are customizable).
Old FVGs Management:
On each new bar, the indicator checks all existing FVG boxes.
It removes boxes that are outside the specified lookback period.
It also removes boxes that are no longer within the current range of swing levels.
Swing Levels Visualization:
Draws lines on the chart to show swing highs (in blue) and swing lows (in purple).
These lines help visualize the current market range.
Continuous Update:
The indicator updates on each new candle, constantly refreshing FVGs and swing levels.
In summary, this indicator identifies and visualizes Fair Value Gaps according to the ICT methodology, filtering them based on higher timeframe swing levels. This helps traders focus on the most significant FVGs within the current market context, reducing visual noise and potentially improving trading decision-making.

FVG Heatmap [Hash Capital Research]FVG Map
FVG Map is a visual Fair Value Gap (FVG) mapping tool built to make displacement imbalances easy to see and manage in real time. It detects 3-candle FVG zones, plots them as clean heatmap boxes, tracks partial mitigation (how much of the zone has been filled), and summarizes recent “fill speed” behavior in a small regime dashboard.
This is an indicator (not a strategy). It does not place trades and it does not publish performance claims. It is a market-structure visualization tool intended to support discretionary or systematic workflows.
What this script detects
Bullish FVG (gap below price)
A bullish FVG is detected when the candle from two bars ago has a high below the current candle’s low.
The zone spans from that prior high up to the current low.
Bearish FVG (gap above price)
A bearish FVG is detected when the candle from two bars ago has a low above the current candle’s high.
The zone spans from the current high up to that prior low.
What makes it useful
Heatmap zones (clean, readable FVG boxes)
Bullish zones plot below price. Bearish zones plot above price.
Partial fill tracking (mitigation progress)
As price trades back into a zone, the script visually shows how much of the zone has been filled.
Mitigation modes (your definition of “filled”)
• Full Fill: price fully trades through the zone
• 50% Fill: price reaches the midpoint of the zone
• First Touch: price touches the zone one time
Optional auto-cleanup
Optionally remove zones once they’re mitigated to keep the chart clean.
Fill-Speed Regime Dashboard
When zones get mitigated, the script records how many bars it took to fill and summarizes the recent environment:
• Average fill time
• Median fill time
• % fast fills vs % slow fills
• Regime label: choppy/mean-revert, trending/displacement, or mixed
How to use
Use FVG zones as structure, not guaranteed signals.
• Bullish zones are often watched as potential support on pullbacks.
• Bearish zones are often watched as potential resistance on rallies.
The fill-speed dashboard helps provide context: fast fills tend to appear in more rotational conditions, while slow fills tend to appear in stronger trend/displacement conditions.
Alerts
Bullish FVG Created
Bearish FVG Created
Notes
FVGs are not guaranteed reversal points. Fill-speed/regime is descriptive of recent behavior and should be treated as context, not prediction. On realtime candles, visuals may update as the bar forms.

FVG Trailing Stop [LuxAlgo]The FVG Trailing Stop indicator tracks unmitigated Fair Value Gaps (FVG) data to produce a Trailing Stop indicator able to determine if the market is uptrending or downtrending easily.
🔶 USAGE
The FVG Trailing Stop is intended to identify trend directions through its position relative to the closing price:
Bullish: Price is located above the Trailing Stop, indicating that all Bearish FVGs have been mitigated and the trend is anticipated to continue upwards.
Bearish State: Price is located below the Trailing Stop, indicating that all Bullish FVGs have been mitigated and the trend is anticipated to continue downwards.
The Trailing Stop originates from two extremities obtained from the average of respective unmitigated FVGs. The specific directional average is also displayed as a more transparent secondary line, however, the trailing stop is derived from this value and a new trend will not be detected until the opposite directional average is crossed.
Price reaching the Trailing Stop is caused by retracements and can lead to the following scenarios:
Outcome 1: The directional average is crossed next, indicating a new trend direction.
Outcome 2: The directional average is held as support or resistance, leading to a new impulse and a continuation of the trend.
🔹 Reset on Cross
While price crossing the Trailing Stop should be considered as a sign of an upcoming trend change; it is possible for the price to still evolve outside it.
As a solution, we have included the "Reset on Cross" feature, which (as the name suggests) hides and resets the Trailing Stop each time it is crossed, leading to a "Neutral" state.
This opens the opportunity for the Trailing Stop to be displayed again once the price moves again in the direction of the pre-established trend. A trader might use this to accumulate positions within a specific trend.
🔶 DETAILS
The script uses a typical identification method for FVGs. Once identified, the script collects the point of the FVG farthest from the current price when formed.
For Upwards FVGs this is the bottom of the FVG.
For Downwards FVGs this is the top of the FVG.
The data is managed only to use the last input lookback of FVGs. If an FVG is mitigated, it frees up a spot in the memory for a new FVG, however, if the lookback is full, the oldest will be deleted.
From there, it uses a "trailing" logic only to move the Trailing Stop in one direction until the trailing stop resets or the direction flips.
The extremities used to calculate the Trailing Stop are created from 2 calculation steps, the first step involves taking the raw average of the FVG mitigation levels, and the second step applies a simple moving average (SMA) smoothing of the precedent-obtained averages.
🔶 SETTINGS
Unmitigated FVG Lookback: Sets the maximum number of Unmitigated FVGs that the script will use.
Smoothing Length: Sets the smoothing length for the Trailing Stop to reduce erratic results.
Reset on Cross: When enabled, hide and reset the Trailing Stop until the price starts moving in the pre-established trend direction again.

FVGs & CEs + Alerts: simple & efficient methodFair Value Gap indicator: Paints FVGs and their midlines (CEs). Stops painting when CE is hit, or when fully filled; user choice of threshold. This threshold is also used in the Alert conditions.
~~Plotted here on ES1! (CME), on the 15m timeframe~~
-A FVG represents a 'naked' body where the wicks/tails on either side do not meet. This can be seen as a type of 'gap', which price will have a tendency to want to re-fill (in part or in full).
-The midline (CE, or 'Consequent encroachment') of FVGs also tend to show price sensitivity.
-This indicator paints all FVGs until priced into, and should give an idea of which are more meaningful and which are best ignored (based on context: location, Time of day, market structure, etc).
-This is a simpler and more efficient method of painting Fair value gaps which auto-stop painting when price reaches them.
//Aims of Publishing:
-Education of ICT concepts of Fair Value Gaps and their midlines (CEs): To easily see via forward testing or backtesting, the sensitivity that price shows to these areas & levels.
-Demonstration of a much more efficient way of plotting FVGs which terminate at price, thanks to a modification of @Bjorgums's clever looping method referenced below.
//Settings:
-Toggle on/off upward and downward FVGs independently(blue and orange by default).
-Toggle on/off midline (CE).
-Standard color/line formatting options.
-Choose Threshold: CE of FVG or Full Fill of FVG: This will determine both the 'stop-painting' trigger and the 'Alert' trigger.
-Choose number of days lookback to control how many historical FVGs paint on chart.
//On alerts:
-Simple choice of 2 alerts:
~~One for price crossing into/above the nearest untouched 'premium' FVG above ( orange ). Trigger is user choice of CE or full fill.
~~Another for price crossing into/below the nearest untouched 'discount' FVG below (blue). Trigger is user choice of CE or full fill.
-Alerts set via the three dots in indicator status line.
//Cautionary notes:
-Do not use the alerts blindly to find trades. Wait until you have identified a good FVG above/below which you think price may show sensitivity to
-Usage on very low timeframes can cause unexpected results with alerts: due to new FVGs forming in realtime the Alert will always trigger at the most recent FVG above/ below having its threshold hit.
-Big thank you to @Bjorgum for his fantastic extendAndRemove method. Modified here for use with boxes and to integrate Alerts.
-Also Credit to ICT (inner circle trader) for the concepts used here: Fair value gaps and their Consequent Encroachment (CE).
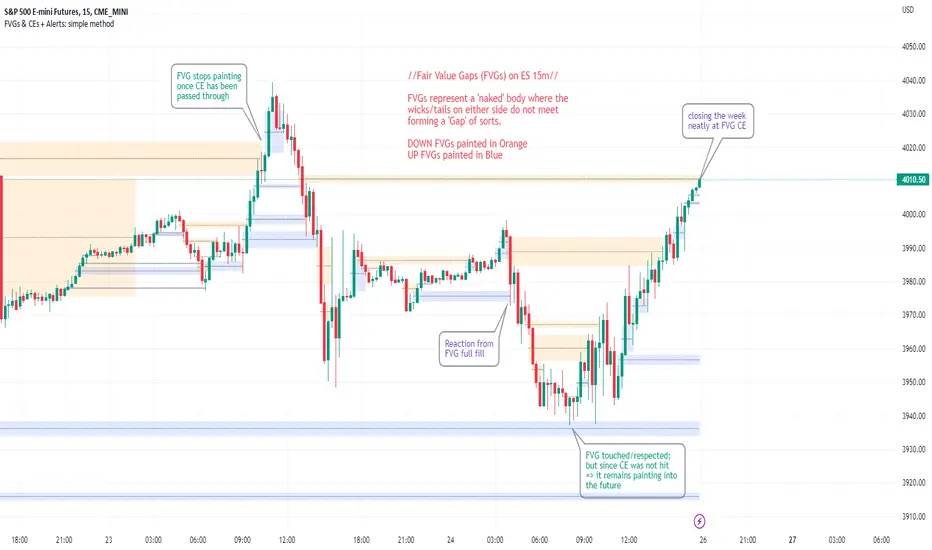
FVG fill with immediate rebalance [LuciTech]The "FVG fill with immediate rebalance AKA Golden Arrow" indicator is designed to identify Fair Value Gaps (FVGs) and detect immediate rebalances to highlight potential trading opportunities. It uses colored boxes to mark FVGs and triangular markers to signal bullish or bearish setups, helping traders pinpoint key price levels where imbalances occur and price reactions are likely.
Key Features
FVG Detection: Spots bullish and bearish Fair Value Gaps based on price action, with customizable width settings.
Golden Arrow Signals: Displays triangular markers when price fills an FVG and immediately rebalances, indicating potential reversal or continuation zones.
Customizable Colors: Bullish FVGs appear in green and bearish FVGs in red by default, with options to tweak colors in the settings.
Time Filter: Allows signals to be restricted to a specific time window, highlighted by a background fill for clarity.
Alert System: Supports TradingView alerts for "Bullish Golden Arrow" and "Bearish Golden Arrow" signals to keep traders updated on setups.
How It Works
FVG Calculation: Analyzes gaps between candles to identify FVGs, with user-defined minimum width options (points, percentages, or ATR-based).
Signal Generation: Triggers a Golden Arrow signal when price fills the FVG and rebalances immediately, based on wick penetration and closing conditions.
Visual Aids:
Bullish FVGs are shown as green boxes, bearish FVGs as red boxes.
Upward triangles mark bullish signals, downward triangles mark bearish signals.
Time-Based Filtering: Optionally limits signals to specific hours, with a background fill showing the active period.

FVG | iSolani
Unveiling Market Inefficiencies with Precision
In fast-moving markets, spotting hidden opportunities often hinges on identifying imbalances between price and value. The FVG | iSolani indicator revolutionises this process by detecting Fair Value Gaps (FVGs) —zones where price action skips over "fair" valuation levels, creating potential retracement targets. Combining advanced filtering, dynamic visualisation, and automated management, this tool empowers traders to pinpoint high-probability setups with unprecedented clarity.
Core Methodology
The indicator employs a multi-layered approach to identify FVGs:
Three-Bar Gap Analysis: Bullish FVGs form when the current low exceeds the high of two bars prior, while bearish FVGs occur when the current high stays below the low of two bars back.
Volatility-Adjusted Filtering: Gaps are measured against a 100-bar standard deviation to exclude insignificant price jumps.
Volume Confirmation: Only gaps accompanied by above-average volume (relative to a 1-bar SMA) are validated, filtering out low-conviction moves.
Auto-Invalidation System: Continuously monitors price action to remove FVG zones once price closes within their range, maintaining chart cleanliness.
Breaking New Ground
This tool introduces three paradigm-shifting innovations:
Volume-Weighted Significance: Unlike traditional FVG detectors, it ties gap validity to volume spikes, emphasising institutional activity.
Adaptive Zone Management: Boxes automatically extend rightward (when enabled) and self-destruct when invalidated, eliminating manual cleanup.
Smart Color Encoding: Offers both monochrome (for multi-timeframe analysis) and standard bull/bear color schemes, with customisable transparency.
Engine Under the Hood
The script operates through four key processes:
Gap Detection: Scans every new bar for three-candle patterns meeting FVG criteria.
Statistical Filtering: Applies user-defined threshold (default: 1σ) to separate meaningful gaps from market noise.
Box Rendering: Draws semi-transparent zones between gap boundaries using TradingView's box objects, styled according to user preferences.
Array-Based Memory: Stores all active FVGs in arrays, enabling real-time validation checks against current price action.
Standard Configuration
Optimised default settings balance visibility and functionality:
Filter: 1.0 (1 standard deviation threshold)
Colors: "Mono" mode (gray boxes) with 90% transparency
Text Labels: Enabled in medium gray
Extension: Gaps extend indefinitely rightward
Borders: Dotted lines with visible outlines
Through its fusion of quantitative rigor and visual adaptability, the FVG | iSolani transforms raw price data into actionable intelligence. By focusing on volume-confirmed gaps and automating zone management, it cuts through market chaos to reveal structurally significant levels—a must-have for traders navigating breakouts, reversals, or order-flow analysis.

FVG Order Blocks [BigBeluga]This indicator is an advanced tool designed to detect and visualize market FVGs with order blocks, where the price action has created gaps due to strong buying or selling pressure. These FVG often act as critical support and resistance levels, giving traders strategic points for potential entries and exits. The indicator not only identifies these imbalances but also displays their relative strength by size %, helping traders prioritize order blocks that are more likely to hold or break.
The indicator works on various pairs and stocks, it also works on charts that do not provide volume data
Forex (JPY/USD):
Stocks (NVDA):
🔵 KEY FEATURES & USAGE
● FVGs Detection and Visualization:
The indicator detects bullish and bearish FVGs. Bullish FVG occur when there is significant buying, and order block is plotted below the FVG zone:
Conversely, bearish FVG are plotted with an order block above the zone, indicating potential resistance.
Traders can use these order blocks to anticipate price reactions when the market revisits these areas, making them ideal for setting up trades.
● FVG Filtering:
The indicator includes a FVG % filter that allows traders to only display strong order blocks. This ensures that only significant FVG order blocks are shown, reducing noise and focusing on the most impactful areas.
● Highlighting Broken Levels:
When an imbalance level is broken—either breached by price action or no longer relevant—the indicator can either delete the level or mark it with a gray color areas. This provides a clear visual cue that the level has been compromised, allowing traders to adjust their strategies accordingly.
● Order Blocks Signals:
When price retest the blocks, indicator display potential sell or buy signals. Which can be an opportunity for trades
🔵 CUSTOMIZATION
● FVG Filter:
Adjust the strength filter to control which FVGs are displayed based on their percentage size. This filter helps in focusing only on significant blocks that are likely to impact price action.
● Order Blocks Amount Displayed:
Set the maximum number of Order Blocks to be displayed on the chart. This customization helps keep the chart clean and ensures that only the most important blocks are in view.
● Broken Order Blocks Display:
Choose whether to display order blocks that have been broken by the price. This feature helps in maintaining a focus on blocks that are still valid while filtering out those that are no longer relevant.
● Color Customization:
You can customize the colors for bullish and bearish Order Blocks to match your chart's overall color scheme. Additionally, strength bars can be color-coded based on their percentage to quickly identify high-priority order blocks.
Traders who are confident in the settings of the indicator can confidently use it on various types of markets
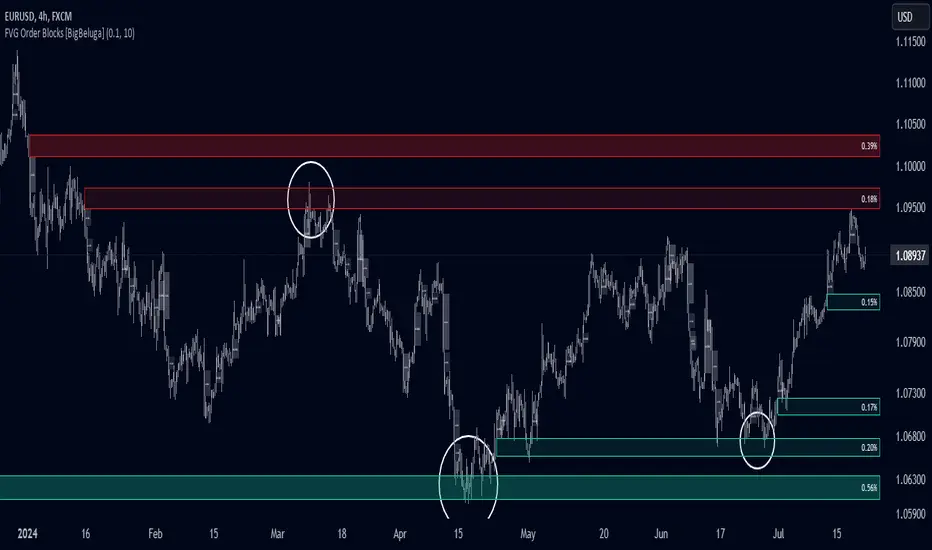
FVG Finder | NRP | ProjectSyndicate🥇 ProjectSyndicate Fair Value Gap (FVG) Finder — Pine Script v6 • NRP Non-Repainting
📌 SMC Imbalance Zones Built for Clean Entries, Targets & Mitigation Tracking
The ProjectSyndicate FVG Finder is a professional TradingView indicator designed for traders who want clean, high-probability Fair Value Gaps price imbalances mapped instantly on-chart—without manual marking or clutter.
Fair Value Gaps form during aggressive displacement when price delivers inefficiently, leaving a void that price often returns to rebalance. This tool helps you spot those zones fast, track whether they’re still fresh, and plan entries with confidence. ✅
________________________________________
🚀 Why Traders Like It
✅ NRP Logic (Non-Repainting): Signals are built to remain stable once confirmed
✅ Real-Time FVG Detection: Automatically identifies bullish + bearish FVG zones as they form
📦 Clean Zone Visualization: Boxed imbalance areas that are easy to trade from
🧹 Auto-Cleanup (Mitigation): Zones update based on your chosen fill rule (Touch / 50% / Full)
🎛️ Anti-Noise Filtering: Minimum size + optional ATR filter to remove weak gaps
⚡ Pine Script v6: Built on the latest TradingView engine for stability and performance
🔔 Alerts + Markers: Get notified when new FVGs print + optional triangle signals
________________________________________
Gold H1 TF active FVGs
Eur Usd M30 TF active FVGs
NQ H1 TF active FVGs
🧠 Detection Logic — Simple, Effective, Battle-Tested
📈 Bullish Fair Value Gap (Demand Imbalance):
A 3-candle imbalance where the low of Candle 3 is above the high of Candle 1
➡️ Signals strong buy-side displacement / inefficient delivery
📉 Bearish Fair Value Gap (Supply Imbalance):
A 3-candle imbalance where the high of Candle 3 is below the low of Candle 1
➡️ Signals strong sell-side displacement / inefficient delivery
________________________________________
🧹 Mitigation Options — Choose How Filled Works
Your strategy decides what counts as used:
👆 Touch: Zone considered mitigated on first interaction
🎯 50% Fill: Mitigated once price fills half the gap
✅ Full Fill: Mitigated only when the entire zone is filled
Optional: Keep mitigated zones visible or hide them for ultra-clean charts.
________________________________________
🛠 Recommended Settings (ATR Multiplier Presets)
Use these as solid starting points on M30 / H1:
•🥇 XAUUSD (Gold) M30/H1: 0.5
•💻 NQ (Nasdaq) M30/H1: 0.25
•🛢️ USOIL M30/H1: 0.25
•₿ BTCUSD M30/H1: 0.25
•💶 EURUSD / GBPUSD M30/H1: 0.25 – 0.50
✅ Other markets are supported too just adjust the ATR Multiplier based on how many signals you want:
•More signals → lower multiplier
•Higher quality → higher multiplier
________________________________________
✅ Best Use-Cases
🎯 Mark imbalance zones instantly without manual drawing
🧲 Wait for price to return to FVG for cleaner entries
🛡️ Use zone boundaries for clear invalidation / stop placement
📊 Combine with trend bias + BOS/CHoCH + premium/discount for higher confirmation
🎯 Use FVGs as both entries and profit targets
________________________________________
⭐ How You Can Support ProjectSyndicate (3 Steps)
1. ✅ Click “Add to Favorites” to save this script to your TradingView Favorites
2. 🔎 Check out our other scripts to complete your SMC toolkit
3. 👤 Follow ProjectSyndicate for the latest updates, upgrades, and new releases
Order Block Finder | Gold | ProjectSyndicate
Breaker Blocks Finder | Gold | ProjectSyndicate

FVG Sessions [LuxAlgo]The FVG Sessions indicator highlights the first fair value gap of the trading session as well as the session range. Detected fair value gaps extend to the end of the trading session.
Alerts are included on the formation of a session fair value gap, price being within a session fair value gap, mitigations, and price crossing session fair value gaps average.
🔶 USAGE
Trader ICT states that the first fair value gap of the trading session can attract the most significant reaction. Having only one FVG per session allows users to further focus on that precise imbalance as well as external elements.
The mitigation of a fair value gap is clearly indicated on the chart with a more transparent color allowing users to see inverse FVGs.
Extending the fair value gaps allows the imbalance area to provide potential support and resistance.
Do note that this script should be used on intraday charts.
🔶 ALERTS
The script includes the following alerts:
🔹 Bullish/Bearish FVG
Alerts on the formation of the first bullish or bearish FVG of the session.
🔹 Bullish/Bearish FVG Mitigation
Alerts when the first bullish or bearish FVG of the session is mitigated.
🔹 Price Within FVG
Alerts when price is within the first bullish or bearish FVG area of the session.
🔹 Price Cross FVG Average
Alerts when price cross the average level of the first bullish or bearish FVG of the session.

[FrizLabz] FVGFVG indicator --
Allows your Charts to stay CLEAN for your T.A. by plotting the FVGs on top of the Candles inside of its Borders
FVGs can also be turned off and you can Remove the Bar Color only
Each FVG has a tooltip that you can hover your mouse over to get the (Type of FVG, Size, Top, Middle, Bottom, Time)
FVGs Using Plots so that they go all the way back in history you can have more than 500 on the chart
Uses 4 Plots to achieve this 4 are used to prevent the fill() from carrying over to the next bar if there are 2 FVGs
Can remove Bar Color - Theres no option to change Bar Color because it will cover up the FVG
Hope you guys Enjoy,