Order Blocks Zones with Signals█ OVERVIEW
“Order Blocks Zones with Signals” is a technical analysis tool that automatically identifies Order Blocks (OB) and optionally Fair Value Gaps (FVG) on the chart.
The script visualizes these zones as colored rectangles, offering full customization of style, transparency, and signal display.
It also generates entry and exit signals (Break & Exit) that can serve as confirmations in strategies based on price action and market structure.
Thanks to flexible candle size filters and rich visual options, the indicator maintains chart clarity and readability.
█ CONCEPTS
Order Blocks (OB) are key zones on the chart where significant price movements previously occurred — areas where large market participants (institutions, so-called smart money) initiated or closed positions.
An OB is the last candle that followed the prior trend before the market reversed (e.g., for a Bullish OB: the last bearish candle before a pivot low and a strong upward impulse).
The script detects these levels using local price pivots, analyzing candle direction to filter out less significant movements.
FVG (Fair Value Gaps) represent areas of imbalance between buyers and sellers — price gaps formed by a sharp impulse where full trading did not occur due to one-sided order dominance (e.g., excess buy or sell orders).
Why combine OB and FVG in one indicator?
Combining OB and FVG analysis is essential because these phenomena often occur sequentially in the institutional market cycle:
1. Order Block — institutions enter the market in the OB zone, absorbing orders and building positions.
2. Strong impulse — after smart money entry, a rapid price move creates an FVG (imbalance gap).
3. Retest — price naturally returns to these zones (OB or FVG), drawn by unfilled orders and the search for equilibrium.
Such areas strongly attract price, as they represent not only historical institutional levels but also open “holes” in the order book. Retests of OB and FVG are ideal entry opportunities with high reaction probability (rebound or breakout). The indicator combines these two interconnected elements, enabling comprehensive market structure analysis in a single tool.
Order Blocks are labeled as:
Bullish OB – demand zones, often accumulation areas before an upmove.
Bearish OB – supply zones, signaling potential impulse end or correction start.
█ FEATURES
Order Block Detection (OB Detection):
- Automatic identification of demand and supply zones based on pivots.
- OB is the last candle aligned with the prior trend, just before the market reversal — precisely identified through candle sequence analysis around the pivot.
- OB zones appear with a delay equal to Pivot Length (default 10 bars).
- Break signals trigger when a candle’s body (close) fully pierces the zone, causing the zone to disappear immediately (e.g., close < low of Bullish OB → Break Down and zone deletion).
- Minimum size filtering via OB Size Multiplier.
- Option to create OB without wicks (Include Wicks in OB): when disabled, OB zones are based solely on candle bodies (open/close), ignoring wicks (high/low).
Fair Value Gap Detection (FVG Detection):
- Optional, with enable/disable capability.
- FVG are detected without delay — immediately upon gap occurrence.
- Size filtering via Candle Size Period and FVG Size Multiplier.
Customizable Styling:
- Separate colors and border styles (Solid / Dashed / Dotted) for each zone type.
- Adjustable transparency and border thickness.
- Unified color for box, border, and signal of the same type.
Breakout and Exit Signals:
- Break Up – triggered when a candle’s close breaks above a Bearish OB, causing the zone to disappear.
- Break Down – triggered when a candle’s close breaks below a Bullish OB, causing the zone to disappear.
- Exit Up / Exit Down – temporary exit from the zone without full breakout (price leaves the zone but doesn’t close beyond it). Signal type selection: Break, Exit, or Both.
- Alerts: built-in alerts for all signal types — triggered automatically on candle close confirming breakout or exit from OB.
█ HOW TO USE
Adding to chart: import the code into Pine Editor and run the script on TradingView.
Settings configuration:
- Pivot Length: controls swing detection sensitivity and OB display delay (default 10).
- Include Wicks in OB: enabled (default) – OB includes wicks; disabled – OB uses bodies only.
- Size Filter: adjust Candle Size Period and OB/FVG Size Multiplier to filter out small zones.
- Colors & Styles: set colors, styles, and transparency for each zone type.
- Signal Type: choose which signals to display (Break, Exit, or Both).
Signal interpretation:
- OB Break Up: price closes above Bearish OB → zone disappears → potential bullish continuation.
- OB Break Down: price closes below Bullish OB → zone disappears → potential bearish continuation.
- Exit Signals: price leaves the zone temporarily without breakout — often signals impending reversal or pullback.
Tips:
- Use OB signals alongside other indicators like RSI, MACD, SMI, or trend filters.
- Order Blocks from higher timeframes (e.g., 4H, 1D) carry greater significance and reaction strength.
- Remember: FVG are detected immediately, OB with delay — a complementary approach!
█ APPLICATIONS
- Smart Money Concepts (SMC): use OB zones as dynamic support and resistance levels. In an uptrend, look for buy opportunities in bullish OBs, which price often retests before further gains. Combining with RSI, MACD, or Fibonacci levels enhances zone significance, confirming institutional demand.
- Breakout Trading: trade based on OB breakout signals. A buy signal after breaking a bearish OB may indicate a strong upward impulse, especially if supported by rising MACD or RSI above 50. Similarly for sell signals after Break Down.
- Reversal Zones: Exit signals may indicate the end of a move or correction. Safest to use in alignment with higher-timeframe trend and confirmed by another indicator (e.g., RSI divergence, Fibonacci levels).
- Confluence Analysis: combine OB and FVG for deeper market structure and equilibrium insight. When an Order Block overlaps or borders an FVG, we get confluence of two institutional phenomena — OB (smart money entry) + FVG (imbalance) — making these areas particularly strong price magnets, increasing retest and reaction probability.
█ NOTES
- FVG can be fully disabled for a cleaner chart view.
- In consolidation periods, signals may appear more frequently — always confirm with additional trend filters.
- Works on all markets and timeframes (crypto, forex, indices, stocks).
Cerca negli script per "fvg"

Luxy BIG beautiful Dynamic ORBThis is an advanced Opening Range Breakout (ORB) indicator that tracks price breakouts from the first 5, 15, 30, and 60 minutes of the trading session. It provides complete trade management including entry signals, stop-loss placement, take-profit targets, and position sizing calculations.
The ORB strategy is based on the concept that the opening range of a trading session often acts as support/resistance, and breakouts from this range tend to lead to significant moves.
What Makes This Different?
Most ORB indicators simply draw horizontal lines and leave you to figure out the rest. This indicator goes several steps further:
Multi-Stage Tracking
Instead of just one ORB timeframe, this tracks FOUR simultaneously (5min, 15min, 30min, 60min). Each stage builds on the previous one, giving you multiple trading opportunities throughout the session.
Active Trade Management
When a breakout occurs, the indicator automatically calculates and displays entry price, stop-loss, and multiple take-profit targets. These lines extend forward and update in real-time until the trade completes.
Cycle Detection
Unlike indicators that only show the first breakout, this tracks the complete cycle: Breakout → Retest → Re-breakout. You can see when price returns to test the ORB level after breaking out (potential re-entry).
Failed Breakout Warning
If price breaks out but quickly returns inside the range (within a few bars), the label changes to "FAILED BREAK" - warning you to exit or avoid the trade.
Position Sizing Calculator
Built-in risk management that tells you exactly how many shares to buy based on your account size and risk tolerance. No more guessing or manual calculations.
Advanced Filtering
Optional filters for volume confirmation, trend alignment, and Fair Value Gaps (FVG) to reduce false signals and improve win rate.
Core Features Explained
### 1. Multi-Stage ORB Levels
The indicator builds four separate Opening Range levels:
ORB 5 - First 5 minutes (fastest signals, most volatile)
ORB 15 - First 15 minutes (balanced, most popular)
ORB 30 - First 30 minutes (slower, more reliable)
ORB 60 - First 60 minutes (slowest, most confirmed)
Each level is drawn as a horizontal range on your chart. As time progresses, the ranges expand to include more price action. You can enable or disable any stage and assign custom colors to each.
How it works: During the opening minutes, the indicator tracks the highest high and lowest low. Once the time period completes, those levels become your ORB high and low for that stage.
### 2. Breakout Detection
When price closes outside the ORB range, a label appears:
BREAK UP (green label above price) - Price closed above ORB High
BREAK DOWN (red label below price) - Price closed below ORB Low
The label shows which ORB stage triggered (ORB5, ORB15, etc.) and the cycle number if tracking multiple breakouts.
Important: Signals appear on bar close only - no repainting. What you see is what you get.
### 3. Retest Detection
After price breaks out and moves away, if it returns to test the ORB level, a "RETEST" label appears (orange). This indicates:
The original breakout level is now acting as support/resistance
Potential re-entry opportunity if you missed the first breakout
Confirmation that the level is significant
The indicator requires price to move a minimum distance away before considering it a valid retest (configurable in settings).
### 4. Failed Breakout Detection
If price breaks out but returns inside the ORB range within a few bars (before the breakout is "committed"), the original label changes to "FAILED BREAK" in orange.
This warns you:
The breakout lacked conviction
Consider exiting if already in the trade
Wait for better setup
Committed Breakout: The indicator tracks how many bars price stays outside the range. Only after staying outside for the minimum number of bars does it become a committed breakout that can be retested.
### 5. TP/SL Lines (Trade Management)
When a breakout occurs, colored horizontal lines appear showing:
Entry Line (cyan for long, orange for short) - Your entry price (the ORB level)
Stop Loss Line (red) - Where to exit if trade goes against you
TP1, TP2, TP3 Lines (same color as entry) - Profit targets at 1R, 2R, 3R
These lines extend forward as new bars form, making it easy to track your trade. When a target is hit, the line turns green and the label shows a checkmark.
Lines freeze (stop updating) when:
Stop loss is hit
The final enabled take-profit is hit
End of trading session (optional setting)
### 6. Position Sizing Dashboard
The dashboard (bottom-left corner by default) shows real-time information:
Current ORB stage and range size
Breakout status (Inside Range / Break Up / Break Down)
Volume confirmation (if filter enabled)
Trend alignment (if filter enabled)
Entry and Stop Loss prices
All enabled Take Profit levels with percentages
Risk/Reward ratio
Position sizing: Max shares to buy and total risk amount
Position Sizing Example:
If your account is $25,000 and you risk 1% per trade ($250), and the distance from entry to stop loss is $0.50, the calculator shows you can buy 500 shares (250 / 0.50 = 500).
### 7. FVG Filter (Fair Value Gap)
Fair Value Gaps are price inefficiencies - gaps left by strong momentum where one candle's high doesn't overlap with a previous candle's low (or vice versa).
When enabled, this filter:
Detects bullish and bearish FVGs
Draws semi-transparent boxes around these gaps
Only allows breakout signals if there's an FVG near the breakout level
Why this helps: FVGs indicate institutional activity. Breakouts through FVGs tend to be stronger and more reliable.
Proximity setting: Controls how close the FVG must be to the ORB level. 2.0x means the breakout can be within 2 times the FVG size - a reasonable default.
### 8. Volume & Trend Filters
Volume Filter:
Requires current volume to be above average (customizable multiplier). High volume breakouts are more likely to sustain.
Set minimum multiplier (e.g., 1.5x = 50% above average)
Set "strong volume" multiplier (e.g., 2.5x) that bypasses other filters
Dashboard shows current volume ratio
Trend Filter:
Only shows breakouts aligned with a higher timeframe trend. Choose from:
VWAP - Price above/below volume-weighted average
EMA - Price above/below exponential moving average
SuperTrend - ATR-based trend indicator
Combined modes (VWAP+EMA, VWAP+SuperTrend) for stricter filtering
### 9. Pullback Filter (Advanced)
Purpose:
Waits for price to pull back slightly after initial breakout before confirming the signal.
This reduces false breakouts from immediate reversals.
How it works:
- After breakout is detected, indicator waits for a small pullback (default 2%)
- Once pullback occurs AND price breaks out again, signal is confirmed
- If no pullback within timeout period (5 bars), signal is issued anyway
Settings:
Enable Pullback Filter: Turn this filter on/off
Pullback %: How much price must pull back (2% is balanced)
Timeout (bars): Max bars to wait for pullback (5 is standard)
When to use:
- Choppy markets with many fake breakouts
- When you want higher quality signals
- Combine with Volume filter for maximum confirmation
Trade-off:
- Better signal quality
- May miss some valid fast moves
- Slight entry delay
How to Use This Indicator
### For Beginners - Simple Setup
Add the indicator to your chart (5-minute or 15-minute timeframe recommended)
Leave all default settings - they work well for most stocks
Watch for BREAK UP or BREAK DOWN labels to appear
Check the dashboard for entry, stop loss, and targets
Use the position sizing to determine how many shares to buy
Basic Trading Plan:
Wait for a clear breakout label
Enter at the ORB level (or next candle open if you're late)
Place stop loss where the red line indicates
Take profit at TP1 (50% of position) and TP2 (remaining 50%)
### For Advanced Traders - Customized Setup
Choose which ORB stages to track (you might only want ORB15 and ORB30)
Enable filters: Volume (stocks) or Trend (trending markets)
Enable FVG filter for institutional confirmation
Set "Track Cycles" mode to catch retests and re-breakouts
Customize stop loss method (ATR for volatile stocks, ORB% for stable ones)
Adjust risk per trade and account size for accurate position sizing
Advanced Strategy Example:
Enable ORB15 only (disable others for cleaner chart)
Turn on Volume filter at 1.5x with Strong at 2.5x
Enable Trend filter using VWAP
Set Signal Mode to "Track Cycles" with Max 3 cycles
Wait for aligned breakouts (Volume + Trend + Direction)
Enter on retest if you missed the initial break
### Timeframe Recommendations
5-minute chart: Scalping, very active trading, crypto
15-minute chart: Day trading, balanced approach (most popular)
30-minute chart: Swing entries, less screen time
60-minute chart: Position trading, longer holds
The indicator works on any intraday timeframe, but ORB is fundamentally a day trading strategy. Daily charts don't make sense for ORB.
DEFAULT CONFIGURATION
ON by Default:
• All 4 ORB stages (5/15/30/60)
• Breakout Detection
• Retest Labels
• All TP levels (1/1.5/2/3)
• TP/SL Lines (Detailed mode)
• Dashboard (Bottom Left, Dark theme)
• Position Size Calculator
OFF by Default (Optional Filters):
• FVG Filter
• Pullback Filter
• Volume Filter
• Trend Filter
• HTF Bias Check
• Alerts
Recommended for Beginners:
• Leave all defaults
• Session Mode: Auto-Detect
• Signal Mode: Track Cycles
• Stop Method: ATR
• Add Volume Filter if trading stocks
Recommended for Advanced:
• Enable ORB15 + ORB30 only (disable 5 & 60)
• Enable: Volume + Trend + FVG
• Signal Mode: Track Cycles, Max 3
• Stop Method: ATR or Safer
• Enable HTF Daily bias check
## Settings Guide
The settings are organized into logical groups. Here's what each section controls:
### ORB COLORS Section
Show Edge Labels: Display "ORB 5", "ORB 15" labels at the right edge of the levels
Background: Fill the area between ORB high/low with color
Transparency: How see-through the background is (95% is nearly invisible)
Enable ORB 5/15/30/60: Turn each stage on or off individually
Colors: Assign colors to each ORB stage for easy identification
### SESSION SETTINGS Section
Session Mode: Choose trading session (Auto-Detect works for most instruments)
Custom Session Hours: Define your own hours if needed (format: HHMM-HHMM)
Auto-Detect uses the instrument's natural hours (stocks use exchange hours, crypto uses 24/7).
### BREAKOUT DETECTION Section
Enable Breakout Detection: Master switch for signals
Show Retest Labels: Display retest signals
Label Size: Visual size for all labels (Small recommended)
Enable FVG Filter: Require Fair Value Gap confirmation
Show FVG Boxes: Display the gap boxes on chart
Signal Mode: "First Only" = one signal per direction per day, "Track Cycles" = multiple signals
Max Cycles: How many breakout-retest cycles to track (6 is balanced)
Breakout Buffer: Extra distance required beyond ORB level (0.1-0.2% recommended)
Min Distance for Retest: How far price must move away before retest is valid (2% recommended)
Min Bars Outside ORB: Bars price must stay outside for committed breakout (2 is balanced)
### TARGETS & RISK Section
Enable Targets & Stop-Loss: Calculate and show trade management
TP1/TP2/TP3 checkboxes: Select which profit targets to display
Stop Method: How to calculate stop loss placement
- ATR: Based on volatility (best for most cases)
- ORB %: Fixed % of ORB range
- Swing: Recent swing high/low
- Safer: Widest of all methods
ATR Length & Multiplier: Controls ATR stop distance (14 period, 1.5x is standard)
ORB Stop %: Percentage beyond ORB for stop (20% is balanced)
Swing Bars: Lookback period for swing high/low (3 is recent)
### TP/SL LINES Section
Show TP/SL Lines: Display horizontal lines on chart
Label Format: "Short" = minimal text, "Detailed" = shows prices
Freeze Lines at EOD: Stop extending lines at session close
### DASHBOARD Section
Show Info Panel: Display the metrics dashboard
Theme: Dark or Light colors
Position: Where to place dashboard on chart
Toggle rows: Show/hide specific information rows
Calculate Position Size: Enable the position sizing calculator
Risk Mode: Risk fixed $ amount or % of account
Account Size: Your total trading capital
Risk %: Percentage to risk per trade (0.5-1% recommended)
### VOLUME FILTER Section
Enable Volume Filter: Require volume confirmation
MA Length: Average period (20 is standard)
Min Volume: Required multiplier (1.5x = 50% above average)
Strong Volume: Multiplier that bypasses other filters (2.5x)
### TREND FILTER Section
Enable Trend Filter: Require trend alignment
Trend Mode: Method to determine trend (VWAP is simple and effective)
Custom EMA Length: If using EMA mode (50 for swing, 20 for day trading)
SuperTrend settings: Period and Multiplier if using SuperTrend mode
### HIGHER TIMEFRAME Section
Check Daily Trend: Display higher timeframe bias in dashboard
Timeframe: What TF to check (D = daily, recommended)
Method: Price vs MA (stable) or Candle Direction (reactive)
MA Period: EMA length for Price vs MA method (20 is balanced)
Min Strength %: Minimum strength threshold for HTF bias to be considered
- For "Price vs MA": Minimum distance (%) from moving average
- For "Candle Direction": Minimum candle body size (%)
- 0.5% is balanced - increase for stricter filtering
- Lower values = more signals, higher values = only strong trends
### ALERTS Section
Enable Alerts: Master switch (must be ON to use any alerts)
Breakout Alerts: Notify on ORB breakouts
Retest Alerts: Notify when price retests after breakout
Failed Break Alerts: Notify on failed breakouts
Stage Complete Alerts: Notify when each ORB stage finishes forming
After enabling desired alert types, click "Create Alert" button, select this indicator, choose "Any alert() function call".
## Tips & Best Practices
### General Trading Tips
ORB works best on liquid instruments (stocks with good volume, major crypto pairs)
First hour of the session is most important - that's when ORB is forming
Breakouts WITH the trend have higher success rates - use the trend filter
Failed breakouts are common - use the "Min Bars Outside" setting to filter weak moves
Not every day produces good ORB setups - be patient and selective
### Position Sizing Best Practices
Never risk more than 1-2% of your account on a single trade
Use the built-in calculator - don't guess your position size
Update your account size monthly as it grows
Smaller accounts: use $ Amount mode for simplicity
Larger accounts: use % of Account mode for scaling
### Take Profit Strategy
Most traders use: 50% at TP1, 50% at TP2
Aggressive: Hold through TP1 for TP2 or TP3
Conservative: Full exit at TP1 (1:1 risk/reward)
After TP1 hits, consider moving stop to breakeven
TP3 rarely hits - only on strong trending days
### Filter Combinations
Maximum Quality: Volume + Trend + FVG (fewest signals, highest quality)
Balanced: Volume + Trend (good quality, reasonable frequency)
Active Trading: No filters or Volume only (many signals, lower quality)
Trending Markets: Trend filter essential (indices, crypto)
Range-Bound: Volume + FVG (avoid trend filter)
### Common Mistakes to Avoid
Chasing breakouts - wait for the bar to close, don't FOMO into wicks
Ignoring the stop loss - always use it, move it manually if needed
Over-leveraging - the calculator shows MAX shares, you can buy less
Trading every signal - quality > quantity, use filters
Not tracking results - keep a journal to see what works for YOU
## Pros and Cons
### Advantages
Complete all-in-one solution - from signal to position sizing
Multiple timeframes tracked simultaneously
Visual clarity - easy to see what's happening
Cycle tracking catches opportunities others miss
Built-in risk management eliminates guesswork
Customizable filters for different trading styles
No repainting - what you see is locked in
Works across multiple markets (stocks, forex, crypto)
### Limitations
Intraday strategy only - doesn't work on daily charts
Requires active monitoring during first 1-2 hours of session
Not suitable for after-hours or extended sessions by default
Can produce many signals in choppy markets (use filters)
Dashboard can be overwhelming for complete beginners
Performance depends on market conditions (trends vs ranges)
Requires understanding of risk management concepts
### Best For
Day traders who can watch the first 1-2 hours of market open
Traders who want systematic entry/exit rules
Those learning proper position sizing and risk management
Active traders comfortable with multiple signals per day
Anyone trading liquid instruments with clear sessions
### Not Ideal For
Swing traders holding multi-day positions
Set-and-forget / passive investors
Traders who can't watch market open
Complete beginners unfamiliar with trading concepts
Low volume / illiquid instruments
## Frequently Asked Questions
Q: Why are no signals appearing?
A: Check that you're on an intraday timeframe (5min, 15min, etc.) and that the current time is within your session hours. Also verify that "Enable Breakout Detection" is ON and at least one ORB stage is enabled. If using filters, they might be blocking signals - try disabling them temporarily.
Q: What's the best ORB stage to use?
A: ORB15 (15 minutes) is most popular and balanced. ORB5 gives faster signals but more noise. ORB30 and ORB60 are slower but more reliable. Many traders use ORB15 + ORB30 together.
Q: Should I enable all the filters?
A: Start with no filters to see all signals. If too many false signals, add Volume filter first (stocks) or Trend filter (trending markets). FVG filter is most restrictive - use for maximum quality but fewer signals.
Q: How do I know which stop loss method to use?
A: ATR works for most cases - it adapts to volatility. Use ORB% if you want predictable stop placement. Swing is for respecting chart structure. Safer gives you the most room but largest risk.
Q: Can I use this for swing trading?
A: Not really - ORB is fundamentally an intraday strategy. The ranges reset each day. For swing trading, look at weekly support/resistance or moving averages instead.
Q: Why do TP/SL lines disappear sometimes?
A: Lines freeze (stop extending) when: stop loss is hit, the last enabled take-profit is hit, or end of session arrives (if "Freeze at EOD" is enabled). This is intentional - the trade is complete.
Q: What's the difference between "First Only" and "Track Cycles"?
A: "First Only" shows one breakout UP and one DOWN per day maximum - clean but might miss opportunities. "Track Cycles" shows breakout-retest-rebreak sequences - more signals but busier chart.
Q: Is position sizing accurate for options/forex?
A: The calculator is designed for shares (stocks). For options, ignore the share count and use the risk amount. For forex, you'll need to adapt the lot size calculation manually.
Q: How much capital do I need to use this?
A: The indicator works for any account size, but practical day trading typically requires $25,000 in the US due to Pattern Day Trader rules. Adjust the "Account Size" setting to match your capital.
Q: Can I backtest this strategy?
A: This is an indicator, not a strategy script, so it doesn't have built-in backtesting. You can visually review historical signals or code a strategy script using similar logic.
Q: Why does the dashboard show different entry price than the breakout label?
A: If you're looking at an old breakout, the ORB levels may have changed when the next stage completed. The dashboard always shows the CURRENT active range and trade setup.
Q: What's a good win rate to expect?
A: ORB strategies typically see 40-60% win rate depending on market conditions and filters used. The strategy relies on positive risk/reward ratios (2:1 or better) to be profitable even with moderate win rates.
Q: Does this work on crypto?
A: Yes, but crypto trades 24/7 so you need to define what "session start" means. Use Session Mode = Custom and set your preferred daily reset time (e.g., 0000-2359 UTC).
## Credits & Transparency
### Development
This indicator was developed with the assistance of AI technology to implement complex ORB trading logic.
The strategy concept, feature specifications, and trading logic were designed by the publisher. The implementation leverages modern development tools to ensure:
Clean, efficient, and maintainable code
Comprehensive error handling and input validation
Detailed documentation and user guidance
Performance optimization
### Trading Concepts
This indicator implements several public domain trading concepts:
Opening Range Breakout (ORB): Trading strategy popularized by Toby Crabel, Mark Fisher and many more talanted traders.
Fair Value Gap (FVG): Price imbalance concept from ICT methodology
SuperTrend: ATR-based trend indicator using public formula
Risk/Reward Ratio: Standard risk management principle
All mathematical formulas and technical concepts used are in the public domain.
### Pine Script
Uses standard TradingView built-in functions:
ta.ema(), ta.atr(), ta.vwap(), ta.highest(), ta.lowest(), request.security()
No external libraries or proprietary code from other authors.
## Disclaimer
This indicator is provided for educational and informational purposes only. It is not financial advice.
Trading involves substantial risk of loss and is not suitable for every investor. Past performance shown in examples is not indicative of future results.
The indicator provides signals and calculations, but trading decisions are solely your responsibility. Always:
Test strategies on paper before using real money
Never risk more than you can afford to lose
Understand that all trading involves risk
Consider seeking advice from a licensed financial advisor
The publisher makes no guarantees regarding accuracy, profitability, or performance. Use at your own risk.
---
Version: 3.0
Pine Script Version: v6
Last Updated: October 2024
For support, questions, or suggestions, please comment below or send a private message.
---
Happy trading, and remember: consistent risk management beats perfect entry timing every time.

GEEKSDOBYTE IFVG w/ Buy/Sell Signals1. Inputs & Configuration
Swing Lookback (swingLen)
Controls how many bars on each side are checked to mark a swing high or swing low (default = 5).
Booleans to Toggle Plotting
showSwings – Show small triangle markers at swing highs/lows
showFVG – Show Fair Value Gap zones
showSignals – Show “BUY”/“SELL” labels when price inverts an FVG
showDDLine – Show a yellow “DD” line at the close of the inversion bar
showCE – Show an orange dashed “CE” line at the midpoint of the gap area
2. Swing High / Low Detection
isSwingHigh = ta.pivothigh(high, swingLen, swingLen)
Marks a bar as a swing high if its high is higher than the highs of the previous swingLen bars and the next swingLen bars.
isSwingLow = ta.pivotlow(low, swingLen, swingLen)
Marks a bar as a swing low if its low is lower than the lows of the previous and next swingLen bars.
Plotting
If showSwings is true, small red downward triangles appear above swing highs, and green upward triangles below swing lows.
3. Fair Value Gap (3‐Bar) Identification
A Fair Value Gap (FVG) is defined here using a simple three‐bar logic (sometimes called an “inefficiency” in price):
Bullish FVG (bullFVG)
Checks if, two bars ago, the low of that bar (low ) is strictly greater than the current bar’s high (high).
In other words:
bullFVG = low > high
Bearish FVG (bearFVG)
Checks if, two bars ago, the high of that bar (high ) is strictly less than the current bar’s low (low).
In other words:
bearFVG = high < low
When either condition is true, it identifies a three‐bar “gap” or unfilled imbalance in the market.
4. Drawing FVG Zones
If showFVG is enabled, each time a bullish or bearish FVG is detected:
Bullish FVG Zone
Draws a semi‐transparent green box from the bar two bars ago (where the gap began) at low up to the current bar’s high.
Bearish FVG Zone
Draws a semi‐transparent red box from the bar two bars ago at high down to the current bar’s low.
These colored boxes visually highlight the “fair value imbalance” area on the chart.
5. Inversion (Fill) Detection & Entry Signals
An inversion is defined as the price “closing through” that previously drawn FVG:
Bullish Inversion (bullInversion)
Occurs when a bullish FVG was identified on bar-2 (bullFVG), and on the current bar the close is greater than that old bar-2 low:
bullInversion = bullFVG and close > low
Bearish Inversion (bearInversion)
Occurs when a bearish FVG was identified on bar-2 (bearFVG), and on the current bar the close is lower than that old bar-2 high:
bearInversion = bearFVG and close < high
When an inversion is true, the indicator optionally draws two lines and a label (depending on input toggles):
Draw “DD” Line (yellow, solid)
Plots a horizontal yellow line from the current bar’s close price extending five bars forward (bar_index + 5). This is often referred to as a “Demand/Daily Demand” line, marking where price inverted the gap.
Draw “CE” Line (orange, dashed)
Calculates the midpoint (ce) of the original FVG zone.
For a bullish inversion:
ce = (low + high) / 2
For a bearish inversion:
ce = (high + low) / 2
Plots a horizontal dashed orange line at that midpoint for five bars forward.
Plot Label (“BUY” / “SELL”)
If showSignals is true, a green “BUY” label is placed at the low of the current bar when a bullish inversion occurs.
Likewise, a red “SELL” label at the high of the current bar when a bearish inversion happens.
6. Putting It All Together
Swing Markers (Optional):
Visually confirm recent swing highs and swing lows with small triangles.
FVG Zones (Optional):
Highlight areas where price left a 3-bar gap (bullish in green, bearish in red).
Inversion Confirmation:
Wait for price to close beyond the old FVG boundary.
Once that happens, draw the yellow “DD” line at the close, the orange dashed “CE” line at the zone’s midpoint, and place a “BUY” or “SELL” label exactly on that bar.
User Controls:
All of the above elements can be individually toggled on/off (showSwings, showFVG, showSignals, showDDLine, showCE).
In Practice
A bullish FVG forms whenever a strong drop leaves a gap in liquidity (three bars ago low > current high).
When price later “fills” that gap by closing above the old low, the script signals a potential long entry (BUY), draws a demand line at the closing price, and marks the midpoint of that gap.
Conversely, a bearish FVG marks a potential short zone (three bars ago high < current low). When price closes below that gap’s high, it signals a SELL, with similar lines drawn.
By combining these elements, the indicator helps users visually identify inefficiencies (FVGs), confirm when price inverts/fills them, and place straightforward buy/sell labels alongside reference lines for trade management.

Inverse Fair Value Gap [Pro+]Introduction
Inverse Fair Value Gap° is a fully customizable charting tool built to track inversion fair value gap logic that occur after displacement events—specifically when Fair Value Gaps (FVGs) are closed through, and effectively flipping their original state. The tool is inspired by Inner Circle Trader (ICT) concepts, offering a clean visual interface to support traders studying price behaviour after liquidity sweeps, FVG closures, and highlighting mechanical swings targets.
This indicator does not draw zones or suggest direction. It operates entirely on confirmed price events and produces logic-bound visuals designed for traders who already understand IFVG-based reasoning and seek visual consistency across sessions, Timeframe on any instrument.
Key Terms and Definitions
Swing High / Swing Low: A swing high is a local price peak with lower highs on either side. A swing low is a local trough with higher lows on either side. These are used to detect where liquidity may rest and are required for confirming the initial raid condition in the IFVG model.
Liquidity Raid: This occurs when price trades through a prior swing high or low, effectively “sweeping” a level where orders may be clustered around. The raid is a required precursor to inversion logic in this model. The tool will not evaluate a potential Fair Value Gap or Inversion Fair Value Gap unless a swing high or low has been taken first.
Fair Value Gap (FVG): A Fair Value Gap is a price imbalance that occurs when a strong move leaves a gap between candles—specifically, when the high of one candle and the low of a later candle do not overlap. FVGs often emerge during displacement and are commonly studied as inefficiencies within a price leg.
Inversion Fair Value Gap: An inversion happens when price fully closes through an existing Fair Value Gap that raided liquidity, suggesting the original imbalance rebalanced, and looks to reverse its original role. For example, when a bearish FVG is closed above after raiding a swing low, it may present a shift in orderflow (bullish inversion). The tool recognizes IFVGs as “inverted” after a candle body candle closes through the gap post raid.
Displacement: A strong directional price move, typically with momentum, that leaves a Fair Value Gap behind. Displacement is important in inversion logic, as it creates the context and confidence in comparing and contrasting FVGs and Inversions for obvious flips in market behaviour.
IFVG Line: Once inversion occurs, the indicator draws a single horizontal array on the candle's close. It marks the start of model activation. This is not a prediction level or a support/resistance area, as it merely serves as a reference for when model logic is sequentially active.
Opposing Swing: The swing high or low opposite the one that was swept during the initial raid. This becomes the model’s first target for mechanical delivery and is automatically drawn once the IFVG line is plotted. When price reaches this swing, the model has reached its mechanical objective and could offer opportunities for further continuation to additional liquidity pools if orderflow continues to be present.
Invalidation: The Inversion Fair Value Gap is considered invalid in one of two scenarios, which the user can toggle individually: a body print back above/below the inversion in bearish/bullish conditions, or trading above/below the most recent swing high/low after the liquidity raid. The IFVG line will continue extending until the setup is invalidated by the chosen toggle, or when the Opposing Swing is reached.
Consequent Encroachment (CE): The midpoint (50%) of the FVG or IFVG. This line can be optionally displayed for users who use the midpoint of imbalances for reference of imbalance respect. It is not required by the model’s internal logic but may assist with discretionary interpretation.
Description
At its core, IFVG° follows a structured three-step logic sequence: a FVG is created, liquidity is taken, and the Fair Value Gap (FVG) inside of the leg of the raid is closed through, signally a potential orderflow shift. Once inversion is confirmed, an IFVG line is plotted at the close of the candle that caused the inversion, making it the structural anchor for the model.
The tool does not account for partial fills or candle wicks for FVGs or IFVGs. Only full-body closures through a qualifying FVG are recognized. When this occurs, a bullish or bearish inversion is plotted and the model becomes active. From there, the opposing swing (the unswept high or low from the displacement leg) is automatically drawn as the target for the model.
The model remains active until either the opposing swing is tagged (completion) or Invalidation Condition is triggered (close through IFVG, or price violating the liquidity raid swing). Upon invalidation, the IFVG line turns gray, signaling that the structure is no longer valid for ongoing tracking.
Key Features
The Bias allows traders to define whether to track bullish inversions (closing above bearish FVGs), bearish inversions (closing below bullish FVGs), or neutral to see both. This allows isolated directional focus as well as the ability to display all models.
The Liquidity Timeframe defines the Timeframe for swing highs and lows that are identified for the required liquidity raid. The Chart mode allows analysts to use the active chart Timeframe. Auto enables a pre-defined Timeframe Alignment, explained inside of the setting tooltip. Custom allows for user-defined Timeframe alignment, which is helpful when syncing with specific higher-Timeframe structures. Session allows the user to use session highs and lows for the liquidity raid. Observe the difference in the IFVG' model activations based on different Liquidity Timeframe configurations:
Chart:
Automatic:
Custom (4H):
Session:
The FVG Filter Timeframe requires the IFVG setup to trade into a FVG before qualifying the raid filter. For instance, setting this to 4H ensures that only setups that form within a 4-hour FVG. This gives analysts an additional filter to qualify the start of the mechanical model.
The Session Filter enables traders to define up to four specific Time blocks when the model is permitted to trigger. The Macros Only toggle filters setups further by limiting activation to the first and last 10 minutes of each hour, a filter inspired for intraday traders and scalpers.
The Invalidation Condition determines when a IFVG is considered no longer valid. The Close option will maintain the inversion as active until price prints a body past the IFVG. Swing will maintain the inversion as active until the most recent swing from the liquidity raid is traded through; in this case a warning icon will appear once price prints a candle body past the IFVG.
Model Style includes customizable controls for the IFVG line, the opposing swing marker, and invalidated states. Label appearance, line styles, and extension behaviour are fully user-controlled. Traders can also enable the Consequent Encroachment (CE) line, which marks the 50% midpoint of the FVG.
An Info Table is available to display the charts Timeframe, current model state, toggled bias, active Timeframes, asset, and Time filter. Its position is fully customizable and can be moved to match chart preferences.
How Traders Can Use the Indicator Effectively
IFVG° is not meant to identify trade signals, entries, or exits. It is best used as a visual tracker and confluence for structure-based delivery. The tool excels as a companion for:
Journaling and reviewing IFVG-based setups across Timeframes and sessions
Studying structural completion or invalidation behaviour
Tracking delayed deliveries and retracement-based logic
Traders using the tool should be familiar with FVG formations, inversion criterias, and the importance of orderflow once an opposing swing is reached.
Usage Guidance
Add the IFVG° to a TradingView chart. This is a fractal script and can be applied across any Timeframe or asset pairing.
Use the IFVG line to track inversion structure, monitor when inversions are created and negated, and reference the opposing swing to determine whether structural delivery has completed.
Use the IFVG in combination with your own discretion and narrative to assess when the model has flipped, held, or broken.
Terms and Conditions
Our charting tools are products provided for informational and educational purposes only and do not constitute financial, investment, or trading advice. Our charting tools are not designed to predict market movements or provide specific recommendations. Users should be aware that past performance is not indicative of future results and should not be relied upon for making financial decisions. By using our charting tools, the purchaser agrees that the seller and the creator are not responsible for any decisions made based on the information provided by these charting tools. The purchaser assumes full responsibility and liability for any actions taken and the consequences thereof, including any loss of money or investments that may occur as a result of using these products. Hence, by purchasing these charting tools, the customer accepts and acknowledges that the seller and the creator are not liable nor responsible for any unwanted outcome that arises from the development, the sale, or the use of these products. Finally, the purchaser indemnifies the seller from any and all liability. If the purchaser was invited through the Friends and Family Program, they acknowledge that the provided discount code only applies to the first initial purchase of any Toodegrees product. The purchaser is therefore responsible for cancelling – or requesting to cancel – their subscription in the event that they do not wish to continue using the product at full retail price. If the purchaser no longer wishes to use the products, they must unsubscribe from the membership service, if applicable. We hold no reimbursement, refund, or chargeback policy. Once these Terms and Conditions are accepted by the Customer, before purchase, no reimbursements, refunds or chargebacks will be provided under any circumstances.
By continuing to use these charting tools, the user acknowledges and agrees to the Terms and Conditions outlined in this legal disclaimer.
Script a pagamento

Price Action SuiteThe TRN Price Action Suite incorporates a treasure trove of time and price action concepts. It includes a set of trading tools that, when combined, allow for a more accurate view of the market. This enables traders to find high probability entry points before the market moves to the next liquidation level.
Features of the TRN Price Action Suite:
(Inverse) Fair Value Gaps (FVG)
Order Blocks (OB)
FVG and OB with Cumulative Volume Delta
Volume Imbalances
Market Structure
Liquidity levels
Sessions
Kill zones/Opening Range
The indicator helps traders to easily identify favorable market conditions and high probability trade setups. It automatically finds time and price action concepts and displays them in an intuitive way on the chart. One of the highlights is the detection of Fair Value Gaps and Order Blocks in connection with Cumulative Volume Delta (approx.). You will not find this connection anywhere else.
Fair Value Gaps (FVGs)
A fair value gap occurs when there are inefficiencies in the market or imbalanced buying and selling pressures. Fair value gaps can become a magnet for the price before continuing in the same direction. Special attention should be paid to FVGs that are supported by support and resistance levels, as these offer a higher probability of success for trades. Additionally, the indicator plots inverse FVG (iFVG). These are FVG that are “closed” by a FVG in the other direction. IFVGs are a strong sign of the market to continue in the direction of the iFVG.
In addition to the FVGs you see on the chart, you can add also FVGs from a higher timeframe including the cumulative buy/sell volume. For this you can set “Timeframe 1” and “Timeframe 2” in the settings to your preferred timeframes. E.g. you trade on a 5-minute chart, and you want to see FVGs from 4 hours and a daily chart, then you set Timeframe 1 to 4 h and to Timeframe 2 to 1 D.
Order Blocks and Volume Imbalances can also be shown from higher timeframes.
Order Blocks (OBs)
Order blocks are areas on the chart where a high concentration of limit orders was found in the past. They can serve as potential support or resistance areas. These represent areas in the market where there is an oversupply (supply) or an excess demand (demand). They are often key zones for potential turning points or continuations of the current trend. A bullish OB, for example, is the last bearish candle before a significant uptrend.
FVGs and OBs with Cumulative Volume Delta
The TRN Price Action Suite can show FVGs and OBs with the corresponding Cumulative Volume Delta (CVD). It is a metric to analyze market dynamics by tracking the net difference between buying and selling volumes over a specific timeframe. It is used to determine the strength of the FVG/OB. The FVG/OB includes two bars on the left side, indicating the cumulative buy volume in green as well es the cumulative sell volume in red. At the right side of the FVG/OB box the ratio of the cumulative buy/sell volume is displayed. A high ratio over 1, for example 1.5, indicates a lot of buying pressure. On the hand, a ratio far below 1, for example 0.66, indicates a lot of selling pressure.
Volume Imbalances (VIBs)
Volume Imbalances indicate a price gap from the previous close, but unlike gaps, there is no absence of trading activity within a specific price range. Bullish VIs have opening and closing prices above the previous close, with overlap between the current low and previous high. Bearish VIs are vice versa.
Market Structure
The market structure represents the dominant trend in the market. It is based on swing highs and lows. For instance, if the price makes higher highs (HH) and higher lows (HL) the market structure represents an uptrend. Vice versa if price makes lower lows (LL) and lower highs (LH) the market trend is down.
If the market structure is up, traders can enter positions in a pullback. For this, a trader could use a FVG or an OB as an entry condition.
Market Structure Shift (MSS) (Change of Character (ChoCh))
A market structure shift occurs when the market transitions from one dominant trend to a different one, often signaling a potential change in the underlying market dynamics. A MSS signals the start of a new trend. It signals the change from an uptrend to a down trend and vice versa. Therefore, it is sometimes called change of character (ChoCh). A valid MSS should ideally occur in a strong supply or demand zone. This indicates that the market may be approaching a trend reversal or consolidation.
Break of Structure (BOS)
A break of structure happens when the market breaks out of its established trading range or pattern. The market continues its dominant trend, indicated by the last MSS.
In an uptrend, for example, each time the price breaks through a new high, a "bullish BOS" is formed. This indicates that the market can overcome previous resistance levels and continue to rise.
Levels
One core concept in trading is that price flows to areas of liquidity. Natural liquidity areas are the current day open, high, low (CDO, CDH, CDL) or the previous day high, low, close (PDH, PDL, PDC). The same is true for the current week (CWO, CWH, CWL) and the previous week (PWH, PWL, PWC).
Pay special attention in case some of these levels are close together. Then these levels serve like a magnet for the price. The TRN Price Action Suite indicator can cluster these levels fully automatically together to give the trader the flexibility to focus solely on the trading part.
Sessions
Sessions are the trading hours during which the banks are actively trading. The three main trading sessions:
Asia: Most of the volume from the Asian players are handled within this session.
London: This is where the European players are most active.
New York: In the New York session all the USA players are active as well as all the other American players. Furthermore, a lot of global players are active in this session as well.
Killzones
A kill zone in trading refers to a specific time period during the trading day when the market experiences increased volatility and liquidity. It is an opportunity for traders to capitalize on potential price movements and generate profits. There are several different killzones during the day.
There are three different types of killzones:
Indices/Futures: This one is suitable if you trade products like the ES, NQ, FDAX, CL or Stocks, Options.
Forex: If you trade Forex this setting will mark the most liquid periods of the day.
Opening Range: In case you trade the opening range of the sessions, use this setting.
Trading Example
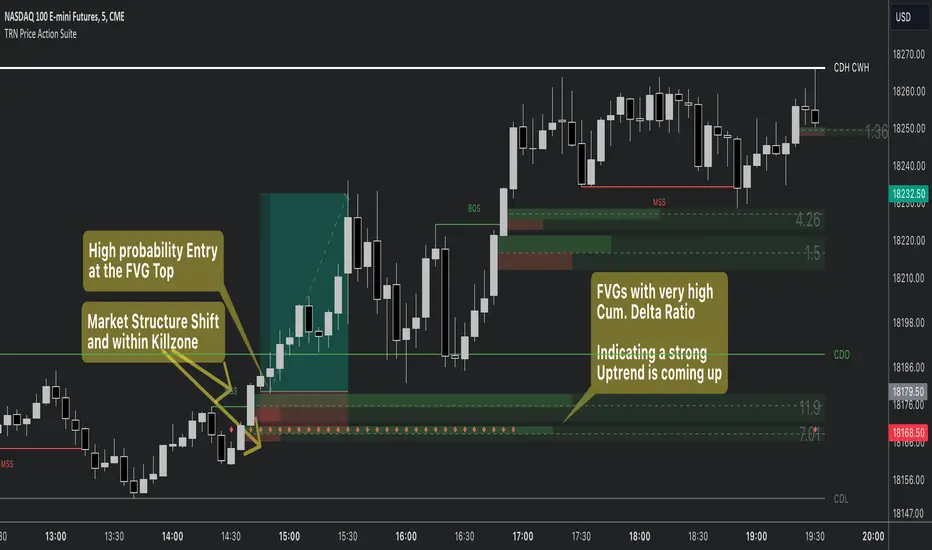
Price Action Toolkit | Flux Charts💎 GENERAL OVERVIEW
Introducing our new Price Action Toolkit indicator! Price Action Toolkit integrates key level strategy , traditional supply-demand analysis , and market structures to help traders in their decisions. Now with features that are available to use in multiple timeframes!
Features of the new Price Action Toolkit indicator :
Volumized Fair Value Gaps (FVGs)
Volumized Order & Breaker Blocks
Identification of Market Structures
Equal Highs & Lows
Buyside & Sellside Liquidity
Premium & Discount Zones
MTF Highs & Lows (Daily, Weekly, Monthly, Pre-Market)
Customizable Settings
📌 HOW DOES IT WORK ?
We believe that the analytical elements that are within this indicator work best when they co-exist with each other on the chart. Trading often requires taking multiple elements into consideration for better accuracy on market analysis. Thus, we combined some of the useful strategies in one indicator for ease of use.
1. Volumized Fair Value Gaps
Fair value gaps often occur when there is an imbalance in the market, and can be spotted with a specific formation on the chart.
The volume when the FVG occurs plays an important role when determining the strength of it, so we've placed two bars on the FVG zone, indicating the high & low volumes of the FVG. The high volume is the total volume of the last two bars on a bullish FVG, while the low volume is - of the FVG. For a bearish FVG, the total volume of the last two bars is the low volume. The indicator can also detect FVGs that exist in other timeframes than the current chart.
2. Volumized Order Blocks
Order blocks occur when there is a high amount of market orders exist on a price range. It is possible to find order blocks using specific formations on the chart.
The high & low volume of order blocks should be taken into consideration while determining their strengths. The determination of the high & low volume of order blocks are similar to FVGs, in a bullish order block, the high volume is the last 2 bars' total volume, while the low volume is the oldest bar's volume. In a bearish order block scenerio, the low volume becomes the last 2 bars' total volume.
3. Volumized Breaker Blocks
Breaker blocks form when an order block fails, or "breaks". It is often associated with market going in the opposite direction of the broken order block, and they can be spotted by following order blocks and finding the point they get broken, ie. price goes below a bullish order block.
The volume of a breaker block is simply the total volume of the bar that the original order block is broken. Often the higher the breaking bar's volume, the stronger the breaker block is.
4. Market Structures
Sometimes specific market structures form and break as the market fills buy & sell orders. Formed Change of Character (CHoCH) and Break of Structure (BOS) often mean that market will change direction, and they can be spotted by inspecting low & high pivot points of the chart.
5. Equal Highs & Lows
Equal Highs & Lows occur when there is a significant amount of difference between a candle's close price and it's high / low value, and it happens again in a specific range. EQH and EQL usually mean there is a resistance that blocks the price from going further up / down.
6. Buyside & Sellside Liquidity
Buyside & Sellside Liquidity zones are where most traders place their take-profits and stop-losses in their long / short positions. They are spotted by using high & low pivot points on the chart.
7. Premium & Discount Zones
The premium zone is a zone that is over the fair value of the asset's price, and the discount zone is the opposite. They are formed by the latest high & low pivot points.
8. MTF Highs / Lows
MTF Highs / Lows are actually pretty self-explanatory, you can enable / disable Daily, Weekly, Monthly & Pre-Market Highs and Lows.
🚩UNIQUENESS
Our new indicator offers a comprehensive toolkit for traders, combining multiple analytical elements with customizable settings to aid in decision-making across different market conditions and timeframes. The volumetric information of both FVGs and Order & Breaker Blocks will be present in your chart to serve you greater detail about them. The indicator also efficiently identifies market structures, liquidity zones and premium & discount zones to give you an insight about the current state of the market. And finally with the use of multiple timeframes , you can easily take a look at the bigger picture. We recommend reading the "How Does It Work" section of the descripton to get a better understanding about how this indicator is unique to others.
⚙️SETTINGS
1. General Configuration
Show Historic Zones -> This will show historic Fair Value Gaps, Order & Breaker Blocks and Sellside & Buyside liquidities which are expired.
2. Fair Value Gaps
Enabled -> Enables / Disables Fair Value Gaps
Volumetric Info -> The volumetric information of the FVG Zones will be rendered if activated.
Zone Invalidation -> Select between Wick & Close price for FVG Zone Invalidation.
Zone Filtering -> With "Average Range" selected, algorithm will find FVG zones in comparison with average range of last bars in the chart. With the "Volume Threshold" option, you may select a Volume Threshold % to spot FVGs with a larger total volume than average.
FVG Detection -> With the "Same Type" option, all 3 bars that formed the FVG should be the same type. (Bullish / Bearish). If the "All" option is selected, bar types may vary between Bullish / Bearish.
Detection Sensitivity -> You may select between Low, Normal or High FVG detection sensitivity. This will essentially determine the size of the spotted FVGs, with lower sensitivies resulting in spotting bigger FVGs, and higher sensitivies resulting in spotting all sizes of FVGs.
3. Order Blocks
Enabled -> Enables / Disables Order Blocks
Volumetric Info -> The volumetric information of the Order Blocks will be rendered if activated.
Zone Invalidation -> Select between Wick & Close price for Order Block Invalidation.
Swing Length -> Swing length is used when finding order block formations. Smaller values will result in finding smaller order blocks.
4. Breaker Blocks
Enabled -> Enables / Disables Breaker Blocks
Volumetric Info -> The volumetric information of the Breaker Blocks will be rendered if activated.
Zone Invalidation -> Select between Wick & Close price for Breaker Block Invalidation.
5. Timeframes
You can set and enable / disable up to 3 timeframes. Note that only higher timeframes than the current chart will work.
6. Market Structures
Break Of Structure ( BOS ) -> If the current structure of the market is broken in a bullish or bearish direction, it will be displayed.
Change Of Character ( CHoCH ) -> If the market shifts into another direction, it will be displayed.
Change Of Character+ ( CHoCH+ ) -> This will display stronger Change Of Characters if enabled.
7. Equal Highs & Lows
EQH -> Enables / Disables Equal Highs.
EQL -> Enables / Disables Equal Lows.
ATR Multiplier (0.1 - 1.0) -> Determines the maximum difference between highs / lows to be considered as equal. Lower values will result in more accurate results.
8. Buyside & Sellside Liquidity
Zone Width -> Determines the width of the liquidity zones, 1 = 0.025%, 2 = 0.05%, 3 = 0.1%.
9. Premium & Discount Zones
Enabled -> Enables / Disables Premium & Discount Zones.
10. MTF Highs / Lows
You can enable / disable Daily, Weekly, Monthly & Pre-Market Highs and Lows using this setting. You can also switch their line shapes between solid, dashed and dotted.

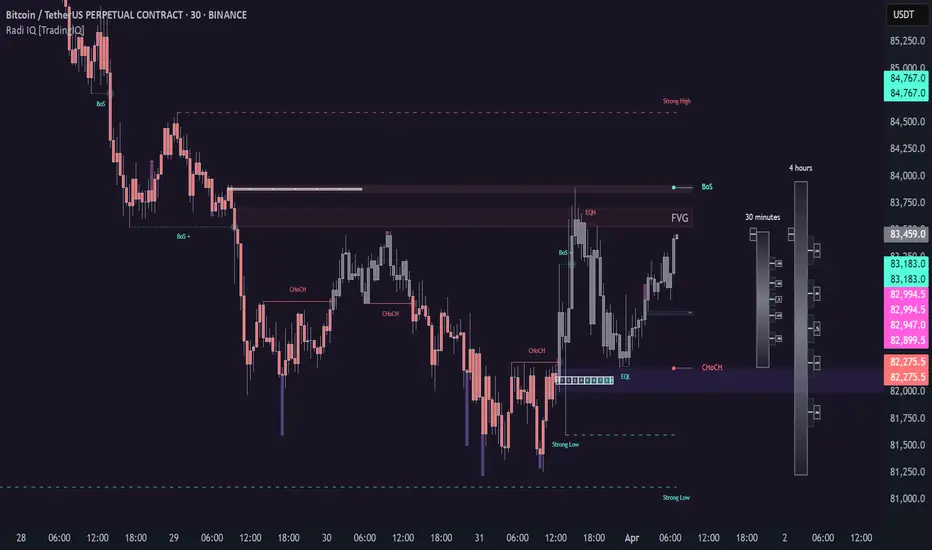
Radi IQ [TradingIQ]Introducing "Radi IQ".
Radi IQ is a comprehensive market structure indicator designed to provide traders with a detailed view of key price levels and market behavior. It combines several analytical methods—including internal and external structure analysis, fair value gaps, order blocks, breaker blocks, rejection blocks, premium discount zones, equal levels, directional liquidity grabs, and trend meters —to help users better understand areas of support and resistance, potential turning points, and liquidity events in the market.
Key Components and Their Functions
Market Structure Analysis
Internal and External Structure : The indicator evaluates market structure on two levels. The internal analysis focuses on immediate price action (e.g., recent support/resistance and swing points), while the external analysis uses a higher timeframe to provide context. This dual approach helps to confirm the strength of key levels by comparing short-term moves with the broader market trend.
Break of Structure (BoS) and Change of Character (CHoCH) : These signals highlight moments when the market shifts its behavior. A BoS indicates that a previous level of support or resistance has been overcome, while a CHoCH signals a change in the market’s character. Both are marked clearly on the chart using distinct color codes.
Break of Structure + (BoS+) and Change of Character + (CHoCH+) : These signals highlight moments when the market shifts its behavior and is confirmed by prior price action. A BoS + indicates that a previous level of support or resistance has been overcome, while price action achieves higher highs and higher lows (resistance break) or lower highs and lower lows (support break). CHoCH + signals a change in the market’s character when supported by prior price action - lower highs for a support break and higher lows for a resistance break.
BoS and CHoCH
The image above shows BoS and CHoCH identified on the price chart, and explains what each signifies.
A Break Of Structure (BoS) occurs when price decisively moves beyond a previously established support or resistance level. It indicates that the current trend or market pattern is being challenged, and the market may be ready to change direction.
A Change of Character (CHoCH) describes a shift in how the market behaves. A CHoCH occurs when, in an uptrend, a previously established support level breaks, or in a downtrend, a previously established resistance level breaks.
This break indicates that the market's typical structure is shifting, suggesting that the current trend may be losing its strength and that a reversal or a new trend could be developing.
CHoCH+
The image above explains CHoCH+ and how it forms, while highlighting an instance where a downside CHoCH+ formed following lower highs.
A Change of Character + (CHoCH+) describes a shift in how the market behaves that is supported by prior price action. For support breaks, price must form lower highs before breaking support.
The image above explains CHoCH+ for resistance breaks, while highlighting an instance where a resistance point broke that was supported by prior price action.
BoS+
The image above explains BoS+ and how it forms, while highlighting an instance where an upside BoS+ formed following higher highs and higher lows.
A BoS+ resistance break requires higher highs and higher lows prior to the resistance point being closed over.
The image above explains BoS+ support break, while highlighting an instance where a downside BoS+ formed following lower highs and lower lows.
A BoS+ support break requires lower highs and lower lows prior to the support point being closed under.
Future BoS and CHoCH
Radi IQ also displays where the next BoS and CHoCH points are located.
The image above shows the feature in action. With this, traders will always know where the next key support/resistance breakpoints are before they actually occur.
Fair Value Gaps (FVG)
The indicator identifies gaps in the price where little or no trading occurred—known as fair value gaps. These gaps can act as temporary support or resistance and may indicate areas where the market is likely to correct. FVGs are displayed with clear color gradients that differentiate between upward and downward gaps.
The image above shows an identified upside FVG. In the image, the identified upside FVG acted as a support point for price.
The image above shows an identified downside FVG. In the image, the identified downside FVG acted as a resistance point for price.
Low Volume FVG
In addition to identifying trading FVGs - Radi IQ can also specifically detect low volume fair value gaps. Ideally, these fair value gaps will form inside a low volume node on a volume profile.
Low volume node FVGs are important because these are areas where very little trading occurred and is confirmable, indicating an imbalance in supply and demand. Since few trades took place there, the market often moves quickly through these zones when revisited, which can lead to rapid price changes. This "gap" in trading activity can serve as a signal for potential reversals or fast moves, offering opportunities to enter or exit positions based on expected market behavior.
The image above shows identified FVGs that formed on low volume.
Large Area FVGs
Radi IQ is also capable of filtering out “inconsequential” FVGs. With this, Radi IQ can be enabled to only mark FVGs that cover a wide price range.
The image above shows the feature enabled, and all identified FVGs formed with a wide price range.
Large Area FVGs and Low Volume FVGs Combined
Traders can also enable Radi IQ to only mark FVGs that form on low volume and have a wide price range - allowing traders to only identify the highest quality FVGs on the chart.
Order Blocks and Premium Discount Zones
Order Blocks: Radi IQ detects areas where large orders have previously been placed by institutional traders. These blocks can act as strong levels of support or resistance, and the indicator marks bullish and bearish order blocks with dedicated colors.
What is an order block?
Order blocks are clusters of orders that institutions have executed to enter or exit a market position. They typically form when there is a period of consolidation before a significant move. For example, the last bullish candle before a strong down move may indicate a supply order block, while the last bearish candle before a sharp rally might be considered a demand order block.
Why They Form:
Institutions don’t trade in small, sporadic amounts; they accumulate or distribute large volumes of an asset. To avoid slippage and minimize market impact, they execute these orders over a zone rather than at a single price point. This creates a recognizable “block” on the chart.
Order Block Identification Types
Strength Score
The “Strength Score” order block detection mode is a TradingIQ proprietary ranking system for identified order blocks.
Purpose
The purpose of the “Strength Score” ranking system is to determine the “strength” or significance of an order block and rate the zone’s likelihood to act as support/resistance when retested in the future.
The scoring system ranks from 0 - 10, with “0” indicating a “weak” score or low likelihood of acting as a key support/resistance level when retested in the future.
A rating of “5” indicates a “moderate” score, indicating that the order block has a moderate likelihood of acting as a key support/resistance level when retested in the future.
A rating of “10” indicates a “strong” score, indicating that the order block has a strong likelihood of acting as a key support/resistance level when retested in the future.
How It Works
The score is calculated by examining the price move following the formation of an order block. The stronger the price move after an order block forms - the higher the Strength Score.
The image above shows a bearish order block with a score of “5” identified on the chart. The order block successfully operates as a resistance point when retested.
The image above shows a bullish order block with a score of “5” identified on the chart. The order block successfully operates as a resistance point when retested.
Volume-Based
The volume-based order block detection method detects traditional order blocks, but goes one step further by identifying the highest concentration point of volume for the bar and drawing the order block around this concentration point.
Key features when using the volume-based order block detection method:
The top of the order block is anchored to the top of the highest volume concentration point of the bar
The bottom of the order block is anchored to the bottom of the highest volume concentration point of the bar
The total volume that went into creation of the order block is displayed on the chart
The total volume of the order block is recorded as a percentage relative to the total volume for all order blocks on the chart
The image above shows the detection method in action.
Breaker Blocks
A breaker block is a specific type of order block that gains significance when price breaks through it and then often retests the level as a new area of support or resistance. Essentially, it’s a zone where, after the initial break, the previous level (which once acted as strong support or resistance) flips roles. For example, in an uptrend, if the price falls below a key support level, that level can become a breaker block and act as resistance if the price tries to move back up. Conversely, in a downtrend, a broken resistance level can serve as new support. Traders monitor breaker blocks because they often mark a shift in market sentiment and can provide potential entry or exit points once the market re-engages with these levels.
The image above shows a breaker block above price acting as resistance.
The image above shows a breaker block below price acting as support.
Rejection Blocks
A rejection block is a price area where the market shows a strong unwillingness to move beyond a certain level. This typically happens when price approaches a specific level but then is quickly rejected, leading to a bounce in the opposite direction. In other words, a rejection block forms when traders' orders create a barrier, causing the price to reverse rather than break through. Traders watch these areas closely, as they often signal a strong concentration of supply or demand that could provide potential entry or exit points for trades.
The image above shows both a verified upside rejection block acting as resistance, and an untested downside rejection block.
Rejection blocks are expected to function as strong support/resistance points when retested in the future.
Premium Discount Zones
Premium Discount Zones : These zones reflect areas where price is trading above (premium) or below (discount) a fair value range. They help traders gauge whether the current market price is relatively high or low compared to historical averages.
Premium Discount Zones account for recent swing highs and lows to calculate a fair value along with discount and premium prices over an intermediate time window.
The image above shows the premium and discount price zones in action.
Equal Levels
The indicator also tracks and highlights equal levels, which occur when the market repeatedly tests the same price levels. Equal levels can reinforce the significance of a support or resistance area and are represented by their own set of color markers.
The image above shows Radi IQ distinguishing equal highs and equal lows.
Equal Highs
When you see two or more highs that are approximately the same, it suggests that the market is repeatedly rejecting attempts to push higher. This signals a strong resistance level where sellers (or stop-hunters) are active.
Equal Lows
Similarly, consecutive lows at the same level indicate strong support, where buyers step in consistently, preventing further decline.
Strong Highs and Lows
Strong High
A strong high is a price level where the market repeatedly fails to push higher. Typically, it’s characterized by:
Rejection: Price approaches the high but then reverses sharply, often leaving long upper wicks on the candlestick chart.
Consolidation: Multiple bars might show highs that are very close in value (often termed "equal highs"), indicating a well-established resistance zone.
Market Sentiment: This pattern suggests that sellers are actively defending that level, preventing further upward movement.
Strong Lows
Conversely, a strong low is a price level where the market repeatedly fails to break lower. It is identified by:
Bounce Back: Price touches the low and then rebounds sharply, often leaving long lower wicks.
Consistency: Multiple lows occur around the same level (sometimes referred to as "equal lows"), marking a solid support area.
Market Sentiment: This indicates that buyers are stepping in at that level, absorbing selling pressure and supporting the price.
The image above shows Radi IQ detecting both a strong high and strong low, while the detected strong low acts as support when retested.
Liquidity Grabs
Liquidity grabs occur when the market temporarily moves to absorb liquidity, often triggering stop-loss orders and leading to rapid price movements. Radi IQ flags these events by identifying conditions where price moves against recent pivots, helping traders spot potential liquidity-related reversals or breakouts.
The image above shows Radi IQ identifying both an upside liquidity grab and a downside liquidity grab.
Upside Liquidity Grab (Bearish)
An upside liquidity grab happens when the price moves above a well-known resistance area or recent high. This move is often short-lived.
Many traders place stop-loss orders or pending buy orders just above resistance levels. Institutional players may intentionally push price upward to trigger these orders, thereby “grabbing” the liquidity available at that level.
Downside Liquidity Grab (Bullish)
A downside liquidity grab is the mirror image: the price briefly dips below a key support level or recent low.
Traders often place stop-loss orders or pending sell orders just below support levels. An intentional drop below this support can trigger these stops, allowing institutional players to capture liquidity.
Multi-Timeframe Analysis and Swings
By using data from different timeframes, Radi IQ offers a broader perspective on market trends. It highlights significant swing highs and swing lows, providing visual cues that indicate the market’s directional bias. This feature assists traders in identifying both short-term opportunities and long-term trends.
The image above shows Radi IQ detecting higher swings and lower swings.
IQ Meters / Fibometer
IQ Meters (Fibometers) are a proprietary TradingIQ tool that allows traders to easily identify the highs and lows of the current trend and where current price is relative to these points.
The image above depicts the IQ Meters—an exclusive TradingIQ tool designed to help traders evaluate trend strength and retracement opportunities.
When the lower timeframe Zig Zag IQ and the higher timeframe Zig Zag IQ are out of sync (i.e., one is uptrending while the other is downtrending, with no active positions), the meters display a neutral color as shown in the image.
The key to using these meters is to identify trend unison and pinpoint key trend retracement entry opportunities. Fibonacci retracement levels for the current trend are interlaced along each meter, and the current price is converted to a retracement ratio of the trend.
These meters can mathematically determine where price stands relative to the larger and smaller trends, aiding in identifying entry opportunities.
The top of each meter indicates the highest price achieved during the current price move.
The bottom of each meter indicates the lowest price achieved during the current price move.
When both the larger and smaller trends are in sync and uptrending, or when a long position is active, the IQ meters turn green, indicating uptrend strength.
When both meters are green, it indicates uptrend strength as both the higher timeframe trend and lower timeframe trend are in unison. Look for price to retrace to key fibonacci retracement levels during this time period.
When both trends are in sync and downtrending, or when a short position is active, the IQ meters turn red, indicating downtrend strength.
When both meters are red, it indicates downtrend strength as both the higher timeframe trend and lower timeframe trend are in unison. Look for price to retrace to key fibonacci retracement levels during this time period.
Summary
Radi IQ serves as a robust, data-driven tool for traders who seek a deeper understanding of market structure. By integrating internal and external analysis, fair value gap detection, order block identification, premium discount zoning, equal level tracking, liquidity grabs and much more into one indicator, it offers a multi-layered view of the market. This helps traders not only recognize potential turning points and areas of market stress but also manage risk more effectively and plan their trades with greater precision. The indicator’s clear visual representation and dynamic updates make it a practical addition to any trader’s toolkit.
Script a pagamento
SIFVG [ULTRA+]Introduction
Sweep Inverse Fair Value Gap° is a fully customizable charting tool built to track inversion fair value gap logic that occur after displacement events—specifically when Fair Value Gaps (FVGs) are closed through, and effectively flipping their original state. The tool is inspired by Inner Circle Trader (ICT) concepts, offering a clean visual interface to support traders studying price behaviour after liquidity sweeps, FVG closures, and highlighting mechanical swings targets.
This indicator does not draw zones or suggest direction. It operates entirely on confirmed price events and produces logic-bound visuals designed for traders who already understand IFVG-based reasoning and seek visual consistency across sessions, Timeframe on any instrument.
Key Terms and Definitions
• Swing High / Swing Low: A swing high is a local price peak with lower highs on either side. A swing low is a local trough with higher lows on either side. These are used to detect where liquidity may rest and are required for confirming the initial raid condition in the IFVG model.
• Liquidity Raid: This occurs when price trades through a prior swing high or low, effectively “sweeping” a level where orders may be clustered around. The raid is a required precursor to inversion logic in this model. The tool will not evaluate a potential Fair Value Gap or Inversion Fair Value Gap unless a swing high or low has been taken first.
• Fair Value Gap (FVG): A Fair Value Gap is a price imbalance that occurs when a strong move leaves a gap between candles—specifically, when the high of one candle and the low of a later candle do not overlap. FVGs often emerge during displacement and are commonly studied as inefficiencies within a price leg.
• Inversion Fair Value Gap: An inversion happens when price fully closes through an existing Fair Value Gap that raided liquidity, suggesting the original imbalance rebalanced, and looks to reverse its original role. For example, when a bearish FVG is closed above after raiding a swing low, it may present a shift in orderflow (bullish inversion). The tool recognizes SIFVGs as “inverted” after a candle body candle closes through the gap post raid.
• Displacement: A strong directional price move, typically with momentum, that leaves a Fair Value Gap behind. Displacement is important in inversion logic, as it creates the context and confidence in comparing and contrasting FVGs and Inversions for obvious flips in market behaviour.
• SIFVG Line: Once inversion occurs, the indicator draws a single horizontal array on the candle's close. It marks the start of model activation. This is not a prediction level or a support/resistance area, as it merely serves as a reference for when model logic is sequentially active.
• Opposing Swing: The swing high or low opposite the one that was swept during the initial raid. This becomes the model’s first target for mechanical delivery and is automatically drawn once the IFVG line is plotted. When price reaches this swing, the model has reached its mechanical objective and could offer opportunities for further continuation to additional liquidity pools if orderflow continues to be present.
• Invalidation: The Sweep Inversion Fair Value Gap is considered invalid in one of two scenarios, which the user can toggle individually: a body print back above/below the inversion in bearish/bullish conditions, or trading above/below the most recent swing high/low after the liquidity raid. The SIFVG line will continue extending until the setup is invalidated by the chosen toggle, or when the Opposing Swing is reached.
• Consequent Encroachment (CE): The midpoint (50%) of the FVG or SIFVG. This line can be optionally displayed for users who use the midpoint of imbalances for reference of imbalance respect. It is not required by the model’s internal logic but may assist with discretionary interpretation.
• Description
At its core, SIFVG follows a structured three-step logic sequence: a FVG is created, liquidity is taken, and the Fair Value Gap (FVG) inside of the leg of the raid is closed through, signally a potential orderflow shift. Once inversion is confirmed, an SIFVG line is plotted at the close of the candle that caused the inversion, making it the structural anchor for the model.
The tool does not account for partial fills or candle wicks for FVGs or SIFVGs. Only full-body closures through a qualifying FVG are recognized. When this occurs, a bullish or bearish inversion is plotted and the model becomes active. From there, the opposing swing (the unswept high or low from the displacement leg) is automatically drawn as the target for the model.
Key Features
The Bias allows traders to define whether to track bullish inversions (closing above bearish FVGs), bearish inversions (closing below bullish FVGs), or neutral to see both. This allows isolated directional focus as well as the ability to display all models.
The Session Filter enables traders to define up to four specific Time blocks when the model is permitted to trigger. The Macros Only toggle filters setups further by limiting activation to the first and last 10 minutes of each hour, a filter inspired for intraday traders and scalpers.
How Traders Can Use the Indicator Effectively
SIFVG is not meant to identify trade signals, entries, or exits. It is best used as a visual tracker and confluence for structure-based delivery. The tool excels as a companion for:
Journaling and reviewing SIFVG-based setups across Timeframes and sessions
Studying structural completion or invalidation behaviour
Tracking delayed deliveries and retracement-based logic
Traders using the tool should be familiar with FVG formations, inversion criterias, and the importance of orderflow once an opposing swing is reached.
Usage Guidance
Add the SIFVG to a TradingView chart. This is a fractal script and can be applied across any Timeframe or asset pairing.
Use the SIFVG line to track inversion structure, monitor when inversions are created and negated, and reference the opposing swing to determine whether structural delivery has completed.
Use the SIFVG in combination with your own discretion and narrative to assess when the model has flipped, held, or broken.
Terms and Conditions
Our charting tools are products provided for informational and educational purposes only and do not constitute financial, investment, or trading advice. Our charting tools are not designed to predict market movements or provide specific recommendations. Users should be aware that past performance is not indicative of future results and should not be relied upon for making financial decisions. By using our charting tools, the purchaser agrees that the seller and the creator are not responsible for any decisions made based on the information provided by these charting tools. The purchaser assumes full responsibility and liability for any actions taken and the consequences thereof, including any loss of money or investments that may occur as a result of using these products. Hence, by purchasing these charting tools, the customer accepts and acknowledges that the seller and the creator are not liable nor responsible for any unwanted outcome that arises from the development, the sale, or the use of these products. Finally, the purchaser indemnifies the seller from any and all liability. If the purchaser was invited through the Friends and Family Program, they acknowledge that the provided discount code only applies to the first initial purchase of any Marcus product. The purchaser is therefore responsible for cancelling – or requesting to cancel – their subscription in the event that they do not wish to continue using the product at full retail price. If the purchaser no longer wishes to use the products, they must unsubscribe from the membership service, if applicable. We hold no reimbursement, refund, or chargeback policy. Once these Terms and Conditions are accepted by the Customer, before purchase, no reimbursements, refunds or chargebacks will be provided under any circumstances.
By continuing to use these charting tools, the user acknowledges and agrees to the Terms and Conditions outlined in this legal disclaimer.

Smart Money Concepts [XoRonX]# Smart Money Concepts (SMC) - Advanced Trading Indicator
## 📊 Deskripsi
**Smart Money Concepts ** adalah indicator trading komprehensif yang menggabungkan konsep Smart Money Trading dengan berbagai alat teknikal analisis modern. Indicator ini dirancang untuk membantu trader mengidentifikasi pergerakan institusional (smart money), struktur pasar, zona supply/demand, dan berbagai sinyal trading penting.
Indicator ini mengintegrasikan multiple timeframe analysis, order blocks detection, fair value gaps, fibonacci retracement, volume profile, RSI multi-timeframe, dan moving averages dalam satu platform yang powerful dan mudah digunakan.
---
## 🎯 Fitur Utama
### 1. **Smart Money Structure**
- **Internal Structure** - Struktur pasar jangka pendek untuk entry presisi
- **Swing Structure** - Struktur pasar jangka panjang untuk trend analysis
- **BOS (Break of Structure)** - Konfirmasi kelanjutan trend
- **CHoCH (Change of Character)** - Deteksi potensi reversal
### 2. **Order Blocks**
- **Internal Order Blocks** - Zona demand/supply jangka pendek
- **Swing Order Blocks** - Zona demand/supply jangka panjang
- Filter otomatis berdasarkan volatilitas (ATR/Range)
- Mitigation tracking (High/Low atau Close)
- Customizable display (jumlah order blocks yang ditampilkan)
### 3. **Equal Highs & Equal Lows (EQH/EQL)**
- Deteksi otomatis equal highs/lows
- Indikasi liquidity zones
- Threshold adjustment untuk sensitivitas
- Visual lines dan labels
### 4. **Fair Value Gaps (FVG)**
- Multi-timeframe FVG detection
- Auto threshold filtering
- Bullish & Bearish FVG boxes
- Extension control
- Color customization
### 5. **Premium & Discount Zones**
- Premium Zone (75-100% dari range)
- Equilibrium Zone (47.5-52.5% dari range)
- Discount Zone (0-25% dari range)
- Auto-update berdasarkan swing high/low
### 6. **Fibonacci Retracement**
- **Equilibrium to Discount** - Fib dari EQ ke discount zone
- **Equilibrium to Premium** - Fib dari EQ ke premium zone
- **Discount to Premium** - Fib full range
- Reverse option
- Show/hide lines
- Custom colors
### 7. **Volume Profile (VRVP)**
- Visible Range Volume Profile
- Point of Control (POC)
- Value Area (70% volume)
- Auto-adjust rows
- Placement options (Left/Right)
- Width customization
### 8. **RSI Multi-Timeframe**
- Monitor 3 timeframes sekaligus
- Overbought/Oversold signals
- Visual table display
- Color-coded signals (Red OB, Green OS)
- Customizable position & size
### 9. **Moving Averages**
- 3 Moving Average lines
- Pilihan tipe: EMA, SMA, WMA
- Automatic/Manual period mode
- Individual color & width settings
- Cross alerts (MA vs MA, Price vs MA)
### 10. **Multi-Timeframe Levels**
- Support up to 5 different timeframes
- Previous high/low levels
- Custom line styles
- Color customization
### 11. **Candle Color**
- Color candles berdasarkan trend
- Bullish = Green, Bearish = Red
- Optional toggle
---
## 🛠️ Cara Penggunaan
### **A. Setup Awal**
1. **Tambahkan Indicator ke Chart**
- Buka TradingView
- Klik "Indicators" → "My Scripts" atau paste code
- Pilih "Smart Money Concepts "
2. **Pilih Mode Display**
- **Historical**: Tampilkan semua struktur (untuk backtesting)
- **Present**: Hanya tampilkan struktur terbaru (clean chart)
3. **Pilih Style**
- **Colored**: Warna berbeda untuk bullish/bearish
- **Monochrome**: Tema warna abu-abu
---
### **B. Penggunaan Fitur**
#### **1. Smart Money Structure**
**Internal Structure (Real-time):**
- ✅ Aktifkan "Show Internal Structure"
- Pilih tampilan: All, BOS only, atau CHoCH only
- Gunakan untuk entry timing presisi
- Filter confluence untuk mengurangi noise
**Swing Structure:**
- ✅ Aktifkan "Show Swing Structure"
- Pilih tampilan struktur bullish/bearish
- Adjust "Swings Length" (default: 50)
- Gunakan untuk konfirmasi trend utama
**Tips:**
- BOS = Konfirmasi trend continuation
- CHoCH = Warning untuk possible reversal
- Tunggu price retest ke order block setelah BOS
---
#### **2. Order Blocks**
**Setup:**
- ✅ Aktifkan Internal/Swing Order Blocks
- Set jumlah blocks yang ditampil (1-20)
- Pilih filter: ATR atau Cumulative Mean Range
- Pilih mitigation: Close atau High/Low
**Cara Trading:**
1. Tunggu BOS/CHoCH terbentuk
2. Identifikasi order block terdekat
3. Wait for price pullback ke order block
4. Entry saat price respek order block (rejection)
5. Stop loss di bawah/atas order block
6. Target: swing high/low berikutnya
**Color Code:**
- 🔵 Light Blue = Internal Bullish OB
- 🔴 Light Red = Internal Bearish OB
- 🔵 Dark Blue = Swing Bullish OB
- 🔴 Dark Red = Swing Bearish OB
---
#### **3. Equal Highs/Lows (EQH/EQL)**
**Setup:**
- ✅ Aktifkan "Equal High/Low"
- Set "Bars Confirmation" (default: 3)
- Adjust threshold (0-0.5, default: 0.1)
**Interpretasi:**
- EQH = Liquidity di atas, kemungkinan sweep lalu dump
- EQL = Liquidity di bawah, kemungkinan sweep lalu pump
- Biasanya smart money akan grab liquidity sebelum move besar
**Trading Strategy:**
- Wait for EQH/EQL formation
- Anticipate liquidity grab
- Entry setelah sweep dengan konfirmasi (order block, FVG, CHoCH)
---
#### **4. Fair Value Gaps (FVG)**
**Setup:**
- ✅ Aktifkan "Fair Value Gaps"
- Pilih timeframe (default: chart timeframe)
- Enable/disable auto threshold
- Set extension bars
**Cara Trading:**
1. Bullish FVG = Support zone untuk buy
2. Bearish FVG = Resistance zone untuk sell
3. Price tends to fill FVG (retest)
4. Entry saat price kembali ke FVG
5. Partial fill = valid, full fill = invalidated
**Tips:**
- FVG + Order Block = High probability setup
- Multi-timeframe FVG lebih kuat
- Unfilled FVG = strong momentum
---
#### **5. Premium & Discount Zones**
**Setup:**
- ✅ Aktifkan "Premium/Discount Zones"
- Zones akan auto-update berdasarkan swing high/low
**Interpretasi:**
- 🟢 **Discount Zone** = Area BUY (price murah)
- ⚪ **Equilibrium** = Neutral (50%)
- 🔴 **Premium Zone** = Area SELL (price mahal)
**Trading Strategy:**
- BUY dari discount zone
- SELL dari premium zone
- Avoid trading di equilibrium
- Combine dengan structure confirmation
---
#### **6. Fibonacci Retracement**
**Setup:**
- Pilih Fib yang ingin ditampilkan:
- Equilibrium to Discount
- Equilibrium to Premium
- Discount to Premium
- Toggle show lines
- Enable reverse jika perlu
- Custom colors
**Key Levels:**
- 0.236 = Shallow retracement
- 0.382 = Common retracement
- 0.5 = 50% golden level
- 0.618 = Golden ratio (penting!)
- 0.786 = Deep retracement
**Cara Pakai:**
- 0.618-0.786 = Ideal entry zone dalam trend
- Combine dengan order blocks
- Wait for confirmation candle
---
#### **7. Volume Profile (VRVP)**
**Setup:**
- ✅ Aktifkan "Show Volume Profile"
- Set jumlah rows (10-100)
- Adjust width (5-50%)
- Pilih placement (Left/Right)
- Enable POC dan Value Area
**Interpretasi:**
- **POC (Point of Control)** = Harga dengan volume tertinggi = magnet
- **Value Area** = 70% volume = fair price range
- **Low Volume Nodes** = Weak support/resistance
- **High Volume Nodes** = Strong support/resistance
**Trading:**
- POC acts as support/resistance
- Price tends to return to POC
- Breakout dari Value Area = momentum
---
#### **8. RSI Multi-Timeframe**
**Setup:**
- ✅ Aktifkan "Show RSI Table"
- Set 3 timeframes (default: chart, 5m, 15m)
- Set RSI period (default: 14)
- Set Overbought level (default: 70)
- Set Oversold level (default: 30)
- Pilih posisi & ukuran table
**Interpretasi:**
- 🟢 **OS (Oversold)** = RSI ≤ 30 = Kondisi jenuh jual
- 🔴 **OB (Overbought)** = RSI ≥ 70 = Kondisi jenuh beli
- **-** = Neutral zone
**Trading Strategy:**
1. Multi-timeframe alignment = strong signal
2. OS + Bullish structure = BUY signal
3. OB + Bearish structure = SELL signal
4. Divergence RSI vs Price = reversal warning
**Contoh:**
- TF1: OS, TF2: OS, TF3: OS + Price di discount zone = STRONG BUY
---
#### **9. Moving Averages**
**Setup:**
- Pilih MA Type: EMA, SMA, atau WMA (berlaku untuk ketiga MA)
- Pilih Period Mode: Automatic atau Manual
- Set period untuk MA 1, 2, 3 (default: 20, 50, 100)
- Custom color & width per MA
- ✅ Enable Cross Alerts
**Interpretasi:**
- **Golden Cross** = MA fast cross above MA slow = Bullish
- **Death Cross** = MA fast cross below MA slow = Bearish
- Price above all MAs = Strong uptrend
- Price below all MAs = Strong downtrend
**Trading Strategy:**
1. MA1 (20) = Short-term trend
2. MA2 (50) = Medium-term trend
3. MA3 (100) = Long-term trend
**Entry Signals:**
- Price bounce dari MA dalam trend = continuation
- MA cross dengan konfirmasi structure = entry
- Multiple MA confluence = strong support/resistance
**Alerts Available:**
- MA1 cross MA2/MA3
- MA2 cross MA3
- Price cross any MA
---
#### **10. Multi-Timeframe Levels**
**Setup:**
- Enable HTF Level 1-5
- Set timeframes (contoh: 5m, 1H, 4H, D, W)
- Pilih line style (solid/dashed/dotted)
- Custom colors
**Cara Pakai:**
- Previous high/low dari HTF = strong S/R
- Breakout HTF level = significant move
- Multiple HTF levels confluence = major zone
---
### **C. Trading Setup Combination**
#### **Setup 1: High Probability Buy (Bullish)**
1. ✅ Swing structure: Bullish BOS
2. ✅ Price di Discount Zone
3. ✅ Pullback ke Bullish Order Block
4. ✅ Bullish FVG di bawah
5. ✅ RSI Multi-TF: Oversold
6. ✅ Price bounce dari MA
7. ✅ POC/Value Area support
8. ✅ Fibonacci 0.618-0.786 retracement
**Entry:** Saat price reject dari order block dengan confirmation candle
**Stop Loss:** Below order block
**Target:** Swing high atau premium zone
---
#### **Setup 2: High Probability Sell (Bearish)**
1. ✅ Swing structure: Bearish BOS
2. ✅ Price di Premium Zone
3. ✅ Pullback ke Bearish Order Block
4. ✅ Bearish FVG di atas
5. ✅ RSI Multi-TF: Overbought
6. ✅ Price reject dari MA
7. ✅ POC/Value Area resistance
8. ✅ Fibonacci 0.618-0.786 retracement
**Entry:** Saat price reject dari order block dengan confirmation candle
**Stop Loss:** Above order block
**Target:** Swing low atau discount zone
---
#### **Setup 3: Liquidity Grab (EQH/EQL)**
1. ✅ Identifikasi EQH atau EQL
2. ✅ Wait for liquidity sweep
3. ✅ Konfirmasi dengan CHoCH
4. ✅ Order block terbentuk setelah sweep
5. ✅ Entry saat retest order block
---
### **D. Tips & Best Practices**
**Risk Management:**
- Selalu gunakan stop loss
- Risk 1-2% per trade
- Risk:Reward minimum 1:2
- Jangan over-leverage
**Confluence adalah Kunci:**
- Minimal 3-4 konfirmasi sebelum entry
- Lebih banyak konfirmasi = higher probability
- Quality over quantity
**Timeframe Analysis:**
- HTF (Higher Timeframe) = Trend direction
- LTF (Lower Timeframe) = Entry timing
- Align dengan HTF trend
**Backtesting:**
- Gunakan mode "Historical"
- Test strategy di berbagai market condition
- Record dan analyze hasil
**Market Condition:**
- Trending market = Follow BOS, use order blocks
- Ranging market = Use premium/discount zones, EQH/EQL
- High volatility = Wider stops, wait for clear structure
**Avoid:**
- Trading di equilibrium zone
- Entry tanpa konfirmasi
- Fighting the trend
- Overleveraging
- Emotional trading
---
## 📈 Recommended Settings
### **For Scalping (1m - 5m):**
- Internal Structure: ON
- Swing Structure: OFF
- Order Blocks: Internal only
- RSI Timeframes: 1m, 5m, 15m
- MA Periods: 9, 21, 50
### **For Day Trading (15m - 1H):**
- Internal Structure: ON
- Swing Structure: ON
- Order Blocks: Both
- RSI Timeframes: 15m, 1H, 4H
- MA Periods: 20, 50, 100
### **For Swing Trading (4H - D):**
- Internal Structure: OFF
- Swing Structure: ON
- Order Blocks: Swing only
- RSI Timeframes: 4H, D, W
- MA Periods: 20, 50, 200
---
## ⚠️ Disclaimer
Indicator ini adalah alat bantu analisis teknikal. Tidak ada indicator yang 100% akurat. Selalu:
- Lakukan analisa fundamental
- Gunakan proper risk management
- Praktik di demo account terlebih dahulu
- Trading memiliki resiko, trade at your own risk
---
## 📝 Version Info
**Version:** 5.0
**Platform:** TradingView Pine Script v5
**Author:** XoRonX
**Max Labels:** 500
**Max Lines:** 500
**Max Boxes:** 500
---
## 🔄 Updates & Support
Untuk update, bug reports, atau pertanyaan:
- Check documentation regularly
- Test new features in replay mode
- Backup your settings before updates
---
## 🎓 Learning Resources
**Recommended Study:**
1. Smart Money Concepts (SMC) basics
2. Order blocks theory
3. Liquidity concepts
4. ICT (Inner Circle Trader) concepts
5. Volume profile analysis
6. Multi-timeframe analysis
**Practice:**
- Start with higher timeframes
- Master one concept at a time
- Keep a trading journal
- Review your trades weekly
---
**Happy Trading! 🚀📊**
_Remember: The best indicator is your own analysis and discipline._

Elite Zone Master Pro - Advanced Multi-Session Trading System🚀 Elite Zone Master Pro - Advanced Multi-Session Trading System
🎯 ORIGINALITY & UNIQUE VALUE PROPOSITION
Elite Zone Master Pro is NOT a simple mashup of existing indicators. It's a proprietary trading system that combines three distinct methodologies into a unified, synergistic approach:
Multi-Session Zone Analysis - Original algorithm for tracking global market sessions
Dynamic Opening Range Breakout (ORB) - Enhanced ORB with bias-aware signal filtering
Advanced Fair Value Gap Detection - Proprietary FVG identification with smart mitigation tracking
🔧 Why This Combination Works
The power lies in how these components work together, not separately:
Session zones provide market context and volatility windows
ORB system identifies key breakout levels during optimal timeframes
FVG detection pinpoints precise entry locations within the ORB framework
Integrated bias system filters signals based on range direction momentum
🧠 DETAILED METHODOLOGY & CALCULATIONS
🌍 1. Multi-Session Zone Framework
What it does: Tracks and visualizes three major global trading sessions simultaneously.
How it works:
Dynamic zone tracking algorithm that calculates session highs/lows in real-time
Adaptive box rendering that expands/contracts based on actual price movement
Session overlap detection for identifying high-volatility periods
Time-weighted zone positioning using custom timezone calculations
Original concepts:
Simultaneous multi-session visualization (not found in standard session indicators)
Dynamic zone expansion based on volatility, not fixed time periods
Cross-session momentum analysis for bias determination
🎯 2. Enhanced Opening Range Breakout System
What it does: Identifies breakout opportunities from predefined session ranges with intelligent bias filtering.
How it works:
Multi-session ORB calculation: Supports US (16:30-16:45), EU (10:00-10:15), Asian (03:00-03:15), and custom sessions
Dynamic range establishment: Range is built in real-time during active session periods
Bias-aware signal filtering: Two-tier breakout system based on range midpoint momentum
Range direction analysis: Compares current range midpoint to previous session's midpoint
Original methodology:
Range Bias Calculation:
- If Current_Midpoint > Previous_Midpoint = Bullish Bias (+1)
- If Current_Midpoint < Previous_Midpoint = Bearish Bias (-1)
- If Current_Midpoint = Previous_Midpoint = Neutral Bias (0)
Signal Logic:
- Bullish Bias: Standard breakout above range high
- Bearish Bias: Enhanced breakout (range_high + 0.5 * range_width) for bullish signals
- Neutral Bias: Standard breakouts both directions
⚡ 3. Advanced Fair Value Gap (FVG) Detection
What it does: Identifies and tracks fair value gaps with automatic mitigation detection.
How it works:
Three-bar gap analysis: Compares current bar relationships to identify true gaps
Dynamic threshold calculation: Auto-adjusting sensitivity based on market volatility
Smart mitigation tracking: Automatically removes filled gaps from display
Directional bias integration: Color-codes gaps based on their directional implication
Proprietary algorithms:
Bullish FVG Criteria:
- Current_Low > High (gap condition)
- Close > High (confirmation)
- (Current_Low - High ) / High > Threshold (significance filter)
Bearish FVG Criteria:
- Current_High < Low (gap condition)
- Close < Low (confirmation)
- (Low - Current_High) / Current_High > Threshold (significance filter)
Mitigation Logic:
- Bullish FVG: Mitigated when Close < FVG_Low
- Bearish FVG: Mitigated when Close > FVG_High
📈 4. Session-Based Moving Average System
What it does: Calculates moving averages that reset and adapt to session boundaries.
How it works:
Session-aware length calculation: Effective length = min(bars_since_session_start, user_length)
Multiple MA types: EMA, SMA, RMA, WMA, VWMA with session-specific calculations
Dynamic smoothing: Adapts to session length for consistent signals across different session durations
🔄 INTEGRATED SYSTEM SYNERGY
🎯 How Components Work Together
Context Layer: Session zones provide market timing context
Setup Layer: ORB system identifies breakout opportunities within optimal timeframes
Entry Layer: FVG detection pinpoints precise entry levels
Filter Layer: Bias system ensures alignment with momentum direction
Confirmation Layer: Session MA provides trend confirmation
🧭 Signal Generation Process
Step 1: Session Analysis
- Identify active trading session
- Calculate session volatility metrics
- Establish range boundaries
Step 2: Range Bias Calculation
- Compare current vs previous range midpoints
- Assign directional bias (-1, 0, +1)
- Adjust breakout thresholds accordingly
Step 3: Breakout Detection
- Monitor price interaction with range boundaries
- Apply bias-specific breakout criteria
- Generate preliminary signals
Step 4: FVG Confirmation
- Scan for fair value gaps within range
- Validate gap significance using dynamic thresholds
- Provide entry refinement opportunities
Step 5: Signal Validation
- Cross-reference with session MA direction
- Ensure alignment with overall bias
- Output final trading signals
📊 PRACTICAL IMPLEMENTATION
🎯 Trading Strategy Framework
Setup Phase:
Configure session times for your timezone
Enable preferred sessions (US/EU/Asian)
Adjust FVG sensitivity based on instrument volatility
Execution Phase:
Wait for range establishment during active session
Monitor for bias-aligned breakouts
Look for FVG retest opportunities
Enter trades with ORB-based stop losses
Risk Management:
Stop loss placement: Outside ORB range boundaries
Position sizing: Based on range width volatility
Trade direction: Must align with calculated range bias
🎨 UNIQUE VISUAL IMPLEMENTATION
📊 Advanced Visualization Features
Multi-layered zone rendering with transparency controls
Dynamic range boxes that adapt to price movement
Smart label positioning to avoid chart clutter
Color-coded bias indication through range fills
Progressive FVG display with automatic cleanup
🔧 TECHNICAL SPECIFICATIONS
⚙️ Performance Optimizations
Efficient array management for FVG tracking
Memory optimization through historical data cleanup
Smart rendering to prevent chart overload
Error handling for edge cases and invalid timeframes
📈 Compatibility
All timeframes under 1 day
All instruments (Forex, Stocks, Crypto, Futures)
All chart types with overlay capability
Mobile and desktop platform support
🏆 WHAT MAKES THIS DIFFERENT FROM OTHER INDICATORS
❌ Standard ORB indicators: Only show basic range breakouts without bias consideration
❌ Basic FVG indicators: Don't integrate with session analysis or range systems
❌ Session indicators: Simply highlight time periods without actionable trading signals
❌ Moving average indicators: Don't adapt to session dynamics
✅ Elite Zone Master Pro: Combines all elements with proprietary logic for a complete trading system
📋 USE CASES & MARKET APPLICATION
🎯 Primary Applications
Forex day trading during major session overlaps
Index futures scalping using session-specific ranges
Cryptocurrency swing trading with 24/7 session analysis
Stock market opening range breakout strategies
📊 Performance Characteristics
Best performance: During high-volatility session transitions
Optimal timeframes: 1m to 4H for intraday trading
Risk-reward ratios: Typically 1:2 to 1:4 based on range width
Win rate: Higher probability when all components align
This indicator represents months of development combining institutional trading concepts with retail accessibility. It's not just another indicator - it's a complete trading methodology in one comprehensive tool.
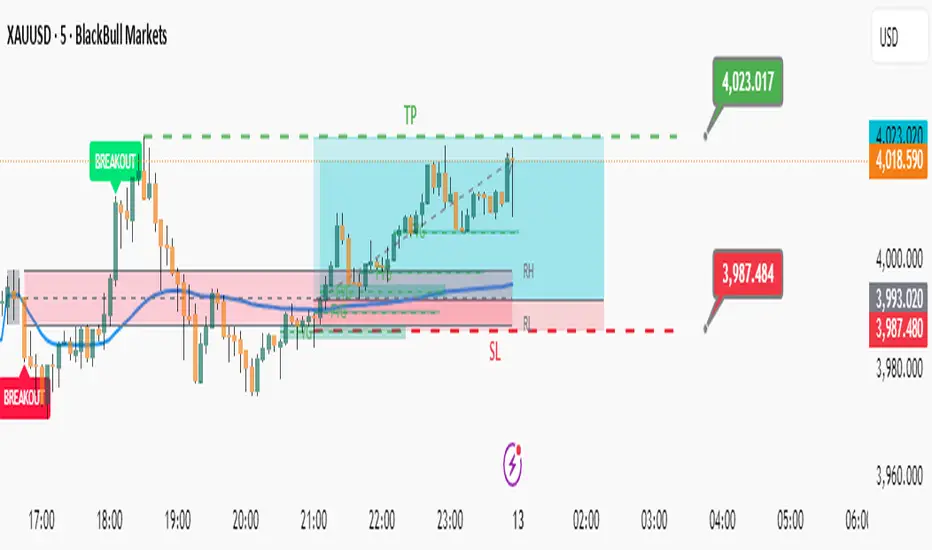
Trident Pattern [SpeculationLab]This indicator is based on the increasingly popular Trident strategy, and is best suited for the 30-minute timeframe. It performs particularly well on naturally bullish instruments such as gold, Bitcoin, and Nasdaq.All components of this indicator are original work by Speculation Lab.
Rather than stacking random features, this script is designed as a modular structure where each part works in synergy to build the Trident logic.
🔧 Modules Included:
Session Highlight — Visual display of the London Kill Zone
5 Customizable EMAs — Fully adjustable length, color, and toggling
Bullish Fair Value Gap (FVG) detection
Four types of Doji candlestick recognition
🧫 Logic Breakdown:
1. Time Session Filter
By default, the indicator highlights the London Kill Zone, defined as 03:00–06:30 New York time.Users can freely adjust the time zone, time range, and background color, with preconfigured zones including New York, London, Tokyo, Shanghai, and Sydney.
⚠️ Note: To maintain flexibility, the London Kill Zone is not enforced as a mandatory entry condition.
Users may apply it as an optional filter based on their own trading style.
2. 5 EMA Trend Filter
The script uses a five-EMA structure to confirm market trend.The default EMA lengths are 5, 9, 13, 21, and 200.A valid entry requires:
EMAs 5, 9, 13, 21 stacked in descending order
AND the 1-hour close is above EMA(200)
All EMAs are fully customizable and can be toggled on/off.
3. Bullish Fair Value Gap (FVG)
Bullish FVGs are detected using a 3-bar logic, from high to low .To filter noise, the gap must be greater than 0.7 × ATR(14) by default.Both the ATR period and multiplier are adjustable.
The FVG Extend setting has two roles:
It controls how many bars the FVG box extends to the right (default: 20)
It defines the active window for confirming entries within the FVG zone
Users can fully customize the box color, text, and center line.
4. Doji Detection
The script detects four types of Doji candlesticks:
Standard Doji
Long-legged Doji
Dragonfly Doji
Gravestone Doji
The Body Ratio setting controls how small the candle body must be relative to the full range (default ≤ 0.1).Long Wick Ratio and Short Wick Ratio further help fine-tune wick length criteria.
✅ Entry Signal Logic:
A Trident entry is confirmed when all the following conditions are met:
Trend Filter Passes
EMAs are stacked: 5 > 9 > 13 > 21
1H close is above EMA(200)
A Doji candle appears inside an active FVG zone
The next candle closes below the Doji’s high
If all conditions are satisfied, a Trident signal is triggered at the close of the confirming candle.
⚠️ Disclaimer
This indicator is intended for educational and research purposes only. It does not constitute financial advice or trading signals.Trading involves high risk. Please act according to your own risk management.Speculation Lab and the author bear no responsibility for any financial outcomes resulting from the use of this script.
本指标基于近年来日益流行的 Trident(三叉戟)策略,推荐使用在 30分钟时间框架,尤其适用于黄金、比特币、纳斯达克等具有自然上涨倾向的交易品种。本指标由 Speculation Lab 原创开发,结构严谨,逻辑清晰。
本指标采用模块化设计,各部分功能相辅相成,共同构建三叉戟策略逻辑,而非杂乱堆砌。
🔧 指标包含以下功能模块:
交易时段高亮 — 默认显示 伦敦杀戮区
五条可调节 EMA 均线 — 长度与颜色可自定义,模块可单独开关
看涨 Fair Value Gap(公平价值缺口)检测
四种 Doji(十字星)K线形态识别
🧫 逻辑说明:
1. 交易时段过滤
默认高亮显示的伦敦杀戮区为 纽约时间03:00–06:30。用户可自由调整 参考时区、具体时段和 背景颜色,支持预设时区包括纽约、伦敦、东京、上海和悉尼。
⚠️ 说明:为保持策略灵活性,伦敦杀戮区并非强制入场条件。
是否采用此过滤,可由用户自行决定。
2. 趋势过滤(五条EMA)
该指标采用五条 EMA 来确认市场趋势。默认长度为 5、9、13、21、200。入场信号要求满足以下条件:
EMA 5、9、13、21 从上到下依次排列(多头排列)
且 1小时图上的收盘价高于 EMA200
所有均线均可单独启用/关闭,长度与颜色均可自定义。
3. 看涨 FVG 区域识别
FVG 使用 3 根K线结构进行检测,从 high 到 low 。默认要求缺口 大于等于 0.7 × ATR(14),以过滤微小无效缺口。ATR周期与乘数均可自定义设置。
“FVG Extend”参数有两个作用:
控制图表上 FVG 区域箱体的右延伸长度(默认20根K线)
用作 FVG 活跃期的判断标准,仅在此区间内出现的 Doji 才会被视为有效信号触发条件
用户可自由设置 FVG 的背景颜色、文字样式与中线颜色。
4. Doji(十字星)识别
支持以下四种常见 Doji 形态识别:
标准十字星
长腿十字星
蜻蜓线(下影线长)
墓碑线(上影线长)
“Body Ratio” 控制实体占K线全长的比例,默认不超过0.2。“Long Wick Ratio” 与 “Short Wick Ratio” 可进一步调节影线长度识别标准。
✅ 入场信号逻辑:
符合以下所有条件时,触发三叉戟入场信号:
趋势过滤通过
EMA 依次排列为 5 > 9 > 13 > 21
且 1小时收盘价高于 EMA200
在 FVG 区域内出现有效 Doji 十字星
下一根K线收盘价 低于 Doji 的最高价
若以上条件均满足,则在确认K线收盘时触发三叉戟入场信号。
⚠️ 免责声明 Disclaimer
本指标旨在提供技术分析工具,仅用于教育与研究目的,不构成任何投资建议或交易指令。交易具有高风险,请根据自身风险承受能力合理操作。使用本脚本所导致的任何盈亏,作者与 Speculation Lab 不承担任何责任。
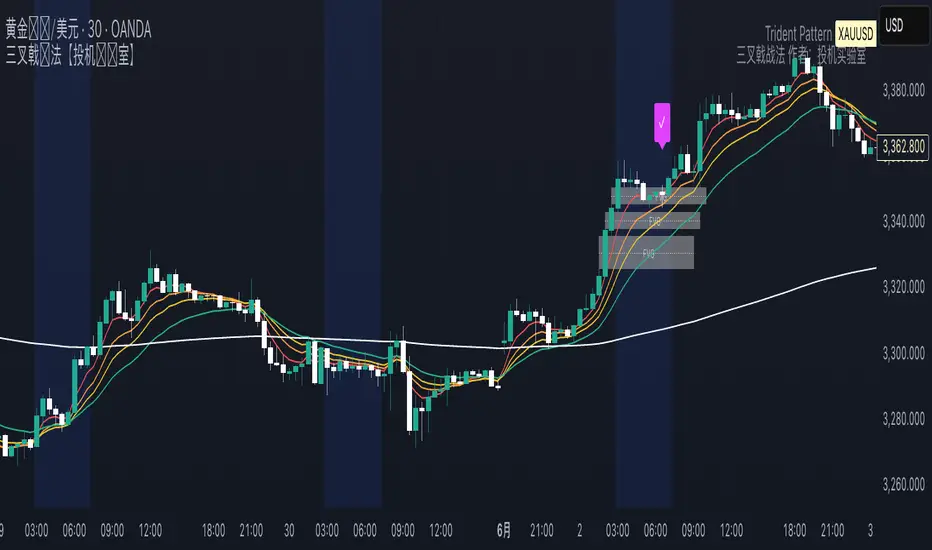
cd_full_poi_CxOverview
This indicator tracks the price in 16 different time frames (optional) in order to answer the question of where the current price has reacted or will react.
It appears on the chart and in the report table when the price approaches or touches the fvg or mitigations (order block / supply-demand), the rules of which will be explained below.
In summary, it follows the fvg and mitigations in the higher timeframe than the lower timeframe.
Many traders see fvg or mitigates as an point of interest and see the high, low swept in those zones as a trading opportunity. Key levels, Session high/lows and Equal high and lows also point of interest.
If we summarise the description of the point of interest ;
1- Fair value gaps (FVG) (16 time frames)
2- Mitigation zones (16 time frames)
3- Previous week, day, H4, H1 high and low levels
4- Sessions zones (Asia, London and New York)
5- Equal high and low levels are in indicator display.
Details:
1- Fair Value Gaps : It is simply described as a price gap and consists of a series of 3 candles. The reaction of the price to the gap between the 1st and 3rd candle wicks is observed.
The indicator offers 3 options for marking. These are :
1-1- ‘Colours are unimportant’: candle colours are not considered for marking. Fvg formation is sufficient.(Classical)
1-2- ‘First candle opposite colour’ : when a price gap occurs, the first candle of a series of 3 candles must be opposite.
For bullish fvg : bearish - bullish - free
For Bearish fvg : bullish - bearish - free
1-3- ‘All same colour’ : all candles in a series of 3 candles must be the same direction.
For bullish fvg: bullish - bullish - bullish
For bearish fvg : bearish - bearish – bearish
Examples:
2- Mitigation zones: Opposite candles with a fvg in front of them or candles higher/lower than the previous and next candle and with the same colour as the fvg series are marked.
Examples :
3- Previous week, day, H4, H1 high and low levels
4- Sessions regions (Asia, London and New York)
5- Equal high and low levels:
Annotation: Many traders want to see a liquidity grab on the poi, then try to enter the trade with the appropriate method.
Among the indicators, there is also the indication of grabs/swepts that occur at swing points. It is also indicated when the area previously marked as equal high/low is violated (grab).
At the end, sample setups will be shown to give an idea about the use of the indicator.
Settings:
- The options to be displayed from the menu are selected by ticking.
- 1m, 2m, 3m, 5m, 5m, 10m, 15m, 30m, h1, h4, h4, h6, h8, h12, daily, weekly, monthly and quarterly, 16 time zones in total can be displayed.
- The ‘Collapse when the price touches mitigate’ tab controls whether to collapse the box as the price moves into the inner region of the mitigate. If not selected, the size of the mitigate does not change.
- ‘Approach limit =(ATR / n)’ tab controls how close the price is to the fvg or mitigate. Instant ATR(10) value is calculated by dividing by the entered ‘n’ value.
- All boxes and lines are automatically removed from the screen when the beyond is closed.
- Colour selections, table, text features are controlled from the menu.
- Sessions hours are set as standard hours, the user can select special time zones. Timezone is set to GMT-4.
- On the candle when the price touches fvg or mitigate, the timeframe information of the POI is shown in the report table together with the graphical representation.
The benefits and differences :
1- We can evaluate the factors we use for setup together.
2- We are aware of what awaits us in the high time frame in the following candles.
3- It offers the user the opportunity to be selective with different candle selection options in fvg selection.
4- Mitige areas are actually unmitige areas because they have a price gap in front of them. The market likes to retest these areas.
5- Equal high/low zones are the levels that the price creates to accumulate liquidity or fails to go beyond (especially during high volume hours). Failure or crossing of the level may give a reversal or continuation prediction.
Sample setup 1:
Sample setup 2:
Sample setup 3:
Cheerful trades…
Enjoy…

Fair Value Gaps (Custom)Fair Value Gaps (FVG) - Custom
A comprehensive Fair Value Gap indicator designed for futures traders, offering multi-timeframe analysis with full customization of colors, opacity, and visual elements per timeframe.
What are Fair Value Gaps?
Fair Value Gaps (FVGs) are three-candle patterns where a gap exists between the high of the first candle and the low of the third candle (bullish) or between the low of the first candle and the high of the third candle (bearish). These imbalances often act as support/resistance zones where price tends to return.
Key Features
Multi-Timeframe Support
5 independent timeframe slots
View higher timeframe FVGs on lower timeframe charts
Each timeframe has its own color, opacity, label, and midline settings
Flexible Fill Methods
Any Touch — FVG filled when price touches the zone
Midpoint Reached — FVG filled when price reaches 50% of the zone
Wick Sweep — FVG filled when wick passes through entire zone
Body Beyond — FVG filled when candle body closes beyond the zone
Visual Customization
Per-timeframe color AND opacity control via color picker
Optional midline display per timeframe
Customizable labels with fill percentage display
Optional borders with style/width settings
Boxes can extend to chart edge or fixed bar length
Dashboard & Alerts
Real-time FVG count dashboard (Bull/Bear above/below price)
Alert conditions: Price enters FVG, Midline cross, New FVG formed, FVG filled
Recommended Settings for ES/NQ Futures
Min Gap Size: 8 ticks (2 points)
Fill Method: Body Beyond (most conservative)
Default Opacity: 10% (adjust per timeframe as needed)
Usage Tips
Use higher timeframe FVGs as key support/resistance zones
Watch for confluence when multiple timeframe FVGs overlap
Midline often acts as the first target/reaction point
Combine with other confluence factors (order blocks, volume, etc.)

One for AllOne for All (OFA) - Complete ICT Analysis Suite
Version 3.3.0 by theCodeman
📊 Overview
One for All (OFA) is a comprehensive TradingView indicator designed for traders who follow Inner Circle Trader (ICT) concepts. This all-in-one tool combines essential ICT analysis features—sessions, kill zones, previous period levels, and higher timeframe candles with Fair Value Gaps (FVGs) and Volume Imbalances (VIs)—into a single, highly customizable indicator. Whether you're a beginner learning ICT concepts or an experienced trader refining your edge, OFA provides the visual structure needed for precise market analysis and execution.
✨ Key Features
- 🏷️ Customizable Watermark**: Display your trading identity with customizable titles, subtitles, symbol info, and full style control
- 🌍 Trading Sessions**: Visualize Asian, London, and New York sessions with high/low lines, range boxes, and open/close markers
- 🎯 Kill Zones**: Highlight 5 critical ICT kill zones with precise timing and visual boxes
- 📈 Previous Period H/L**: Track Daily, Weekly, and Monthly highs/lows with customizable styles and lookback periods
- 🕐 Higher Timeframe Candles**: Display up to 5 HTF timeframes with OHLC trace lines, timers, and interval labels
- 🔍 FVG & VI Detection**: Automatically detect and visualize Fair Value Gaps and Volume Imbalances on HTF candles
- ⚙️ Universal Timezone Support**: Works globally with GMT-12 to GMT+14 timezone selection
- 🎨 Full Customization**: Control colors, styles, visibility, and layout for every feature
🚀 How to Use
Watermark Setup
The watermark overlay helps you identify your charts and maintain focus on your trading principles:
1. Enable/disable watermark via "Show Watermark" toggle
2. Customize the title (default: "Name") to display your trading name or account identifier
3. Set up to 3 subtitles (default: "Patience", "Confidence", "Execution") as trading reminders
4. Choose position (9 locations available), size, color, and transparency
5. Toggle symbol and timeframe display as needed
Use Case: Display your trading principles or account name for multi-monitor setups or content creation.
Trading Sessions Analysis
Sessions define market character and liquidity availability:
1. Enable "Show All Sessions" to visualize all three sessions
2. Adjust timezone to match your local market (default: UTC-5 for EST)
3. Customize session times if needed (defaults cover standard hours)
4. Enable session range boxes to see consolidation zones
5. Use session high/low lines to identify key levels for the current session
6. Enable open/close markers to track session transitions
Use Case: Identify which session you're trading in, track session highs/lows for liquidity, and anticipate session transition volatility.
Kill Zones Trading
Kill zones are ICT's high-probability trading windows:
1. Enable individual kill zones or use "Show All Kill Zones"
2. **Asian Kill Zone** (2000-0000 GMT): Early positioning and smart money accumulation
3. **London Kill Zone** (0300-0500 GMT): European market opening volatility
4. **NY AM Kill Zone** (0930-1100 EST): Post-NYSE open expansion
5. **NY Lunch Kill Zone** (1200-1300 EST): Midday consolidation or manipulation
6. **NY PM Kill Zone** (1330-1600 EST): Afternoon positioning and closes
7. Customize colors and times to match your trading style
8. Set max days display to control historical visibility (default: 30 days)
Use Case: Focus entries during high-probability windows. Watch for liquidity sweeps at kill zone openings and institutional positioning.
Previous Period High/Low Levels
Previous period levels act as magnetic price targets and support/resistance:
1. Enable Daily (PDH/PDL), Weekly (PWH/PWL), or Monthly (PMH/PML) levels individually
2. Set lookback period (how many previous periods to display)
3. Choose line style: Solid (current emphasis), Dashed (standard), or Dotted (subtle)
4. Customize colors per timeframe for visual hierarchy
5. Adjust line width (1-5) for visibility preference
6. Enable gradient effect to fade older periods
7. Position labels left or right based on chart layout
8. Customize label text for your preferred notation
Use Case: Identify key levels where price is likely to react. Daily levels work on intraday timeframes, Weekly on daily charts, Monthly for swing trading.
Higher Timeframe (HTF) Candles
HTF candles reveal the larger market context while trading lower timeframes:
1. Enable up to 5 HTF slots simultaneously (default: 5m, 15m, 1H, 4H, Daily)
2. Choose display mode: "Below Chart" (stacked rows) or "Right Side" (compact column)
3. Customize timeframe, colors (bull/bear), and titles for each slot
4. **OHLC Trace Lines**: Visual lines connecting HTF candle levels to chart bars
5. **HTF Timer**: Countdown showing time remaining until HTF candle close
6. **Interval Labels**: Display day of week (Daily+) or time (intraday) on each candle
7. For Daily candles: Choose open time (Midnight, 8:30, 9:30) to match your market structure preference
Use Case: Trade lower timeframes while respecting higher timeframe structure. Watch for HTF candle closes to confirm directional bias.
FVG & VI Detection
Fair Value Gaps and Volume Imbalances highlight inefficiencies that price often revisits:
1. **Fair Value Gaps (FVGs)**: Detected when HTF candle wicks don't overlap between 3 consecutive candles
- Bullish FVG: Gap between candle 1 high and candle 3 low (green box by default)
- Bearish FVG: Gap between candle 1 low and candle 3 high (red box by default)
2. **Volume Imbalances (VIs)**: Similar detection but focuses on body gaps
- Bullish VI: Gap between candle 1 close and candle 3 open
- Bearish VI: Gap between candle 1 open and candle 3 close
3. Enable FVG/VI detection per HTF slot individually
4. Customize colors and transparency for each imbalance type
5. Boxes appear on chart at formation and remain visible as retracement targets
**Use Case**: Identify high-probability retracement zones. Price often returns to fill FVGs and VIs before continuing the trend. Use as entry zones or profit targets.
🎨 Customization
OFA is built for flexibility. Every feature includes extensive customization options:
Visual Customization
- **Colors**: Independent color control for every element (sessions, kill zones, lines, labels, FVGs, VIs)
- **Transparency**: Adjust box and label transparency (0-100%) for clean charts
- **Line Styles**: Choose Solid, Dashed, or Dotted for previous period lines
- **Sizes**: Control text size, line width, and box borders
- **Positions**: Place watermark in 9 positions, labels left/right
Layout Control
- **HTF Display Mode**: "Below Chart" for detailed analysis, "Right Side" for space efficiency
- **Drawing Limits**: Set max days for sessions/kill zones to manage chart clutter
- **Lookback Periods**: Control how many previous periods to display (1-10)
- **Gradient Effects**: Enable fading for older previous period lines
Timing Adjustments
- **Timezone**: Universal GMT offset selector (-12 to +14) for global markets
- **Session Times**: Customize each session's start/end times
- **Kill Zone Times**: Adjust kill zone windows to match your market's characteristics
- **Daily Open**: Choose Midnight, 8:30, or 9:30 for Daily HTF candle open time
💡 Best Practices
1. Start Simple: Enable one feature at a time to learn how each element affects your analysis
2. Match Your Timeframe: Use Daily levels on intraday charts, Weekly on daily charts, HTF candles one or two levels above your trading timeframe
3. Kill Zone Focus: Concentrate your trading activity during kill zones for higher probability setups
4. HTF Confirmation: Wait for HTF candle closes before committing to directional bias
5. FVG/VI Entries: Look for price to return to unfilled FVGs/VIs for entry opportunities with favorable risk/reward
6. Customize Colors: Use a consistent color scheme that matches your chart theme and reduces visual fatigue
7. Reduce Clutter: Disable features you're not actively using in your current trading plan
8. Session Context: Understand which session controls the market—trade with session direction or anticipate reversals at session transitions
⚙️ Settings Guide
OFA organizes settings into logical groups for easy navigation:
- **═══ WATERMARK ═══**: Title, subtitles, position, style, symbol/timeframe display
- **═══ SESSIONS ═══**: Enable/disable sessions, times, colors, high/low lines, boxes, markers
- **═══ KILL ZONES ═══**: Individual kill zone toggles, times, colors, max days display
- **═══ PREVIOUS H/L - DAILY ═══**: Daily high/low lines, style, color, lookback, labels
- **═══ PREVIOUS H/L - WEEKLY ═══**: Weekly high/low lines, style, color, lookback, labels
- **═══ PREVIOUS H/L - MONTHLY ═══**: Monthly high/low lines, style, color, lookback, labels
- **═══ HTF CANDLES ═══**: Global display mode, layout settings
- **═══ HTF SLOT 1-5 ═══**: Individual HTF configuration (timeframe, colors, title, FVG/VI detection, trace lines, timer, interval labels)
Each setting includes tooltips explaining its function. Hover over any input for detailed guidance.
📝 Final Notes
One for All (OFA) represents a complete ICT analysis toolkit in a single indicator. By combining watermark customization, session visualization, kill zone highlighting, previous period levels, and higher timeframe candles with FVG/VI detection, OFA eliminates the need for multiple indicators cluttering your chart.
**Version**: 3.3.0
**Author**: theCodeman
**Pine Script**: v6
**License**: Mozilla Public License 2.0
Start with default settings to learn the indicator's structure, then customize extensively to match your personal trading style. Remember: tools provide information, but your edge comes from disciplined execution of a proven strategy.
Happy Trading! 📈

Forever ModelForever Model is a comprehensive trading framework that visualizes market structure through Fair Value Gaps (FVGs), Smart Money Technique (SMT) divergences, and order block confirmations. The indicator identifies potential price rotations by tracking internal liquidity zones, correlation breaks between assets, and confirmation signals across multiple timeframes.
Designed for clarity and repeatability, the model presents a structured visual logic that supports manual analysis while maintaining flexibility across different assets and timeframes. All components are non-repainting, ensuring historical accuracy and reliable backtesting.
Description
The model operates through a three-part sequence that forms the visual foundation for identifying potential market rotations:
Fair Value Gaps (FVGs)
FVGs are price imbalances detected on higher timeframes—areas where price moved rapidly between candles, leaving an inefficiency that may be revisited. The indicator identifies both bullish and bearish FVGs, displaying them with color-coded levels that extend until mitigated.
: Chart showing FVG detection with colored lines indicating bullish (green) and bearish (red) gaps
Smart Money Technique (SMT)
SMT detects divergence between the current chart asset and a correlated pair. When one asset makes a higher high while the other forms a lower high (or vice versa), it indicates a potential shift in delivery. The indicator draws visual lines connecting these divergence points and can filter SMTs to only display those occurring within FVG ranges.
: Chart showing SMT divergence lines between two correlated assets with labels indicating the pair name]
Order Block Confirmations (OB)
When price confirms a signal by crossing a pivot level, an Order Block is created. The confirmation line extends from the pivot point, labeled as "OB+" for bullish signals or "OB-" for bearish signals. The latest OB extends to the current bar, while previous OBs remain fixed at their confirmation points.
: Chart showing OB confirmation lines with OB+ and OB- labels at confirmation points]
Key Features
Higher Timeframe (HTF) Detection
FVGs are detected on a higher timeframe than the current chart, with automatic HTF selection based on the current timeframe or manual override options. This ensures that internal liquidity zones are identified from the appropriate structural context.
External Range Liquidity (ERL)
Tracks the latest higher timeframe pivot highs and lows, marking external liquidity levels that may be revisited. ERL levels are displayed as horizontal lines with optional labels, providing context for potential continuation targets.
: Chart showing ERL lines at recent HTF pivot points
Signal Creation and Confirmation System
The model creates pending signals when FVG levels are mitigated. Signals confirm when price closes beyond a pivot level, creating the OB confirmation line. Stop levels are automatically calculated from the maximum (bearish) or minimum (bullish) price between signal creation and confirmation.
SMT Filtering Options
Display all SMTs or only those within FVG ranges
Require SMT for signal confirmation (optional filter)
Automatic or manual SMT pair selection
Support for both correlated and inverse correlated pairs
Directional Bias Filter
Filter FVG detection to show only bullish bias, bearish bias, or both. This allows analysts to align with higher timeframe structure or focus on unidirectional setups.
Confirmation Line Management
Toggle to extend only the latest confirmation line or all confirmation lines
Transparent label backgrounds with colored text (red for bearish, green for bullish)
Automatic cleanup of old confirmation lines (keeps last 50)
Labels positioned at line end (latest) or middle (older lines)
Position Sizing Calculator
Optional position sizing based on account balance, risk percentage or fixed amount, and instrument-specific contract sizes. Supports prop firm calculations and can display position size, entry, and stop levels in the dashboard.
Information Dashboard
A customizable floating table displays:
Current timeframe and HTF
Remaining time in current bar
Current bias direction
Latest confirmed signal details (type, size, entry, stop)
Pending signal status
The dashboard can be repositioned, resized, and styled to match your preferences.
Special Range Creation
When signals confirm, the model can automatically create special range levels from stop prices. These levels persist on the chart as important reference points, even after mitigation, serving as potential reversal zones for future signals.
Label and Visualization Controls
Toggle FVG labels on/off
Toggle confirmation lines on/off
Customizable colors for bullish and bearish FVGs
ERL color customization
SMT line width adjustment
Order Flow Integration (Optional)
The indicator includes optional Open Interest (OI) based special range detection, allowing integration with order flow analysis for enhanced context.
Technical Notes
All components are non-repainting—once formed, they remain on the chart
FVGs cannot be mitigated on their creation bar
Signal-based special ranges persist even after mitigation (important stop levels)
SMT detection supports both HTF and chart timeframe modes
Maximum 50 confirmation lines are maintained for performance
The model is designed to work across all asset classes and timeframes, providing a consistent framework for identifying potential market rotations through the interaction of internal liquidity, correlation breaks, and confirmation signals, this does not constitute as trading advice, past performance is no indication of future performance , this is entirely done for entertainment and educational purposes

ATHENS Gold ICT + Smart Money [Advanced Signals]🎯 ADVANCED ICT + SMART MONEY CONFLUENCE INDICATOR
This indicator combines Inner Circle Trader (ICT) concepts with Smart Money theory to deliver high-probability trading signals based on institutional order flow and market structure.
━━━━━━━━━━━━━━━━━━━━━━━━━━━━━━━━━━━━━━━━
⚡ KEY FEATURES:
✅ ICT CONFLUENCE SYSTEM (0-4 Score)
• Order Blocks (Institutional Entry Zones)
• Fair Value Gaps (Price Imbalances)
• Liquidity Sweeps (Stop Hunt Detection)
• Market Structure (BOS & ChoCh)
✅ SMART SIGNALS
• Signals only trigger with minimum confluence
• Customizable requirements (OB/FVG/Liquidity)
• Filters out low-quality setups
• Higher win rate potential (65-85%)
✅ VISUAL COMPONENTS
• Order Blocks (OB+ / OB-)
• Fair Value Gaps (FVG↑ / FVG↓)
• Liquidity Zones (💧 markers)
• Break of Structure (BOS)
• Change of Character (ChoCh)
✅ PERSISTENT TP/SL LINES
• Entry, Stop Loss, TP1, TP2
• Automatically calculated from OB levels
• Lines extend across chart canvas
• Clear risk:reward visualization
✅ SMART DASHBOARD
• Real-time confluence score
• Component status (OB/FVG/Liquidity)
• Trend direction & RSI
• Signal strength indicator
━━━━━━━━━━━━━━━━━━━━━━━━━━━━━━━━━━━━━━━━
🎯 HOW IT WORKS:
The indicator scores each setup based on 4 key components:
1️⃣ ORDER BLOCK PRESENCE
• Bullish OB = Last bearish candle before strong move up
• Bearish OB = Last bullish candle before strong move down
• Price must be in OB zone
2️⃣ FAIR VALUE GAP (FVG)
• Gap between 3 candles indicating imbalance
• Price tends to fill these gaps
• Bounce from FVG = high probability entry
3️⃣ LIQUIDITY SWEEP
• Price sweeps recent high/low
• Retail stop losses triggered
• Smart money enters opposite direction
4️⃣ MARKET STRUCTURE
• Bullish = HH + HL
• Bearish = LH + LL
• Confirms trend direction
CONFLUENCE SCORE:
- 4/4 = Excellent (75-85% win rate)
- 3/4 = Good (65-75% win rate)
- 2/4 = Moderate (55-65% win rate)
- 1/4 = Weak (avoid)
━━━━━━━━━━━━━━━━━━━━━━━━━━━━━━━━━━━━━━━━
⚙️ CUSTOMIZABLE SETTINGS:
SIGNAL REQUIREMENTS:
- Require Order Block (ON/OFF)
- Require FVG (ON/OFF)
- Require Liquidity Sweep (ON/OFF)
- Minimum Confluence (1-4)
VISUAL SETTINGS:
- Show/Hide OB, FVG, BOS, ChoCh
- Adjustable lookback periods
- Customizable colors
- Line extension length
RISK MANAGEMENT:
- Risk:Reward ratio (1:1 to 5:1)
- Stop Loss buffer (%)
- Auto TP/SL calculation
- Clear old lines option
━━━━━━━━━━━━━━━━━━━━━━━━━━━━━━━━━━━━━━━━
📈 RECOMMENDED SETTINGS:
CONSERVATIVE (High Quality):
- Require OB: ON
- Require FVG: ON
- Min Confluence: 3/4
- Result: 1-2 signals/day, 70-80% win rate
BALANCED (Recommended):
- Require OB: ON
- Require FVG: OFF
- Min Confluence: 2/4
- Result: 2-4 signals/day, 60-70% win rate
AGGRESSIVE (More Signals):
- Require OB: OFF
- Require FVG: OFF
- Min Confluence: 2/4
- Result: 3-6 signals/day, 55-65% win rate
━━━━━━━━━━━━━━━━━━━━━━━━━━━━━━━━━━━━━━━━
🎯 BEST PRACTICES:
✅ Trade 3/4 or 4/4 confluence signals only
✅ Confirm with higher timeframe (H4/Daily)
✅ Trade during kill zones (London/NY open)
✅ Use proper position sizing (1-2% risk)
✅ Wait for all components to align
✅ Respect stop losses
✅ Take partial profits at TP1
❌ Don't trade 1/4 confluence signals
❌ Don't ignore liquidity sweeps
❌ Don't trade against higher TF trend
❌ Don't overtrade (quality > quantity)
━━━━━━━━━━━━━━━━━━━━━━━━━━━━━━━━━━━━━━━━
⚡ SIGNAL TYPES:
🟢 BUY SIGNAL (Green Triangle)
- Appears when bullish confluence met
- Label shows "BUY ICT"
- Blue entry line + Red SL + Green/Lime TPs
- Long opportunity
🔴 SELL SIGNAL (Red Triangle)
- Appears when bearish confluence met
- Label shows "SELL ICT"
- Blue entry line + Red SL + Green/Lime TPs
- Short opportunity
━━━━━━━━━━━━━━━━━━━━━━━━━━━━━━━━━━━━━━━━
📊 SUITABLE FOR:
- Gold (XAUUSD) - Optimized
- Forex pairs (Major pairs)
- Indices (US30, NAS100, SPX500)
- Crypto (BTC, ETH - adjust settings)
Recommended Timeframes:
- 15M - Primary for scalping
- 5M - Entry refinement
- 1H - Swing trading
- H4/Daily - Trend confirmation
━━━━━━━━━━━━━━━━━━━━━━━━━━━━━━━━━━━━━━━━
⚠️ DISCLAIMER:
This indicator is for educational purposes only. Past performance does not guarantee future results. Always:
- Practice on demo account first
- Use proper risk management
- Never risk more than you can afford to lose
- Seek professional financial advice
- Understand that trading carries risk
━━━━━━━━━━━━━━━━━━━━━━━━━━━━━━━━━━━━━━━━
🎓 BASED ON:
- ICT (Inner Circle Trader) Concepts
- Smart Money Theory
- Order Flow Analysis
- Institutional Trading Zones
- Market Structure Theory
━━━━━━━━━━━━━━━━━━━━━━━━━━━━━━━━━━━━━━━━
📢 FEATURES SUMMARY:
✅ Confluence-based signals (not random)
✅ Order Blocks + FVG + Liquidity integration
✅ Persistent TP/SL lines (scroll-friendly)
✅ Smart dashboard (real-time info)
✅ Customizable requirements
✅ High-probability setups
✅ Professional trading approach
✅ Works on multiple assets
✅ Clean visual presentation
✅ Beginner to advanced friendly
━━━━━━━━━━━━━━━━━━━━━━━━━━━━━━━━━━━━━━━━
Trade smart. Trade with confluence. 🎯
#ICT #SmartMoney #OrderBlocks #FVG #Gold #Forex #TradingStrategy #Confluence

SMC OB+HOBSmart Money OB/HOB Indicator — Quick Guide
Use this as a field manual: what you’re seeing, how it’s decided, and which settings to use for different timeframes and trade styles.
What the tool plots
Bullish Order Block (OB) — teal box
The last small down candle before a bullish displacement/BOS. Height = candle body (default) or wick range (if you choose “Wick”).
Pin (small white dot) at the origin candle’s time to make anchoring obvious.
Bearish Order Block (OB) — red box
The last small up candle before a bearish displacement/BOS.
Hidden Order Block (HOB) — same box but yellow-tinted fill
A valid OB with one or more same-bias FVGs “ahead” (i.e., OB sits “behind” inefficiency). These tend to be stronger.
Mitigation state (fill transparency)
Unmitigated (least transparent): price hasn’t meaningfully traded back into the box. Highest priority.
Partial (more transparent): some penetration; still valid.
Full (most transparent): fully consumed; lower priority (optional to hide).
Top-K border — thin white outline
Only the best-scoring OBs/HOBs per direction are drawn to reduce clutter.
Auto-Fibs (optional)
OTE zone (0.62–0.79) — subtle purple band across the current swing leg.
0.618 / 0.705 / 0.786 — thin white horizontal lines. Confluence here adds score.
Trade idea lines (per Top-K block)
Entry — white line (mid/edge per your setting).
Stop — red line (box edge ± your pad).
TP1/TP2 — lime lines, R-based from entry→stop distance.
Label shows LONG/SHORT, entry, SL, TP1, TP2, time-stop (bars).
Note: Fair Value Gaps (FVGs) are tracked internally to classify HOBs and for pruning, not drawn to avoid noise.
How a block is qualified (in plain English)
BOS + Displacement:
Close breaks the recent swing high/low by at least N ticks and the bar shows impulse (body ≥ X·ATR and ≥ Y% of its total range).
(Settings: “Close beyond ≥ ticks”, “Min impulse body (x ATR)”, “Body/TR min %”)
Seed candle:
Look back ≤ N bars for the last opposite small-body candle (body ≤ Z% of its range). That candle’s body/wick becomes the OB height.
(Settings: “Last opposite candle within N bars”, “OB body ≤ % of TR”, “OB height model”)
Hidden OB:
Count same-bias FVGs “ahead”. If ≥ your threshold → tag the OB as HOB.
(Setting: “Require ≥ N same-bias FVGs ahead”)
Mitigation tracking:
As price trades into the box, we compute penetration %, updating unmitigated / partial / full state each bar.
Ranking (Top-K):
Every OB/HOB gets a score: near price, newer, hidden, near fib, and unmitigated boost. We draw only the Top-K per direction.
Inputs you’ll actually tweak
Timeframe
Compute on: Current (uses your chart TF) or Specific (MTF scan).
Process last N bars: reduce for speed, increase to see more history.
Anchoring
Extend: Right, Limited, or Origin only.
Limited draws boxes to a fixed number of bars so charts stay clean.
Show origin pins: Keep on so you always know the source candle.
Structure / BOS (signal frequency vs. quality)
Require FVG on break bar: ON = stricter, OFF = more signals.
Min impulse body (x ATR): higher = stricter.
Body/TR min %: higher = stricter.
Close beyond ≥ ticks: 0–1 for LTF; 1–3 for HTF.
Order Blocks
OB height model: Body (cleaner) or Wick (wider protection).
Last opposite candle within N bars: 3–8 (higher finds more).
OB body ≤ % of TR: 0.35–0.70 (lower = stricter).
Min OB height (ticks): 1–2 (avoid micro slivers).
Expire on first touch: If ON, removes boxes after first reaction.
Hidden OB
Require ≥ N FVGs ahead: 0–1 for LTF (more HOBs), 1–2 for HTF.
Mitigation Filter (what you show)
Toggle Unmitigated / Partial / Full visibility.
For precision trading, keep Unmitigated on; show others while scanning.
Auto-Fibs
Enable fib confluence: On adds score near 0.618/0.705/0.786.
Draw lines / OTE: Visual only; confluence also boosts ranking.
Tolerance (x ATR): how close price must be to count as “near fib”.
Ranking & Draw
Top-K per direction: how many OBs/HOBs you’ll see each side.
Prefer near / newer / hidden / unmitigated: scoring toggles.
Fib boost: how much fib confluence bumps a level.
Trade Ideas
Entry style: 50% of OB (balanced) or OB edge (faster fills).
Stop pad (ticks/ATR): give a little room beyond the box edge.
TP1/TP2 (R): risk-multiple targets (e.g., 1R, 2R).
Time stop (minutes): exit if it doesn’t go in time.
Execution / Alerts (recommended)
Keep on-close workflow: do not enable calc_on_every_tick.
When creating alerts, choose Once per bar close.
How to use it (mechanical checklist)
Scan: Focus on Top-K boxes. HOBs (yellow-tinted) and unmitigated get first look.
Context (optional): If you like, also check HTF structure or obvious liquidity pools (equal highs/lows).
Confluence: Prefer boxes near 0.618/0.705/0.786 or inside the OTE band.
Trigger: Let the bar close. If entry line is touched next, you have a go-signal with a placed stop and R-targets.
Manage: If TP1 hits, move SL to BE. For HOBs, consider a runner (trail under minor swing/FVG) — they often travel further.
Time stop: If it hasn’t moved within N minutes/bars, cut it; don’t babysit.
Preset recipes (copy these settings)
1) Hyper-Scalp (1–3m) — frequent, fast
Structure / BOS:
FVG on break = OFF | Min impulse = 0.6–0.8 | Body/TR = 0.45–0.55 | Close beyond = 0–1
Order Blocks:
Opposite lookback = 5–6 | OB body ≤ 0.55–0.60 | Min height = 1
HOB: Need FVGs = 0–1
Mitigation view: Show Unmit/Partial, optionally Full while scanning
Ranking: Top-K = 4–6, prefer near/new/hidden/unmit = ON, Fib boost = 0.6–1.0
Trade Ideas: Entry = OB edge, Stop pad = 1–2 ticks, Time stop = 5–8 min
Execution: On bar close alerts
2) Intraday (5–15m) — balanced
Structure / BOS:
FVG on break = OFF | Min impulse = 0.8–1.0 | Body/TR = 0.55–0.60 | Close beyond = 1
Order Blocks:
Opposite lookback = 4–5 | OB body ≤ 0.50–0.55 | Min height = 1–2
HOB: Need FVGs = 1
Ranking: Top-K = 3–4, Fib boost = 1.0–1.5
Trade Ideas: Entry = 50%, Stop pad = 2–3 ticks, Time stop = 10–20 min
3) Swing (1H–4H) — selective, higher quality
Structure / BOS:
FVG on break = ON | Min impulse = ≥1.0 | Body/TR = ≥0.65 | Close beyond = 1–3
Order Blocks:
Opposite lookback = 3–4 | OB body ≤ 0.45–0.50 | Min height = 2–4
HOB: Need FVGs = 1–2
Ranking: Top-K = 2–3, Fib boost = 1.5–2.0
Trade Ideas: Entry = 50%, Stop pad = a few ticks + ATR pad, Time stop = few bars
4) HTF (Daily+) — very selective
Keep swing settings, increase Min impulse and Close beyond a bit, reduce Top-K to 1–2.
Priority rules (what to trade first)
HOB over OB
Unmitigated over partial/full
With fib confluence over without
Near price and recent over far/old
Favor levels that follow a sweep (equal highs/lows taken, then return to your box)
If two boxes tie, take the one with the cleaner origin candle and simpler path to TP (fewer nearby obstacles).
Troubleshooting & tips
“I’m not seeing many signals.”
Loosen Structure/BOS (lower ATR and Body/TR), increase Opposite lookback, allow Partial/Full in view, raise Top-K.
“Too many lines/boxes.”
Lower Top-K, use Limited extension (Anchoring), hide Partial/Full, and keep fib lines if you rely on confluence.
“Stuff looks offset.”
Keep origin pins on. Use xloc.bar_time (already in code) and avoid custom time compressions that desync objects.
Execution discipline:
Use on-close alerts. Respect time stops. Size by fixed risk per trade, not fixed leverage.
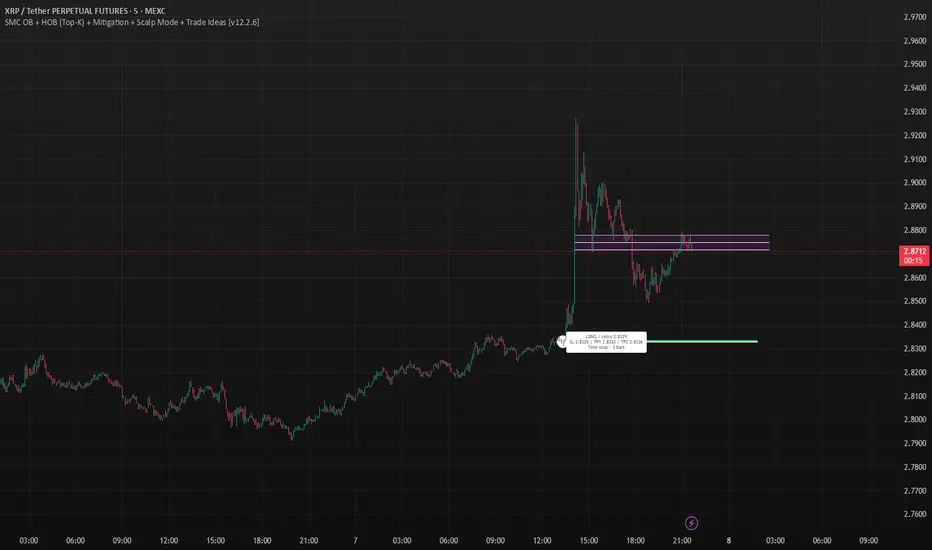
DT_KEY_LEVELSDT_Key_Levels: Powerful Market Structure Analysis Indicator
DT_Key_Levels is an advanced indicator for fundamental market structure analysis, optimized for higher timeframes (D1, W, M). The indicator combines three powerful technical analysis tools — fractals, Fair Value Gaps (FVG), and psychological levels — in one comprehensive solution.
Three Components of the Indicator
1. Enhanced Fractal System
The indicator uses an improved version of Bill Williams' classic fractals, allowing for deeper market structure analysis:
Dual Identification System:
Standard 5-bar fractals (displayed with thick lines) for analyzing reliable support/resistance levels
Light 3-bar fractals (displayed with thin lines) for early identification of potential reversal points
Intelligent Tracking System:
Automatic detection and filtering of completed fractals
Marking fractals with corresponding timeframe designation (HTF-1D, HTF-1W, HTF-1M)
Tracking and marking the All-Time High (ATH)
2. Fair Value Gaps (FVG) System
The indicator identifies and visualizes price gaps in market structure — zones that often act as magnets for future price movements:
Precise Identification of Inefficient Zones:
Bullish FVG: when the current candle's low is above the -2 candle's high
Bearish FVG: when the current candle's high is below the -2 candle's low
Detailed Visualization:
Clear display of upper and lower boundaries of each FVG
Midline (0.5 FVG) for determining key reaction levels within the gap
Marking each FVG with "FF" (Fair value Fill) label for quick identification
Dynamic Management:
Automatic removal of FVGs when they are filled by price movement
Customizable line extension for improved tracking of target zones
3. Intelligent Psychological Levels
The indicator automatically determines key psychological levels with adaptation to the type of instrument being traded:
Specialized Calibration for Various Assets:
Forex (EUR/USD, GBP/USD, USD/JPY): optimization for standard figures and round values
Precious metals (XAUUSD): adaptation to typical gold reaction zones with a $50 step
Cryptocurrencies (BTC, ETH): dynamic step adjustment depending on current price zone
Stock indices (NASDAQ, S&P500, DAX): accounting for the movement characteristics of each index
Smart Adaptation System:
Automatic determination of the optimal step for any instrument
Generation of up to 24 key levels, evenly distributed around the current price
Intelligent filtering to display only significant levels
Practical Application
Strategic Analysis
Identifying Key Structural Levels:
Use monthly and weekly fractals to determine strategic support/resistance zones
Look for coincidences of fractals with psychological levels to identify particularly strong zones of interest
Determine long-term barriers using type 5 fractals on higher timeframes
Analysis of Market Inefficiencies:
Track the formation of FVGs as potential targets for future movements
Use FVG midlines (0.5) as important internal reaction levels
Analyze the speed of FVG filling to understand trend strength
Tactical Trading Decisions
Entry Points and Risk Management:
Use bounces from fractals in the direction of the larger trend as a signal for entry
Place stop-losses behind fractal levels or key psychological levels
Monitor the formation of new fractals as a signal of potential reversal
Determining Target Levels:
Use unfilled FVGs as natural price targets
Apply nearby psychological levels for partial position closing
Project higher timeframe fractals to determine long-term goals
Indicator Advantages
Comprehensive Approach: combining three methodologies for a complete understanding of market structure
Intelligent Adaptation: automatic adjustment to the characteristics of different types of assets
Clean Visual Presentation: despite the abundance of information, the indicator maintains clarity of display
Effective Signal Filtering: automatic removal of completed levels to reduce visual noise
Higher Timeframe Optimization: specifically designed for daily, weekly and monthly charts
Usage Recommendations
Use the indicator only on D1, W, and M timeframes for the most reliable signals
Pay special attention to areas where different types of signals coincide (e.g., fractal + psychological level)
Use higher timeframe fractals as key zones for medium and long-term trading
Track FVGs as potential target zones and focus on their filling

The Ultimate Indicator by ATK
The Ultimate Indicator By ATK
This all-in-one trading indicator integrates multiple advanced tools to provide ICT traders with deep insights into market structure, liquidity zones, Fair Value Gaps (FVG), and AI-powered signals. Whether you’re a scalper or a long-term trader, this indicator offers real-time analysis and helps identify potential trading opportunities in dynamic markets.
🔵 Key Features
🔹 2 options for checking SMT (Separation and Divergence) Detection:
First - Compares highs and lows of a primary symbol (e.g., NQ1!) with a user-defined comparison symbol (e.g., ES1!).
Automatically detects and visualizes discrepancies (red for highs, blue for lows) between the symbols.
Offers customizable comparison settings and alerts for divergence detection.
Second -
Real-time SMT comparison between two tickers - red/green lines.
🔹 Market Structure Change (MSS) & Break of Structure (BOS) Detection:
Identifies market structure shifts and breakouts, crucial for spotting potential reversals.
Customizable sensitivity and length settings to adapt to various market conditions and trading strategies. Use 3 different timeframes on the same chart.
🔹 Buy Side & Sell Side Liquidity Zones:
Highlights liquidity zones on both buy and sell sides, offering a clear view of market pressure points.
Configurable settings for detection length, margin, and alert conditions for liquidity sweeps like the 15-minute Buy Side Liquidity (BSL) and Sell Side Liquidity (SSL).
These lines from Swing Highs & Lows:
Automatically plots horizontal lines at the most recent swing highs and lows.
Lines are removed once the closing price breaches these levels, ensuring real-time updates and clean charting.
🔹 Fair Value Gap (FVG) Detection:
Detects FVG formations on 5-minute and 1-minute charts, making it ideal for scalpers capturing liquidity gaps.
Includes directional arrows and customizable alerts based on higher and lower timeframe FVG analysis, helping traders time their entry and exit points.
🔹IFVG (Inverse fair value gap) - yellow
🔹IFVG + SMT - Light blue
🔹IFVG + SMT + HTF FVG - green/red (1 min only)
🔹IFVG + SMT + BSL/SSL Swept - green/red (1 min only)
for example:
🔹 Capture and plot significant price levels at specific times throughout the trading day:
TDO (True Day Open): The price at which a market opens at 12:00 AM US.
TMSO (True Micro Session Open): The open price of the Q2 of the micro session.
RVT (Revolving True Open): The price recorded at 12:00 PM US.
AO (Asia True Open Price): The price captured at 7:30 PM US, specifically representing the opening price of the Asian session.
LO (London True Open Price): 1:30 AM US
AM (New York Session - Afternoon Market True Open Price): 7:30 AM US
PM (Post Market Open Price): 1:30 PM US.
For example TMSO:
🔹 AI-Powered Entry Detection:
The script helps identify entry points based on specific candle patterns, while also considering the exponential moving averages (EMAs) for trend confirmation.
🔶FFMS Strategy: (First Five Minute Strategy)
Check 5-min time frame if the price is between the high and low of the previous day. then, when NYO if there is retest on the High/Low on the 5-min chart after crossover or crossunder the 5 minute first candle high/low lines.
🔶PSP & PSP + FVG
🔹The Precision Swing Point (PSP). It helps you visually identify price decorrelation (type of SMT) among key futures contracts (NQ/ES or NQ/ES/YM/ZB) and set alerts for these significant market movements.
🔹The PSP HTF 15 Min + FVG LTF 1 Min
In this strategy the script is looking for PSP in HTF (15-Min) and capture the FVG in LTF (1-Min) only if its between High and Low of the PSP.
If there is a retracement in parallel micro session time, for example: Q1 with Q3 or Q2 with Q4, Q3 with Q1, etc…
if the retracement was happened and the price close above/below the high/low of the FVG from the LTF that captured according to the direction for long/short, it plots an arrow.
Update the script that checks the purple arrows and shows all of them each time there is a new PSP in a 15-minute timeframe and then FVG in 1 Min timeframe with the reference to the TDO/TMSO/Open session
for example:
Step 1: PSP 15Min LOW/HIGH Lines look for FVG by the conditions above - purple arrow
Step 2:FVG founded - purple arrow
SMT Fill on 15 min timeframe + IFVG 1 min - Detected option:
When Sym1 closed above/below FVG and Sym2 didn't it is SMT FILL (15 Min timeframe)
White arrows when captured SMT FIll + IFVG:
option to turn on alert on this strategy too.
🔹Detect liquidity swept on 15-min timeframe by $$ - green/red
🔹Detect liquidity to sweep zones on by diamonds - green/red
🔹Alerts for all Events and full scenarios.
Real-time notifications ensure traders can act quickly on potential trade setups.
🔵 Conclusion:
This Ultimate Indicator by ATK brings together critical elements of market analysis in one tool for ICT traders, offering real-time insights, alerts, and visual aids to enhance trading strategies. Whether you’re focused on short-term price action or long-term market trends, this indicator provides the tools necessary for informed decision-making and improved trading performance.
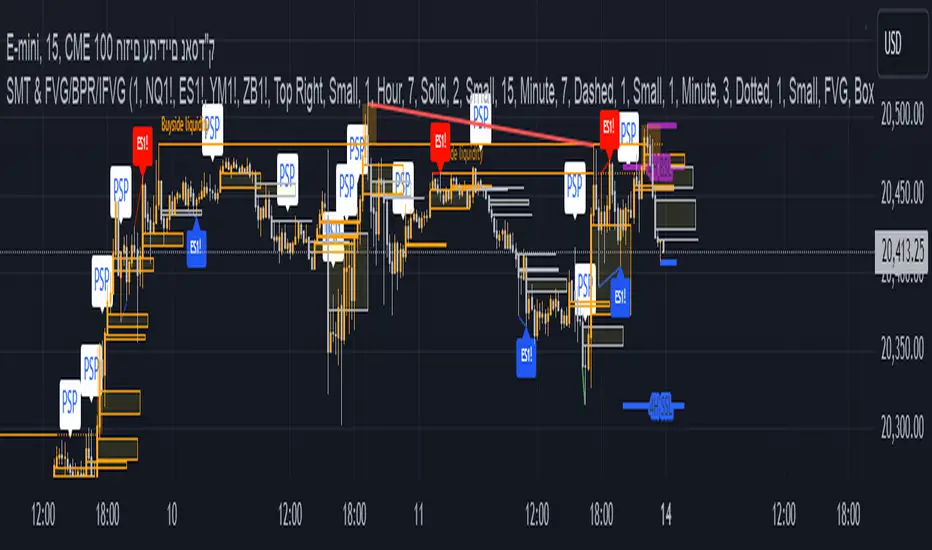
cd_sfp_CxGeneral:
This indicator is designed to assist users who trade the Swing Failure Pattern ( SFP ).
In technical literature (various definitions exist), an SFP is a situation where the price violates a previous swing level but fails to close beyond that level.
• (Liquidity Sweep)
• (Buyer or seller dominance)
• (Stop hunt)
• (Turtle Soup)
The general strategy is built upon seeking trade opportunities after an SFP is formed and conviction is established that the market direction has changed.
Components used to gather confirmation:
• Determining Bias: Periodic SAR
• Obtaining Breakout/Reversal Confirmation: Change in State Delivery (CISD)
• Defining the Buyer/Seller Block (Supply/Demand Zones): Mitg Blocks (Mitigation Blocks), FVG (Fair Value Gaps), and Standard Deviation Projection
• Key Levels: Previous HTF (Higher Time Frame) levels
• Setting Targets: Standard Deviation Projection
• Trade Management: Anchored VWAP and opposing blocks
• Time-Based Context: Session Killzone times
• Notifications: An alarm/alert system will be utilized to stay informed.
________________________________________
Details:
Swing and Swing Failure Pattern:
Swing Sweep Types (Liquidity Sweep):
1. Single
2. Consecutive (The liquidity of the entity that swept the liquidity is being swept)
Bias Determination
We need to filter out the numerous SFPs that occur across all time frames. Our first strong filter will be the Bias. We will only look for trades aligned with our bias.
We will use Periodic SAR (Stop and Reverse) to determine the bias. We compare the price with the SAR value from a Higher Time Frame than the one we are trading on.
• Price > SAR => Bullish Bias
• Price < SAR => Bearish Bias
Depending on the pair, H1 SAR may be chosen for scalp trades, and Daily/Weekly SAR for intraday and swing trades.
Key Levels
Strategies looking for trades after a liquidity grab generally state that the sweep / stop hunt movement should occur at a significant price level.
The most fundamental Key Level levels are (User can customize):
• Previous Week High & Low
• Previous Day High & Low
• Previous H4 High & Low
• Previous H1 High & Low
• Asia Killzone High & Low
• London Killzone High & Low
• New York Killzone High & Low
• Monday Range High & Low values
We will prefer SFP formations that occur when these levels are swept. When Key Levels are violated, an information label appears on the screen.
Blocks / Zones
To strengthen our hand, we will use three types of blocks/zones, either with Key Levels or separately. When an SFP structure is formed in these areas (along with bias and breakout confirmation), our expectation is for the price to continue in our desired direction. These regions are:
1. Mitigation Blocks (Mtg)
o (Details can be found in the cd_VWAP_mtg_Cx indicator)
o In short: A second candle, following a bullish candle, crosses its high but fails to close above it. We call this a sweep / SFP. When the price, which was expected to go to the low, instead makes a new high/close, an Mtg block is formed. (Buyers are dominant)
2. FVGs (Fair Value Gaps)
o We use classic FVG structures.
3. Standard Deviation Projection Boxes
o When we get an SFP structure + breakout confirmation (CISD), we use the Standard Deviation Projection to determine our profit-taking and take-profit levels.
o Based on the idea that the price often respects the range between -2 and -2.5 of the projection values, we box this range and use it as our area of interest. (Our expectation is for the price to reverse after reaching this target).
o Let's mark it on the chart.
Confirmation
To summarize what has been explained so far: we look for the price to form an SFP structure in levels/zones we deem important, aligned with our bias, and for the breakout to be confirmed with a CISD.
No single component is strong on its own, but the success rate increases when they occur together.
We observe the following as additional confirmation along with the CISD: a new Mtg block forming in the direction of the breakout, high-volume movement (with FVG and a large body), and respect for VWAPs, the resistance/support line, and the defense block.
Additional Confirmations with Breakouts:
• Defence block, new mtg and VWAP
• Resistance / Support Line:
Indicator Signals
The indicator marks all formed sweeps, selected key levels, blocks, the projection, and CISD confirmations on the screen. The candle where the CISD confirmation occurs is indicated by an arrow.
• Arrows with double short lines signify a CISD that follows an SFP occurring at a Key Level.
• All other CISD candle indications are shown with single-line arrows.
Trade Management
When selecting profit targets in trades (preferably), the projection, opposing blocks, and structures that have formed are taken into account. Do not neglect to look at the structures that have formed against you when entering a trade.
Menu Settings:
• For Mtg blocks, the trading timeframe or a higher timeframe can be selected.
• FVGs formed in the current timeframe are displayed when the price creates an SFP (in "Fvg" option).
• Deviation boxes are displayed when the price creates an SFP (in box).
• The SAR HTF setting (H1) for scalp trades may vary depending on the pair. Users trying trades on higher timeframes should increase the HTF setting.
o Example: If you are looking for a trade with an SFP structure on H1, the SAR HTF setting should be H4 or higher.
• VWAP lines are refreshed starting from the candle that executed the sweep when the price forms an SFP. The only setting to adjust is the source selection setting (hlc3 is selected).
• Time frames and Killzone / Special Zone settings for Key Levels can be changed/should be checked.
Alarms / Alerts:
The conditions that will trigger an alert can be selected from the menu.
• To receive an alert aligned with the bias, the "Alignment with bias" checkbox must be selected.
• The alert should be set on the timeframe where you plan to enter the trade.
• The display options do not affect the alarm conditions. (Example: FVGs are monitored even when the menu selection is "off").
• If the necessary conditions are met, the alarm is triggered on the new candle that opens after the CISD confirmation.
• The alarm will not be triggered more than once at the same Key Level.
The user can preferably select alerts:
• Bias-aligned or Bias-independent
• Sweep (without waiting for CISD)
• Sweep + CISD (without looking for other conditions)
• Sweep + Key Level + CISD (the swept level is a Key Level)
• Sweep + Mtg / Fvg / Dev. + CISD (SFP formed in any of the blocks)
• Sweep + Mtg + CISD (SFP formed in the Mtg block)
• Sweep + Fvg + CISD (SFP formed inside the FVG)
• Sweep + Deviation Box + CISD (SFP formed inside the Dev. Box)
• Sweep + Key Level + Mtg / Fvg / Dev. + CISD (SFP formed simultaneously at a Key Level and any of the blocks)
Trade Example:
• Conditions: Bias-aligned + Sweep + Mtg/Fvg/Dev (at least one) + CISD
• Extra Confirmations: Respect for the Defense Block + Respect for VWAP
• Target (TP): Projection between -2 and -2.5
I welcome your thoughts and suggestions regarding my indicator, which I believe will be successful in the long run by adhering to uncompromising risk management and a strict trading plan.
Happy Trading!

IFVG ExtendedThis indicator identifies and visualizes "Imbalance Fair Value Gaps" (IFVGs) on a price chart. It highlights these gaps, tracks their evolution, and signals when they are "filled" or "invalidated" by price action. The script is quite advanced, using custom types, arrays, and dynamic drawing.
1. Types and Variables
Custom Types:
lab: Stores label information (x, y, direction).
fvg: Stores Fair Value Gap data, including its boundaries, direction, state, labels, and other properties.
Arrays:
Four arrays track bullish and bearish FVGs, and their "invalidated" (filled) versions.
Signals:
Boolean variables to store if a bullish or bearish signal is triggered.
2. User Inputs and Parameters
Display Settings:
How many recent FVGs to show, signal preference (close or wick), ATR multiplier for gap size filtering, and colors for bullish/bearish/midline.
3. Chart Data
Price Data:
Open, high, low, close, and ATR (Average True Range) are stored for use in calculations.
4. Functions
label_maker:
Draws an up or down arrow label at a given point, colored for bullish or bearish.
fvg_manage:
Checks if any FVGs in the array have been "invalidated" (i.e., price has crossed their boundary). If so, moves them to the invalidated array.
inv_manage:
Manages invalidated FVGs, checking if a signal should be fired (i.e., price has reacted to the gap). Also removes old FVGs.
send_it:
Draws the FVGs and their labels on the chart, using boxes and lines for visualization.
5. Main Logic and Visualization
FVG Detection:
On each bar, checks for new bullish or bearish FVGs based on price action and ATR filter.
Adds new FVGs to the appropriate array.
FVG Management:
Updates the arrays, moves invalidated FVGs, and checks for signals.
Drawing:
On the last bar, clears all previous drawings and redraws the current FVGs and their labels.
6. Alerts
Alert Conditions:
Sets up alerts for when a bullish or bearish IFVG signal is triggered, so users can be notified.
Summary
In short:
This script automatically finds and tracks "Imbalance Fair Value Gaps" on your chart, highlights them, and alerts you when price interacts with them in a significant way. It uses advanced Pine Script features to manage and visualize these zones dynamically, helping traders spot potential reversal or continuation points based on gap theory

OmniSessions [WinWorld]The indicator shows the range of 4 most popular sessions (New York, Tokyo, London, Sydney). Sessions are used to identify zones with maximum volatility, as well as to find entry points. Session boundaries can act as POI no worse than OrderBlock.
In addition to sessions, you can use settings with KillZones - a range within a session that has potentially high volatility.
Silver Bullet is a more advanced range that allows you to identify the potential for maximum volatility. Excellent entry points can be obtained on the sweep of the range or from the nearest orderblock. We will explain it a bit deeply below.
Why use sessions?
During specific sessions big financial instutions from specific parts of the world enter the market, and this fact alone let us find the most "liquid" sessions in order to catch the best price movements. If talking about orderblocks, it is just a point of interest (more precisely, it is actually a zone of interest), which usually is a zone where the signficant amount of limit orders lies, and when price enter such zone, it immediately shows a strong reaction with either breakout from this zone or it bounces against this zone.
How is this indicator different from others?
There a lot of orderblocks indicator out here publicly available, but huge portion of them doesn't take into calculation important smart money concepts, such as valid pullbacks, for example. Valid pullbacks is a concept of price movement, which lets us indentify quite precisely price's impulses. Based on this impulses, we search our orderblocks. This approach allows to catch the most relevant and highly liquid orderblocks, which present traders with best trade entry opportunities, because usually, when entering with these orderblocks, you follow the moves of big money players, and that gives trader an edge in trading. None of open-source indicators uses such approach ( we've studied all of them ). Also an important notice: no public code is utilized in this indicato whatsoever. We've build our own flexible session mechanism, which allows you to quickly change between different type of sessions and also choose which session to use. And the big thing is our own alorithm to deal with asset, trading sessions of which are quite exotic (such as DAX and MEOX indexes, which close and open at different times of the day, which makes it hard for indicator to catch by default), so with indicator you can enjoy trading by sessions with no "bugs".
And the most user-desired and important thing: we've implemented feature to set winter and summer seasons for sessions, and this solves life-long struggle of traders to set correct trading session time, when forex exchanges switch trading hours, so now you don't need to info which our summer or winter is traded by, but just switch between seasons by one button in our indicator. And we can proudly state, no sesions indicator in the TradingView has such feature , so feel free to use it now on our indicator.
How orderblocks are built?
When London, New York or Asia ends, we find the closest orderblocks above and below closed session's high and low respectively. We do it by finding so called valid pullbacks ( was explained above ), then searching for valid fair value gap (FVG), that is inside of some valid pullbacks, and if we find it, then the orderblock is established and you will live orderblock and fair value gap (FVG) box ( both are colored in closed session's colour ).
How are orderblocks and FVG displayed on the chart?
Live orderblock and FVG are displayed as boxes on the chart, that are plolonged each bar if price didn't reach the orderblock.
Some important details:
When price touches FVG, FVG then is modified to reflect how much of untouched FVG is left. You will see it as decreasing of FVG box size in live mode. If price fully takes over FVG, FVG deletes;
When price touches orderblock, orderblock stops being prolonged and stays on the chart and is considered as worked-out.
These featues allow you to fully see live orderblocks and FVGs (if they exist) and already worked-out orderblocks to see how useful they were in the history.
Is that it?
No, because our indicator also shows sessions sweeps, which is historically a good indication that price grabbed the liquidity of previously closed sessions and now has enough "power" to do big movements, which is a good thing for traders, because it allows them to catch big movements and profit big.
Ok, we've covered the basics, now let's talk about what exactly this indicator can do.
OmnISessions is all-in-one sessions' indicator, that cointain:
Sessions (Automatic adaptation to your time zone)
Kill Zones
Silver Bullets
Session Sweeps
Order Blocks (Session, Killzone, SilverBullet)
Easily switch between summer and winter seasons
Now you don't need to look for opening and closing times of stock exchanges: the algorithm itself adjusts the session times according to your timezone. Just change the seasonality: winter/summer and the session times will be clearly displayed on your chart.
A quick view of the settings:
Show: Sessions, KillZones or SilverBullet
Season selection: Winter/Summer
Session Color Selection
Visuals:
Show/Hide session name - displays session name (ex.: London, New York, Silver Bullet and etc.) on the chart;
Show/Hide session box - displays session range as box with coloured background on the chart;
Show/Hide High/Low sessions - displays two horizontal lines for higher and lower borders of the session;
Show/Hide OrderBlocks - displays worked-out orderblocks in the history with live orderblocks and their fair value gaps (FVGs);
Show/Hide live Session High/Low - displays higher and lower border of the session as lines, that are prolonged each bar even after the session ends;
Show/Hide Session Sweeps - displays session sweeps of higher and lower border as dotted line;
Dividers (alternative session display):
Horizontal Divider
Backgrounder coloring
Customization: choose the display type: Sessions, Killzones or Silver Bullet.
The indicator displays orders that are above or below the previous session boundaries.
Below are Killzones with Order Blocks:
And this is Silver Bullet with Order Blocks:
Overall, you can clearly see that orderblocks, sessions sweeps and different type of sessions in one indicator allow you to fully utilize your time and mental energy, because finding orderblocks with valid pullbacks by hand is quite time-costly task, but finding them on different type of sessions, while not knowing trading hours of current trading session, is the true hell of work. OmniSessions indicator performs all of these calculations by itself, so you can focus on finding the best entries, while checking the situation on different sessions at the same time.
We hope that you will find great use of OmniSessions!
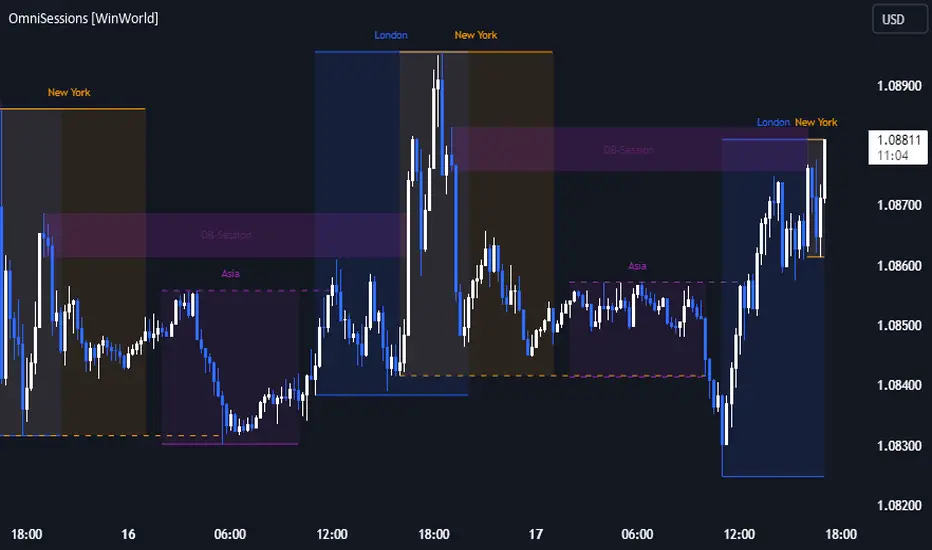
Momentum Master v1# Momentum Master v1 - Multi-Strategy Trading System
## SCRIPT OVERVIEW
Momentum Master v1 is a multi-strategy trading system that integrates 6 distinct trading methodologies (EMA Crossover, RSI Mean Reversion, Breakout, MACD Crossover, Bollinger Bands, Volume Breakout) through a shared risk management pipeline. This script implements a proprietary integration framework that creates synergistic value beyond what individual indicators provide, combining advanced technical analysis techniques with institutional flow analysis.
## TECHNICAL METHODOLOGY
### Multi-Strategy Signal Generation Framework
The script operates on a shared execution framework where all six trading strategies share the same risk management system, but each strategy uses its own unique entry logic:
1. **EMA Crossover System**: Detects momentum shifts using configurable fast/slow EMA periods (Standard 9/21, Fast 7/17, Slow 13/26, or Custom)
2. **RSI Mean Reversion**: Identifies overbought/oversold conditions for counter-trend opportunities
3. **Breakout Detection**: Captures price breakouts from consolidation zones
4. **MACD Crossover**: Uses MACD line crossovers to confirm trend changes
5. **Bollinger Bands**: Trades bounces from band extremes and breakouts
6. **Volume Breakout**: Confirms moves with above-average volume
**Why This Integration Creates Unique Value:**
This is not a simple indicator mashup. The proprietary integration framework creates synergistic value through:
- **Shared Risk Management**: All strategies share ATR-based stop loss calculation and multiple take profit levels (TP1-TP6 with ratios 1:2, 1:4, 1:6, 1:8, 1:10, 1:12)
- **Adaptive Confidence Scoring**: The system evaluates market context from multiple perspectives simultaneously
- **Shared Filter System**: Optional filters (RSI extremes, ADX trend strength, Volume confirmation, POC proximity) apply uniformly across all strategies
## FLOW ANALYSIS INTEGRATION
### Fair Value Gap (FVG) Retracement Validation
The script implements proprietary FVG detection with retracement validation logic:
- **200-bar lookback** with **20% ATR tolerance** for gap identification
- **Retracement confirmation**: Signals can require price to retrace into a recent FVG before entry (optional filter)
- **Size filtering**: Only displays FVGs above minimum ATR threshold (configurable)
- **Visual tracking**: Shows last N FVGs with color-coded boxes (bullish green, bearish red)
**How FVG Integration Enhances Strategy Signals:**
When a strategy generates a signal, the FVG system validates whether price has recently retraced into an institutional order flow gap. This adds a layer of confirmation that the move is supported by institutional activity, not just retail momentum.
### Order Block Detection with Directional Alignment
- **Institutional accumulation/distribution zones**: Identifies the last bullish/bearish candle before a significant move
- **Directional filter**: Optional setting to only allow trades aligned with the most recent order block direction
- **ATR-based size filtering**: Filters out noise by requiring minimum order block size
- **Visual display**: Shows order blocks as colored boxes extending N bars forward
**Integration Logic:**
Order blocks represent areas where institutions accumulated or distributed positions. When a strategy signal occurs near an order block, it indicates higher probability that the move will continue in the block's direction.
### Multi-Timeframe POC (Point of Control) Analysis
The script calculates and displays POC levels from multiple timeframes:
- **Volume Profile POC**: Highest volume price over last N bars (configurable lookback)
- **Session POC**: Point of control for current trading session
- **Daily POC**: Daily volume-weighted average price
- **Weekly POC**: Weekly volume-weighted average price (optional)
**POC Proximity Filtering:**
Optional filters allow signals only when price is within X ATR of a POC level. This ensures entries occur at statistically significant price levels where liquidity is concentrated.
## FIBONACCI EXTENSION SYSTEM
### Dynamic Fibonacci Calculation
- **Swing-based detection**: Automatically identifies swing highs and lows using configurable lookback period
- **Extension levels**: Calculates Fibonacci extension levels (0.618, 0.786, 1.0, 1.272, 1.414, 1.618, 2.0, 2.618)
- **Retracement levels**: Shows standard retracement levels (0.236, 0.382, 0.5, 0.618, 0.786)
- **Negative levels**: Optional negative Fibonacci levels (-0.27, -0.618) for extended targets
**How Fibonacci Enhances Risk Management:**
Take profit levels are automatically calculated using Fibonacci extension mathematics. The system identifies the swing structure and projects potential reversal zones, allowing traders to set targets based on mathematical probability rather than arbitrary price levels.
## LIQUIDITY ZONE DETECTION
### Buy and Sell Side Liquidity
- **Swing-based liquidity zones**: Identifies recent swing highs (sell-side liquidity) and swing lows (buy-side liquidity)
- **Configurable lookback**: Adjustable period for liquidity zone detection
- **Visual display**: Horizontal lines extending N bars forward to show liquidity targets
- **Maximum zones**: Limits display to most recent N zones to avoid chart clutter
**Trading Application:**
Liquidity zones represent areas where stop losses are likely clustered. Price often moves to "sweep" these liquidity zones before reversing, creating high-probability entry opportunities.
## RISK MANAGEMENT SYSTEM
### ATR-Based Stop Loss Calculation
- **Dynamic stop placement**: Stop loss calculated using ATR (Average True Range) with configurable multiplier
- **Adaptive to volatility**: Stop loss automatically adjusts to current market volatility conditions
- **Configurable ATR period**: Default 14-period ATR, adjustable from 5-30 periods
- **SL multiplier**: Adjustable from 0.5x to 10x ATR for different risk profiles
### Multiple Take Profit Levels
The system supports up to 6 take profit levels with fixed risk-reward ratios:
- **TP1**: 1:2 risk-reward ratio
- **TP2**: 1:4 risk-reward ratio
- **TP3**: 1:6 risk-reward ratio
- **TP4**: 1:8 risk-reward ratio (optional)
- **TP5**: 1:10 risk-reward ratio (optional)
- **TP6**: 1:12 risk-reward ratio (optional)
**Why Multiple TP Levels:**
This allows partial profit-taking at key Fibonacci extension levels while letting winners run. The system tracks win rates for each TP level, helping traders optimize their exit strategy.
## SIGNAL FILTERS (OPTIONAL ENHANCEMENTS)
### RSI Extreme Filter
- **Avoid overbought/oversold extremes**: Prevents entries when RSI is in extreme zones (default: >70 overbought, <30 oversold)
- **Configurable thresholds**: Adjustable RSI levels and calculation period
- **Purpose**: Reduces false signals in exhausted moves
### ADX Trend Strength Filter
- **Avoid choppy markets**: Only allows trades when ADX indicates trending conditions (default: ADX > 20)
- **Configurable threshold**: Adjustable ADX minimum value (10-50)
- **Purpose**: Filters out low-probability trades in ranging markets
### Volume Confirmation
- **Volume multiplier**: Requires volume above X times average (default: 1.1x)
- **Purpose**: Ensures moves are supported by institutional participation
### POC Proximity Filters
- **Volume POC filter**: Only enter when price is near Volume Profile POC
- **Session POC filter**: Only enter when price is near Session POC
- **Daily POC filter**: Only enter when price is near Daily POC
- **Weekly POC filter**: Only enter when price is near Weekly POC
- **Proximity threshold**: Configurable ATR multiplier for "near" definition (default: 2.0x ATR)
---
## DIVERGENCE DETECTION
### MFI (Money Flow Index) Divergence
- **Bullish divergence**: Price makes lower low, MFI makes higher low (potential reversal up)
- **Bearish divergence**: Price makes higher high, MFI makes lower high (potential reversal down)
- **Configurable lookback**: Adjustable period for divergence detection (default: 100 bars)
- **Minimum bars between divergences**: Prevents duplicate signals (default: 10 bars)
- **Advanced thresholds**: Separate thresholds for RSI, price, and MFI divergence strength
**Note**: Divergence detection is visual-only and does not filter trades. It provides additional market context for discretionary traders.
## MARKET CONTEXT TOOLS
### Session High/Low Lines
- **Recent session extremes**: Displays horizontal lines for session high and low
- **Configurable lookback**: Adjustable period for session calculation (default: 10 bars)
- **Purpose**: Identifies key intraday support/resistance levels
### Swing Point Detection
- **Automatic swing identification**: Marks significant swing highs and lows
- **Visual reference**: Helps identify market structure and trend direction
### Signal Overview Table
Real-time technical analysis overview:
- **Current RSI**: Relative Strength Index value
- **ATR**: Current Average True Range
- **ADX**: Average Directional Index (trend strength)
- **EMA status**: Current fast/slow EMA relationship (Bullish/Bearish/Neutral)
- **POC levels**: Current price relative to POC levels
- **Confidence score**: Calculated confidence percentage based on confluence
- **Volume trend**: Current volume trend direction
## CHART DISPLAY OPTIONS
### Entry/SL/TP Lines
- **Visual trade management**: Displays entry price, stop loss, and all take profit levels as horizontal lines
- **Configurable length**: Lines extend N bars forward (default: 30 bars)
- **Color-coded**: Different colors for entry, stop loss, and each TP level
### Win/Loss Labels
- **Trade verification**: Displays up to 500 individual win/loss labels on chart
- **Visual feedback**: Green labels for wins, red labels for losses
- **Performance tracking**: Helps verify strategy performance visually
## USAGE INSTRUCTIONS
### Initial Setup
1. **Select Strategy Mode**: Choose your preferred trading strategy from the dropdown (EMA Crossover, RSI Mean Reversion, Breakout, MACD Crossover, Bollinger Bands, Volume Breakout, or Disabled)
2. **Configure Risk Management**:
- Set ATR Length for stop loss calculation (default: 14)
- Set SL ATR Multiplier (default: 1.0)
- Enable additional TP levels if desired (TP4-TP6 are optional)
3. **Adjust Strategy Parameters**: Each strategy has its own settings group. Configure EMA periods, RSI settings, MACD parameters, etc., based on your selected strategy.
### Recommended Settings by Market Type
**Forex/Crypto (High Volatility)**:
- EMA Mode: Fast (7/17) or Custom (3/21)
- SL ATR Multiplier: 1.5-2.0
- Enable FVG retracement filter
- Enable Order Block directional filter
**Stocks (Moderate Volatility)**:
- EMA Mode: Standard (9/21)
- SL ATR Multiplier: 1.0-1.5
- Enable ADX filter to avoid choppy markets
- Enable Volume confirmation
**Indices (Lower Volatility)**:
- EMA Mode: Slow (13/26)
- SL ATR Multiplier: 0.8-1.2
- Enable POC proximity filters
- Enable RSI extreme filter
### Advanced Configuration
1. **Enable Optional Filters**: Navigate to "Signal Filters" section and enable filters that match your trading style
2. **Configure Market Analysis Tools**: Adjust FVG, Order Block, Fibonacci, and POC settings in their respective sections
3. **Customize Display**: Toggle chart display options to show/hide various elements based on your preference
---
## WHY THIS INDICATOR COMBINATION CREATES UNIQUE VALUE
### Multi-Layered Confluence Analysis
This script is not a simple indicator mashup. It implements a proprietary integration framework that creates synergistic value through three layers of analysis:
**Layer 1: Fibonacci Mathematics**
- Golden Zone identification (61.8%-78.6% retracement zone) using three-point trend-based calculation
- Extension targets based on swing structure mathematics
- Statistically significant retracement areas where price is likely to reverse
**Layer 2: Institutional Flow Analysis**
- Fair Value Gaps (FVGs) identify order flow gaps where price must return
- Order Blocks mark institutional accumulation/distribution zones
- Multi-timeframe POC analysis shows where liquidity is concentrated
- Liquidity zones identify where stop losses cluster
**Layer 3: Multi-Strategy Signal Generation**
- Six different entry methodologies provide multiple perspectives
- Shared risk management ensures consistent position sizing
- Adaptive confidence scoring evaluates confluence from all three layers
- Optional filters allow customization for different market conditions
### Proprietary Integration Framework
The unique value comes from how these components work together:
1. **Strategy generates signal** → 2. **FVG/Order Block validates institutional support** → 3. **POC confirms liquidity level** → 4. **Fibonacci provides target zones** → 5. **Risk management calculates optimal SL/TP placement**
This creates a complete trading system, not just a collection of indicators.
---
## TECHNICAL SPECIFICATIONS
- **Pine Script Version**: v6
- **Chart Type**: Overlay (displays on price chart)
- **Max Bars Back**: 5000 (for historical analysis)
- **Max Labels**: 500 (for win/loss tracking)
- **Compatibility**: Works on all timeframes and instruments
- **Performance**: Optimized for real-time execution
---
## DISCLAIMER
This script is a technical analysis tool and does not constitute financial, investment, trading, or other types of advice. Past performance does not guarantee future results. Always use proper risk management and never risk more than you can afford to lose. The script's signals are based on mathematical calculations and should be used in conjunction with your own analysis and risk management practices.
---
## SUPPORT AND ACCESS
This is an invite-only script. To request access:
1. Visit: www.pinescriptedge.com
2. Include your TradingView username and brief trading experience
3. Access will be reviewed and granted within 24 hours
**Note**: TradingView does NOT recommend paying for or using a script unless you fully trust its author and understand how it works. You may also find free, open-source alternatives in our community scripts.
---
## VERSION INFORMATION
**Momentum Master v1** - Initial release with multi-strategy framework and institutional flow analysis integration.
For updates and new features, follow the script or check the author's profile for version announcements.
