Gann Swing Chart [One-Bar]"Gann used three types of swings chart.
One-Bar Swing Chart (1-Bar Swing Chart): The One-Bar Swing Chart, or Minor Trend Chart, follows the one-bar movements of the market. From a low price, each time the market makes a higher-high than the previous bar, a One-Bar trend line moves up from the recent low to the new high. This action makes the previous low price a One-Bar bottom. From a high price each time the market makes a lower-low than the previous bar, a One-Bar swing line moves down from the recent high to the new low. This action makes the previous high price a One-Bar top.
The combination of One-Bar tops and bottoms forms the One-Bar trend indicator chart. The crossing of a One-Bar swing top changes the One-Bar trend to up. The penetration of a One-Bar swing bottom changes the One-Bar trend to down."
This Indicator only show Gann Swing Chart use One-Bar type.
Cerca negli script per "gann"

Gann Octave 8 - Professional V 1.0Gann Octave 8 Indicator:
Core Concept: This indicator divides the price range between highest high and lowest low into 8 equal parts (octaves), creating support/resistance levels based on W.D. Gann's trading principles.
Key Components:
1. Price Range Calculation:
o Finds highest high and lowest low over a lookback period (default 50 bars)
o Divides this range into 8 equal segments (12.5% each)
2. 8 Octave Levels:
o 0% (Low Support) - Strongest support
o 12.5%, 25%, 37.5% - Minor levels
o 50% (CRITICAL) - Most important level
o 62.5%, 75%, 87.5% - Minor levels
o 100% (High Resistance) - Strongest resistance
3. Gann Angles: Projects trend lines from high/low points at various angles (1x1, 2x1, 1x2, etc.)
4. Visual Features:
o Color-coded levels
o Information table showing current position
o Background highlighting when near critical levels
o Trend analysis (bullish/bearish zones)
Trading Strategy
Entry Signals:
BULLISH TRADES:
• Price crosses above 50% level → Strong buy signal
• Price bounces from 25% or 37.5% levels → Support bounce
• Price in upper zone (above 50%) → Bullish bias
BEARISH TRADES:
• Price crosses below 50% level → Strong sell signal
• Price rejects at 75% or 87.5% levels → Resistance rejection
• Price in lower zone (below 50%) → Bearish bias
Key Trading Rules:
1. 50% Level is Critical: Most important for trend direction
2. Zone Trading:
o Above 50% = Bullish zone (look for longs)
o Below 50% = Bearish zone (look for shorts)
3. Strength Levels:
o Above 75% or below 25% = Strong moves
o Near 100% (high) or 0% (low) = Extreme levels
Risk Management:
• Stop Loss: Place below previous octave level
• Take Profit: Target next octave level
• Position Size: Reduce size near extreme levels (0%, 100%)
Example Trade:
If price breaks above 50% level:
• Entry: Long position
• Stop: Below 37.5% level
• Target: 75% level
• Risk: Monitor for rejection at resistance levels
The indicator works best in trending markets and helps identify high-probability reversal zones.
Works for both Stocks & Derivatives. Experiment with code and share your feedback in comments..

Gann Levels 360
This indicator plots a series of horizontal lines on a chart based on pre-defined levels and the current market price. These levels are believed to be significant for potential support and resistance zones according to the Gann trading methodology.
This code defines a custom indicator that plots a set of Gann levels and dynamically adjusts them based on the current market price. Users can change the line color through the input option.


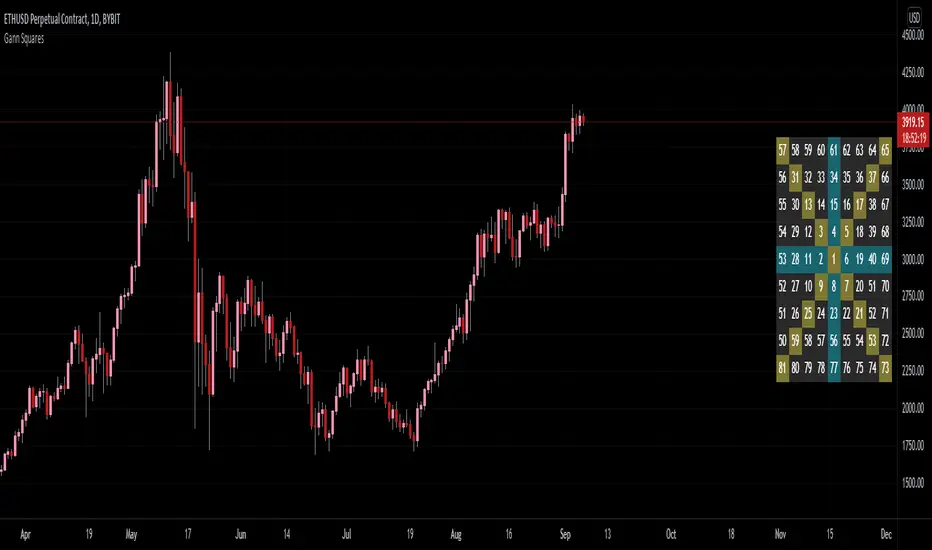
GANN Square Of 9 PivotsGANN Square Of 9 Pivots
How to use for Intraday ?
Method 01 (From 9:05 am to 9:15 am or pre-open market)
Take the Weighted Average Price or Volume Weighted Average Price (VWAP) or Time Weighted Average Price (TWAP) of any stock or index.
You can use TWAP for Index as volume is not available.
Method 02 (From 9:05 am to 9:15 am or pre-open market)
Take the Last Traded Price (LTP) of index or stock
Method 03 (After 9:30 am or after 1st 15 min)
Only take Last Traded Price (LTP) of stock or index
Ideal Time
15min to 1hr after market opens
Indicator Features
Lines
Gray Dashed Line: Calculation Price
Teal Solid Line: Long Above
Red Solid Line: Short Below
3 Teal Dotted Lines: Bullish Targets 1, 2 & 3
3 Red Dotted Lines: Bearish Targets 1, 2 & 3
Labels
1st Numbers: Price
2nd Numbers in (): % change from LTP to that Level
For Index
As VWAP is not available for Index, TWAP (Time Weighted Average Price) values can be used for Index.
Custom Price Inputs
Price of your choice can be given manually by selecting:
Source > Custom
Enter Price > (type the price)
Timeframe
Higher timeframes like Weekly, Monthly can be changed using Timeframe Option
For More Reading
Reading: traderji.com/community/threads/intraday-trading-using-gann-calculator.39185/#post-419677
Calculator: stockmaniacs.net/freebies/free-tools/gann-square-of-9-calculator/

Gann Box (Zeiierman)█ Overview
The Gann Box (Zeiierman) is an indicator that provides visual insights using the principles of W.D. Gann's trading methods. Gann's techniques are based on geometry, astronomy, and astrology, and are used to predict important price levels and market trends. This indicator helps traders identify potential support and resistance levels, and forecast future price movements.
Gann used angles and various geometric constructions to divide time and price into proportionate parts. Gann indicators are often used to predict areas of support and resistance, key tops and bottoms, and future price moves.
█ How It Works
The indicator operates by identifying high and low points within a visible range on the chart and drawing a Gann Box between these points. The box is divided into segments based on selected percentages, which represent key levels for observing market reactions. It includes options to display labels, a Gann fan, and Gann angles for analysis. Advanced features allow extending the box into the future for predictive analysis and reversing its orientation for alternative viewpoints.
High and Low Points Identification: It starts by locating the highest and lowest price points visible on the chart.
Gann Box Construction: Draws a box from these points and divides it according to specified percentages, highlighting potential support and resistance levels.
█ How to Use
Support and Resistance Levels
Using a Gann angle to forecast support and resistance is probably the most popular way they are used. This technique frames the market, allowing the analyst to read the movement of the market inside this framework.
The lines within the Gann Box, drawn at the key percentages, create a grid of potential support and resistance levels. As prices fluctuate, these lines can act as barriers to price movement, with the price often pausing or reversing at these intervals.
Forecasting with the 'Extend' Feature: The indicator's ability to extend lines and boxes into the future provides traders with a forward-looking tool to anticipate potential market movements and prepare for them.
Gann Fan: This feature draws lines at a significant price angle, helping traders identify potential support and resistance levels based on the theory that prices move in predictable patterns.
Gann Curves: Gann Curves display dynamic support and resistance levels, aiding in the analysis of momentum and trend strength.
█ Settings
The indicator includes several settings that allow customization of its appearance and functionality:
⚪ General Settings
Reverse: This setting changes the orientation of labels and calculations within the Gann Box, providing alternative analytical perspectives. It essentially flips the Gann Box's direction, which can be useful in different market conditions or analysis scenarios.
Extend: Extends the drawing of Gann lines or boxes into the future beyond the current last bar. This feature is essential for forecasting future price movements and identifying potential support or resistance levels that lie outside the current price action.
⚪ Gann Box
Show Box: Toggles the visibility of the Gann Box on the chart. The Gann Box is a fundamental tool in Gann analysis, highlighting key levels based on selected high and low points to identify potential support and resistance areas.
Show Fibonacci Labels: Controls the display of Fibonacci labels within the Gann Box. These labels mark specific Fibonacci retracement levels, aiding traders in recognizing significant levels for potential reversals.
Box Visibility: Allows users to enable or disable individual boxes within the Gann Box, providing flexibility in focusing on specific levels of interest.
Percentage Levels: Defines the Fibonacci levels within the Gann Box. Traders can adjust these levels to customize the Gann Box according to their specific analysis needs.
Coloring: Customizes the color of each level within the Gann Box, enhancing visual clarity and differentiation between levels.
⚪ Gann Fan
Show Fan: Enables the Gann Fan, which draws lines at significant Gann angles from a particular point on the chart, helping identify potential support and resistance levels.
Fan Percentages and Coloring: Similar to the Gann Box, these settings allow traders to customize which Gann angles are displayed and how they are colored.
⚪ Gann Curves
Show Curves: When enabled, this setting draws Gann Curves on the chart. These curves are based on Gann percentages and provide a dynamic view of support and resistance levels as they adapt to changing market conditions.
Curve Percentages and Coloring: Define which curves are displayed and their colors, allowing for a tailored analysis experience.
⚪ Gann Angles
Show Angles: Toggles the display of Gann Angles, which are crucial for understanding the market's price and time dynamics, offering insights into future support and resistance levels.
Coloring: Customizes the color of the Gann Angles, making it easier to differentiate between various angles on the chart.
█ Alerts
The indicator includes several alert conditions for price breakouts from the Gann Box and specific levels, enabling traders to be notified of significant market movements.
-----------------
Disclaimer
The information contained in my Scripts/Indicators/Ideas/Algos/Systems does not constitute financial advice or a solicitation to buy or sell any securities of any type. I will not accept liability for any loss or damage, including without limitation any loss of profit, which may arise directly or indirectly from the use of or reliance on such information.
All investments involve risk, and the past performance of a security, industry, sector, market, financial product, trading strategy, backtest, or individual's trading does not guarantee future results or returns. Investors are fully responsible for any investment decisions they make. Such decisions should be based solely on an evaluation of their financial circumstances, investment objectives, risk tolerance, and liquidity needs.
My Scripts/Indicators/Ideas/Algos/Systems are only for educational purposes!

Gann Square of 9Gann's Square's are some of the best known tools created by Gann. His most well known square was his Square of 9.
The reason for this was because of the symmetry 9 had with itself. Gann was able to balance both price and time with this symmetry.
- 9 is the last single-digit and largest number
- You can add anything to 9 and it will give you a natural number
- (9 + 3 = 12); 1 + 2 = 3... (9 + 9 = 18); 1 + 8 = 9... etc.
- Multiplying any number by 9 will have the natural number be 9
- (9 * 6 = 54); 5 + 4 = 9... (9 * 3 = 27); 2 + 7 = 9... etc.
For these reason, Gann claimed that 9 has everything within itself.
Here I have created an on-chart square of 9 including the cardinal and ordinal cross points colored. In the settings you are able to customize the starting value of the table as well as the period movement. In most cases, 81 is not high enough to be useful in charting cases, so I'd recommend printing out your own Gann Square of 9 that goes as high as you need it to go.
THIS IS NOT TRADING ADVICE ; please use your own technical analysis before making any decisions based off of public indicators. Learn more about Gann's Squares before attempting to use them as this script was not meant to give you answers, only the table.
Gann Octogram - Sacred Geometry Confluence Ver 1.0📐 Gann Octogram - Sacred Geometry Confluence Ver 1.0
Overview
Advanced Gann analysis tool combining W.D. Gann's Square of Nine principles with sacred geometry and multi-factor confluence signals. This indicator automatically detects swing highs/lows and projects octogram grids forward in time and price, identifying high-probability trading opportunities where multiple factors align.
Understanding Gann Octograms
W.D. Gann believed markets move in geometric patterns through time and price. The octogram (8-sided figure) represents the square of nine principle where:
Price divisions (1/8ths) create natural support/resistance
Time cycles mark potential reversal points
Diagonal angles show dynamic price-time relationships
Confluence zones where geometry aligns offer highest probability trades
This indicator makes these complex calculations automatic and visual.
Key Features
🎯 Intelligent Auto-Detection
Auto Gann Number Selection: Automatically chooses optimal Gann period (11, 22, 44, 88, 176) based on timeframe and data availability
Adaptive Half-Period Mode: Uses Gann/2 for faster swing detection while validating with full period
Smart Grid Projection: Projects octagrams near current price action for relevance
📊 Sacred Geometry Visualization
Octogram Grids: Complete octagonal geometry with inner square, angled square, and connecting lines
Gann Angles: 1×1 and 2×1 diagonal support/resistance angles
Time Cycles: Quarter, half, and three-quarter cycle markers
Price Levels: Automatic 1/8th division levels (0%, 12.5%, 25%, 37.5%, 50%, 62.5%, 75%, 87.5%, 100%)
⚡ Advanced Confluence System
Adjustable 4-Factor Confluence (Levels 0-4):
Price Level Touch: Precise detection of key support/resistance levels
Time Cycle Alignment: Major (25%, 50%, 75%) and minor (1/8th divisions) cycles
Octogram Geometry: Proximity to vertices and diagonal angles
Price Action: Bullish/bearish candle confirmation
Confluence Levels:
Level 0: Signals on price touch only (most signals)
Level 1: Minimum 1 factor required
Level 2: Minimum 2 factors (⭐ recommended - balanced)
Level 3: Minimum 3 factors (strict quality)
Level 4: All 4 factors required (highest quality, fewer signals)
🛡️ Signal Quality Controls
Max Signals Per Cell: Limit signals to 1-10 per grid cell
Cooldown Period: Minimum bars between consecutive signals
Cell Signal Tracking: Automatic reset when entering new time cells
Adjustable Tolerances: Fine-tune price and geometry sensitivity
How It Works
Swing Detection: Identifies significant market swings using pivot highs/lows
Grid Construction: Builds octogram grid from swing high to swing low
Multi-Grid Projection: Projects multiple cells forward (time) and vertically (price)
Confluence Analysis: Monitors all 4 factors continuously
Signal Generation: Fires BUY/SELL when confluence threshold is met
BUY Signals trigger when:
Price touches LOW zones (0%-50%)
At key time cycle points
Near octogram geometry
Bullish candle forms
SELL Signals trigger when:
Price touches HIGH zones (50%-100%)
At key time cycle points
Near octogram geometry
Bearish candle forms
Settings Guide
Structure Settings
Auto Gann Number: Enable for automatic period selection (recommended)
Manual Gann Number: 11, 22, 44, 88, or 176 bars
Use Half Period: Faster detection using Gann/2 lookback
Grid Stability: Adaptive (1/8th) / Strict (1/4th) / Relaxed (1/16th)
Signal Settings ⚙️
Confluence Level: 0-4 (start with 2)
Price Tolerance: 1-8% (default 3%)
Geometry Tolerance: 0.5-5% (default 2.5%)
Min Bars Between Signals: 1-20 (default 3)
Max Signals Per Cell: 1-10 (default 4-6)
Display Options
Toggle grid squares, octagrams, triangles, Gann angles
Customizable colors for all elements
Time cycle visualization
Swing high/low markers
Info panel with swing statistics
Best Practices
For Day Trading (5min-15min charts):
Confluence Level: 2
Auto Gann: ON
Grid Stability: Adaptive
Max Signals Per Cell: 4-6
For Swing Trading (1H-4H charts):
Confluence Level: 3
Auto Gann: ON
Grid Stability: Strict
Max Signals Per Cell: 2-4
For Position Trading (Daily charts):
Confluence Level: 3-4
Manual Gann: 88 or 176
Grid Stability: Strict
Max Signals Per Cell: 2-3
Alert Setup
Built-in alert conditions:
Gann Octogram Buy - Fires on BUY signal
Gann Octogram Sell - Fires on SELL signal
Configure alerts using TradingView's alert system to get notified when confluence zones trigger.
Backtesting Tips
Start with Confluence Level 2 (balanced approach)
Increase level to 3-4 if too many signals
Decrease to 1 if missing opportunities
Adjust tolerances based on asset volatility
Test different Gann numbers for your specific market
Credits & Theory
Based on W.D. Gann's principles:
Square of Nine
Time-Price Geometry
Sacred Geometry (Octograms)
Natural Market Cycles
Developed with modern Pine Script for reliability, efficiency, and user control.
Version History
Ver 1.0 - Initial Release
4-factor confluence system
Auto Gann number selection
Adjustable confluence levels (0-4)
Sacred geometry visualization
Signal quality controls
Support
For questions, suggestions, or issues:
Comment on this indicator
Check the code (open source)
Experiment with settings for your trading style
Happy Trading! 📈
Disclaimer
This indicator is for educational and informational purposes only. Past performance does not guarantee future results. Always practice proper risk management and never risk more than you can afford to lose. Backtest thoroughly before live trading.

Gann Square This indicator build by Gann Square of 19.
you select start and end of big trend in daily timeframe and calculate date range.
by draw trend line in Gann square and enter the numbers cross by line in settings input you could recognize future pivot points
remember : first) this tool worked only in daily timeframe. second) better using this in dark theme :)
chart example :
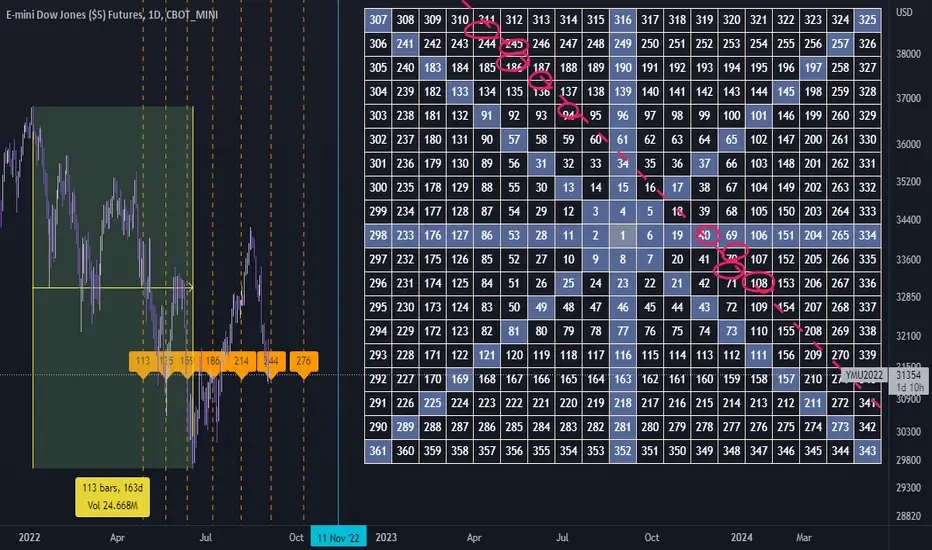
Gann Spiral / Square of 9The Gann Spiral, more commonly known as the Square of 9 is one of the most well known tools that Gann used. Today, it is most commonly used to find possible support and resistance levels, and possible reversals in time.
This indicator is a more flexible version of the traditional Gann Spiral / Square. This is achieved by allowing you to change:
Price and Time direction
The timeframe
How often to draw lines based on degrees
Toggles for Price and Time
Price and Time line customization
How to use:
1 - Select your desired starting value of Price and Time.
2 - Choose the direction of Price and Time.
3 - Choose the amount of lines to display.
4 - Choose how often for lines to be drawn (Rotation Degree Value).
==================================================================
Side Note:
This uses a more proper and more accurate formula to "navigate the square". (Sqr x + 2)^2 is not the formula used, but rather (Sqr x + 1)^2.
If you wish to use the formula you're used to, change Full Revolution Value to 180.
The reasoning behind this formula change is because I re-created the square in the form of an actual spiral. The issue with such a conversion is that the formula used to construct it uses one Pi. If you understand circles, you should know that we're off by 180 degrees. A full rotation is 360, not 180.
Correcting for this error requires a slight but important change in the formula, that being +1 instead of +2. This not only corrects it to fit for a proper spiral, but also makes it easier to use fractions. 1/360 results in 1 degree. This slight formula change makes it incompatible when used on the actual Square of 9, however it is technically the more accurate formula.

Gann Sacred Geometry Hexagram Ver 1.2━━━━━━━━━━━━━━━━━━━━━━━━━━━━━━━━━━━━━━━━
🔯 GANN SACRED GEOMETRY HEXAGRAM v1.2
━━━━━━━━━━━━━━━━━━━━━━━━━━━━━━━━━━━━━━━━
A comprehensive technical analysis tool combining W.D. Gann's sacred geometry principles,
hexagram patterns, and advanced confluence scoring for high-probability trade signals.
━━━━━━━━━━━━━━━━━━━━━━━━━━━━━━━━━━━━━━━━
📖 GANN THEORY BACKGROUND
━━━━━━━━━━━━━━━━━━━━━━━━━━━━━━━━━━━━━━━━
W.D. Gann (1878-1955) believed markets move in geometric patterns and that price
and time must be in balance. His methods incorporated:
- The Square of Nine
- Geometric angles (1x1, 2x1, etc.)
- Sacred geometry and natural law
- Cycle theory and time divisions
- The principle "When time and price square, a change in trend is imminent"
This indicator applies these timeless principles with modern confluence analysis.
SACRED GEOMETRY FOUNDATION:
The hexagram (six-pointed star) is formed by two overlapping equilateral triangles:
- ▲ Upward triangle = Yang energy, bullish forces, expansion
- ▼ Downward triangle = Yin energy, bearish forces, contraction
When overlapped, they create the "Star of David" - representing perfect balance
between opposing market forces. Gann believed this geometry revealed natural
support and resistance zones where price would react.
HEXAGRAM IN MARKETS:
- 6 outer points = Major reversal zones
- Center point = Balance/equilibrium price
- Inner intersections = Secondary support/resistance
- The shape itself creates "harmonic" price levels
GANN'S SQUARE PHILOSOPHY:
"When time and price square, a change in trend is imminent."
- W.D. Gann
This indicator applies the "squaring" concept:
1. SPATIAL SQUARE: Grid cells are perfect squares in price-time space
2. TEMPORAL SQUARE: Time divisions (1/4, 1/2, 3/4) create cycle points
3. PRICE SQUARE: Price divisions (25%, 50%, 75%) mirror time divisions
4. GEOMETRIC SQUARE: All geometry radiates from perfect square centers
When price reaches a corner or edge of a square at a time cycle point,
the "squaring" of price and time creates a reversal probability zone.
PHI IN GANN GEOMETRY:
The Golden Ratio appears throughout natural phenomena and market structure.
This script uses φ in two primary ways:
1. INNER TRIANGLE SCALING:
- Outer triangles span the full cell (100%)
- Inner triangles scaled by φ⁻¹ (0.618 or 61.8%)
- This creates Fibonacci retracement levels geometrically
2. HARMONIC RESONANCE:
- φ ratio divides price space into natural harmony
- Markets tend to pause/reverse at these φ-scaled levels
- Combines Fibonacci analysis with Gann geometry
MATHEMATICAL RELATIONSHIP:
Inner Triangle Height = Outer Height × 0.618
Inner Triangle Width = Outer Width × 0.618
These create the 61.8% retracement levels automatically
within each grid cell's geometry.
GANN'S COMPLETE ANGLE SYSTEM:
Gann identified 9 primary angles that price follows. Each represents a different
relationship between price movement and time passage:
╔════════════════════════════════════════════════════════════════╗
║ ANGLE │ RATIO │ DEGREES │ MEANING ║
╠════════════════════════════════════════════════════════════════╣
║ 1x8 │ 1:8 │ 7.125° │ Very slow trend (gentle) ║
║ 1x4 │ 1:4 │ 14.036° │ Slow trend ║
║ 1x3 │ 1:3 │ 18.435° │ Moderate-slow trend ║
║ 1x2 │ 1:2 │ 26.565° │ Moderate trend ║
║ 1x1 │ 1:1 │ 45.000° │ MASTER ANGLE (most important) ║
║ 2x1 │ 2:1 │ 63.435° │ Strong trend ║
║ 3x1 │ 3:1 │ 71.565° │ Very strong trend ║
║ 4x1 │ 4:1 │ 75.964° │ Extreme trend ║
║ 8x1 │ 8:1 │ 82.875° │ Parabolic trend (unsustainable)║
╚════════════════════════════════════════════════════════════════╝
THE 1x1 ANGLE - THE MASTER:
- Most important angle in Gann theory
- Represents perfect balance: 1 unit price = 1 unit time
- When price is ABOVE 1x1 = Bullish control
- When price is BELOW 1x1 = Bearish control
- Crossing 1x1 = Major trend change signal
ANGLE FANS:
- From any pivot point, all 9 angles radiate outward
- Creates a "fan" of dynamic support/resistance
- Steeper angles (4x1, 8x1) = strong momentum resistance
- Gentler angles (1x4, 1x8) = weak support in downtrends
THE SACRED DIVISIONS OF TIME:
Gann divided all cycles into 8 equal parts, based on ancient geometry
and astrological principles:
CYCLE DIVISIONS (8ths):
┌─────────────────────────────────────────────────────┐
│ 1/8 = 12.5% │ First minor turn point │
│ 2/8 = 25.0% │ First major turn (Cardinal) │
│ 3/8 = 37.5% │ Second minor turn │
│ 4/8 = 50.0% │ MID-CYCLE (most powerful) │
│ 5/8 = 62.5% │ Third minor turn │
│ 6/8 = 75.0% │ Second major turn (Cardinal) │
│ 7/8 = 87.5% │ Fourth minor turn │
│ 8/8 = 100.0% │ CYCLE COMPLETION (reversal zone) │
└─────────────────────────────────────────────────────┘
WHY EIGHTHS?
- 8 is the number of balance in sacred geometry
- Octave divisions create harmonic resonance
- 360° circle ÷ 8 = 45° (the 1x1 master angle)
- Natural cycles show 8-fold symmetry
IN THIS SCRIPT:
When current time position is within 8% of any eighth division,
the "Gann 8ths Timing" factor activates, adding confluence points.
THE CARDINAL CROSS SYSTEM:
The Cardinal Cross divides any square into four equal quadrants,
creating a cross pattern:
100% ●━━━━━━━━━━━━━●
┃ ↑ ┃
75% ┃ SELL ZONE ┃ ← Resistance quadrant
┃ ↑ ┃
50% ●━━━━━●━━━━━━● ← EQUILIBRIUM (most important)
┃ ↓ ┃
25% ┃ BUY ZONE ┃ ← Support quadrant
┃ ↓ ┃
0% ●━━━━━━━━━━━━━●
PRICE LEVELS:
- 0% = Bottom support (grid cell low)
- 25% = Lower mid-level support
- 50% = PERFECT BALANCE - most powerful level
- 75% = Upper mid-level resistance
- 100% = Top resistance (grid cell high)
TIME DIVISIONS:
- 0% = Cycle start (grid cell left edge)
- 25% = First quarter turn
- 50% = Mid-cycle (most powerful timing)
- 75% = Third quarter turn
- 100% = Cycle completion (grid cell right edge)
CONFLUENCE MAGIC:
When BOTH price AND time align at cardinal points simultaneously:
Example: Price at 50% level + Time at 50% of cycle = Maximum power
This is the "squaring" Gann referred to.
━━━━━━━━━━━━━━━━━━━━━━━━━━━━━━━━━━━━━━━━
📊 KEY FEATURES
━━━━━━━━━━━━━━━━━━━━━━━━━━━━━━━━━━━━━━━━
✅ Dynamic Grid System (1x1 to 7x7) - Automatically constructed from swing high to swing low
✅ Sacred Geometry Hexagrams - Overlapping triangles creating Star of David pattern
✅ Golden Ratio (φ = 1.618) Inner Triangles - Fibonacci harmony in geometry
✅ 9 Complete Gann Angles - 1x1, 2x1, 1x2, 3x1, 1x3, 4x1, 1x4, 8x1, 1x8
✅ Cardinal Cross Levels - 0%, 25%, 50%, 75%, 100% price divisions
✅ Gann 8ths Timing Cycles - 1/8, 1/4, 3/8, 1/2, 5/8, 3/4, 7/8 time divisions
✅ Price-Time Square Balance - Gann's principle of harmonious price-time relationship
✅ Advanced Confluence Scoring - Multi-factor signal validation (8-30 score range)
✅ Optimized Geometry Display - Shows full detail only near current price (reduces clutter)
✅ Customizable Visual Themes - Full color and thickness control
━━━━━━━━━━━━━━━━━━━━━━━━━━━━━━━━━━━━━━━━
🎯 HOW IT WORKS
━━━━━━━━━━━━━━━━━━━━━━━━━━━━━━━━━━━━━━━━
📍 GRID CONSTRUCTION:
The indicator identifies the most recent significant swing high-to-low movement using
configurable pivot periods (default: 88 bars). This creates the base "square" which is
then replicated in a grid pattern both vertically (price) and horizontally (time).
📐 SACRED GEOMETRY:
Each grid cell contains:
- Outer hexagram (Star of David) formed by two overlapping triangles
- Inner φ-ratio triangles scaled by the Golden Ratio
- Gann angles radiating from the center point
- Cardinal cross levels dividing price into quarters
🔍 CONFLUENCE SCORING SYSTEM:
Signals are generated when multiple Gann principles align:
1. Cardinal Cross Levels (0-6 points) - Price at key quarter divisions
2. Gann Angle Touches (0-5 points) - Price touching dynamic support/resistance angles
3. Angle Clustering (0-6 points) - Multiple angles converging = strong zone
4. Gann 8ths Timing (0-3 points) - At critical time cycle points
5. Price-Time Square (0-4 points) - Balanced price/time movement
6. Trend Alignment (0-3 points) - Signal direction matches trend
7. Grid Boundary Timing (0-3 points) - Near cell edges = reversal zones
8. φ Triangle Touches (0-2 points) - Golden ratio support/resistance
9. Reversal Patterns (0-2 points) - Wick rejections confirming reversal
Minimum confluence score of 15 required for signal (adjustable 8-30).
━━━━━━━━━━━━━━━━━━━━━━━━━━━━━━━━━━━━━━━━
⚙️ RECOMMENDED SETTINGS
━━━━━━━━━━━━━━━━━━━━━━━━━━━━━━━━━━━━━━━━
📊 For Daily Charts (Swing Trading):
- Gann Number: 88
- Grid Size: 4x4
- Confluence Score: 15
- Geometry Range: 5
- Trend Filter: ON
📊 For 4H Charts (Intraday):
- Gann Number: 44
- Grid Size: 3x3
- Confluence Score: 12-13
- Geometry Range: 3-4
- Trend Filter: ON
📊 For 15M Charts (Scalping):
- Gann Number: 22
- Grid Size: 2x2
- Confluence Score: 10-12
- Geometry Range: 2-3
- Allow Counter-Trend: Consider enabling
━━━━━━━━━━━━━━━━━━━━━━━━━━━━━━━━━━━━━━━━
📚 BEST PRACTICES
━━━━━━━━━━━━━━━━━━━━━━━━━━━━━━━━━━━━━━━━
✓ Use higher confluence scores (15+) for higher probability trades
✓ Combine with volume analysis for confirmation
✓ Respect trend filter - signals with trend are stronger
✓ Watch for signals at grid boundaries (time cycle completions)
✓ Higher scores (20+) indicate exceptional setups
✓ Use alerts to catch signals in real-time
✓ Works best on liquid markets with clear swings
EXAMPLE 1: Strong Buy Signal (Score: 18)
✓ Price touched 50% level (6 pts)
✓ 1x1 Gann angle support (5 pts)
✓ At Gann 8th cycle point (3 pts)
✓ Price-Time squared (4 pts)
= High probability long entry
EXAMPLE 2: Medium Sell Signal (Score: 15)
✓ Price at 75% level (4 pts)
✓ 2x1 angle resistance (3 pts)
✓ Trend aligned downward (3 pts)
✓ Near grid boundary (3 pts)
✓ Bearish wick rejection (2 pts)
= Valid short entry
━━━━━━━━━━━━━━━━━━━━━━━━━━━━━━━━━━━━━━━━
🎨 CUSTOMIZATION OPTIONS
━━━━━━━━━━━━━━━━━━━━━━━━━━━━━━━━━━━━━━━━
- Structure: Gann Number (11, 22, 44, 88, 176, 352)
- Grid: Size from 1x1 to 7x7
- Geometry: Toggle squares, triangles, angles, levels
- Optimization: Show geometry only near price (performance boost)
- Thickness: All line widths adjustable (1-5)
- Colors: Full color customization for all elements
- Scoring: Adjust all tolerance and threshold parameters
- Timing: Enable/disable Gann 8ths, Price-Time Square
- Filters: Trend filter, boundary requirement, counter-trend signals
- Display: 4 signal styles (Labels, Diamonds, Circles, Stars)
━━━━━━━━━━━━━━━━━━━━━━━━━━━━━━━━━━━━━━━━
⚠️ IMPORTANT NOTES
━━━━━━━━━━━━━━━━━━━━━━━━━━━━━━━━━━━━━━━━
- This indicator is for educational purposes
- Not financial advice - always do your own research
- Past performance does not guarantee future results
- Use proper risk management and position sizing
- Combine with other analysis methods for best results
- Grid redraws when new swing high/low forms
- Signals appear in real-time based on confluence scoring
━━━━━━━━━━━━━━━━━━━━━━━━━━━━━━━━━━━━━━━━
📞 SUPPORT & UPDATES
━━━━━━━━━━━━━━━━━━━━━━━━━━━━━━━━━━━━━━━━
Follow for updates and improvements. Feedback welcome!
Version 1.2 - January 2025
- Optimized geometry rendering
- Enhanced confluence scoring
- Improved visual clarity
- Performance optimizations
━━━━━━━━━━━━━━━━━━━━━━━━━━━━━━━━━━━━━━━━

Gann Fan Strategy [KedarArc Quant]Description
A single-concept, rule-based strategy that trades around a programmatic Gann Fan.
It anchors to a swing (or a manual point), builds 1×1 and related fan lines numerically, and triggers entries when price interacts with the 1×1 (breakout or bounce). Management is done entirely with the fan structure (next/previous line) plus optional ATR trailing.
What TV indicators are used
* Pivots: `ta.pivothigh/ta.pivotlow` to confirm swing highs/lows for anchor selection.
* ATR: `ta.atr` only to scale the 1×1 slope (optional) and for an optional trailing stop.
* EMA: `ta.ema` as a trend filter (e.g., only long above the EMA, short below).
No RSI/MACD/Stoch/Heikin/etc. The logic is one coherent framework: Gann price–time geometry, with ATR as a scale and EMA as a risk filter.
How it works
1. Anchor
* Auto: chooses the most recent *confirmed* pivot (you control Left/Right).
* Manual: set a price and bar index and the fan will hold that point (no re-anchoring).
* Optional Re-anchor when a newer pivot confirms.
2. 1×1 Slope (numeric, not cosmetic)
* ATR mode: `1×1 = ATR(Length) × Multiplier` (adapts to volatility).
* Fixed mode: `ticks per bar` (constant slope).
Because slope is numeric, it doesn’t change with chart zoom, unlike the drawing tool.
3. Fan Lines
Builds classic ratios around the 1×1: 1/8, 1/4, 1/3, 1/2, 1/1, 2/1, 3/1, 4/1, 8/1.
4. Signals
* Breakout: cross of price over/under the 1×1 in the EMA-aligned direction.
* Bounce (optional): touch + reversal across the 1×1 to reduce whipsaw.
5. Exits & Risk
* Take-profit at the next fan line; Stop at the previous fan line.
* If a level is missing (right after re-anchor), a fallback Risk-Reward (RR) is used.
* Optional ATR trailing stop.
Why this is unique
* True numeric fan: The 1×1 slope is calculated from ATR or fixed ticks—not from screen geometry—so it is scale-invariant and reproducible across users/timeframes.
* Deterministic anchor logic: Uses confirmed pivots (with your L/R settings). No look-ahead; anchors update only when the right bars complete.
* Fan-native trade management: Both entries and exits come from the fan structure itself (with a minimal ATR/EMA assist), keeping the method pure.
* Two entry archetypes: Breakout for momentum days; Bounce for range days—switchable without changing the core model.
* Manual mode: Lock a session’s bias by anchoring to a chosen swing (e.g., day’s first major low/high) and keep the fan constant all day.
Inputs (quick guide)
* Auto Anchor (Left/Right): pivot sensitivity. Higher values = fewer, stronger anchors.
* Re-anchor: refresh to newer pivots as they confirm.
* Manual Anchor Price / Bar Index: fixes the fan (turn Auto off).
* Scale 1×1 by ATR: on = adaptive; off = use ticks per bar.
* ATR Length / ATR Multiplier: controls adaptive slope; start around 14 / 0.25–0.35.
* Ticks per bar: exact fixed slope (match a hand-drawn fan by computing slope ÷ mintick).
* EMA Trend Filter: e.g., 50–100; trades only in EMA direction.
* Use Bounce: require touch + reverse across 1×1 (helps in chop).
* TP/SL at fan lines; Fallback RR for missing levels; ATR Trailing Stop optional.
* Transparency/Plot EMA: visual preferences.
Tips
* Range days: larger pivots (L/R 8–12), Bounce ON, ATR Multiplier \~0.30–0.40, EMA 100.
* Trend days: L/R 5–6, Breakout, Multiplier \~0.20–0.30, EMA 50, ATR trail 1.0–1.5.
* Match the TV Gann Fan drawing: turn ATR scale OFF, set ticks per bar = `(Δprice between anchor and 1×1 target) / (bars) / mintick`.
Repainting & testing notes
* Pivots require Right bars to confirm; anchors are set after confirmation (no look-ahead).
* Signals use the current bar close with TradingView strategy mechanics; real-time vs. bar-close can differ slightly, as with any strategy.
* Re-anchoring legitimately moves the structure when new pivots confirm—by design.
⚠️ Disclaimer
This script is provided for educational purposes only.
Past performance does not guarantee future results.
Trading involves risk, and users should exercise caution and use proper risk management when applying this strategy.

Gann Single Square Swing Trading System with Gann AnglesGann Single Square Swing Trading System
This script automatically detects "squares" - geometric patterns where price movement equals time movement. When price moves the same distance as the number of bars (time), it creates powerful support/resistance levels based on Gann theory.
Key Visual Elements
• Box: The detected square pattern
• Dark Blue Line (50%): Most important trading level
• Green Lines: Profit target levels (125%, 150%)
• Red Lines: Stop loss levels (-25%, -50%)
• Colored Angle Lines: Gann angles for trend direction
• Quality Score: Blue label showing setup strength (aim for 70%+)
Simple Trading Rules
LONG Trades (Green 🟢 Square)
1. Entry: Buy when price touches the dark blue 50% line from above
2. Stop Loss: Place below the red -25% line
3. Take Profit: Exit at green 125% line (first target) or 150% line (second target)
SHORT Trades (Red 🔴 Square)
1. Entry: Sell when price touches the dark blue 50% line from below
2. Stop Loss: Place above the red -25% line
3. Take Profit: Exit at green 125% line (first target) or 150% line (second target)
Entry Checklist
✅ Square quality score > 70%
✅ Price touches 50% level (dark blue line)
✅ Volume above average (if volume filter enabled)
✅ Clear square formation visible
Alerts
The script generates automatic alerts when price reaches the 50% trading level. Enable alerts in TradingView to get notified of setups.
Bottom Line: Wait for the alert → Check quality score → Enter at 50% level → Set stop at red line → Take profit at green line.

Gann High LowGann High Low is a moving average based trend indicator consisting of two different simple moving averages.
The Gann High Low Activator Indicator was described by Robert Krausz in a 1998 issue of Stocks & Commodities Magazine. It is a simple moving average SMA of the previous n period's highs or lows.
The indicator tracks both curves (of the highs and the lows). The close of the bar defines which of the two gets plotted.
This version is showing the channel that needs to be broken if the trend is going to be changed, and it allows you to chose from the 4 basic averages type for calculation (by definition, Gann High Low Activator uses only simple moving average, but some other averages can give you results that are probably more acceptable for trading in some conditions).
Increasing HPeriod and decreasing LPeriod better for short trades, vice versa for long positions.

Gann VooDoo LinesGann VooDoo Lines Indicator
Description
- Gann VooDoo Lines is a precise overlay indicator that applies W.D. Gann's Square of 9 mathematics to generate static horizontal support and resistance levels from a single manual anchor price. It calculates 8 key vibrational degrees (45°, 90°, 135°, 180°, 225°, 270°, 315°, 360°) both upward (resistance) and downward (support), delivering clean, timeframe-independent price zones.
Key Features
- Manual anchor price input for complete control
- Individual toggles for each of the 8 degrees
- "Both (Support + Resistance)" mode to display levels in both directions simultaneously
- Extend lines left/right or both
- Dynamic right-side labels that follow the latest bar
- Price values automatically displayed on the right price scale for all visible lines (including anchor)
- Customizable resistance, support, and anchor colors
What Makes It Unique (Compared to Other Gann Scripts)
- Unlike most Gann indicators on TradingView (which typically focus on sloping angles/fans, auto-detected swings, or limited degrees), Gann VooDoo Lines uses pure static Square of 9 horizontal levels with full individual toggles for all 8 degrees and a dedicated "Both" mode — allowing you to view support and resistance simultaneously without overlap or clutter. The combination of per-degree toggles, dynamic right-side labels, and clean price scale integration (no duplicates or repainting) sets it apart from generic Gann tools that often lack this granular control and visual clarity.
How to Use and Trade With It
- Set the anchor properly — this is the most critical step:
- Choose a major significant price extreme (all-time high/low, major swing high/low, or key psychological level).
- For higher timeframes (daily/weekly): use long-term extremes (e.g., all-time low/high) for "master" levels that influence price over months/years.
- For lower timeframes/intraday: use recent session extremes (today's open, previous close, or recent swing high/low) and update the anchor as needed for fresh levels.
- Experiment: test different anchors and observe which produces the most reactions.
Trading approach:
- Watch for price reactions (reversals, bounces, accelerations) at the lines — especially confluence with multiple degrees or right-side labels.
- Use in "Both" mode for full support/resistance picture.
- Combine with price action (candlestick patterns, volume) for entries/exits.
- Toggle off unused degrees to declutter the chart.

Gann Octave 8 Ver.2.0Gann Octave 8 Ver.2.0 - Complete Trading Guide
Overview
This indicator combines W.D. Gann's time-tested principles of market geometry with modern technical analysis. It identifies key market structures and projects precise support/resistance levels along with angular momentum lines to help traders identify high-probability trading opportunities.
________________________________________
Core Concepts
1. Gann's Octave Division (The Rule of 8)
W.D. Gann discovered that markets move in harmonic divisions based on the number 8. This indicator divides any swing movement into 8 equal parts (octaves):
• 0% - Swing extreme (High for bearish, Low for bullish)
• 12.5% - First octave
• 25% - Quarter level
• 37.5% - Three-eighths level
• 50% - Midpoint (most critical level)
• 62.5% - Five-eighths level
• 75% - Three-quarter level
• 87.5% - Seventh octave
• 100% - Swing extreme (opposite end)
Why 8? Gann believed natural market cycles follow mathematical harmonics. The octave division provides precise entry and exit points that frequently act as support/resistance zones.
2. Gann Angles (Price-Time Relationship)
Gann angles represent the relationship between price movement and time. Each angle shows different momentum levels:
• 1x1 (Black) - 45° angle, perfect balance between price and time. Most important Gann angle. Represents the natural trend line.
• 2x1 (Red) - Steeper angle, 2 units of price per 1 unit of time. Shows strong momentum.
• 1x2 (Red) - Flatter angle, 1 unit of price per 2 units of time. Shows weak momentum.
• 4x1 & 1x4 (Blue) - Even more extreme angles indicating very strong or very weak trends.
• 8x1 & 1x8 (Orange) - Most extreme angles, parabolic moves or complete consolidation.
Key Principle: When price is above the 1x1 angle = bullish. Below 1x1 = bearish. When price crosses from one angle to another, it signals a change in momentum.
________________________________________
How the Indicator Works
Structure Detection
The indicator automatically identifies market swings using pivot points:
1. Bullish Structure (Green): Detected when price makes a higher high
o Octave levels calculated from swing low (0%) to swing high (100%)
o Gann angles project upward from the swing low
2. Bearish Structure (Red): Detected when price makes a lower low
o Octave levels calculated from swing high (0%) to swing low (100%)
o Gann angles project downward from the swing high
Dynamic Updates
• Swing Tracker ON: Levels update continuously as the swing evolves
• Swing Tracker OFF: Levels lock at the initial swing detection (cleaner charts)
Historical Structures
The indicator maintains previous swing structures based on "Number of Swings to Show":
• Set to 1: Only current structure (cleanest)
• Set to 2-3: Current + recent history (recommended for context)
• Set to 4+: Multiple historical structures (may overlap but shows pattern)
________________________________________
Trading Strategy
Entry Signals
BUY SIGNALS (Green Triangle Up ▲)
Signal 1: Bounce from Support Levels
• Price drops to 0%, 50%, or 100% level and reverses
• Best when combined with bullish candlestick pattern (hammer, engulfing)
• Entry: On signal confirmation
• Stop Loss: Below the support level (0.5-1% below)
• Target: Next octave level up (12.5%, 25%, 50%)
Signal 2: Breakout Above Resistance
• Price breaks above 50% or 100% level with momentum
• Confirms trend continuation or reversal
• Entry: On close above the level
• Stop Loss: Below the breakout level
• Target: Previous swing high or next major level
Signal 3: Gann Angle Support
• Price bounces off 1x1 angle (black line)
• Indicates trend is intact
• Entry: When price respects the angle
• Stop Loss: Below the 1x1 angle
• Target: Next resistance level
SELL SIGNALS (Red Triangle Down ▼)
Signal 1: Rejection from Resistance Levels
• Price rallies to 0%, 50%, or 100% level and reverses
• Best when combined with bearish candlestick pattern (shooting star, bearish engulfing)
• Entry: On signal confirmation
• Stop Loss: Above the resistance level (0.5-1% above)
• Target: Next octave level down (87.5%, 75%, 50%)
Signal 2: Breakdown Below Support
• Price breaks below 50% or 0% level with momentum
• Confirms trend continuation or reversal
• Entry: On close below the level
• Stop Loss: Above the breakdown level
• Target: Previous swing low or next major level
Signal 3: Gann Angle Resistance
• Price fails at 1x1 angle (black line)
• Indicates trend weakness
• Entry: When price rejects the angle
• Stop Loss: Above the 1x1 angle
• Target: Next support level
________________________________________
Advanced Trading Techniques
1. The 50% Rule (Most Powerful)
The 50% octave level is the most critical in Gann theory:
• In Uptrend: Price should not break below 50% retracement. If it holds = trend intact, go long.
• In Downtrend: Price should not break above 50% retracement. If it holds = trend intact, go short.
• Reversal: Breaking and closing beyond 50% often signals trend reversal.
2. Gann Angle Confluence
When multiple Gann angles converge with octave levels = HIGH probability zone:
• Look for price to bounce or reverse at these zones
• Example: 1x2 angle meets 50% level = strong support/resistance
• These zones often become pivot points
3. Multiple Timeframe Analysis
• Use higher timeframe (daily) for major structure
• Use lower timeframe (5min, 15min) for precise entries
• Take trades when both timeframes align
4. Swing Failure Pattern
• Price breaks a key level (e.g., 50%) but quickly reverses back
• This "false breakout" often leads to strong move in opposite direction
• Wait for signal in the reversal direction
________________________________________
Settings Optimization
For Day Trading (Scalping)
• Structure Period: 0-2 (22 bars or less)
• Number of Swings: 1 (only current structure)
• Signal Sensitivity: High
• Swing Tracker: OFF (cleaner)
For Swing Trading
• Structure Period: 4-5 (44-88 bars)
• Number of Swings: 2-3
• Signal Sensitivity: Medium
• Swing Tracker: ON or OFF (preference)
For Position Trading
• Structure Period: 6-8 (176+ bars)
• Number of Swings: 3-5
• Signal Sensitivity: Low
• Swing Tracker: ON
________________________________________
Common Patterns to Watch
Bullish Reversal Setup
1. Price in bearish structure (red levels)
2. Price drops to 100% level (swing low)
3. Buy signal appears (green triangle)
4. Price breaks back above 50% level
5. Action: Go long with stop below 100%
Bearish Reversal Setup
1. Price in bullish structure (green levels)
2. Price rises to 100% level (swing high)
3. Sell signal appears (red triangle)
4. Price breaks back below 50% level
5. Action: Go short with stop above 100%
Trend Continuation
1. Price respects 1x1 Gann angle
2. Small pullback to 25% or 37.5% level
3. Buy/sell signal appears
4. Action: Enter in trend direction
________________________________________
________________________________________
Signal Sensitivity Guide
• Low: Conservative, only major breakouts (3-5 signals per day)
• Medium: Balanced, includes approaches (5-10 signals per day)
• High: Aggressive, includes bounces (10-20 signals per day)
Choose based on your trading style and risk tolerance
________________________________________
Final Words
This indicator is a powerful tool, but remember:
"The market is never wrong. Opinions are." - W.D. Gann
• No indicator is 100% accurate
• Always combine with price action and volume
• Backtest on your instrument and timeframe
• Keep learning and adapting your strategy
• Discipline and risk management are more important than the perfect setup
Happy Trading! 📈

Gann Square of 9Understanding the Gann Square of 9
Delve into the fascinating realm of W.D. Gann’s Square of 9, a tool that has intrigued traders for generations. As we explore the insights behind this unique structure, we’ll show you how our Gann Square of 9 Indicator can become a valuable asset in your trading toolkit.
The History of the Gann Square of 9
The story behind the Gann Square of 9 is as fascinating as the man who created it. W.D. Gann, a pioneering trader from the early 20th century, introduced a method that highlighted the connection between time and price. Rooted in ancient mathematics and geometry, Gann’s theory suggests that financial markets follow cyclical patterns, which are captured in the design of the Square of 9.
Core Principles of the Gann Square of 9
At its heart, the Gann Square of 9 is based on a numerical system that spirals outward from a central point. This unique arrangement allows traders to identify potential support and resistance levels in the market. Each number represents a possible pivot point, indicating shifts in market direction, aligned with Gann’s time-price equilibrium theory.
Applying the Gann Square in Market Analysis
The strength of the Gann Square of 9 lies in its ability to predict key moments in the market where significant price movements may occur. By utilizing our Gann Square of 9 Indicator, traders can easily pinpoint these crucial points, applying Gann’s principles to anticipate both market highs and lows. This section will guide you through practical applications of the Gann Square for making both short-term and long-term trading decisions.
Market Timing with the Gann Square of 9 Indicator
Unlock the potential of market timing and price prediction using our Gann Square of 9 Indicator. This versatile tool brings Gann’s trading insights into the modern world of finance. Here, you’ll find a detailed walkthrough on how to use the indicator to enhance your trading strategies.
Step-by-Step Guide
Input the Source Price: Open, High, Low, Close on specific Timeframe.
Set the Pip Value: Adjust the pip value according to the scale of your trades. The pip value helps define the precision of the price levels the calculator will generate.
Analyze Results: The generated grid displays a central value (your input price) surrounded by numbers representing possible support and resistance levels.
Use the Support and Resistance Levels: Below the grid, you’ll find specific support and resistance points. These are key price levels that can help you plan your trading strategy, such as entry or exit points.
Apply Gann's Trading Entries: At the bottom, suggested long and short trade entries, with targets and stop-loss levels, giving you essential tools for managing risk effectively.
By following these steps, you can effectively incorporate Gann’s time-tested techniques into modern market analysis. Our Gann Square of 9 Indicator simplifies complex calculations while offering powerful insights, helping you make informed trading decisions rooted in one of market analysis’s most influential theories.
Whether you’re new to Gann’s approach or a seasoned trader, this indicator is designed to provide valuable insights aligned with Gann’s original concepts while delivering a seamless user experience for today’s traders. With just a few clicks, you can transform market data into a geometric pattern of time and price, setting the stage for strategic trading based on the cyclical nature of financial markets.

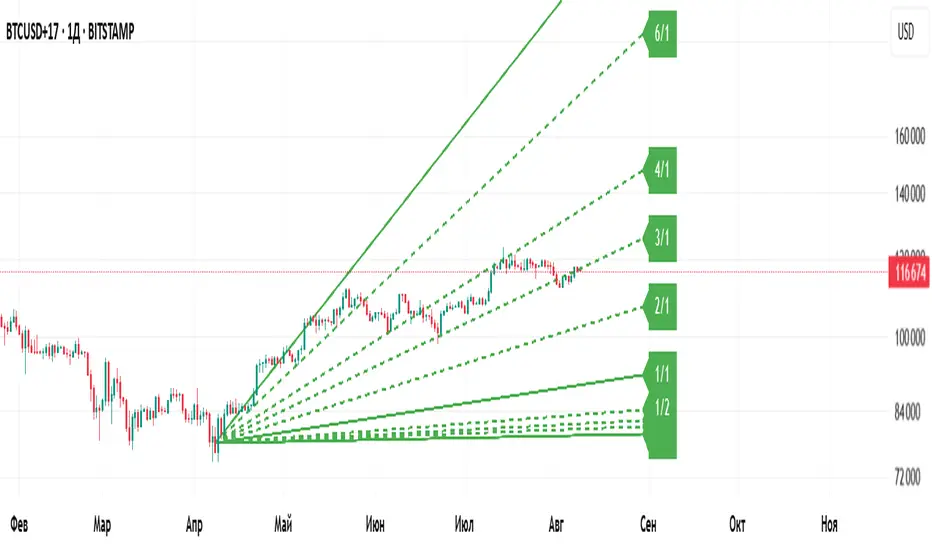
Gann Fan Master – Selectable Base Angle & Fibonacci AnglesGann Fan Master – Selectable Base Angle & Fibonacci Angles
This indicator plots a Gann Fan from point A1 through point B1, with full customization over:
Base angle selection (8/1, 1/1, 1/8)
Main angle set
Fibonacci-based angles
Up to 10 custom user-defined angles
Logarithmic or linear slope calculation
Custom fan color and extended line length
Perfect for manual chart analysis — you select A1 and B1, the script calculates and draws the fan with labeled angles.
How It Works
-Select A1 (time & price) and B1 (time & price).
-The script calculates the base slope depending on the selected base angle:
Linear scale: slope = (B1 − A1) / Δt / base_angle_value
Logarithmic scale: slope = (ln(B1) − ln(A1)) / Δt / base_angle_value
-Each enabled angle is drawn from A1, extended by the chosen number of bars, and labeled with its value.
-Fan color is determined automatically by direction (green for upward, red for downward) or can be overridden.
Quick Start
-Add the indicator to your chart.
-In settings:
A1 Time/Price — starting point.
B1 Time/Price — second point (defines slope).
Base Angle — choose 8/1, 1/1, or 1/8.
Extend Fan (Bars) — number of bars to extend lines into the future.
Logarithmic Fan Calculation — toggle for log-scale mode.
Enable desired angle sets: Main, Fibonacci, or Custom.
-Optionally, enable Use Custom Fan Color and set your own color.
Settings
Enable Fan — master switch.
A1 Time/A1 Price, B1 Time/B1 Price — anchor points.
Base Angle — 8/1, 1/1, 1/8.
Extend Fan (Bars) — extension length.
Use Custom Fan Color / Fan Color — manual color override.
Main Angles — 1/8, 1/4, 1/3, 1/2, 1/1, 2/1, 3/1, 4/1, 6/1, 8/1.
Fibonacci Angles — 0.214, 0.35, 0.382, 0.618, 0.786, 0.886, 0.9335, 1.118, 1.236, 1.382, 1.618.
Custom Angles — up to 10 values (dotted lines), labels from the exact value.
Usage Tips
-Choosing A1 and B1:
A1 — significant starting swing high or low.
B1 — next key swing to define slope.
-Logarithmic scale:
Ideal for long-term exponential trends (crypto, growth stocks).
Prices must be > 0.
-Watch how price reacts to different angles:
1/1 as median trend, fractional for support/resistance, multiples for acceleration/slowdown.
Disclaimer
This is a technical analysis tool. It is not financial advice. Trading decisions are made at your own risk.
Gann Fan Master – Selectable Base Angle & Fibonacci Angles
Индикатор строит веер Ганна от точки A1 через точку B1 с полной кастомизацией:
Выбор базового угла (8/1, 1/1, 1/8)
Набор основных углов
Углы Фибоначчи
До 10 пользовательских углов
Расчёт в логарифмической или линейной шкале
Цвет веера по направлению или заданный вручную
Настройка длины продления линий
Идеально подходит для ручного анализа графика — вы задаёте A1 и B1, а скрипт рассчитывает и строит веер с подписями углов.
Как это работает
-Задайте A1 (время и цена) и B1 (время и цена).
-Скрипт рассчитывает базовый наклон в зависимости от выбранного базового угла:
Линейная шкала: наклон = (B1 − A1) / Δt / base_angle_value
Логарифмическая шкала: наклон = (ln(B1) − ln(A1)) / Δt / base_angle_value
-Каждый включённый угол рисуется из точки A1, продлевается на заданное число баров и подписывается.
-Цвет линий определяется автоматически по направлению (зелёный — вверх, красный — вниз) или задаётся вручную.
Быстрый старт
1)Добавьте индикатор на график.
2)В настройках:
A1 Time/Price — начальная точка.
B1 Time/Price — вторая точка (задаёт наклон).
Base Angle — выберите 8/1, 1/1 или 1/8.
Extend Fan (Bars) — длина продления линий в барах.
Logarithmic Fan Calculation — переключатель логарифмического режима.
Включите нужные блоки углов: Main, Fibonacci, Custom.
3)При желании активируйте Use Custom Fan Color и задайте цвет веера.
Настройки
Enable Fan — общий выключатель.
A1 Time/A1 Price, B1 Time/B1 Price — опорные точки.
Base Angle — 8/1, 1/1, 1/8.
Extend Fan (Bars) — продление линий.
Use Custom Fan Color / Fan Color — цвет вручную.
Main Angles — 1/8, 1/4, 1/3, 1/2, 1/1, 2/1, 3/1, 4/1, 6/1, 8/1.
Fibonacci Angles — 0.214, 0.35, 0.382, 0.618, 0.786, 0.886, 0.9335, 1.118, 1.236, 1.382, 1.618.
Custom Angles — до 10 значений (точечные линии) с подписями.
Советы по применению
Выбор A1 и B1:
A1 — значимый экстремум начала движения.
B1 — следующий важный экстремум для задания наклона.
Логарифмическая шкала:
Подходит для долгосрочных экспоненциальных трендов (крипто, акции роста).
Цена должна быть > 0.
Следите, как цена реагирует на разные углы:
1/1 — медианный тренд.
Дробные углы — потенциальная поддержка/сопротивление.
Кратные — ускорение/замедление движения.
Дисклеймер
Это инструмент технического анализа и не является инвестиционной рекомендацией. Торговые решения вы принимаете на свой страх и риск.
Gann Square of 144This indicator will create lines on the chart based on W.D. Gann's Square of 144. All the inputs will be detailed below
Why create this indicator?
I didn't find it on Tradingview (at least with open source). But the main reason is to study the strategy and be able to draw it fast. Manually drawing the square is not hard, but moving all together to the right spots and scale was time-consuming.
It has a lot of inputs...
Yes, each square point divisible by 6 has information with some options, so the user can create any configuration he wants. Also, it has the advantage of having the square built in seconds and adjusting itself on each new calculation.
About the inputs
Starting Date
This input will be used when the "Set Upper/Lower Prices and Start Bar Automatically" checkbox is not selected. The indicator will calculate all the line locations on the chart using the selected start date. When selecting this input, change the Manual Max and Min Prices to the better calculation
Manual Max/Min Price
This input will be used when the "Set Upper/Lower Prices and Start Bar Automatically" checkbox is not selected. The indicator will calculate all the line's locations on the chart using these prices
Set Upper/Lower Prices and Start Bar Automatically
Selects if the starting date will be automatically selected by the system or based on the input data. When it's set, the indicator will use the most recent bar as the middle point of the square, using the higher price as the Upper Price and the lowest price as the Lower Price in the latest 72 bars (or more based on the Candles Per Division parameter)
Update at a new bar
When this option is market, the indicator will update all created lines to match the new bar position, together with all the possible new Upper/Lower prices. Let it unchecked to watch the progression of the price while the square remains fixed in the chart.
Top X-Axis
When checked, it will display the labels on the Top of the square
Bottom X-Axis
When checked, it will display the labels on the Bottom of the square
Left X-Axis
When checked, it will display the labels on the left of the square
Right X-Axis
When checked, it will display the labels on the right of the square
Show Prices on the Right Y-Axis
When checked, it will display the prices together with the labels on the right of the square
Show Vertical Divisions
Show the lines that will divide the square into 9 equal parts
Show Extra Lines
Show unique lines that will come from the Top and bottom middle of the square, connecting the center to the 36 and 108 levels
Show Grid
When selected, it will display a grid in the square
Line Patterns
A selector with some options of built-in lines configuration. When any option besides None is selected, it will override the lines inputs below
Numbers Color
Select the color of each number on the Axis
Vertical Lines Color
Select the color of the vertical lines
Grid Color
Select the grid line color
Connections from corners to N
Each corner is represented by 2 characters, so they all fit in a single line
It will indicate where the line starts and where it ends
┏ ↓ = Top Left to Bottom
┏ → = Top Left to Right
┗ ↑ = Bottom Left to Top
┗ → = Bottom Left to Right
┓ ← = Top Right to Left
┓ ↓ = Top Right to Bottom
┛ ← = Bottom Right to Left
┛ ↑ = Bottom Right to Top
Besides selecting what line will be created, it's possible to select the color, the style, and the extension
How to use this indicator
When you dig into Gann's books for more information about the square of 144, you find that it was part of his setup with multiple indicators (technical and fundamental, and astrological). It is not a "one indicator" setup, so it's hard to say that you will find entries, exits, stop loss, and take profit in this. Still, it will help see trendiness, support, and resistance levels.
Mixing this with other indicators is probably a good idea, but some may find this indicator the only one needed.
Some aspects of the square
The end of the square is important, so where it starts is crucial. The end is important because it is where the price and time expire. The other parts of the square are defined based on their start and end, so placing them right is essential.
So, where to set the start of the square?
The last major low is the most indicated. The minimum price will be the lowest, and the max price will be the last major Top. Note that the indicator uses 1 candle on each point.
After finding the start, the minimum, and the maximum prices for the square, it will draw all lines. Another essential part of the square is The Midpoint.
The midpoint is the most crucial part of the square and is the best way to see if you positioned the square correctly. When the price is inside the square, using the starting candle as the start, a second higher low or a lower high occurs in that spot. When using the Vertical lines in the indicator, it's the middle square inside Gann's square.
The other divisions will be opposing each other most of the time. So if the price is rising in the 1/3 of the square, it's common to see the price fall in the 3/3 of the square.
More information about these aspects here
Considerations
This indicator was meant for price targets and a time calculator for possible support/resistances in the chart. It was created by William Delbert Gann and was part of his setup for trading almost a century ago. The lines will form geometric figures, which Gann used with high accuracy to predict tops/bottoms and when they would occur.

Gann Trend Oscillator Backtest The Gann Swing Oscillator has been adapted from Robert Krausz's book,
"A W.D. Gann Treasure Discovered". The Gann Swing Oscillator helps
define market swings.
You can change long to short in the Input Settings
Please, use it only for learning or paper trading. Do not for real trading.

Gann Trend Oscillator Strategy The Gann Swing Oscillator has been adapted from Robert Krausz's book,
"A W.D. Gann Treasure Discovered". The Gann Swing Oscillator helps
define market swings.

Gann Swing Oscillator The Gann Swing Oscillator has been adapted from Robert Krausz's book,
"A W.D. Gann Treasure Discovered". The Gann Swing Oscillator helps
define market swings.
You can change long to short in the Input Settings
Please, use it only for learning or paper trading. Do not for real trading.

Gann Swing Oscillator Strategy The Gann Swing Oscillator has been adapted from Robert Krausz's book,
"A W.D. Gann Treasure Discovered". The Gann Swing Oscillator helps
define market swings.
