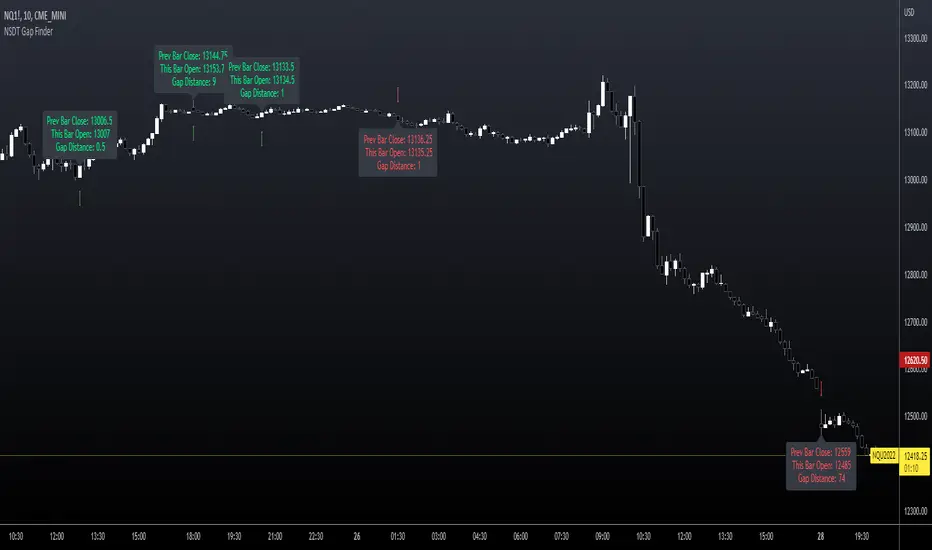
NSDT Gap FinderThis script plots gaps between candles.
It uses the "round_to_mintick" feature in the Pinescript code, so it works on any instrument out to 3 decimal places.
If there is a Gap Up (open of current candle is greater than the close of previous candle) it will plot a green arrow under the current candle and plot a label above the current candle to show the Gap Amount.
If there is a Gap Down (open of current candle is less than the close of previous candle) it will plot a red arrow over the current candle and plot a label below the current candle to show the Gap Amount.
You can turn the label and/or the arrow on and off.
I created this indicator to more easily identify gaps in the market. The probability of a gap being filled is extremely high. Some are right away (intraday candle to candle), some take a while (gap from previous day close to current day open), and some make take a long time (close at end of previous week to open at beginning of current week).
This is published free to use and open source code.
Please see my other similar Gap Indicators.
Daily Gap Range
USA Session - Previous Day Close Gap to Current Day Open
Cerca negli script per "gaps"
Oxy CandlestickOxymoronic (oxy) candlesticks often appear at significant levels in a chart and can indicate increased probabilities of directional moves.
Typically, green candles are hollow and red candles are filled. An oxymoronic candle is colored bullishly but filled bearishly (solid green) or vice versa (hollow red).
Oxy flags occur when:
1) Price gaps up and closes lower than the open but above the last close. A solid green (or black) candle is bearish.
2) Price gaps down and closes higher than the open but below the last close. A hollow red candle is bullish.
An oxy candle indicates one of three things:
1) Price is going up (bullish oxy)
2) Price is going down (bearish oxy)
3) Price will return to this level (either)
#1 and #2 are the default meaning. If those don't play out then look for #3.
As is the case with most indicators, it is best not to use this indicator in isolation, but to combine it with other forms of analysis to increase your probabilities and to identify significant levels.

Fractal Break Imbalance / Fair Value Gap (FVG) / Liquidity VoidFractal Break Imbalance / Fair Value Gap (FVG) / Liquidity Void
Order imbalances in either direction, either excess buy or sell orders, reduce liquidity. The market will seek to fill gaps sooner or later. The script marks an imbalance / FVG after a fractal break. It also marks any other imbalance.
Default Colours:
Green - Imbalance after fractal break to the upside
Red - Imbalance after fractal break to the downside
Yellow - Other imbalances
How To Use:
Gaps can be used to determine possible entries and targets. Those familiar with liquidity raids, supply and demand, and ICT concepts may realise it's potential.
Indicator in use:

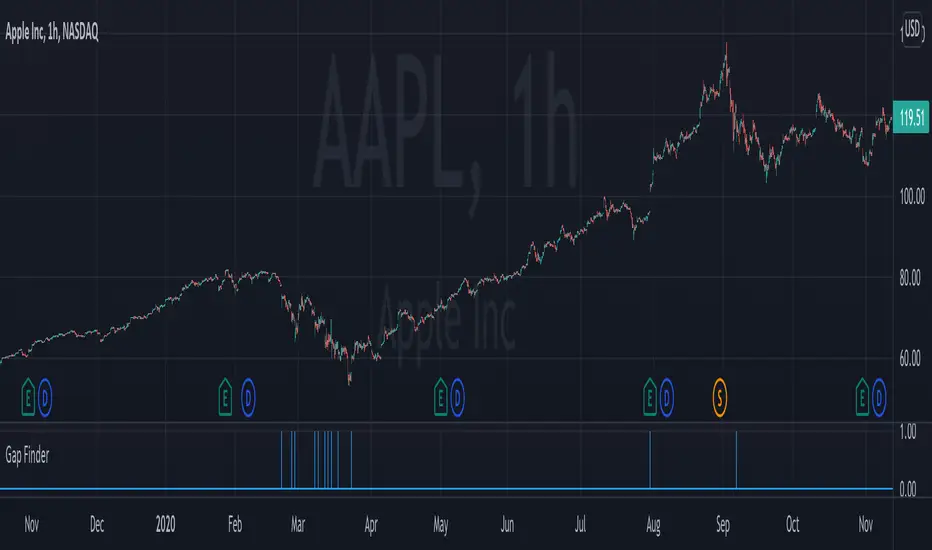
Gap FinderThis indicator finds gaps based on User specified input % threshold in the indicator settings. Histogram plot shows gaps as vertical lines for easy detection. Enjoy!
Elgrand - GapsVisualize gaps between 2 bars using the open and close bar values. You can also display old gaps which have been closed which might be helpful for finding older support and resistance areas. The script is a bit heavy to run and probably will need some improvements. At least no more trying to spot a gap on your chart ;-) This script will do it for you.

RAFEN-G - Kill Zones & Institutional Gaps🔍 What It Does
Kill Zones (KZ1, KZ2, KZ3)
Automatically highlights the main intraday liquidity windows such as the London open, NY AM, and NY PM sessions — customizable by time, color, and transparency.
Perfect for timing setups, identifying liquidity sweeps, or backtesting session behavior.
Institutional GAP Detection (NY 11:00 → 03:00)
Anchored on the New York H1 clock, the script automatically draws the “institutional gap” between the 11:00 close and the 03:00 open of the next trading day.
Each gap is drawn as a transparent box with a label showing its size in price units.
Dynamic Cleanup & Color Updates
Automatically removes old boxes beyond your chosen history limit and keeps all visuals perfectly synchronized in real-time.
⚙️ Key Features
3 fully independent and editable Kill Zones
Adjustable timezone (default: America/New_York)
Works on all intraday timeframes
Auto-management of historical data
Clean and lightweight visuals (up to 2000 boxes)
Real-time color and transparency updates
Alerts when each Kill Zone starts
🧠 Ideal For
Traders using ICT, SMC, or institutional frameworks who want clear visual separation of market sessions and automatic tracking of session-to-session gaps for confluence or imbalance analysis.
🕐 Recommended Use
Apply on 5 min / 15 min / 1 h charts, align timezone to NYC, and combine with liquidity or FVG tools for maximum insight.

Fair Value Gaps by DGTFair Value Gaps
A refined, multi-timeframe Fair Value Gap (FVG) detection tool that brings institutional imbalance zones to life directly on your chart.
Designed for precision, it visualizes how price delivers into inefficiencies across chart, higher, and lower (intrabar) timeframes — offering a fluid, structural view of liquidity displacement and market flow.
The script continuously tracks unfilled, partially repaired, and fully resolved imbalances, revealing where liquidity inefficiencies concentrate and where price may seek rebalancing.
Overlapping zones naturally expose institutional footprints, potential liquidity targets, and key re-pricing regions within the broader market structure.
KEY FEATURES
⯌ Multi-Timeframe Detection
Detect and display FVGs from the current chart, higher timeframes (HTF), or lower timeframes (LTF)
⯌ Smart Fill Tracking
Automatic real-time monitoring of each FVG’s fill progress with live percentage updates
⯌ Custom Fill Logic
Choose your preferred definition of when a gap is considered filled: Any Touch
Midpoint Reached
Wick Sweep
Body Beyond
⯌ Dynamic Labels & Tooltips
Labels can be toggled on/off. Even when hidden, detailed tooltips remain available by hovering over the FVG midpoint.
⯌ Adaptive Lower-Timeframe Mode
When set to “Auto,” the script intelligently selects the optimal lower timeframe based on the chart resolution.
DISCLAIMER
This script is intended for informational and educational purposes only. It does not constitute financial, investment, or trading advice. All trading decisions made based on its output are solely the responsibility of the user.

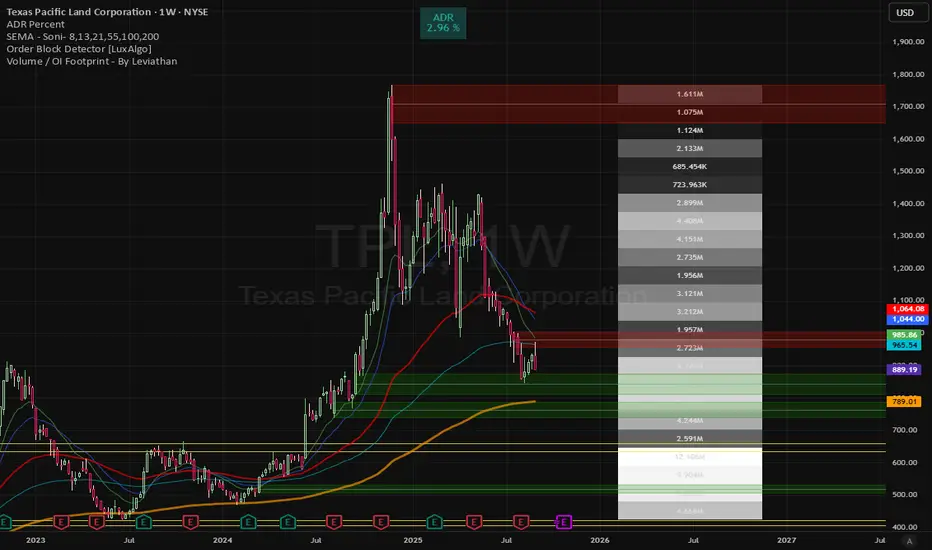
Volume gaps Volume gaps (white-highlighted zones) are unfinished business in the market. Mark them between low–high, and expect price to revisit them. They’re excellent targets for mean reversion trades and confluence levels for continuation setups
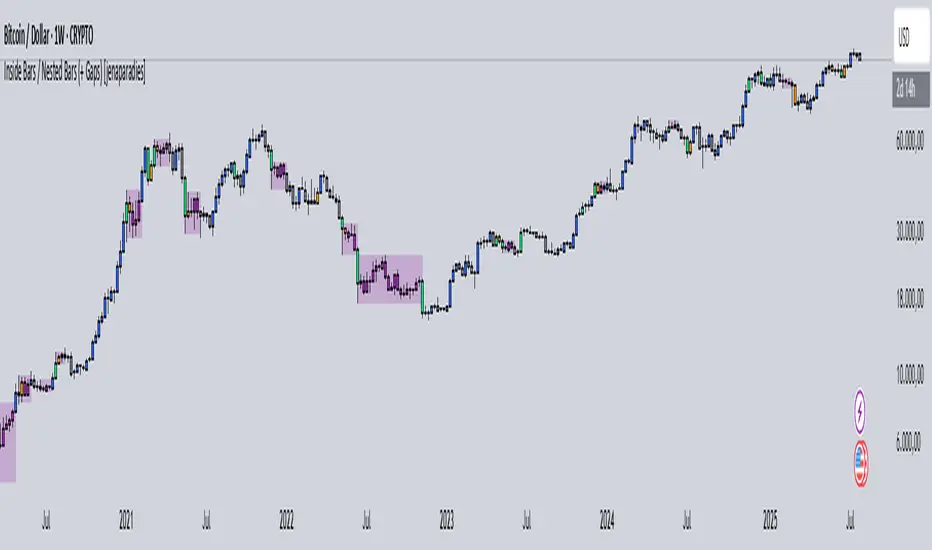
Inside Bars / Nested Bars (+ Gaps) [jenaparadies]📌 Features
Highlight inside bars
Highlight bars that remain within the range of a mother bar (called nested bars )
Highlight the mother bar (optional)
Highlight consecutive nested bars using a visual box (optional)
Enable no-gap candle logic (optional, see below)
Show no-gap candles on the chart (optional)
Fully customizable colors and appearance
📌 Method
An inside bar is any candle whose high is lower than or equal to the previous candle's high, and whose low is higher than or equal to the previous candle's low. In other words, the entire price action of the inside bar remains within the range of the previous candle without exceeding it. The preceding candle is referred to as the mother bar .
Occasionally, the candle following the inside bar may break above or below the inside bar's range, while still remaining fully within the high and low of the mother bar. These candles are referred to as nested bars and are highlighted in a different color.
Optionally, sequences of consecutive nested bars can be enclosed within a box to emphasize consolidation zones.
📌 No-Gap Candles (Optional)
This feature adjusts each candle’s opening price so that it matches the closing price of the previous candle. It is particularly useful for assets that frequently experience large gaps between candles.
By extending each candle's effective range to include the previous candle's close, the indicator maintains structural consistency over timeframes, especially when the open price deviates significantly from the prior close. Inside bars are then identified relative to the extended range of the mother bar.
Optionally, the adjusted no-gap candles can be visualized directly on the chart for better clarity.
🎁 Bonus
Activating the "Show No-Gap Candles" option transforms any line chart into a gap-free bar chart ‒ ideal for visualizing economic data such as inflation rates.
Synapse Trade - Fair Value GapsNot your average FVG indicator. This FVG indicator allowed for overlapping, and invalidated FVGs to remain as the existence of Inversion Fair Value Gaps exists and, in my recent experience, has been incredibly useful finding new levels of support and resistance, even inside a currently FVG, the "invalidated" FVGs can still have an impact on price trend and react to it.
~edit: updated chart to be cleaner and include only the FVG indicator

Gap Down Reversal Strategy█ STRATEGY OVERVIEW
The "Gap Down Reversal Strategy" capitalizes on price recovery patterns following bearish gap-down openings. This mean-reversion approach enters long positions on confirmed intraday recoveries and exits when prices breach previous session highs. This strategy is NOT optimized.
█ What is a Gap Down Reversal?
A gap down reversal occurs when:
An instrument opens significantly below its prior session's low (price gap)
Selling pressure exhausts itself during the session
Buyers regain control, pushing price back above the opening level
Creates a candlestick with:
• Open < Prior Session Low (true gap)
• Close > Open (bullish reversal candle)
█ SIGNAL GENERATION
1. LONG ENTRY CONDITION
Previous candle closes BELOW its opening price (bearish candle)
Current session opens BELOW prior candle's low (gap down)
Current candle closes ABOVE its opening price (bullish reversal)
Executes market order at session close
2. EXIT CONDITION
A Sell Signal is generated when the current closing price exceeds the highest high of the previous seven bars (`close > _highest `). This indicates that the price has shown strength, potentially confirming the reversal and prompting the strategy to exit the position.
█ PERFORMANCE OVERVIEW
Ideal Market: High volatility instruments with frequent gaps
Key Risk: False reversals in sustained downtrends
Optimization Tip: Test varying gap thresholds (1-3% ranges)

Immediate Rebalance ICT [TradingFinder] No Imbalances - MTF Gaps🔵 Introduction
The concept of "Immediate Rebalance" in technical analysis is a powerful and advanced strategy within the ICT (Inner Circle Trader) framework, widely used to identify key market levels.
Unlike the "Fair Value Gap," which leaves a price gap requiring a retracement for a fill, an Immediate Rebalance fills the gap immediately, representing an instant balance that strengthens the prevailing market trend. This structure allows traders to quickly spot critical price zones, capitalizing on strong trend continuations without the need for price retracement.
The "Immediate Rebalance ICT" indicator leverages this concept, providing traders with automated identification of critical supply and demand zones, order blocks, liquidity voids, and key buy-side and sell-side liquidity levels.
Through features like crucial liquidity points and immediate rebalancing areas, this tool enables traders to perform precise real-time market analysis and seize profitable opportunities.
🔵 How to Use
The Immediate Rebalance indicator assists traders in identifying reliable trading signals by detecting and analyzing Immediate Rebalance zones. By focusing on supply and demand areas, the indicator pinpoints optimal entry and exit positions.
Here’s how to use the indicator in both bearish (Supply Immediate Rebalance) and bullish (Demand Immediate Rebalance) structures :
🟣 Bullish Structure (Demand Immediate Rebalance)
In a bullish scenario, the indicator detects a Demand Immediate Rebalance formed by two consecutive bullish candles with overlapping wicks. This structure signifies an immediate demand zone, where price instantly balances within the zone, reducing the likelihood of a revisit and indicating potential upside momentum.
Zone Identification : Look for two consecutive bullish candles with overlapping wicks, forming a demand zone. This structure, due to its rapid balance, usually does not require a revisit and supports further upward movement.
Entry and Exit Levels : If price revisits this zone, percentage markers, particularly 50% and 75%, act as supportive levels, creating ideal entry points for long positions.
Example : In the second image, an example of a Demand Immediate Rebalance is shown, where overlapping bullish candle shadows indicate immediate balance, supporting the continuation of the bullish trend.
🟣 Bearish Structure (Supply Immediate Rebalance)
In a bearish setup, the indicator identifies a Supply Immediate Rebalance when two consecutive bearish candles with overlapping wicks appear. This formation signals an immediate supply zone, suggesting a high probability of trend continuation to the downside, with minimal expectation for price to retrace back to this area.
Zone Identificatio n: Look for two consecutive bearish candles with overlapping shadows. This structure forms a supply area where price is expected to continue its downtrend without revisiting the zone.
Entry and Exit Level s: Should price revisit this zone, percentage-based levels (e.g., 50% and 75%) serve as potential resistance points, optimizing entry for short positions, especially if the downtrend is expected to persist.
Example : The attached chart illustrates a Supply Immediate Rebalance, where overlapping candle shadows define this area, reassuring traders of a continued downward trend with a low likelihood of price returning to this zone.
🔵 Settings
ImmR Filter : This filter allows users to adjust the detection of Immediate Rebalance zones in four modes, from "Very Aggressive" to "Very Defensive," based on zone width. The chosen mode controls the sensitivity of Immediate Rebalance detection, allowing users to fine-tune the indicator to their trading style.
Multi Time Frame : Enabling this option allows users to set the indicator to a specific timeframe (1 minute, 5 minutes, 15 minutes, 30 minutes, 1 hour, 4 hours, daily, weekly, or monthly), broadening the perspective for identifying Immediate Rebalance zones across multiple timeframes.
🔵 Conclusion
The Immediate Rebalance indicator, based on rapid balancing zones within supply and demand areas, serves as a powerful tool for market analysis and improving trade decision-making.
By accurately identifying zones where price achieves instant balance without gaps, the indicator highlights areas likely to support strong trend continuations, exempt from common retracements.
The indicator’s use of percentage levels enables traders to pinpoint optimal entry and exit points more effectively, with levels like 50% and 75% acting as support within demand zones and resistance within supply zones. This empowers traders to ride strong trends without the worry of abrupt reversals.
Overall, the Immediate Rebalance is a reliable tool for both professional and beginner traders seeking precise methods to recognize supply and demand zones, capitalizing on consistent trends.
By choosing appropriate settings and focusing on the zones highlighted by this indicator, traders can enter trades with greater confidence and improve their risk management.

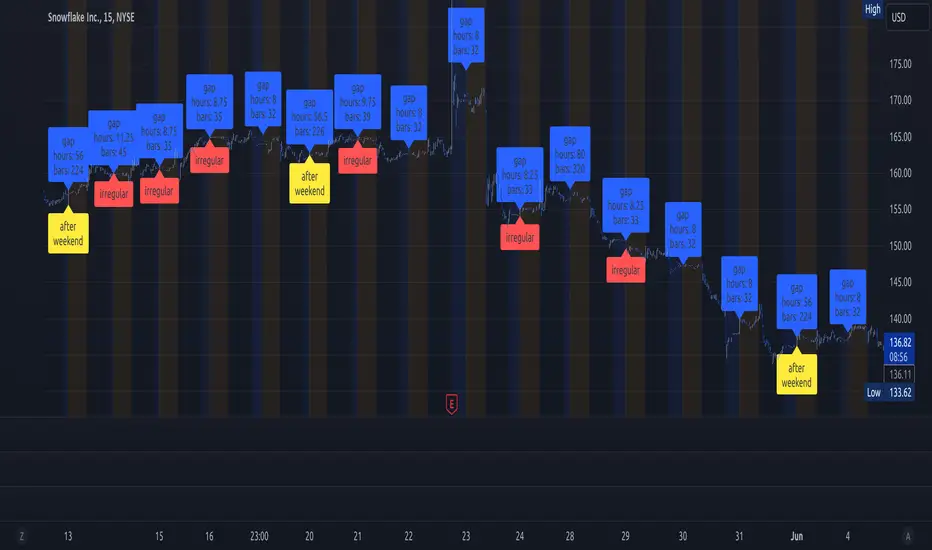
lib_session_gapsLibrary "lib_session_gaps"
simple lib to calculate the gaps between sessions
time_gap()
calculates the time gap between this and previous session (in case of irregular end of previous session, considering extended sessions)
Returns: the time gap between this and previous session in ms (time - time_close )
bar_gap()
calculates the bars missing between this and previous session (in case of irregular end of previous session, considering extended sessions)
Returns: the bars virtually missing between this and previous session (time gap / bar size in ms)
Fair Value Gaps Setup 01 [TradingFinder] FVG Absorption + CHoCH🔵 Introduction
🟣 Market Structures
Market structures exhibit a fractal and nested nature, which leads us to classify them into internal (minor) and external (major) categories. Definitions of market structure vary, with different methodologies such as Smart Money and ICT offering distinct interpretations.
To identify market structure, the initial step involves examining key highs and lows. An uptrend is characterized by successive highs and lows that are higher than their predecessors. Conversely, a downtrend is marked by successive lows and highs that are lower than their previous counterparts.
🟣 Market Trends and Movements
Market trends consist of two primary types of movements :
Impulsive Movements : These movements align with the main trend and are characterized by high strength and momentum.
Corrective Movements : These movements counter the main trend and are marked by lower strength and momentum.
🟣 Break of Structure (BOS)
In a downtrend, a Break of Structure (BOS) occurs when the price falls below the previous low and establishes a new low (LL). In an uptrend, a BOS, also known as a Market Structure Break (MSB), happens when the price rises above the last high.
To confirm a trend, at least one BOS is necessary, which requires the price to close at least one candle beyond the previous high or low.
🟣 Change of Character (CHOCH)
Change of Character (CHOCH) is a crucial concept in market structure analysis, indicating a shift in trend. A trend concludes with a CHOCH, also referred to as a Market Structure Shift (MSS).
For example, in a downtrend, the price continues to drop with BOS, showcasing the trend's strength. However, when the price rises and exceeds the last high, a CHOCH occurs, signaling a potential transition from a downtrend to an uptrend.
It is essential to note that a CHOCH does not immediately indicate a buy trade. Instead, it is prudent to wait for a BOS in the upward direction to confirm the uptrend. Unlike BOS, a CHOCH confirmation does not require a candle to close; merely breaking the previous high or low with the candle's wick is sufficient.
🟣 Spike | Inefficiency | Imbalance
All these terms mean fast price movement in the shortest possible time.
🟣 Fair Value Gap (FVG)
To pinpoint the "Fair Value Gap" (FVG) on a chart, a detailed candle-by-candle analysis is necessary. This process involves focusing on candles with substantial bodies and evaluating them in relation to the candles immediately before and after them.
Here are the steps :
Identify the Central Candle : Look for a candle with a large body.
Examine Adjacent Candles : The candles before and after this central candle should have long shadows, and their bodies must not overlap with the body of the central candle.
Determine the FVG Range : The distance between the shadows of the first and third candles defines the FVG range.
This method helps in accurately identifying the Fair Value Gap, which is crucial for understanding market inefficiencies and potential price movements.
🟣 Setup
This setup is based on Market Structure and FVG. After a change of character and the formation of FVG in the last lag of the price movement, we are looking for trading positions in the price pullback.
Bullish Setup :
Bearish Setup :
🔵 How to Use
After forming the setup, you can enter the trade using a pending order or after receiving confirmation. To increase the probability of success, you can adjust the pivot period market structure settings or modify the market movement coefficient in the formation leg of the FVG.
Bullish Setup :
Bearish Setup :
🔵 Setting
Pivot Period of Market Structure Detector :
This parameter allows you to configure the zigzag period based on pivots. Adjusting this helps in accurately detecting order blocks.
Show major Bullish ChoCh Lines :
You can toggle the visibility of the Demand Main Zone and "ChoCh" Origin, and customize their color as needed.
Show major Bearish ChoCh Lines :
Similar to the Demand Main Zone, you can control the visibility and color of the Supply Main Zone and "ChoCh" Origin.
FVG Detector Multiplier Factor :
This feature lets you adjust the size of the moves forming the Fair Value Gaps (FVGs) using the Average True Range (ATR). The default value is 1, suitable for identifying most setups. Adjust this value based on the specific symbol and market for optimal results.
FVG Validity Period :
This parameter defines the validity period of an FVG in terms of the number of candles. By default, an FVG remains valid for up to 15 candles, but you can adjust this period as needed.
Mitigation Level FVG :
This setting establishes the basic level of an FVG. When the price reaches this level, the FVG is considered mitigated.
Level in Low-Risk Zone :
This feature aims to reduce risk by dividing the FVG into two equal areas: "Premium" (upper area) and "Discount" (lower area). For lower risk, ensure that "Demand FVG" is in the "Discount" area and "Supply FVG" in the "Premium" area. This feature is off by default.
Show or Hide :
Given the potential abundance of setups, displaying all on the chart can be overwhelming. By default, only the last setup is shown, but you can enable the option to view all setups.
Alert Settings :
On / Off : Toggle alerts on or off.
Message Frequency : Determine how often alerts are triggered.
Options include :
"All" (alerts every time the function is called)
"Once Per Bar" (alerts only on the first call within the bar)
"Once Per Bar Close" (alerts only at the last script execution of the real-time bar upon closing)
The default setting is "Once Per Bar".
Show Alert Time by Time Zone : Set the alert time based on your preferred time zone, such as "UTC-4" for New York time. The default is "UTC".
Display More Info : Optionally show additional details like the price range of the order blocks and the date, hour, and minute in the alert message. Set this to "Off" if you prefer not to receive this information.

Fair Value Gaps (Volumetric) | Flux Charts💎 GENERAL OVERVIEW
Introducing a brand new Fair Value Gaps (FVG) indicator, now with Volumetric Zones! You can now see the total volume of FVG zones, as well as their bullish & bearish volume ratio.
Features of the Volumetric FVG Indicator :
Render Bullish / Bearish FVG Zones
See Total Volume Of The FVG Zones
See The Ratio Of Bullish / Bearish Bar Volume Of FVG Zones
Combination Of Overlapping FVG Zones
Variety Of Zone Detection/ Sensitivity / Filtering / Invalidation Settings
High Customizability
🚩UNIQUENESS
The ability to render the total volume of FVGs as well as bullish / bearish volume ratio is what sets this FVG indicator apart from others. Also the ability to combine overlapping FVG zones will result in cleaner charts for traders.
⚙️SETTINGS
1. General Configuration
Zone Invalidation -> Select between Wick & Close price for FVG Zone Invalidation.
Zone Filtering -> With "Average Range" selected, algorithm will find FVG zones in comparison with average range of last bars in the chart. With the "Volume Threshold" option, you may select a Volume Threshold % to spot FVGs with a larger total volume than average.
FVG Detection -> With the "Same Type" option, all 3 bars that formed the FVG should be the same type. (Bullish / Bearish). If the "All" option is selected, bar types may vary between Bullish / Bearish.
Detection Sensitivity -> You may select between Low, Normal or High FVG detection sensitivity. This will essentially determine the size of the spotted FVGs, with lower sensitivities resulting in spotting bigger FVGs, and higher sensitivities resulting in spotting all sizes of FVGs.
Show Historic Zones -> If this option is on, the indicator will render invalidated FVG zones as well as current FVG zones. For a cleaner look at current FVG zones which are not invalidated yet, you can turn this option off.

Inversion GapsAn inverted fair value gap (FVG) occurs when candles start closing below a bullish FVG or above a bearish FVG and in this case, support FVGs become resistances and vice versa. This is a smart money concept introduced by ICT. While we a number of have indicators for FVGs, we don't have any for inversion FVGs. This indicator is just for that - it shows FVGs only after they're inverted.
The meat of it comes from being able to plot HTF inverted FVGs in LTF. In the above BTC chart, you can see M15 inverted FVGs plotted on M1 chart and you can see price respecting them. Mitigations can also be shown as lines (as you can see in the chart).
You can also setup alerts for formation and mitigation of such inversion FVGs.

Spinn GAPs offIf you need to see the price movement without gaps, especially on very small timeframes, this simple indicator will help you with this. It uses the closing price of the previous candle as the opening price of the current one.
For its correct operation, you need to disable the display of candles in settings.
--
Если вам нужно увидеть ход цены без учета ГЭПов, особенно на очень мелких таймфреймах, этот простой индикатор поможет вам в этом. Он использует цену закрытия предыдущей свечи в качестве цены открытия текущей.
Для его корректной работы нужно отключить отображение свечей стандартными средствами.

Stock Gaps SPY Correlation StrategyThis is daytrade stock strategy, designed to take the best out of the daily gaps that are forming between the close of previous day and opening of present day.
At the same time its logic has been adapted for SPY chart, in order to use correlation with the other stocks/assets/ etf which are linked with SP500 movement.
Lastly it has been added 2 new confirmation logics, based on the USI: advance/decline chart and percentage above vwap among all US stocks.
The rules for entry are simple :
We are at the opening daily candle, we have a long/short gap based on where the opening is happening and at the same time we are checking to see that the current different between the current difference between low and previous high (or viceversa) is higher than an established parameter(minimal deviation )
For exit, we exit based on time/clock parameter, in this case by default I selected 1h and half before close of the US session.
For testing purposes I have used 10% of the available capital, with a 0.0035$ comission per each share bought ( IBKR comissions)
If there are any questions, please let me know either here or in private !

GAP HunterThis indicator shows the GAPs that are formed according to whether the opening price is above or below the rate specified in the selection box. An alarm can be set on these conditions.

Extreme Bars"Extreme Bars" is a simple but useful indicator that marks overbought and oversold candles. This indicator paints candles that fall far above the average red, and the candles that rise above the average green. Of course, they can change these colors if they want. "Extreme Bars" can be interpreted in many different ways. The starting points of colored candles can often be good support or resistance. In addition, it would be wise to close the positions opposite the colored candles and to maintain the positions compatible with the colored candles. It is also possible that the gaps formed by the colored candles will be closed in the future. The sensitivity of the indicator can be changed in the settings section.

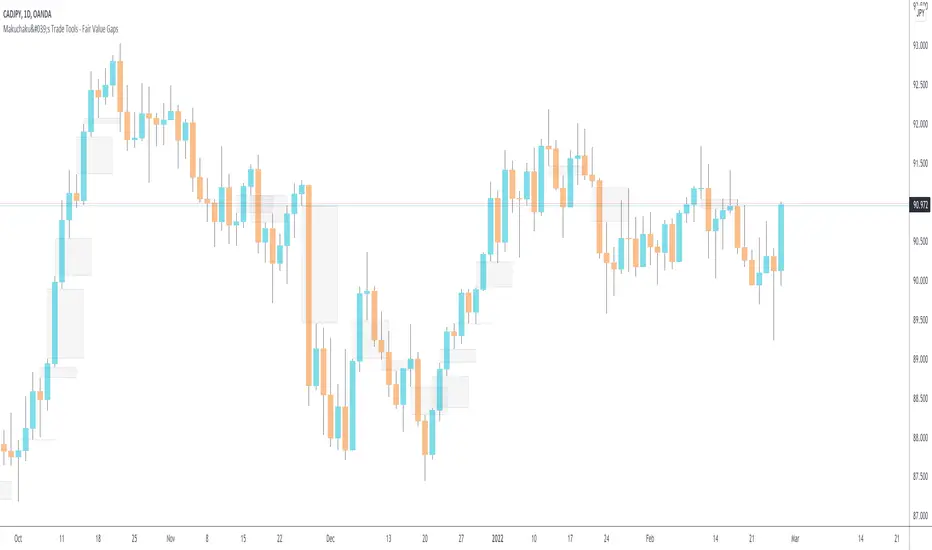
Makuchaku's Trade Tools - Fair Value GapsFair Value Gaps are a 3 candlesticks patterns, formed when the 3rd candle does not fully overlaps the 1st candle, leaving a gap in the 2nd candle.
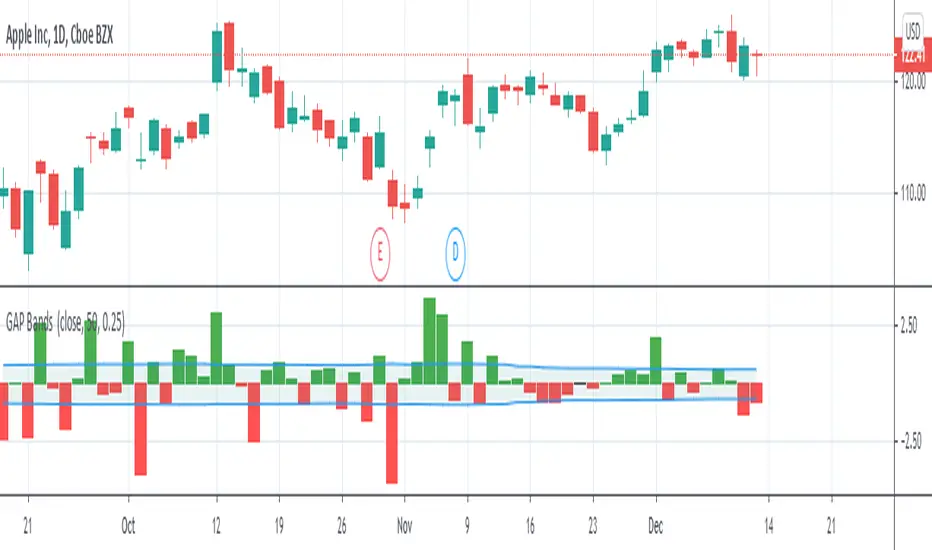
GAP Bands""
Introduction
Gap trading is a simple and disciplined approach to buying and shorting stocks. Essentially, one finds stocks that have a price gap from the previous close, then watches the first hour of trading to identify the trading range. Rising above that range signals a buy, while falling below it signals a short.
What is a Gap?
A gap is a change in price levels between the close and open of two consecutive days. Although most technical analysis manuals define the four types of gap patterns as Common, Breakaway, Continuation and Exhaustion, those labels are applied after the chart pattern is established. That is, the difference between any one type of gap from another is only distinguishable after the stock continues up or down in some fashion. Although those classifications are useful for a longer-term understanding of how a particular stock or sector reacts, they offer little guidance for trading.""" (Definition from StockCharts)
I plot gaps and add a band to them with volatility to make a decision about how important the current gap in terms of our price movement.
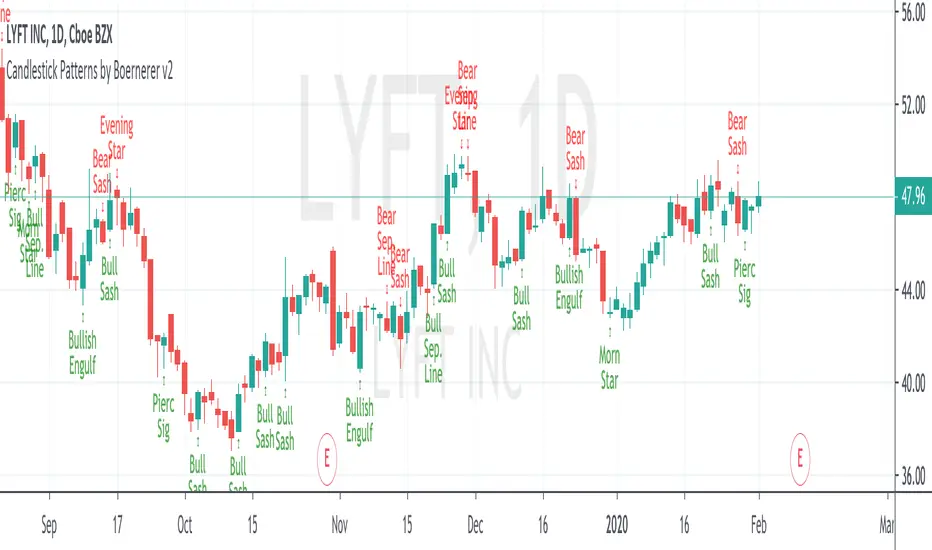
Candlestick Patterns by Boernerer v2New version 2 of my modifications of the original candlestick pattern script by Robert Waddell.
- Added window (= gaps) detection
- Added Bear/Bull Sash
- Added Bear/Bull Counter Attack
- Added Bear/Bull Seperating Line
- Modified candlestick ID code
- Added Lookback period instead of SMA (TLine) for trend detection