Cerca negli script per "grid"

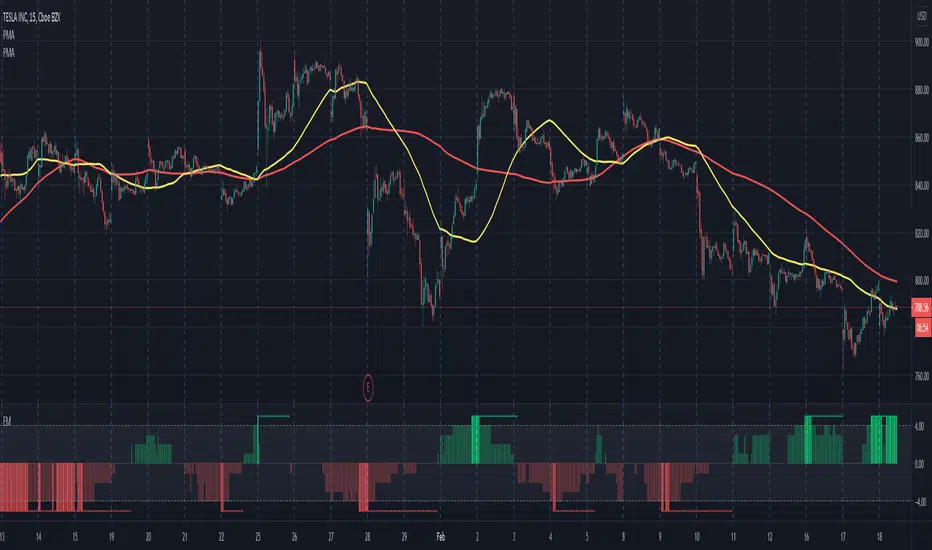
Elliott Wave AnalysisInitially, Elliott wave analysis is designed to simplify and increase the objectivity of graph analysis using the Elliott method. Probably, this indicator can be successfully used in trading without knowing the Elliott method.
The indicator is based on a supertrend. Supertrends are built in accordance with the Fibonacci grid. The degree of waves in the indicator settings corresponds to a 1-hour timeframe - this is the main mode of working with the indicator. I also recommend using weekly (for evaluating large movements) and 1-minute timeframes.
When using other timeframes, the baseline of the indicator will correspond to:
1 min-Submicro
5 minutes-Micro
15 minutes-Subminuette
1 hour-Minuette
4 hours-Minute
Day-Minor
Week-Intermediate
Month-Primary
Those who are well versed in the Elliott method can see that the waves fall on the indicator almost perfectly. To demonstrate this, I put the markup on the graph

Electrified Momentum Signal (Prototype)This indicator uses an ensemble of different indicators to help in identifying significant changes in momentum.
It's time-frame is constant and is based up on the length of the configurable period. This allows for a consistent signal across multiple time-frames.
This is not a buy or sell signal but can be used for alerts to indicate a change in momentum that might be worth paying attention to.
If looking for an long entry point, a negative (red) value can signal "don't buy yet" or may simple mean "it's risky". In a similar way if looking for a short, a positive (green) value can signal "not now".
Note: "Electrified" does not mean this has anything to do with electric vehicles or the power grid. :P
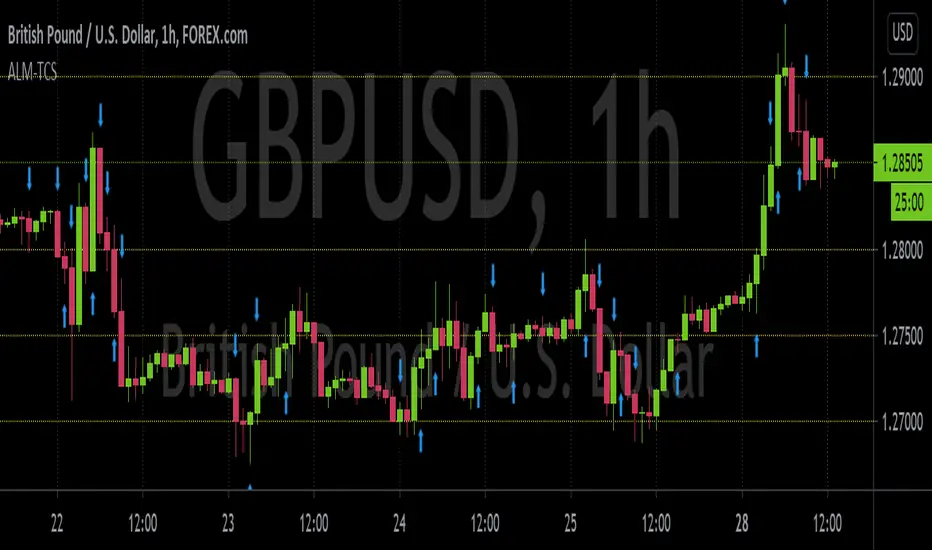
ALM-TCSThis is an indicator built to help those who trade using the ALM-TCS strategy created and taught by Federico Sellitti. The ALM strategy is a statistics-based trend-following strategy based on a trading grid.
Interest Zones ScannerThis indicator automatically scans a user-defined price range (on current or higher timeframe) to detect and plot the strongest horizontal support/resistance zones based on validated price reactions. It intelligently identifies levels where price has repeatedly bounced without breaking for a specified number of bars, prioritizing high-probability reaction areas.
How It Works (Technical Methodology)
Range Calculation
The script determines the high/low range using a configurable method:
"Lookback Bars": User-defined number of bars (default 400) on the target timeframe.
"Fixed Start Date": Bars since a specified date (default dynamic).
Data is fetched via request.security() from a selectable timeframe (default current chart TF) for multi-timeframe alignment.
Auto Mode Scanning
When enabled:
Scans the entire range in small percentage steps (default 1.0%, adjustable down to 0.5%).
For each potential level, creates a thin volatility-adjusted zone (height % of price, default 0.07%).
Counts "valid hits": Instances where price touches the zone and holds (no break) for user-defined bars (default 10).
Break detection: Configurable "Close" (strict) or "Wick" (sensitive).
Assumes support/resistance direction based on close relative to zone center.
Level Selection and Filtering
Ranks candidates by hit count (highest first).
Applies minimum distance filter (% apart, default 8%) to avoid clustering.
Limits to user-defined max zones (default 9) for clean display.
Sorts final zones from low to high price.
Manual Mode Alternative
When auto disabled: Directly uses user-input percentages (e.g., classic Fibo levels like 23.6, 50, 61.8) applied to the range – no validation/scoring.
Zone Construction
Horizontal boxes centered on validated levels, with dynamic height (% of price).
Colored by position: Supply (above close, default light gray), Demand (below close, default cyan).
Optional full extension (both sides) or right-only.
Labeled with percentage from range low.
Dashboard and Visuals
Table (positionable) shows:
% Level, Exact Price, Hit Count (green if >3).
Header with validation details and lookback info.
Vertical line marks range start for reference.
How to Use
This scanner excels at finding statistically validated horizontal zones where price has shown respect – ideal for support/resistance, mean reversion, or breakout setups.
Auto Mode: Best for discovering hidden/non-obvious levels. Higher hit counts = stronger zones (expect reactions/retests).
Validation Bars: Increase (e.g., 20+) for stricter, higher-quality zones in trending markets; lower for more sensitive detection.
Min Distance: Higher % for fewer, separated zones; lower for denser grids.
Multi-Timeframe: Set target TF higher (e.g., Daily) for major structural levels on lower charts.
Supply Zones (Above Price): Potential resistance – shorts or take-profits.
Demand Zones (Below Price): Potential support – longs or stops below.
Confluence: Combine with volume, order blocks, or fibo for entries. Watch for multiple hits + confluence.
Manual Mode: Quick plotting of custom % (e.g., fibo retracements/extensions).
Fine-tune scan step smaller for precision (slower on large lookbacks) or larger for speed.
Disclaimer
This indicator is a technical analysis tool and should be used in conjunction with other forms of analysis. Past performance does not guarantee future results. Always use proper risk management.

Reactive Curvature Smoother Moving Average IndicatorSummary in one paragraph
RCS MA is a reactive curvature smoother for any liquid instrument on intraday through swing timeframes. It helps you act only when context strengthens by adapting its window length with a normalized path energy score and by smoothing with robust residual weights over a quadratic fit, then optionally blending a capped one step forecast. Add it to a clean chart and watch the single colored line. Shapes can shift while a bar forms and settle on close. For conservative use, judge on bar close.
Scope and intent
• Markets: major FX pairs, index futures, large cap equities, liquid crypto
• Timeframes: one minute to daily
• Purpose: reduce lag in trends while resisting chop and outliers
• Limits: indicator only, no orders
Originality and usefulness
• Novelty: adaptive window selection by minimizing normalized path energy with directionality bias, plus Huber weighted residuals and curvature aware penalty, finished with a mintick capped forecast blend
• Failure modes addressed: whipsaws from fixed length MAs and outlier spikes that pull means
• Testable: Inputs expose all components and optional diagnostics show chosen length, directionality, and energy
• Portable yardstick: forecast cap uses mintick to stay symbol aware
Method overview in plain language
Base measures
• Range span of the tested window and a path energy defined as the sum of squared price increments, normalized by span
Components
Adaptive window chooser: scans L between Min and Max using an energy over trend score and picks the lowest score
Robust smoother: fits a quadratic to the last L bars, computes residuals, applies Huber weights and an exponential residual penalty scaled down when curvature is high
Forecast blend: projects one step ahead from the quadratic, caps displacement by a multiple of mintick, blends by user weight
Fusion rule
• Final line equals robust mean plus optional capped forecast blend
Signal rule
• Visual bias only: color turns lime when close is above the line, red otherwise
What you will see on the chart
• One colored line that tightens in trends and relaxes in chop
• Optional debug overlays for core value, chosen L, directionality, and energy
• Optional last bar label with L, directionality, and energy
• Reminder: drawings can move intrabar and settle on close
Inputs with guidance
Setup
• Source: price series to smooth
Logic
• Min window l_min. Typical 5 to 21. Higher increases stability, adds lag
• Max window l_max. Typical 40 to 128. Higher reduces noise, adds lag ceiling
• Length step grid_step. Typical 1 to 8. Smaller is finer and heavier
• Trend bias trend_bias. Typical 0.50 to 0.80. Higher favors trend persistence
• Residual penalty lambda_base. Typical 0.8 to 2.0. Higher downweights large residuals more
• Huber threshold huber_k. Typical 1.5 to 3.0. Higher admits more outliers
• Curvature guard curv_guard. Typical 0.3 to 1.0. Higher reduces influence when curve is tight
• Forecast blend lead_blend. 0 disables. Typical 0.10 to 0.40
• Forecast cap lead_limit. Typical 1 to 5 minticks
• Show chosen L and metrics show_debug. Diagnostics toggle
Optional: enable diagnostics to see length, direction, and energy
Realism and responsible publication
• No performance claims. Past results never guarantee future outcomes
• Shapes can move while bars are open and settle on close
• Use on standard candles for analysis and combine with your own risk process
Honest limitations and failure modes
• Very quiet regimes can reduce energy contrast, length selection may hover near the bounds
• Gap heavy symbols can disrupt quadratic fit on the window edges
• Excessive forecast blend may look anticipatory; use low values and the cap

MSS BoxesWhat it is
The MSS Boxes indicator finds Market Structure Shifts (a decisive break in structure with displacement) and draws actionable zones (“boxes”) from the candle that caused the shift. Those boxes then act as mitigation / continuation areas for the rest of the session (or until they’re invalidated). It’s designed to be clean, non-repainting, and to work as a confluence layer with your SD and ATR Trigger grids.
What you’ll see on the chart
Green boxes for bullish MSS (demand); red boxes for bearish MSS (supply).
A compact label at the box origin (e.g., BOS↑ / BOS↓, or CHOCH) with the time-frame tag if you enable MTF.
Optional status badge on the right edge:
active (untouched), mitigated (tapped and respected), invalid (closed through), expired.
Clean behavior: once a box is printed it does not slide; coordinates are fixed to the confirmed signal candle.
Inputs (quick guide)
Swing detection
Swing length (for swing highs/lows), lookback for break validity, strict wick rule on/off.
Displacement factor (0 = off; typical 1.2–2.0).
Box recipe
Use full wick vs. use body for top/bottom.
Minimum box height (ticks), auto-merge overlapping (joins adjacent boxes of the same side).
Max lifetime (bars), session reset (e.g., clear on NY 18:00).
MTF alignment
Toggle H1 / M15 filters; choose “Plot only when aligned” vs “Plot all but alert only when aligned.”
Visuals
Fill/outline colors, opacity, label size, extend style (full-width vs to last bar).

Justice GameplanFibonacci Playbook: The Gridiron Indicator
This indicator doesn’t just mark levels—it’s your head coach, calling plays straight from the Fibonacci playbook to keep you ahead of the market’s defense. Here’s the game plan:
1. Scouting the Field:
It analyzes the last 180 bars like a seasoned scout, finding the *high-price MVP* and *low-price underdog* to set the boundaries of the game. This is your field—own it.
2. The Playbook:
- 50% Retracement (The Midfield Handoff):** The classic “let’s regroup and push forward” zone. Price often makes its comeback play here.
- 61.8% Retracement (The Sideline Route):** A tighter play—when price hits this zone, it’s like a running back juking defenders, setting up for a breakout move.
- 1.618 and 2.618 Extensions (Hail Mary Territory):** These are your end zones—when price reaches here, it’s all or nothing. You’re either scoring big or heading back to the locker room.
3. Game-Day Colors:
- Green Lines: Your offensive line—protecting your buy zones. Calm, calculated, and ready for a push.
- Red Lines: The defensive blitz—these levels warn, “You’ve hit resistance, time to adjust before you fumble.”
4. Signal Flags:
- Green Triangles (The Snap):The market signals a buy opportunity like a quarterback calling the perfect audible. It’s your chance to get in before the defense reacts.
- Red Triangles (The Sack): The market’s pressure is on—time to exit before the price gets tackled back to where it started.
5. End-to-End Game Vision:
The horizontal lines stretch across the chart like yard markers, setting the stage for price to march down the field—or get stopped cold by Fibonacci resistance.
This indicator is your ultimate play-caller, marking the critical zones where the market makes its big plays. Whether you’re running a steady offense or pulling off a last-minute Hail Mary, Fibonacci’s got your back. Time to suit up and dominate the trading field. 🏈

Custom Price Levels and AveragesThe "Custom Price Levels and Averages" indicator is a versatile tool designed for TradingView. It dynamically calculates and displays key price levels based on user-defined parameters such as distance percentages and position size. The indicator plots three ascending and descending price levels (A, B, C, X, Y, Z) around the last candle close on a specified timeframe. Additionally, it provides the average price for both upward and downward movements, considering the user's specified position size and increase factor. Traders can easily customize the visual appearance by adjusting colors for each plotted line. This indicator assists in identifying potential support and resistance levels and understanding the average price movements within a specified trading context.
Avoid SL hunting by acumulating your position with scaled orders.
Input Parameters:
inputTimeframe: Allows the user to select a specific timeframe (default: "D" for daily).
distancePercentageUp: Determines the percentage increase for ascending price levels (default: 1.5%).
distancePercentageDown: Determines the percentage decrease for descending price levels (default: 1.5%).
position: Specifies the position size in USD for calculating average prices (default: $100).
increaseFactor: Adjusts the increase in position size for each subsequent level (default: 1.5).
calcAvgPrice Function:
Parameters:
priceA, priceB, priceC: Ascending price levels.
priceX, priceY, priceZ: Descending price levels.
position: User-defined position size.
increaseFactor: User-defined increase factor.
Calculation:
Calculates the weighted average price for ascending (priceA, priceB, priceC) and descending (priceX, priceY, priceZ) levels.
Utilizes the specified position size and increase factor to determine the weighted average.
Plotting:
Price Calculations:
priceA, priceB, priceC: Derived by applying percentage increases to the last candle's close.
priceX, priceY, priceZ: Derived by applying percentage decreases to the last candle's close.
avgPriceUp, avgPriceDown: Computed using the calcAvgPrice function for ascending and descending levels, respectively.
Plotting Colors:
User-customizable through input parameters (colorPriceA, colorPriceB, colorPriceC, colorAvgPriceUp, colorPriceX, colorPriceY, colorPriceZ, colorAvgPriceDown).
Styling:
All lines are plotted with minimal thickness (linewidth=1) for a clean visualization.
Overall, the indicator empowers traders to analyze potential support and resistance levels and understand average price movements based on their specified parameters. The flexibility of color customization adds a layer of personalization to suit individual preferences.
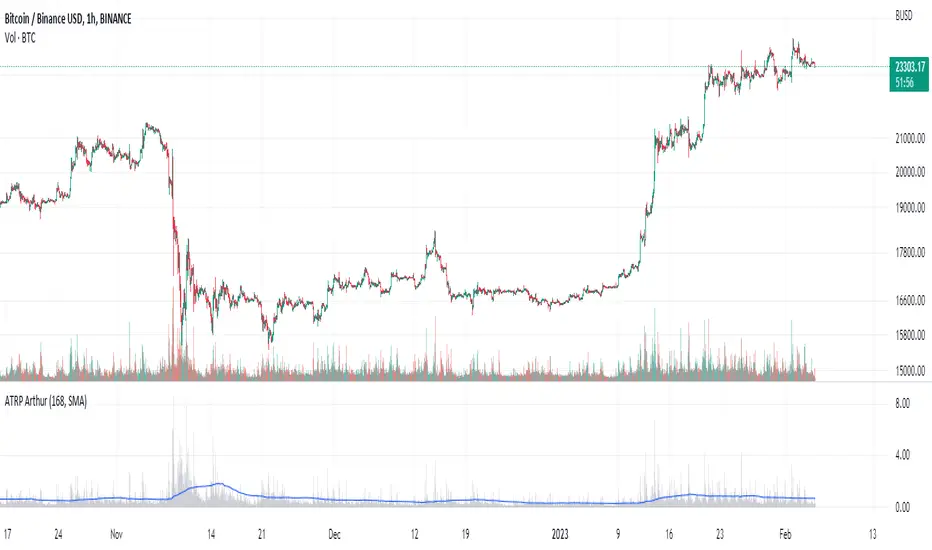
Average True Range PercentWhen writing the Quickfingers Luc base scanner (Marvin) script, I wanted a measure of volatility that would be comparable between charts. The traditional Average True Range (ATR) indicator calculates a discrete number providing the average true range of that chart for a specified number of periods. The ATR is not comparable across different price charts.
Average True Range Percent (ATRP) measures the true range for the period, converts it to a percentage using the average of the period's range ((high + low) / 2) and then smooths the percentage. The ATRP provides a measure of volatility that is comparable between charts showing their relative volatility.
Enjoy.
Up & Down Trend Trading Strategy - BNB/USDT 15minThis strategy will focus on up trend trading and down trend trading based on several indicators such as;
for up trend
1. SAR indicator
2. Super trend indicator
3. Simple moving average for the period of 100
down trend
1. RSI Indicator
2. Money flow index
3. Relative volatility index
4. Balance of powder

Bloomberg Terminal//@version=6
indicator("Bloomberg Terminal ", shorttitle="QUANTLABS", overlay=true, max_lines_count=500, max_labels_count=500)
// =============================================================================
// I. SETTINGS & THEME (ULTIMATE FIDELITY)
// =============================================================================
group_layout = "Terminal Layout"
sz_text = input.string(size.large, "Font Size", options= , group=group_layout)
pos_main = input.string(position.top_right, "Position", options= , group=group_layout)
group_colors = "Terminal Colors"
c_bg_main = color.black
c_bg_alt = color.rgb(15, 15, 15) // Subtle Zebra
c_amber = input.color(#ffb300, "Terminal Amber", group=group_colors)
c_header = input.color(#00294d, "Bloomberg Blue", group=group_colors)
c_bull = input.color(#00e676, " Terminal Green", group=group_colors)
c_bear = input.color(#ff1744, "Terminal Red", group=group_colors)
c_neutral = input.color(#b0bec5, "Terminal Gray", group=group_colors)
c_white = color.white
// =============================================================================
// II. DATA ENGINE & SPARKLINE LOGIC
// =============================================================================
type asset_data
float price
float chg
float rvol
bool is_up
float c1
float c2
float c3
f_get_stats(_sym) =>
= request.security(_sym, timeframe.period, [close, open, volume, ta.sma(volume, 20), close , close ], ignore_invalid_symbol=true)
_chg = (_c - _o) / _o * 100
asset_data.new(_c, _chg, _v / (_avg_v + 0.0001), _chg >= 0, _c, _c1, _c2)
// Market Data
d_spy = f_get_stats("AMEX:SPY")
d_qqq = f_get_stats("NASDAQ:QQQ")
d_iwm = f_get_stats("AMEX:IWM")
d_btc = f_get_stats("BINANCE:BTCUSDT")
d_eth = f_get_stats("BINANCE:ETHUSDT")
d_gold = f_get_stats("TVC:GOLD")
d_oil = f_get_stats("TVC:USOIL")
d_dxy = f_get_stats("TVC:DXY")
d_us10y = f_get_stats("TVC:US10Y")
d_vix = f_get_stats("CBOE:VIX")
// Active Ticker Intelligence
rsi = ta.rsi(close, 14)
= ta.supertrend(3, 10)
avg_vol = ta.sma(volume, 20)
rvol = volume / avg_vol
atr = ta.atr(14)
// Sparkline Generator (Text Based)
// We use simple block characters to simulate a "Trend"
// logic: if Price > Open -> Bullish Block, else Bearish Block.
// Ideally we'd have history but keeping it simple for now.
// Sparkline Generator (3-Bar Mini Chart)
// Sparkline char generator
f_spark_char(_p, _min, _rng) =>
_rel = (_p - _min) / (_rng == 0 ? 1 : _rng)
_rel < 0.33 ? " " : (_rel < 0.66 ? "▃" : "▇")
// Sparkline Generator (3-Bar Mini Chart)
f_spark(_d) =>
// Simple logic: Normalize 3 prices to choose low/med/high blocks
_min = math.min(_d.c1, math.min(_d.c2, _d.c3))
_max = math.max(_d.c1, math.max(_d.c2, _d.c3))
_rng = _max - _min
f_spark_char(_d.c2, _min, _rng) + f_spark_char(_d.c1, _min, _rng) + f_spark_char(_d.c3, _min, _rng)
// =============================================================================
// III. UI RENDERER (TEXT BASED TERMINAL)
// =============================================================================
// Table with thick outer frame but NO inner grid lines
var table term = table.new(pos_main, 4, 30, border_width=0, frame_width=2, frame_color=color.rgb(40,40,40), bgcolor=c_bg_main)
f_txt(_t, _c, _r, _txt, _col, _align, _bg) =>
table.cell(_t, _c, _r, _txt, text_color=_col, text_halign=_align, text_size=sz_text, bgcolor=_bg, text_font_family=font.family_monospace)
// Helper to print a row
// Helper to print a row with Zebra Striping
f_row(_row_idx, _name, _d) =>
_c_p = _d.is_up ? c_bull : c_bear
_bg_row = _row_idx % 2 == 0 ? c_bg_main : c_bg_alt // Zebra Logic
// Col 0: Ticker
f_txt(term, 0, _row_idx, _name, c_amber, text.align_left, _bg_row)
// Col 1: Price
f_txt(term, 1, _row_idx, str.tostring(_d.price, "#.##"), c_white, text.align_right, _bg_row)
// Col 2: Chg%
f_txt(term, 2, _row_idx, str.tostring(_d.chg, "+#.##") + "%", _c_p, text.align_right, _bg_row)
// Col 3: Spark (Simulated Trend)
f_txt(term, 3, _row_idx, f_spark(_d), _c_p, text.align_center, _bg_row)
if barstate.islast
// --- ROW 0: TOP MENU (F-Keys) - BLACK BG ---
_menu = " 1 2 3 4 5 6 7 8 9"
table.cell(term, 0, 0, _menu, text_color=c_amber, bgcolor=c_bg_main, text_halign=text.align_left, text_size=size.tiny, text_font_family=font.family_monospace)
table.merge_cells(term, 0, 0, 3, 0)
// --- ROW 1: BRANDING HEADER - BLACK BG ---
_time = str.format("{0,date,HH:mm:ss} EST", time)
// Simulated "BLOOMBERG" logo text + Time
f_txt(term, 0, 1, "QUANTLABS PROFESSIONAL | " + _time, c_amber, text.align_left, c_bg_main)
table.merge_cells(term, 0, 1, 3, 1)
// --- ROW 2: PANEL HEADERS - BLUE BG ---
f_txt(term, 0, 2, "SECURITY", c_white, text.align_left, c_header)
f_txt(term, 1, 2, "LAST PRICE", c_white, text.align_right, c_header)
f_txt(term, 2, 2, "NET CHANGE", c_white, text.align_right, c_header)
f_txt(term, 3, 2, "TREND", c_white, text.align_center, c_header)
// --- DATA ROWS (WATCHLIST) ---
f_row(3, "SPX Index", d_spy)
f_row(4, "NDX Index", d_qqq)
f_row(5, "RTY Index", d_iwm)
f_row(6, "VIX Index", d_vix)
// Separator
f_txt(term, 0, 7, ">> FX / CRYPTO", c_amber, text.align_left, color.new(c_header, 50))
table.merge_cells(term, 0, 7, 3, 7)
f_row(8, "BTCUSD Curncy", d_btc)
f_row(9, "ETHUSD Curncy", d_eth)
f_row(10, "DXY Curncy", d_dxy)
f_row(11, "XAU Curncy", d_gold)
// --- INTELLIGENCE SECTION ---
f_txt(term, 0, 12, ">> ACTIVE TICKER ANALYTICS", c_amber, text.align_left, color.new(c_header, 50))
table.merge_cells(term, 0, 12, 3, 12)
// Active Stats Row 1
f_txt(term, 0, 13, "RSI(14): " + str.tostring(rsi, "#.0"), c_white, text.align_left, c_bg_main)
c_rsi = rsi > 70 ? c_bear : (rsi < 30 ? c_bull : c_white)
f_txt(term, 1, 13, rsi > 70 ? "OVERBOUGHT" : (rsi < 30 ? "OVERSOLD" : "NEUTRAL"), c_rsi, text.align_right, c_bg_main)
// Active Stats Row 2
f_txt(term, 0, 14, "REL VOL(20): " + str.tostring(rvol, "#.1") + "x", c_white, text.align_left, c_bg_main)
c_vol = rvol > 2.0 ? c_amber : c_neutral
f_txt(term, 1, 14, rvol > 2.0 ? "HIGH ADVISE" : "NORMAL", c_vol, text.align_right, c_bg_main)
// Active Stats Row 3 (Merged)
_tr_txt = close > st_val ? "BULLISH TREND" : "BEARISH TREND"
c_tr = close > st_val ? c_bull : c_bear
f_txt(term, 0, 15, _tr_txt, c_tr, text.align_center, c_bg_main)
table.merge_cells(term, 0, 15, 3, 15)
// --- COMMAND LINE ---
// Blinking cursor effect
_blink = int(timenow / 500) % 2 == 0 ? "_" : " "
_cmd = "COMMAND: MONITOR " + syminfo.ticker + " " + _blink
f_txt(term, 0, 17, _cmd, c_amber, text.align_left, color.new(#222222,0))
table.merge_cells(term, 0, 17, 3, 17)
// --- NEWS TICKER (Multi-Line) ---
// We'll simulate a log by checking conditions
_msg1 = "SYSTEM READY..."
_msg2 = "MONITORING MARKETS..."
_msg3 = "NO ACTIVE ALERTS"
// Priority Alert Overwrite
if rvol > 3.0
_msg3 := ">> WHALE ALERT: VOL SPIKE <<"
else if rsi > 75
_msg3 := ">> EXTREME OB DETECTED <<"
else if rsi < 25
_msg3 := ">> EXTREME OS DETECTED <<"
// Render 3 lines of logs
f_txt(term, 0, 18, "LOG : " + _msg3, _msg3 == "NO ACTIVE ALERTS" ? c_neutral : c_amber, text.align_left, c_bg_main)
table.merge_cells(term, 0, 18, 3, 18)
f_txt(term, 0, 19, "LOG : " + _msg2, c_neutral, text.align_left, c_bg_main)
table.merge_cells(term, 0, 19, 3, 19)
f_txt(term, 0, 20, "LOG : " + _msg1, c_neutral, text.align_left, c_bg_main)
table.merge_cells(term, 0, 20, 3, 20)

Trend Strength Matrix [JOAT]
Trend Strength Matrix — Multi-Timeframe Trend Health Dashboard
Trend Strength Matrix provides a comprehensive view of trend health across multiple timeframes and indicators. It combines RSI, MACD, ADX, and moving average alignment into a single heatmap-style dashboard with an overall strength score—giving you a complete picture of trend quality at a glance.
What Makes This Indicator Unique
Unlike single-indicator trend tools, Trend Strength Matrix:
Analyzes four different indicators simultaneously (RSI, MACD, ADX, MA)
Evaluates up to four timeframes at once for multi-timeframe confluence
Presents everything in an intuitive color-coded heatmap
Calculates a weighted composite score for overall trend assessment
Marks trend shifts directly on the chart
What This Indicator Does
Calculates trend scores from four different indicators
Analyzes up to four timeframes simultaneously
Creates a color-coded heatmap showing strength across all components
Generates a weighted composite score for overall trend assessment
Marks bullish and bearish trend shifts on the chart
Displays a trend-following moving average on the price chart
Component Scores Explained
Each indicator contributes a normalized score from -1 (strongly bearish) to +1 (strongly bullish):
RSI Score — (RSI - 50) / 50
- RSI of 70 = +0.4 (bullish)
- RSI of 30 = -0.4 (bearish)
- RSI of 50 = 0 (neutral)
MACD Score — MACD line normalized by its standard deviation
- Positive MACD = positive score
- Negative MACD = negative score
- Magnitude reflects strength
ADX Score — ADX strength multiplied by DI direction
- High ADX with DI+ > DI- = strong positive
- High ADX with DI- > DI+ = strong negative
- Low ADX = weak score regardless of direction
MA Score — Price position relative to moving average
- Price above MA = positive
- Price below MA = negative
- Distance from MA affects magnitude
Multi-Timeframe Analysis
The indicator analyzes multiple timeframes with weighted importance:
// Weighted MTF composite score
mtfScore = composite1 * 0.40 + // Current TF (40% weight)
composite2 * 0.25 + // TF2, e.g., 1H (25% weight)
composite3 * 0.20 + // TF3, e.g., 4H (20% weight)
composite4 * 0.15 // TF4, e.g., Daily (15% weight)
Higher timeframes provide context and trend direction, while lower timeframes provide timing and entry signals.
Dashboard Layout
The matrix displays a grid with:
Rows — Each timeframe (current, TF2, TF3, TF4)
Columns — Each indicator (RSI, MACD, ADX, MA, Score)
Cell Colors :
- Bright green: Score > 0.5 (strongly bullish)
- Faded green: Score 0.2 to 0.5 (moderately bullish)
- Gray: Score -0.2 to 0.2 (neutral)
- Faded red: Score -0.5 to -0.2 (moderately bearish)
- Bright red: Score < -0.5 (strongly bearish)
Overall Row — Shows weighted composite with trend classification
Trend Classifications
Based on the overall MTF score:
STRONG BULL — Score > 50%
BULLISH — Score 20% to 50%
NEUTRAL — Score -20% to 20%
BEARISH — Score -50% to -20%
STRONG BEAR — Score < -50%
Visual Features
Trend Moving Average — Optional MA line on price chart colored by trend direction
Trend Background — Subtle background tint showing overall trend direction
Trend Shift Labels — "BULL" and "BEAR" labels when trend direction changes
Heatmap Dashboard — Color-coded matrix showing all components and timeframes
Color Scheme
Bullish Color — Default: #00E676 (bright green)
Bearish Color — Default: #FF5252 (red)
Neutral Color — Default: #9E9E9E (gray)
Dashboard Header — #2962FF (blue)
Inputs Overview
Calculation Settings:
RSI Length — Period for RSI (default: 14, range: 5-30)
MACD Fast — Fast EMA period (default: 12, range: 5-30)
MACD Slow — Slow EMA period (default: 26, range: 10-50)
MACD Signal — Signal line period (default: 9, range: 3-20)
ADX Length — Period for ADX/DI (default: 14, range: 5-30)
MA Length — Period for trend MA (default: 50, range: 20-200)
Multi-Timeframe:
Enable Multi-Timeframe — Toggle MTF analysis (default: on)
Timeframe 2 — Second timeframe (default: 60 = 1 hour)
Timeframe 3 — Third timeframe (default: 240 = 4 hours)
Timeframe 4 — Fourth timeframe (default: D = Daily)
Visual Settings:
Bullish/Bearish/Neutral Colors — Customizable color scheme
Show Trend MA — Toggle moving average on price chart
Show Dashboard — Toggle the heatmap matrix
Dashboard Position — Choose corner placement (Top Right, Top Left, Bottom Right, Bottom Left)
How to Use It
For Trend Confirmation:
All green cells = strong bullish alignment across indicators and timeframes
All red cells = strong bearish alignment
Mixed colors = consolidation or transition period
Wait for alignment before entering trend trades
For Multi-Timeframe Analysis:
Higher timeframes (TF3, TF4) show the "big picture" trend
Lower timeframes (current, TF2) show immediate momentum
Best signals occur when all timeframes align
Divergence between timeframes suggests caution
For Entry Timing:
Enter when trend shifts from neutral to bullish/bearish
Look for "BULL" or "BEAR" labels on chart
Confirm with dashboard showing alignment
Use the trend MA as a trailing stop reference
Alerts Available
TSM Bullish Shift — Trend shifted from neutral/bearish to bullish
TSM Bearish Shift — Trend shifted from neutral/bullish to bearish
TSM Strong Bull — Score crossed above 50% (strong bullish)
TSM Strong Bear — Score crossed below -50% (strong bearish)
Best Practices
Wait for multiple timeframes to align before entering
Strong trends show green (or red) across all cells
Mixed colors suggest waiting for clarity
Use the overall score percentage to gauge conviction
— Made with passion by officialjackofalltrades

Laughing Grid Radar
// ═══ Row 9: 底部装饰线 ═══
table.cell(panel, 0, 9, "▄▄▄▄▄▄▄▄▄▄▄▄▄▄▄▄▄▄▄", bgcolor=c_void, text_color=c_neon_pink, text_halign=text.align_center, text_size=size.tiny)
table.merge_cells(panel, 0, 9, 1, 9)

High-Probability Scalper (Market Open)Market open is where volatility is real, spreads are tight, and momentum shows itself early. This scalping strategy is built specifically to operate during that window, filtering out low-quality signals that usually appear later in the session.
Instead of trading all day, the logic is restricted to the first 90 minutes after market open, where continuation moves and fast pullbacks are more reliable.
What This Strategy Does
This script looks for short-term momentum alignment using:
Fast vs slow EMA structure
RSI confirmation to avoid chasing extremes
ATR-based risk control
Session-based filtering to trade only when volume matters
It’s designed for intraday scalping, not swing trading.
Core Trading Logic
1. Market Open Filter
Trades are allowed only between 09:30 – 11:00 exchange time.
This avoids low-liquidity chop and focuses on the period where most breakouts and reversals form.
2. Trend Confirmation
Bullish bias: 9 EMA crosses above 21 EMA
Bearish bias: 9 EMA crosses below 21 EMA
This keeps trades aligned with short-term direction instead of random entries.
3. Momentum Check (RSI)
RSI is used as a quality filter, not as an overbought/oversold signal.
Long trades only when RSI is strong but not extended
Short trades only when RSI shows weakness without exhaustion
This removes late entries and reduces whipsaws.
Entries & Exits
Entries
Executed only on confirmed candles
No intrabar repainting
One position at a time
Risk Management
Stop-loss based on ATR
Take-profit calculated using a fixed risk–reward ratio
Same structure for both long and short trades
This keeps risk consistent across different symbols and volatility levels.
Why This Strategy Works Better at Market Open
Volume is highest
False breakouts are fewer
EMA crosses have follow-through
RSI behaves more cleanly
By not trading all day, the strategy avoids most of the noise that kills scalpers.
Best Use Cases
Index futures
High-liquidity stocks
Major crypto pairs during active sessions
1m to 5m timeframes
What This Strategy Is NOT
Not a martingale
Not grid-based
Not designed for ranging markets
Not a “set and forget” system
It’s a controlled scalping template meant for disciplined execution.
How to Use It Properly
Test on multiple symbols
Adjust ATR length for volatility
Tune RSI ranges per market
Always forward-test before live alerts
Final Note
This strategy focuses on structure, timing, and risk, not indicator stacking.
If you trade the open, this gives you a clear framework instead of emotional entries.
If you want:
Alerts
Session customization
News filters
Partial exits
You can extend this logic without breaking the core system.

SMA Crossover Strategy with Monte Carlo TunerCore logic
• Two signals:
• FAST SMA
• SLOW SMA
• Trade rule:
• FAST > SLOW → long
• FAST < SLOW → short
• Nothing else. No indicators stacked on top.
⸻
Two operating modes
1) Deterministic mode (baseline)
• MC = OFF
• You choose (fast, slow) explicitly (default 8/34)
• Behavior is stationary and repeatable
This is your control experiment.
⸻
2) Monte Carlo mode (adaptive discovery)
• MC = ON
• The script:
• Samples (fast, slow) pairs randomly from bounded integer ranges
• Simulates trades for each pair in parallel
• Tracks (gross profit, gross loss, trade count)
• Computes PF = GP / GL
• Promotes best-so-far online
Key point:
This is not grid search. It’s stochastic sampling with early stopping with time control (default 35 s)

Druckenmiller Alpha-Physics [Dual-Core]Stop trading in a vacuum. Start trading like a Macro Fund Manager.
The Druckenmiller Alpha-Physics engine is a professional-grade dashboard designed to solve the single biggest problem in trading: Context. Most traders buy a "dip" only to realize it was a crash, or sell a "rip" only to watch it fly higher.
This tool solves this by synthesizing Market Physics (Velocity & Acceleration) across two distinct timeframes (Weekly Macro & Daily Tactical) and filtering every signal through a Global Liquidity Shield.
It is engineered based on the trading philosophy of Stanley Druckenmiller: “I don’t care about the news. I care about the liquidity and the acceleration of the trend.”
How It Works (The Dual-Core Logic)
The engine runs 27 distinct sector assets through a dual-loop physics processor:
The Macro Core (Weekly): Analyzes the 18-month trend. Is the "Tide" coming in or going out?
The Tactical Core (Daily): Analyzes the 3-day price action. Is the "Wave" crashing or rising?
It then synthesizes these two data streams into a single Action Signal.
The Signals (How to Read)
The dashboard tells you exactly what to do based on the conflict between Macro and Micro:
🟢 BUY PULLBACK (The "Alpha" Trade):
Logic: Macro is RIPPING (Bullish) + Tactical is TOP/CRASH (Bearish).
Meaning: You are buying a long-term leader on a short-term discount.
🔵 STINK BID (The "Bottom" Trade):
Logic: Macro is TURNING UP + Tactical is CRASHING.
Meaning: The physics have shifted positive, but price is still dumping. Place limit orders -5% lower to catch the panic bottom.
🔴 SELL RIP (The "Trap" Trade):
Logic: Macro is TOPPING (Bearish) + Tactical is RIPPING (Bullish).
Meaning: The long-term trend is dead. Sell into this short-term rally immediately.
⚪ HOLD: All systems go. Sit on your hands and ride the trend.
The "Invisible" Liquidity Shield
The most dangerous time to buy is when the Fed is draining liquidity. This script monitors the 10-Year Treasury Yield (TNX) and VIX in real-time.
If Liquidity is OK (Navy Header): Signals are valid. Green means Go.
If Liquidity is TIGHT (Maroon Header): The entire dashboard enters "Defense Mode." Buy signals are tinted Maroon to warn you that you are fighting the Fed.
Included Universe (The "Ultimate" List)
Includes 27 institutional-grade tickers covering every corner of the market:
Growth: XLK, SMH, IGV, GRID, QTUM
Cyclical: JETS, XHB, KRE, XLI, XLF
Commodities: GDX, URA, XLE, XLB, TAN
Risk/Safety: IBIT, TLT, XLV, XLP
Note: This script uses dynamic request handling optimized for Pine Script v6. It is designed for Premium/Ultimate plans due to the high volume of data processing (54+ simultaneous streams).

Miela Labs | John Dee's Watchtower [257-463]Bridging the gap between 16th-century esoteric mathematics and modern algorithmic trading.
The Enochian Watchtower is not merely a trend indicator; it is a computational artifact developed by Miela Labs LLC. This script translates Dr. John Dee’s "Great Table of the Watchtowers" and the "Sigil Dei Aemeth" into actionable financial data points.
Using our proprietary Occultator V2.0 Engine, we have derived specific mathematical constants that resonate with the current market structure.
🏛️ The Algorithmic Logic
This indicator utilizes three sacred numbers to construct a "Future Vision" of the market:
1. The Axis Mundi (Vector 257): derived from Fermat Primes and John Dee’s Grid coordinates. This Weighted Moving Average (WMA) acts as the spinal cord of the trend.
2. The Gates (Cipher 463): A prime number derived from the "Galethog" cipher stride. These bands define the absolute volatility limits (Heaven & Earth Gates).
3. Future Vision (Offset 21): Utilizing Fibonacci time sequences, the indicator projects Support and Resistance levels 21 bars into the future, allowing traders to anticipate market movements before they occur.
⚡ How to Use
• The Trend: If price is above the Purple Axis (257), the market is in a bullish phase.
• The Entry: Look for "L" (Long) and "S" (Short) signals. These are confirmed when the signal path crosses the Axis.
• The Future: Watch the projected lines on the right side of the chart to identify upcoming resistance zones.
About Miela Labs
Miela Labs is a Technomancy Research Institute based in McKinney, Texas. We specialize in building open-source esoteric trading tools and the Magic Programming Language (MPL).
🌐 Official Hub: Visit Miela Labs
💻 Source Code & Research: GitHub Repository
Disclaimer: This tool is for educational and research purposes only. It demonstrates the application of esoteric mathematics in financial analysis. Trade responsibly.


IDLP – Intraday Daily Levels Pro [FXSMARTLAB]🔥 IDLP – Intraday Daily Levels Pro
IDLP – Intraday Daily Levels Pro is a precision toolkit for intraday traders who rely on objective daily structure instead of repainting indicators and noisy signals.
Every level plotted by IDLP is derived from one simple rule:
Today’s trading decisions must be based on completed market data only.
That means:
✅ No use of the current day’s unfinished data for levels
✅ No lookahead
✅ No hidden repaint behavior
IDLP reconstructs the previous trading day from the intraday chart and then projects that structure forward onto the current session, giving you a stable, institutional-style intraday map.
🧱 1. Previous Daily Levels (Core Structure)
IDLP extracts and displays the full previous daily structure, which you can toggle on/off individually via the inputs:
Previous Daily High (PDH)
Previous Daily Low (PDL)
Previous Daily Open
Previous Daily Close,
Previous Daily Mid (50% of the range)
Previous Daily Q1 (25% of the range)
Previous Daily Q3 (75% of the range)
All of these come from the day that just closed and are then locked for the entire current session.
What these levels tell you:
PDH / PDL – true extremes of yesterday’s price action (liquidity zones, breakout/reversal points).
Previous Daily Open / Close – how the market positioned itself between session start and end
Mid (50%) – equilibrium level of the previous day’s auction.
Q1 / Q3 (25% / 75%) internal structure of the previous day’s range, dividing it into four equal zones and helping you see if price is trading in the lower, middle, or upper quarter of yesterday’s range.
All these levels are non-repaint: once the day is completed, they are fixed and never change when you scroll, replay, or backtest.
🎯 2. Previous Day Pivot System (P, S1, S2, R1, R2)
IDLP includes a classic floor-trader pivot grid, but critically:
It is calculated only from the previous day’s high, low, and close.
So for the current session, the following are fixed:
Pivot P – central reference level of the previous day.
Support 1 (S1) and Support 2 (S2)
Resistance 1 (R1) and Resistance 2 (R2)
These levels are widely used by institutional desks and algos to structure:
mean-reversion plays, breakout zones, intraday targets, and risk placement.
Everything in this section is non-repaint because it only uses the previous day’s fully closed OHLC.
📏 3. 1-Day ADR Bands Around Previous Daily Open
Instead of a multi-day ADR, IDLP uses a pure 1-Day ADR logic:
ADR = Range of the previous day
ADR = PDH − PDL
From that, IDLP builds two clean bands centered around the previous daily Open:
ADR Upper Band = Previous Day Open + (ADR × Multiplier)
ADR Lower Band = Previous Day Open − (ADR × Multiplier)
The multiplier is user-controlled in the inputs:
ADR Multiplier (default: 0.8)
This lets you choose how “tight” or “wide” you want the ADR envelope to be around the previous day’s open.
Typical use cases:
Identify realistic intraday extension targets, Spot exhaustion moves beyond ADR bands, Frame reversals after reaching volatility extremes, Align trades with or against volatility expansion
Again, since ADR is calculated only from the completed previous day, these bands are totally non-repaint during the current session.
🔒 4. True Non-Repaint Architecture
The internal logic of IDLP is built to guarantee non-repaint behavior:
It reconstructs each day using time("D") and tracks:
dayOpen, dayHigh, dayLow, dayClose for the current day
prevDayOpen, prevDayHigh, prevDayLow, prevDayClose for the previous day
At the moment a new day starts:
The “current day” gets “frozen” into prevDay*
These prevDay* values then drive: Previous Daily Levels, Pivots, ADR.
During the current day:
All these “previous day” values stay fixed, no matter what happens.
They do not move in real time, they do not shift in replay.
This means:
What you see in the past is exactly what you would have seen live.
No fake backtests.
No illusion of perfection from repainting behavior.
🎯 5. Designed For Intraday Traders
IDLP – Intraday Daily Levels Pro is made for:
- Day traders and scalpers
- Index and FX traders
- Prop firm challenge trading
- Traders using ICT/SMC-style levels, liquidity, and range logic
- Anyone who wants a clean, institutional-style daily framework without noise
You get:
Previous Day OHLC
Mid / Q1 / Q3 of the previous range
Previous-Day Pivots (P, S1, S2, R1, R2)
1-Day ADR Bands around Previous Day Open
All calculated only from closed data, updated once per day, and then locked.

ShooterViz Lazy Trader EMA SystemShooterViz Lazy Trader EMA System - Complete User Guide
What This Script Does
This is a position scaling indicator that tells you exactly when to enter, add to, and exit trades using a simplified 5-EMA system. It removes the guesswork and decision fatigue from trading by giving you clear visual signals.
The Core Concept
3 entry signals that build your position from 20% → 50% → 100%
2 exit signals that scale you out at 50% → 50% (complete exit)
1 higher timeframe filter that keeps you on the right side of the trend
No Fibonacci calculations, no RSI divergence, no multi-indicator confusion. Just EMAs and price action.
What You'll See On Your Chart
1. Colored EMA Lines
Blue Lines (Entry Zone):
3 EMA (lightest blue) - Early reversal detector
5 EMA (darker blue) - Confirmation line
Green Lines (Add Zone):
21 EMA (bright green) - First add location
34 EMA (lighter green) - Final add location
Red Lines (Exit Zone):
89 EMA (lighter red) - First exit trigger
144 EMA (darker red) - Final exit trigger
Orange Lines (Hyper Frame - optional):
Hyper 21 EMA (from higher timeframe) - Trend direction
Hyper 34 EMA (from higher timeframe) - Bias confirmation
2. Triangle Signals
Green Triangles (Below Price) = BUY/ADD:
Lime triangle with "20%" = Entry 1: Price reclaimed 3→5 EMA (starter position)
Green triangle with "30%" = Entry 2: Price bounced off 21 EMA (first add)
Teal triangle with "50%" = Entry 3: Price broke out from 34 EMA compression (final add)
Red Triangles (Above Price) = SELL:
Orange triangle with "50% OFF" = Exit 1: Price broke below 89 EMA (take half off)
Red triangle with "EXIT ALL" = Exit 2: Price broke below 144 EMA (close remaining position)
3. Background Color (Trend Bias)
Light green background = Hyper frame EMAs trending up (bias LONG)
Light red background = Hyper frame EMAs trending down (bias SHORT)
Gray background = Neutral/choppy (be cautious)
4. Info Table (Top Right Corner)
A live status dashboard showing:
Which entry signals are currently active (✓ or —)
Which exit signals are currently active (⚠ or ⛔)
Current hyper frame bias (🟢 LONG / 🔴 SHORT / ⚪ NEUTRAL)
Which timeframe you're using for hyper frame filtering
How to Install and Set Up
Step 1: Add the Script to TradingView
Open TradingView
Click "Pine Editor" at the bottom of the screen
Copy the entire script code
Paste it into the Pine Editor
Click "Add to Chart"
Step 2: Configure Your Settings
Click the gear icon ⚙️ next to "LazyEMA" in your indicators list.
Critical Settings to Configure:
Hyper Frame Selection (Most Important!)
Location: "Hyper Frame (Pick ONE)" section
Setting: "Timeframe"
What to choose:
Trading 15min or 1H charts? → Use "240" (4-hour)
Trading 4H or Daily charts? → Use "D" (Daily)
Trading Daily or Weekly charts? → Use "W" (Weekly)
Why this matters: This filter keeps you aligned with the bigger trend. Only take longs when this timeframe is green, shorts when it's red.
MA Type (Optional, default is fine)
Location: "MA Config" section
Default: EMA (recommended)
Options: EMA, SMA, WMA, HMA, RMA, VWMA
Most traders should stick with EMA
Visual Toggles (Customize your view)
Entry Zone: Turn individual EMAs on/off (3, 5, 21, 34)
Exit Zone: Turn individual EMAs on/off (89, 144)
Hyper Frame: Toggle the higher timeframe EMAs on/off
Step 3: Clean Up Your Chart
Turn OFF these if visible:
Volume bars (they clutter the view)
Any other indicators you have loaded
Grid lines (optional, but cleaner)
Keep ONLY:
Price candles
Your ShooterViz Lazy Trader EMA System
Maybe support/resistance levels if you manually draw them
How to Trade With This Script
The Basic Workflow
Before the Market Opens:
Check the background color and info table bias
Green background? Look for LONG setups only
Red background? Look for SHORT setups only
Gray background? Stay flat or trade small
During the Trading Session:
LONGS (When hyper frame is bullish):
Wait for Entry 1 signal:
Lime triangle appears with "20%"
Price has reclaimed the 5 EMA after dipping to 3 EMA
Action: Enter 20% of your intended position
Stop loss: Place below the 5 EMA or recent swing low
Wait for Entry 2 signal:
Green triangle appears with "30%"
Price pulled back to 21 EMA and bounced
Action: Add 30% more (you're now at 50% total)
Move stop: Trail it up to below 21 EMA
Wait for Entry 3 signal:
Teal triangle appears with "50%"
Price compressed at 34 EMA and broke out
Action: Add final 50% (you're now 100% loaded)
Move stop: Trail it up to below 34 EMA
Wait for Exit 1 signal:
Orange triangle appears with "50% OFF"
Price broke below 89 EMA
Action: Exit 50% of your position immediately
Move stop on rest: Trail to 89 EMA or lock in profits
Wait for Exit 2 signal:
Red triangle appears with "EXIT ALL"
Price broke below 144 EMA
Action: Exit remaining 50% (you're now flat)
Or: Stop gets hit at 89 EMA (same result)
SHORTS (When hyper frame is bearish):
Same process, but inverted
Triangles appear above price instead of below
Look for breakdowns below EMAs instead of bounces off them
Exit when price reclaims 89 and 144 EMAs
Real-World Example Walkthrough
Setup: Trading ES (S&P 500 Futures) on 1H Chart
Chart Configuration:
Timeframe: 1 Hour
Hyper Frame: 240 (4-hour)
Ticker: ES
Pre-Market Check:
Background is light green
Info table shows "🟢 LONG" for Hyper Bias
Decision: Only look for long entries today
9:30 AM - Market Opens
Price dips and touches 3 EMA
Watch for: Reclaim of 5 EMA
9:45 AM - Entry 1 Triggers
Lime triangle appears below bar
Price closed above 5 EMA at $4,550
Action taken:
Enter long 20% position (2 contracts if targeting 10 total)
Stop loss at $4,545 (below 5 EMA)
Risk: $10 per contract × 2 = $20 risk
10:30 AM - Entry 2 Triggers
Price rallied to $4,565, pulls back
Green triangle appears at 21 EMA ($4,555)
Action taken:
Add 30% (3 more contracts, now have 5 total)
Move stop to $4,550 (below 21 EMA)
Current P/L: +$25 ($5 gain on original 2 contracts, break-even on new 3)
11:15 AM - Entry 3 Triggers
Price consolidates at 34 EMA around $4,560
Teal triangle appears as price breaks to $4,568
Action taken:
Add final 50% (5 more contracts, now have 10 total)
Move stop to $4,555 (below 34 EMA)
Current P/L: +$70
1:00 PM - Price Extends
Price rallies to $4,595 (on track)
89 EMA is at $4,575
No action yet, let it run
2:15 PM - Exit 1 Triggers
Price pulls back from $4,600
Orange triangle appears as price breaks below 89 EMA at $4,580
Action taken:
Exit 50% (5 contracts closed at $4,580)
Keep 5 contracts with stop at 89 EMA ($4,575)
Banked: +$150 average gain on closed 5 contracts
2:45 PM - Exit 2 Triggers
Price continues down
Red triangle appears as price breaks 144 EMA at $4,570
Action taken:
Exit remaining 5 contracts at $4,570
Banked: +$100 on remaining 5 contracts
Final Results:
Total gain: $250 on the trade
Initial risk: $50 (if stopped out at Entry 1)
Risk/Reward: 5:1
Time in trade: ~5 hours
Common Questions
"What if I miss Entry 1? Can I still take Entry 2?"
Yes! Each entry is independent. If you miss the 3→5 reclaim, wait for the 21 EMA bounce. You'll start with a 30% position instead of 20%, but that's fine.
Rule: Never chase. Wait for the next EMA setup.
"What if multiple entry signals trigger at the same bar?"
Rare, but possible. If you see both Entry 1 and Entry 2 trigger together:
Take Entry 1 first (20%)
If the next bar confirms Entry 2 is still valid, add 30%
When in doubt, scale in gradually
"The hyper frame is green but I'm seeing short signals?"
Don't take them. The hyper frame is your bias filter. If it says "go long," ignore short setups. They're usually lower probability and will get stopped out.
"Can I use this for swing trading overnight?"
Absolutely. Just switch your hyper frame:
If you're on Daily charts, use Weekly hyper frame
If you're on 4H charts, use Daily hyper frame
Adjust position sizes for overnight risk
"What if the signal appears right at market close?"
Don't chase it. Wait for the next bar (next day) to confirm. Signals that appear in the last 5 minutes are often noise.
"How do I set up alerts?"
Right-click on the chart
Select "Add Alert"
Choose "LazyEMA" from the condition dropdown
Select which signal you want alerts for:
Entry 1: 3→5 Reclaim
Entry 2: 21 EMA Add
Entry 3: 34 EMA Breakout
Exit 1: 89 EMA Break
Exit 2: 144 EMA Break
Click "Create"
Pro tip: Set up all 5 alerts so you never miss a signal.
Position Sizing Guide see
swingtradenotes.substack.com
Critical Rule: Know your total risk BEFORE you take Entry 1. Don't wing it.
Customization Tips
For Day Traders (Scalpers)
Use 5min or 15min charts
Hyper frame: 1H or 4H
Expect 2-4 setups per day
Tighter stops (0.5% risk per entry)
For Swing Traders
Use 4H or Daily charts
Hyper frame: Daily or Weekly
Expect 1-2 setups per week
Wider stops (1-2% risk per entry)
For Position Traders
Use Daily or Weekly charts
Hyper frame: Weekly or Monthly
Expect 1-2 setups per month
Widest stops (2-3% risk per entry)
The "Don't Be Stupid" Checklist
Before taking ANY signal from this script, ask:
✅ Is the hyper frame bias pointing in my direction?
✅ Is the signal clean (not at a weird time or during news)?
✅ Do I know my stop loss level?
✅ Do I know my position size?
✅ Can I afford to lose if this trade fails?
If you answered "no" to ANY of these, skip the trade.
Troubleshooting
"I'm not seeing any signals"
Possible causes:
The "Show Lazy Trader System" toggle is off (turn it on)
Your chart timeframe is too high (try 1H or 4H)
Market is in a tight range (EMAs are compressed)
You need to refresh the chart
"Too many signals, getting whipsawed"
Fixes:
Increase your chart timeframe (go from 15m to 1H)
Switch to a less volatile ticker
Only trade when hyper frame bias is STRONG (not neutral)
Add a minimum bar count between signals
"The info table is covering my price action"
Fix:
Edit the script
Find the line: table.new(position.top_right, ...
Change position.top_right to position.bottom_right or position.top_left
"Signals appear then disappear"
This is normal (repainting). Some signals (especially compression breakouts) can disappear if the next bar reverses. This is why you:
Wait for bar close before acting
Use alerts that only fire on confirmed bars
Don't chase signals mid-bar
Final Thoughts
This script is a decision-making tool, not a crystal ball. It shows you high-probability setups based on EMA dynamics and trend structure. You still need to:
Manage your risk
Choose your position size
Stick to the rules
Accept losses when they happen
The system works when YOU work the system.
Print this guide, tape it next to your monitor, and follow it religiously for 20 trades before making ANY changes.
Good luck, and stay lazy (the smart way).

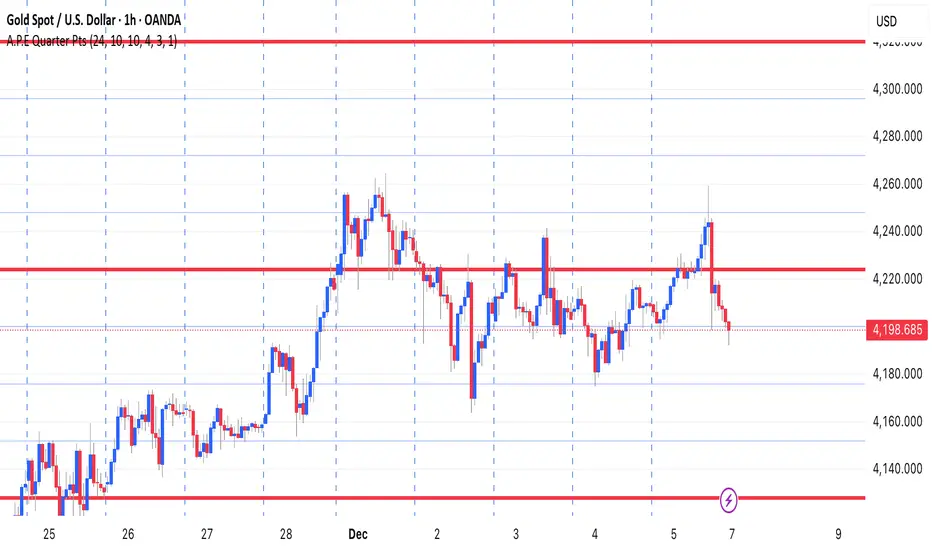
A.P.E Quarter PtsThis indicator draws a set of straight horizontal price levels on your chart.
Each line is spaced evenly apart at a distance you choose — these are called quarter-points.
As price moves, the grid of lines stays centered around the current price, so you always see the nearest support and resistance levels. The lines above price show possible resistance, and the lines below price show possible support.
Some of the lines can be drawn thicker or in a stronger color to show more important levels.
Overall, the indicator gives you a clean, easy-to-read structure of evenly spaced levels that help you see where price may react, stall, bounce, or reverse.
Interest Rate ExpectationsThis indicator shows how much rate cuts or hikes are currently priced into SOFR futures. You choose two SOFR contracts and the script converts each contract price into basis points relative to the current effective fed funds rate. This gives you a very clear view of how policy expectations shift over time.
You can switch between using a fixed EFFR value or pulling the live EFFR ticker. Colours for each line and label are fully adjustable. The script also includes an optional grid for the plus or minus 25, 50 and 75 basis point levels so the chart does not zoom out too far.
Labels appear at the end of both lines and display how many basis points of cuts or hikes are priced for each contract. A small reference box is added on the chart to remind you what each quarterly code represents. For example H is March and Z is December.
The background shading highlights changes in the timing of cuts. Green shading means the market is pushing cuts further out in time. Red shading means cuts are being pulled closer. This gives a simple and visual way to track how the curve reprices near term versus long term policy expectations.
This tool is useful for anyone tracking fed path repricing, front end volatility, macro catalysts or cross asset rate sensitivity.
