Trapped Traders Order BlocksHow It Works
The Trapped Traders Order Blocks indicator identifies specific price action patterns that suggest large market participants ("big money") have been trapped in losing positions after significant price sweeps, creating potential opportunities for reversals. The indicator detects both "bullish trap blocks" (where bearish traders are trapped) and "bearish trap blocks" (where bullish traders are trapped). Here’s the step-by-step process for each:
Bullish Trap Block (Bears Trapped):
A bearish candle (Candle A) must sweep the high of the previous candle (Candle B), meaning its high exceeds the high of the prior candle.
This bearish candle must have a longer upper wick than its lower wick, indicating rejection of higher prices.
The candle must not be a doji (i.e., it must have a significant body, defined as the body being at least 10% of the candle's range).
The next candle (Candle C) must close above the body of the bearish candle (Candle A), suggesting that price has immediately moved against the bearish sweep, potentially trapping bearish traders who entered short positions expecting a downward move.
The body of the bearish candle (Candle A) is marked as a "bullish trap block." A box is drawn around this candle's body, and a label ("Bullish Trap") is placed below it.
Bearish Trap Block (Bulls Trapped):
A bullish candle (Candle A) must sweep the low of the previous candle (Candle B), meaning its low is below the low of the prior candle.
This bullish candle must have a longer lower wick than its upper wick, indicating rejection of lower prices.
The candle must not be a doji.
The next candle (Candle C) must close below the body of the bullish candle (Candle A), suggesting that price has immediately moved against the bullish sweep, potentially trapping bullish traders who entered long positions expecting an upward move.
The body of the bullish candle (Candle A) is marked as a "bearish trap block." A box is drawn around this candle's body, and a label ("Bearish Trap") is placed above it.
Dynamic Box Extension:
For both bullish and bearish trap blocks, the box extends dynamically to the current bar unless it exceeds a user-defined age (default is 52 bars), at which point it stops at the maximum age.
Sweep Detection:
Bullish Sweep (of any trap block, bullish or bearish):
The current candle's open is above the top of the box.
The low is below the top of the box.
The close is above the top of the box.
The lower wick is longer than the upper wick (indicating rejection of lower prices).
The close is above 50% of the candle's range (ensuring a strong bullish bias).
When a bullish sweep occurs, a label ("Bullish Sweep") is placed at the low of the candle, pointing upward, and an alert is triggered.
Bearish Sweep (of any trap block, bullish or bearish):
The current candle's open is below the bottom of the box.
The high is above the bottom of the box.
The close is below the bottom of the box.
The upper wick is longer than the lower wick (indicating rejection of higher prices).
The close is below 50% of the candle's range (ensuring a strong bearish bias).
When a bearish sweep occurs, a label ("Bearish Sweep") is placed at the high of the candle, pointing downward, and an alert is triggered.
When to Be Used
The Trapped Traders Order Blocks indicator is best used in the following scenarios:
Reversal Trading:
Use this indicator to identify potential reversal points in the market. Bullish trap blocks suggest that trapped bears may unwind their short positions, leading to a potential bullish move. Bearish trap blocks suggest that trapped bulls may unwind their long positions, leading to a potential bearish move.
Look for sweeps of these blocks as confirmation of a directional move. A bullish sweep indicates a potential upward move, while a bearish sweep indicates a potential downward move.
Range-Bound Markets:
In sideways or ranging markets, trapped blocks can highlight key levels where large players have been caught off-guard. These levels often act as support or resistance, and a sweep of the block can signal a breakout or continuation in the direction of the sweep.
Confluence with Other Indicators:
Combine the trapped blocks with other technical analysis tools, such as support/resistance levels, Fibonacci retracements, or volume analysis, to increase the probability of a successful trade. For example, a bullish trap block near a strong support level with a bullish sweep can provide a high-probability setup for a long position, while a bearish trap block near a strong resistance level with a bearish sweep can signal a short opportunity.
Timeframes:
The indicator is most effective on higher timeframes such as 1-day (1D), 1-week (1W), and 1-month (1M) charts. These timeframes are more likely to capture significant moves involving large market participants, reducing noise and false signals compared to lower timeframes. While it can be used on lower timeframes (e.g., 1-hour or 4-hour), the signals may be less reliable due to increased market noise.
Logic Behind It
The logic behind the Trapped Traders Order Blocks indicator is rooted in market psychology and the behavior of large market participants ("big money"). When a large sweep candle occurs where price spikes in one direction but then quickly reverses it often indicates that traders have entered positions in the direction of the sweep, expecting a continuation. However, if the price immediately moves against them, these traders are now trapped in losing positions.
Bullish Trap Block (Bears Trapped):
A large bearish sweep candle (spiking upward but closing lower) suggests that bearish traders (bears) have entered short positions at the top of the move, expecting a downward continuation. If the next candle closes above the bearish candle's body, these bears are trapped in losing positions.
The body of the bearish candle becomes a "bullish trap block" because the trapped bears are likely to have placed their stop-loss orders or break-even exit orders just above the high of the sweep candle or within the body of the candle. As price revisits this level in the future, these trapped traders may attempt to unwind their positions by buying back their shorts, which can drive the price higher. This unwinding process often attracts new buyers, leading to a potential bullish reversal or continuation.
The bullish sweep conditions (e.g., close > box top, longer lower wick, and close above 50% of the range) ensure that the price action at the block level shows strong bullish momentum and rejection of lower prices, confirming the potential for a move higher.
Bearish Trap Block (Bulls Trapped):
A large bullish sweep candle (spiking downward but closing higher) suggests that bullish traders (bulls) have entered long positions at the bottom of the move, expecting an upward continuation. If the next candle closes below the bullish candle's body, these bulls are trapped in losing positions.
The body of the bullish candle becomes a "bearish trap block" because the trapped bulls are likely to have placed their stop-loss orders or break-even exit orders just below the low of the sweep candle or within the body of the candle. As price revisits this level in the future, these trapped traders may attempt to unwind their positions by selling their longs, which can drive the price lower. This unwinding process often attracts new sellers, leading to a potential bearish reversal or continuation.
The bearish sweep conditions (e.g., close < box bottom, longer upper wick, and close below 50% of the range) ensure that the price action at the block level shows strong bearish momentum and rejection of higher prices, confirming the potential for a move lower.
Summary
Bullish Trap Block: Occurs when bears get trapped after a bearish sweep candle is immediately followed by a bullish candle, indicating a potential reversal as trapped bears may unwind their positions.
Bearish Trap Block: Occurs when bulls get trapped after a bullish sweep candle is immediately followed by a bearish candle, indicating a potential bearish reversal.
Use Case: Ideal for identifying reversal opportunities, especially in range-bound markets or at key support/resistance levels on higher timeframes like 1D, 1W, and 1M, and can be combined with other indicators for confluence.
Logic: Large sweep candles followed by an immediate reversal suggest that big money has been trapped, and these traders may unwind their positions at break-even in the near future, driving price in the opposite direction of their initial trade.
This indicator provides a visual and actionable way to identify these trapped trader scenarios, with customizable settings for box display, sweep visuals, and alerts to help traders capitalize on these opportunities, particularly on higher timeframes where the signals are most reliable.
Cerca negli script per "ha溢价率"

Uptrick: Acceleration ShiftsIntroduction
Uptrick: Acceleration Shifts is designed to measure and visualize price momentum shifts by focusing on acceleration —the rate of change in velocity over time. It uses various moving average techniques as a trend filter, providing traders with a clearer perspective on market direction and potential trade entries or exits.
Purpose
The main goal of this indicator is to spot strong momentum changes (accelerations) and confirm them with a chosen trend filter. It attempts to distinguish genuine market moves from noise, helping traders make more informed decisions. The script can also trigger multiple entries (smart pyramiding) within the same trend, if desired.
Overview
By measuring how quickly price velocity changes (acceleration) and comparing it against a smoothed average of itself, this script generates buy or sell signals once the acceleration surpasses a given threshold. A trend filter is added for further validation. Users can choose from multiple smoothing methods and color schemes, and they can optionally enable a small table that displays real-time acceleration values.
Originality and Uniqueness
This script offers an acceleration-based approach, backed by several different moving average choices. The blend of acceleration thresholds, a trend filter, and an optional extra-entry (pyramiding) feature provides a flexible toolkit for various trading styles. The inclusion of multiple color themes and a slope-based coloring of the trend line adds clarity and user customization.
Inputs & Features
1. Acceleration Length (length)
This input determines the number of bars used when calculating velocity. Specifically, the script computes velocity by taking the difference in closing prices over length bars, and then calculates acceleration based on how that velocity changes over an additional length. The default is 14.
2. Trend Filter Length (smoothing)
This sets the lookback period for the chosen trend filter method. The default of 50 results in a moderately smooth trend line. A higher smoothing value will create a slower-moving trend filter.
3. Acceleration Threshold (threshold)
This multiplier determines when acceleration is considered strong enough to trigger a main buy or sell signal. A default value of 2.5 means the current acceleration must exceed 2.5 times the average acceleration before signaling.
4. Smart Pyramiding Strength (pyramidingThreshold)
This lower threshold is used for additional (pyramiding) entries once the main trend has already been identified. For instance, if set to 0.5, the script looks for acceleration crossing ±0.5 times its average acceleration to add extra positions.
5. Max Pyramiding Entries (maxPyramidingEntries)
This sets a limit on how many extra positions can be opened (beyond the first main signal) in a single directional trend. The default of 3 ensures traders do not become overexposed.
6. Show Acceleration Table (showTable)
When enabled, a small table displaying the current acceleration and its average is added to the top-right corner of the chart. This table helps monitor real-time momentum changes.
7. Smart Pyramiding (enablePyramiding)
This toggle decides whether additional entries (buy or sell) will be generated once a main signal is active. If enabled, these extra signals act as filtered entries, only firing when acceleration re-crosses a smaller threshold (pyramidingThreshold). These signals have a '+' next to their signal on the label.
8. Select Color Scheme (selectedColorScheme)
Allows choosing between various pre-coded color themes, such as Default, Emerald, Sapphire, Golden Blaze, Mystic, Monochrome, Pastel, Vibrant, Earth, or Neon. Each theme applies a distinct pair of colors for bullish and bearish conditions.
9. Trend Filter (TrendFilter)
Lets the user pick one of several moving average approaches to determine the prevailing trend. The options include:
Short Term (TEMA)
EWMA
Medium Term (HMA)
Classic (SMA)
Quick Reaction (DEMA)
Each method behaves differently, balancing reactivity and smoothness.
10. Slope Lookback (slopeOffset)
Used to measure the slope of the trend filter over a set number of bars (default is 10). This slope then influences the coloring of the trend filter line, indicating bullish or bearish tilt.
Note: The script refers to this as the "Massive Slope Index," but it effectively serves as a Trend Slope Calculation, measuring how the chosen trend filter changes over a specified period.
11. Alerts for Buy/Sell and Pyramiding Signals
The script includes built-in alert conditions that can be enabled or configured. These alerts trigger whenever the script detects a main Buy or Sell signal, as well as extra (pyramiding) signals if Smart Pyramiding is active. This feature allows traders to receive immediate notifications or automate a trading response.
Calculation Methodology
1. Velocity and Acceleration
Velocity is derived by subtracting the closing price from its value length bars ago. Acceleration is the difference in velocity over an additional length period. This highlights how quickly momentum is shifting.
2. Average Acceleration
The script smooths raw acceleration with a simple moving average (SMA) using the smoothing input. Comparing current acceleration against this average provides a threshold-based signal mechanism.
3. Trend Filter
Users can pick one of five moving average types to form a trend baseline. These range from quick-reacting methods (DEMA, TEMA) to smoother options (SMA, HMA, EWMA). The script checks whether the price is above or below this filter to confirm trend direction.
4. Buy/Sell Logic
A buy occurs when acceleration surpasses avgAcceleration * threshold and price closes above the trend filter. A sell occurs under the opposite conditions. An additional overbought/oversold check (based on a longer SMA) refines these signals further.
When price is considered oversold (i.e., close is below a longer-term SMA), a bullish acceleration signal has a higher likelihood of success because it indicates that the market is attempting to reverse from a lower price region. Conversely, when price is considered overbought (close is above this longer-term SMA), a bearish acceleration signal is more likely to be valid. This helps reduce false signals by waiting until the market is extended enough that a reversal or continuation has a stronger chance of following through.
5. Smart Pyramiding
Once a main buy or sell signal is triggered, additional (filtered) entries can be taken if acceleration crosses a smaller multiplier (pyramidingThreshold). This helps traders scale into strong moves. The script enforces a cap (maxPyramidingEntries) to limit risk.
6. Visual Elements
Candles can be recolored based on the active signal. Labels appear on the chart whenever a main or pyramiding entry signal is triggered. An optional table can show real-time acceleration values.
Color Schemes
The script includes a variety of predefined color themes. For bullish conditions, it might use turquoise or green, and for bearish conditions, magenta or red—depending on which color scheme the user selects. Each scheme aims to provide clear visual differentiation between bullish and bearish market states.
Why Each Indicator Was Part of This Component
Acceleration is employed to detect swift changes in momentum, capturing shifts that may not yet appear in more traditional measures. To further adapt to different trading styles and market conditions, several moving average methods are incorporated:
• TEMA (Triple Exponential Moving Average) is chosen for its ability to reduce lag more effectively than a standard EMA while still reacting swiftly to price changes. Its construction layers exponential smoothing in a way that can highlight sudden momentum shifts without sacrificing too much smoothness.
• DEMA (Double Exponential Moving Average) provides a faster response than a single EMA by using two layers of exponential smoothing. It is slightly less smoothed than TEMA but can alert traders to momentum changes earlier, though with a higher risk of noise in choppier markets.
• HMA (Hull Moving Average) is known for its balance of smoothness and reduced lag. Its weighted calculations help track trend direction clearly, making it useful for traders who want a smoother line that still reacts fairly quickly.
• SMA (Simple Moving Average) is the classic baseline for smoothing price data. It offers a clear, stable perspective on long-term trends, though it reacts more slowly than other methods. Its simplicity can be beneficial in lower-volatility or more stable market environments.
• EWMA (Exponentially Weighted Moving Average) provides a middle ground by emphasizing recent price data while still retaining some degree of smoothing. It typically responds faster than an SMA but is less aggressive than DEMA or TEMA.
Alongside these moving average techniques, the script employs a slope calculation (referred to as the “Massive Slope Index”) to visually indicate whether the chosen filter is sloping upward or downward. This adds an extra layer of clarity to directional analysis. The indicator also uses overbought/oversold checks, based on a longer-term SMA, to help filter out signals in overstretched markets—reducing the likelihood of false entries in conditions where the price is already extensively extended.
Additional Features
Alerts can be set up for both main signals and additional pyramiding signals, which is helpful for automated or semi-automated trading. The optional acceleration table offers quick reference values, making momentum monitoring more intuitive. Including explicit alert conditions for Buy/Sell and Pyramiding ensures traders can respond promptly to market movements or integrate these triggers into automated strategies.
Summary
This script serves as a comprehensive momentum-based trading framework, leveraging acceleration metrics and multiple moving average filters to identify potential shifts in market direction. By combining overbought/oversold checks with threshold-based triggers, it aims to reduce the noise that commonly plagues purely reactive indicators. The flexibility of Smart Pyramiding, customizable color schemes, and built-in alerts allows users to tailor their experience and respond swiftly to valid signals, potentially enhancing trading decisions across various market conditions.
Disclaimer
All trading involves significant risk, and users should apply their own judgment, risk management, and broader analysis before making investment decisions.

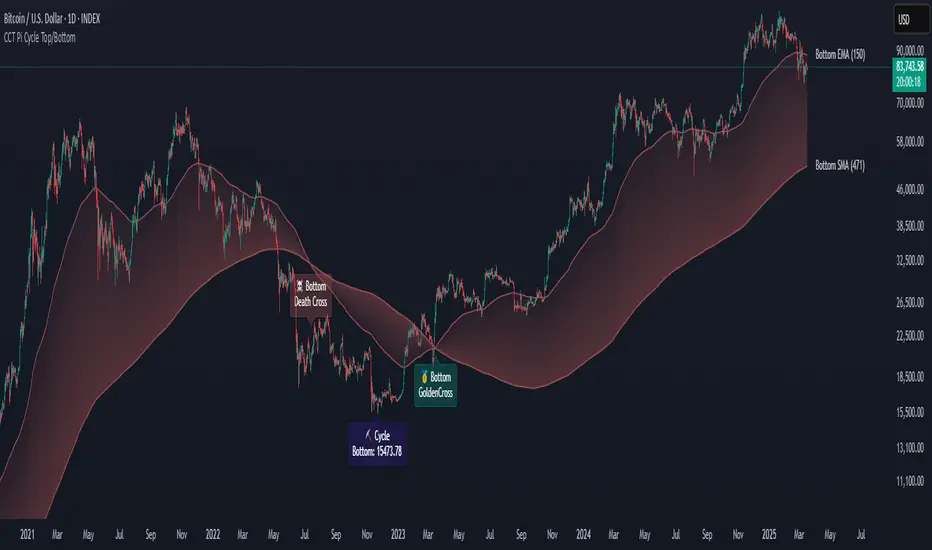
CCT Pi Cycle Top/BottomPi Cycle Top/bottom: The Ultimate Market Cycle Indicator
Introduction
The Pi Cycle Top/bottom Indicator is one of the most reliable tools for identifying Bitcoin market cycle peaks and bottoms. Its effectiveness lies in the strategic combination of moving averages that historically align with major market cycle reversals. Unlike traditional moving average crossovers, this indicator applies an advanced iterative approach to pinpoint price extremes with higher accuracy.
This version, built entirely with Pine Script™ v6, introduces unprecedented precision in detecting both the Pi Cycle Top and Pi Cycle Bottom, eliminating redundant labels, optimizing visual clarity, and ensuring the indicator adapts dynamically to evolving market conditions.
What is the Pi Cycle Theory?
The Pi Cycle Top and Pi Cycle Bottom were originally introduced based on a simple yet profound discovery: key moving average crossovers consistently align with macro market tops and bottoms.
Pi Cycle Top: The crossover of the 111-day Simple Moving Average (SMA) and the 350-day SMA multiplied by 2 has historically signaled market tops with astonishing accuracy.
Pi Cycle Bottom: The intersection of the 150-day Exponential Moving Average (EMA) and the 471-day SMA has repeatedly marked significant market bottoms.
While traditional moving average strategies often suffer from lag and false signals, the Pi Cycle Indicator enhances accuracy by applying a range-based scanning methodology, ensuring that only the most critical reversals are detected.
How This Indicator Works
Unlike basic moving average crossovers, this script introduces a unique iteration process to refine the detection of Pi Cycle points. Here’s how it works:
Detecting Crossovers:
Identifies the Golden Cross (bullish crossover) and Death Cross (bearish crossover) for both the Pi Cycle Top and Pi Cycle Bottom.
Iterating Through the Cycle:
Instead of plotting a simple crossover point, this script scans the range between each Golden and Death Cross to identify the absolute lowest price (Pi Cycle Bottom) and highest price (Pi Cycle Top) within that cycle.
Precision Labeling:
The indicator dynamically adjusts label positioning:
If the price at the crossover is below the fast moving average → the label is placed on the moving average with a downward pointer.
If the price is above the fast moving average → the label is placed below the candle with an upward pointer.
This ensures optimal visibility and prevents misleading signal placement.
Advanced Pine Script v6 Features:
Labels and moving average names are only shown on the last candle, reducing chart noise while maintaining clarity.
Offers full user customization, allowing traders to toggle:
Pi Cycle Top & Bottom visibility
Moving average labels
Crossover labels
Why This Indicator is Superior
This script is not just another moving average crossover tool—it is a market cycle tracker designed for long-term investors and analysts who seek:
✔ High-accuracy macro cycle identification
✔ Elimination of false signals using an iterative range-based scan
✔ Automatic detection of market extremes without manual adjustments
✔ Optimized visuals with smart label positioning
✔ First-of-its-kind implementation using Pine Script™ v6 capabilities
How to Use It?
Bull Market Tops:
When the Pi Cycle Top indicator flashes, consider the potential for a market cycle peak.
Historically, Bitcoin has corrected significantly after these signals.
Bear Market Bottoms:
When the Pi Cycle Bottom appears, it suggests a macro accumulation phase.
These signals have aligned perfectly with historical cycle bottoms.
Final Thoughts
The Pi Cycle Top/bottom Indicator is a must-have tool for traders, investors, and analysts looking to anticipate long-term trend reversals with precision. With its refined methodology, superior label positioning, and cutting-edge Pine Script™ v6 optimizations, this is the most reliable version ever created.
DTFX Algo Zones [SamuraiJack Mod]CME_MINI:NQ1!
Credits
This indicator is a modified version of an open-source tool originally developed by Lux Algo. I literally modded their indicator to create the DTFX Algo Zones version, incorporating additional features and refinements. Special thanks to Lux Algo for their original work and for providing the open-source code that made this development possible.
Introduction
DTFX Algo Zones is a technical analysis indicator designed to automatically identify key supply and demand zones on your chart using market structure and Fibonacci retracements. It helps traders spot high-probability reversal areas and important support/resistance levels at a glance. By detecting shifts in market structure (such as Break of Structure and Change of Character) and highlighting bullish or bearish zones dynamically, this tool provides an intuitive framework for planning trades. The goal is to save traders time and improve decision-making by focusing attention on the most critical price zones where market bias may confirm or reverse.
Logic & Features
• Market Structure Shift Detection (BOS & CHoCH): The indicator continuously monitors price swings and marks significant structure shifts. A Break of Structure (BOS) occurs when price breaks above a previous swing high or below a swing low, indicating a continuation of the current trend. A Change of Character (ChoCH) is detected when price breaks in the opposite direction of the prior trend, often signaling an early trend reversal. These moments are visually marked on the chart, serving as anchor points for new zones. By identifying BOS and ChoCH in real-time, the DTFX Algo Zones indicator ensures you’re aware of key trend changes as they happen.
• Auto-Drawn Fibonacci Supply/Demand Zones: Upon a valid structure shift, the indicator plots a Fibonacci-based zone between the breakout point and the preceding swing high/low (the source of the move). This creates a shaded area or band of Fibonacci retracement levels (for example 38.2%, 50%, 61.8%, etc.) representing a potential support zone in an uptrend or resistance zone in a downtrend. These supply/demand zones are derived from the natural retracement of the breakout move, highlighting where price is likely to pull back. Each zone is essentially an auto-generated Fibonacci retracement region tied to a market structure event, which traders can use to anticipate where the next pullback or bounce might occur.
• Dynamic Bullish and Bearish Zones: The DTFX Algo Zones indicator distinguishes bullish vs. bearish zones and updates them dynamically as new price action unfolds. Bullish zones (formed after bullish BOS/ChoCH) are typically highlighted in one color (e.g. green or blue) to indicate areas of demand/support where price may bounce upward. Bearish zones (formed after bearish BOS/ChoCH) are shown in another color (e.g. red/orange) to mark supply/resistance where price may stall or reverse downward. This color-coding and real-time updating allow traders to instantly recognize the market bias: for instance, a series of bullish zones implies an uptrend with multiple support levels on pullbacks, while consecutive bearish zones indicate a downtrend with resistance overhead. As old zones get invalidated or new ones appear, the chart remains current with the latest key levels, eliminating clutter from outdated levels.
• Flexible Customization: The indicator comes with several options to tailor the zones to your trading style. You can filter which zones to display – for example, show only the most recent N zones or limit to only bullish or only bearish zones – helping declutter the chart and focus on recent, relevant levels. There are settings to control zone extension (how far into the future the zones are drawn) and to automatically invalidate zones once they’re no longer relevant (for instance, if price fully breaks through a zone or a new structure shift occurs that supersedes it). Additionally, the Fibonacci retracement levels within each zone are customizable: you can choose which retracement percentages to plot, adjust their colors or line styles, and decide whether to fill the zone area for visibility. This flexibility ensures the DTFX Algo Zones can be tuned for different markets and strategies, whether you want a clean minimalist look or detailed zones with multiple internal levels.
Best Use Cases
DTFX Algo Zones is a versatile indicator that can enhance various trading strategies. Some of its best use cases include:
• Identifying High-Probability Reversal Zones: Each zone marks an area where price has a higher likelihood of stalling or reversing because it reflects a significant prior swing and Fibonacci retracement. Traders can watch these zones for entry opportunities when the market approaches them, as they often coincide with order block or strong supply/demand areas. This is especially useful for catching trend reversals or pullbacks at points where risk is lower and potential reward is higher.
• Spotting Key Support and Resistance: The automatically drawn zones act as dynamic support (below price) and resistance (above price) levels. Instead of manually drawing Fibonacci retracements or support/resistance lines, you get an instant map of the key levels derived from recent price action. This helps in quickly identifying where the next bounce (support) or rejection (resistance) might occur. Swing traders and intraday traders alike can use these zones to set alerts or anticipate reaction areas as the market moves.
• Trend-Following Entries: In a trending market, the indicator’s zones provide ideal areas to join the trend on pullbacks. For example, in an uptrend, when a new bullish zone is drawn after a BOS, it indicates a fresh demand zone – buying near the lower end of that zone on a pullback can offer a low-risk entry to ride the next leg up. Similarly, in a downtrend, selling rallies into the highlighted supply zones can position you in the direction of the prevailing trend. The zones effectively serve as a roadmap of the trend’s structure, allowing trend traders to buy dips and sell rallies with greater confidence.
• Mean-Reversion and Range Trading: Even in choppy or range-bound markets, DTFX Algo Zones can help find mean-reversion trades. If price is oscillating sideways, the zones at extremes of the range might mark where momentum is shifting (ChoCH) and price could swing back toward the mean. A trader might fade an extended move when it reaches a strong zone, anticipating a reversion. Additionally, if multiple zones cluster in an area across time (creating a zone overlap), it often signifies a particularly robust support/resistance level ideal for range trading strategies.
In all these use cases, the indicator’s ability to filter out noise and highlight structurally important levels means traders can focus on higher-probability setups and make more informed trading decisions.
Strategy – Pullback Trading with DTFX Algo Zones
One of the most effective ways to use the DTFX Algo Zones indicator is trading pullbacks in the direction of the trend. Below is a step-by-step strategy to capitalize on pullbacks using the zones, combining the indicator’s signals with sound price action analysis and risk management:
1. Identify a Market Structure Shift and Trend Bias: First, observe the chart for a recent BOS or ChoCH signal from the indicator. This will tell you the current trend bias. For instance, a bullish BOS/ChoCH means the market momentum has shifted upward (bullish bias), and a new demand zone will be drawn. A bearish structure break indicates downward momentum and creates a supply zone. Make sure the broader context supports the bias (e.g., if multiple higher timeframe zones are bullish, focus on long trades).
2. Wait for the Pullback into the Zone: Once a new zone appears, don’t chase the price immediately. Instead, wait for price to retrace back into that highlighted zone. Patience is key – let the market come to you. For a bullish setup, allow price to dip into the Fibonacci retracement zone (demand area); for a bearish setup, watch for a rally into the supply zone. Often, the middle of the zone (around the 50% retracement level) can be an optimal area where price might slow down and pivot, but it’s wise to observe price behavior across the entire zone.
3. Confirm the Entry with Price Action & Confluence: As price tests the zone, look for confirmation signals before entering the trade. This can include bullish reversal candlestick patterns (for longs) or bearish patterns (for shorts) such as engulfing candles, hammers/shooting stars, or doji indicating indecision turning to reversal. Additionally, incorporate confluence factors to strengthen the setup: for example, check if the zone overlaps with a key moving average, a round number price level, or an old support/resistance line from a higher timeframe. You might also use an oscillator (like RSI or Stochastic) to see if the pullback has reached oversold conditions in a bullish zone (or overbought in a bearish zone), suggesting a bounce is likely. The more factors aligning at the zone, the more confidence you can have in the trade. Only proceed with an entry once you see clear evidence of buyers defending a demand zone or sellers defending a supply zone.
4. Enter the Trade and Manage Risk: When you’re satisfied with the confirmation (e.g., price starts to react positively off a demand zone or shows rejection wicks in a supply zone), execute your entry in the direction of the original trend. Immediately set a stop-loss order to control risk: for a long trade, a common placement is just below the demand zone (a few ticks/pips under the swing low that formed the zone); for a short trade, place the stop just above the supply zone’s high. This way, if the zone fails and price continues beyond it, your loss is limited. Position size the trade so that this stop-loss distance corresponds to a risk you are comfortable with (for example, 1-2% of your trading capital).
5. Take Profit Strategically: Plan your take-profit targets in advance. A conservative approach is to target the origin of the move – for instance, in a long trade, you might take profit as price moves back up to the swing high (the 0% Fibonacci level of the zone) or the next significant zone or resistance level above. This often yields at least a 1:1 reward-to-risk ratio if you entered around mid-zone. More aggressive trend-following traders may leave a portion of the position running beyond the initial target, aiming for a larger move in line with the trend (for example, new higher highs in an uptrend). You can also trail your stop-loss upward behind new higher lows (for longs) or lower highs (for shorts) as the trend progresses, locking in profit while allowing for further gains.
6. Monitor Zone Invalidation: Even after entering, keep an eye on the behavior around the zone and any new zones that may form. If price fails to bounce and instead breaks decisively through the entire zone, respect that as an invalidation – the market may be signaling a deeper reversal or that the signal was false. In such a case, it’s better to exit early or stick to your stop-loss than to hold onto a losing position. The indicator will often mark or no longer highlight zones that have been invalidated by price, guiding you to shift focus to the next opportunity.
Risk Management Tips:
• Always use a stop-loss and don’t move it farther out in hope. Placing the stop just beyond the zone’s far end (the swing point) helps protect you if the pullback turns into a larger reversal.
• Aim for a favorable risk-to-reward ratio. With pullback entries near the middle or far end of a zone, you can often achieve a reward that equals or exceeds your risk. For example, risking 20 pips to make 20+ pips (1:1 or better) is a prudent starting point. Adjust targets based on market structure – if the next resistance is 50 pips away, consider that upside against your risk.
• Use confluence and context: Don’t take every zone signal in isolation. The highest probability trades come when the DTFX Algo Zone aligns with other analysis (trend direction, chart patterns, higher timeframe support/resistance, etc.). This filtered approach will reduce trades taken in weak zones or counter-trend traps.
• Embrace patience and selectivity: Not all zones are equal. It can be wise to skip very narrow or insignificant zones and wait for those that form after a strong BOS/ChoCH (indicating a powerful move). Larger zones or zones formed during high-volume times tend to produce more reliable pullback opportunities.
• Review and adapt: After each trade, note how price behaved around the zone. If you notice certain Fib levels (like 50% or 61.8%) within the zone consistently provide the best entries, you can refine your approach to focus on those. Similarly, adjust the indicator’s settings if needed – for example, if too many minor zones are cluttering your screen, limit to the last few or increase the structure length parameter to capture only more significant swings.
⸻
By combining the DTFX Algo Zones indicator with disciplined confirmation and risk management, traders can improve their timing on pullback entries and avoid chasing moves. This indicator shines in helping you trade what you see, not what you feel – the clearly marked zones and structure shifts keep you grounded in price action reality. Whether you’re a trend trader looking to buy the dip/sell the rally, or a reversal trader hunting for exhaustion points, DTFX Algo Zones provides a robust visual aid to elevate your trading decisions. Use it as a complementary tool in your analysis to stay on the right side of the market’s structure and enhance your trading performance.

Smart Volume S/R Pro [The_lurker]مؤشر "Smart Volume S/R Pro " هو أداة تحليل فني متقدمة مصممة لمساعدة المتداولين في تحديد مستويات الدعم والمقاومة القوية بناءً على حجم التداول، مع إضافة ميزات تحليلية متطورة مثل تصفية الاتجاه ، مناطق الثقة ، تقييم القوة ، حساب احتمالية الاختراق ، قياس السيولة ، تحديد الأهداف السعرية ، ومستويات فيبوناتشي . وايضا تقديم تسميات (Labels) بجانب كل مستوى دعم ومقاومة، تحتوي على أرقام ومعلومات دقيقة تعكس حالة السوق. هذه التسميات ليست مجرد زينة، بل أدوات تحليلية تساعد المتداولين على اتخاذ قرارات مستنيرة بناءً على بيانات السوقيهدف هذا المؤشر إلى توفير رؤية شاملة للسوق .
الوظائف الرئيسية للمؤشر
1- تحديد مستويات الدعم والمقاومة بناءً على حجم التداول العالي
يقوم المؤشر بتحليل الأشرطة (Bars) السابقة (حتى 300 شريط افتراضيًا) لتحديد النقاط التي شهدت أعلى مستويات حجم التداول.
يرسم خطوط أفقية تمثل مستويات المقاومة (عند أعلى سعر في تلك الأشرطة) والدعم (عند أدنى سعر)، ويمكن للمستخدم اختيار عدد الخطوط المعروضة (من 1 إلى 6).
2- تصفية الاتجاه باستخدام مؤشر ADX
يستخدم المؤشر مؤشر الاتجاه المتوسط (ADX) لتقييم قوة الاتجاه في السوق.
عندما تكون قوة الاتجاه عالية (تتجاوز عتبة محددة، 25 افتراضيًا)، يقلل المؤشر عدد مستويات الدعم والمقاومة المعروضة للتركيز فقط على المستويات الأكثر أهمية.
3- مناطق الثقة الديناميكية
يضيف المؤشر مناطق حول مستويات الدعم والمقاومة بناءً على متوسط المدى الحقيقي (ATR)، مما يساعد المتداولين على تصور النطاقات التي قد يتفاعل فيها السعر مع هذه المستويات.
يمكن تعديل عرض هذه المناطق باستخدام مضاعف ATR.
4- تقييم قوة المستويات
يحسب المؤشر قوة كل مستوى بناءً على حجم التداول، عدد المرات التي تم اختبار المستوى فيها (Touch Count)، وقرب السعر الحالي من المستوى.
يتم عرض درجة القوة (من 0 إلى 100) بجانب كل مستوى إذا تم تفعيل هذه الخاصية.
5- احتمالية الاختراق
يقدّر المؤشر احتمالية اختراق كل مستوى بناءً على الزخم (ROC)، قوة المستوى، والمسافة بين السعر الحالي والمستوى.
يظهر الاحتمال كنسبة مئوية إذا تم تفعيل الخيار، مما يساعد المتداولين على توقع الحركات المحتملة.
6- تحليل السيولة التاريخية
يقيس المؤشر السيولة حول كل مستوى بناءً على حجم التداول في النطاقات القريبة منه.
يمكن عرض قيم السيولة في التسميات أو استخدامها لتعديل عرض الخطوط (الخطوط الأكثر سيولة تظهر أعرض).
7- الأهداف السعرية
عند تفعيل هذه الخاصية، يحسب المؤشر أهداف سعرية للاختراق (Breakout) والارتداد (Reversal) بناءً على الزخم وقوة المستوى وATR.
يمكن عرض هذه الأهداف كنصوص في التسميات أو كخطوط أفقية على الرسم البياني.
8- مستويات فيبوناتشي
يرسم المؤشر مستويات فيبوناتشي (0.0، 0.236، 0.382، 0.5، 0.618، 0.786، 1.0) بناءً على أعلى وأدنى سعر في فترة النظرة الخلفية.
يمكن للمستخدم اختيار أي من هذه المستويات لعرضها أو إخفائها.
9- تنبيه شامل للاختراق
يوفر المؤشر تنبيهًا واحدًا يشمل جميع المستويات، حيث يُطلق التنبيه عندما يخترق السعر أي مستوى دعم أو مقاومة مع رسالة توضح نوع الاختراق والمستوى المخترق.
كيفية عمل المؤشر
الخطوة الأولى: يحدد المؤشر الأشرطة ذات الحجم العالي خلال فترة النظرة الخلفية المحددة (Lookback Period).
الخطوة الثانية: يرسم مستويات الدعم والمقاومة بناءً على أعلى وأدنى الأسعار في تلك الأشرطة، مع مراعاة عدد الخطوط المختارة من المستخدم.
الخطوة الثالثة: يطبق مرشح الاتجاه (إذا كان مفعلاً) لتقليل عدد المستويات في حالة الاتجاه القوي.
الخطوة الرابعة: يضيف التحليلات الإضافية مثل القوة، السيولة، احتمالية الاختراق، والأهداف السعرية، ويرسم مناطق الثقة ومستويات فيبوناتشي حسب الإعدادات.
الخطوة الخامسة: يراقب السعر ويطلق تنبيهًا عند الاختراق.
الإعدادات القابلة للتخصيص
1- فترة النظرة الخلفية (Lookback Period): عدد الأشرطة التي يتم تحليلها (افتراضيًا 300).
2- عدد الخطوط (Number of Lines): من 1 إلى 6 مستويات دعم ومقاومة.
3- الألوان والأنماط: يمكن تغيير ألوان الخطوط وأنماطها (ممتلئة، متقطعة، منقطة).
4- التسميات: تفعيل/تعطيل التسميات، وحجمها، وموقعها، ولون النص.
5- مرشح الاتجاه: تفعيل/تعطيل ADX، وتعديل طوله وعتبته.
6- مناطق الثقة: تفعيل/تعطيل، وتعديل طول ATR ومضاعفه.
7- القوة واحتمالية الاختراق: تفعيل/تعطيل العرض، وتعديل طول ROC.
8- السيولة: تفعيل/تعطيل تأثير السيولة على عرض الخطوط وقيمها في التسميات.
9- الأهداف السعرية: تفعيل/تعطيل الأهداف وعرضها كخطوط.
10- فيبوناتشي: اختيار المستويات المعروضة ولون الخطوط.
فوائد المؤشر
دقة عالية: يعتمد على حجم التداول لتحديد المستويات، مما يجعله أكثر موثوقية من المستويات العشوائية.
مرونة: يوفر خيارات تخصيص واسعة تتيح للمتداولين تكييفه حسب استراتيجياتهم.
تحليل شامل: يجمع بين الدعم والمقاومة، الاتجاه، السيولة، والأهداف في أداة واحدة.
سهولة الاستخدام: التسميات والتنبيهات تجعل من السهل متابعة السوق دون تعقيد.
==================================================================================تسميات (Labels) بجانب كل مستوى دعم ومقاومة، تحتوي على أرقام ومعلومات دقيقة تعكس حالة السوق. هذه التسميات ليست مجرد زينة، بل أدوات تحليلية تساعد المتداولين على اتخاذ قرارات مستنيرة بناءً على بيانات السوق. في هذا الشرح، سنستعرض كل رقم أو قيمة تظهر في التسميات ومعناها العملي.
مكونات التسميات
التسميات تظهر بجانب كل مستوى دعم (Support) ومقاومة (Resistance) وتبدأ بحرف "S" للدعم أو "R" للمقاومة، تليها مجموعة من الأرقام والقيم التي يمكن تفعيلها أو تعطيلها حسب إعدادات المستخدم. إليك تفصيل كل عنصر:
1- عدد اللمسات (Touch Count)
الرمز: يظهر مباشرة بعد "S" أو "R" (مثال: "R: 5" أو "S: 3").
المعنى: يشير إلى عدد المرات التي اختبر فيها السعر هذا المستوى دون اختراقه.
الفائدة: كلما زاد عدد اللمسات، كلما كان المستوى أقوى وأكثر أهمية. على سبيل المثال، إذا كان "R: 5"، فهذا يعني أن السعر ارتد من هذا المستوى 5 مرات، مما يجعله مقاومة قوية محتملة.
2- قوة المستوى (Strength Rating)
الرمز: يظهر بين قوسين مربعين (مثال: " ").
المعنى: قيمة من 0 إلى 100 تعكس قوة المستوى بناءً على عوامل مثل حجم التداول، عدد اللمسات، وقرب السعر الحالي من المستوى.
الفائدة: القيم العالية (مثل 75 أو أكثر) تشير إلى مستوى قوي يصعب اختراقه، بينما القيم المنخفضة (مثل 30 أو أقل) تدل على ضعف المستوى وسهولة اختراقه. يمكن للمتداول استخدام هذا لتحديد المستويات الأكثر موثوقية.
3- احتمالية الاختراق (Breakout Probability)
الرمز: يبدأ بحرف "B" متبوعًا بنسبة مئوية (مثال: "B: 60%").
المعنى: نسبة من 0% إلى 100% تُظهر احتمالية اختراق السعر للمستوى بناءً على الزخم الحالي، قوة المستوى، والمسافة بين السعر والمستوى.
الفائدة: نسبة مرتفعة (مثل 60% أو أكثر) تعني أن السعر قد يخترق المستوى قريبًا، بينما النسب المنخفضة (مثل 20%) تشير إلى احتمال ارتداد السعر. هذا مفيد لتوقع الحركة التالية.
4- قيمة السيولة (Liquidity Value)
الرمز: يبدأ بحرف "L" متبوعًا برقم (مثال: "L: 1200").
المعنى: يمثل متوسط حجم التداول في النطاق القريب من المستوى، مما يعكس السيولة التاريخية حوله.
الفائدة: القيم العالية تدل على وجود سيولة كبيرة، مما يعني أن السعر قد يتفاعل بقوة مع هذا المستوى (إما بالارتداد أو الاختراق). القيم المنخفضة تشير إلى سيولة ضعيفة، مما قد يجعل المستوى أقل تأثيرًا.
5- الأهداف السعرية (Price Targets)
الرمز: يبدأ بـ "BT" (هدف الاختراق) و"RT" (هدف الارتداد) متبوعين بأرقام (مثال: "BT: 150.50 RT: 148.20").
المعنى:
BT (Breakout Target): السعر المحتمل الذي قد يصل إليه السعر بعد اختراق المستوى.
RT (Reversal Target): السعر المحتمل الذي قد يصل إليه السعر إذا ارتد من المستوى.
الفائدة: تساعد المتداولين في تحديد نقاط الخروج المحتملة بعد الاختراق أو الارتداد، مما يسهل وضع خطة تداول دقيقة.
أمثلة عملية
تسمية مقاومة: "R: 4 B: 25% L: 1500 BT: 155.00 RT: 152.00"
المستوى اختُبر 4 مرات، قوته 80 (قوي جدًا)، احتمالية الاختراق 25% (منخفضة، أي احتمال ارتداد أعلى)، السيولة 1500 (مرتفعة)، هدف الاختراق 155.00، هدف الارتداد 152.00.
الاستنتاج: المستوى قوي ومن المرجح أن يرتد السعر منه، لكن إذا اخترق، فقد يصل إلى 155.00.
تسمية دعم: "S: 2 B: 70% L: 800 BT: 145.00 RT: 147.50"
المستوى اختُبر مرتين، قوته 40 (متوسطة إلى ضعيفة)، احتمالية الاختراق 70% (مرتفعة)، السيولة 800 (متوسطة)، هدف الاختراق 145.00، هدف الارتداد 147.50.
الاستنتاج: المستوى ضعيف ومن المحتمل أن يخترقه السعر ليهبط إلى 145.00.
كيفية الاستفادة من التسميات
تحديد القوة والضعف: استخدم قوة المستوى (Strength) لمعرفة ما إذا كان المستوى موثوقًا للارتداد أو عرضة للاختراق.
توقع الحركة: انظر إلى احتمالية الاختراق (Breakout Probability) لتحديد ما إذا كنت ستنتظر اختراقًا أو ترتدًا.
إدارة المخاطر: استخدم الأهداف السعرية (BT وRT) لتحديد نقاط جني الأرباح أو وقف الخسارة.
تقييم السيولة: ركز على المستويات ذات السيولة العالية لأنها غالبًا تكون نقاط تحول رئيسية في السوق.
تأكيد التحليل: ادمج عدد اللمسات مع القوة والسيولة للحصول على صورة كاملة عن أهمية المستوى.
تخصيص التسميات
يمكن للمستخدم تفعيل أو تعطيل أي من هذه القيم (القوة، الاحتمالية، السيولة، الأهداف) من إعدادات المؤشر.
يمكن أيضًا تغيير حجم التسميات (صغير، عادي، كبير)، موقعها (يمين، يسار، أعلى، أسفل)، ولون النص لتناسب احتياجاتك.
التسميات في هذا المؤشر هي بمثابة لوحة تحكم صغيرة بجانب كل مستوى دعم ومقاومة، تقدم لك معلومات فورية عن قوته، احتمالية اختراقه، سيولته، وأهدافه السعرية. بفهم هذه الأرقام، يمكنك تحسين قراراتك في التداول، سواء كنت تبحث عن نقاط دخول، خروج، أو إدارة مخاطر. إذا كنت تريد أداة تجمع بين البساطة والعمق التحليلي .
تنويه:
المؤشر هو أداة مساعدة فقط ويجب استخدامه مع التحليل الفني والأساسي لتحقيق أفضل النتائج.
إخلاء المسؤولية
لا يُقصد بالمعلومات والمنشورات أن تكون، أو تشكل، أي نصيحة مالية أو استثمارية أو تجارية أو أنواع أخرى من النصائح أو التوصيات المقدمة أو المعتمدة من TradingView.
The Smart Volume S/R Pro indicator is an advanced technical analysis tool designed to help traders identify strong support and resistance levels based on trading volume, with the addition of advanced analytical features such as trend filtering, confidence zones, strength assessment, breakout probability calculation, liquidity measurement, price target identification, and Fibonacci levels. It also provides labels next to each support and resistance level, containing accurate numbers and information that reflect the market condition. These labels are not just decorations, but analytical tools that help traders make informed decisions based on market data. This indicator aims to provide a comprehensive view of the market.
Main functions of the indicator
1- Identifying support and resistance levels based on high trading volume
The indicator analyzes previous bars (up to 300 bars by default) to identify the points that witnessed the highest levels of trading volume.
It draws horizontal lines representing resistance levels (at the highest price in those bars) and support (at the lowest price), and the user can choose the number of lines displayed (from 1 to 6).
2- Filtering the trend using the ADX indicator
The indicator uses the Average Directional Index (ADX) to assess the strength of a trend in the market.
When the strength of the trend is high (exceeding a specified threshold, 25 by default), the indicator reduces the number of support and resistance levels displayed to focus only on the most important levels.
3- Dynamic Confidence Zones
The indicator adds zones around support and resistance levels based on the Average True Range (ATR), helping traders visualize the ranges in which the price may interact with these levels.
The width of these zones can be adjusted using the ATR multiplier.
4- Assessing the Strength of Levels
The indicator calculates the strength of each level based on trading volume, the number of times the level has been tested (Touch Count), and the proximity of the current price to the level.
A strength score (from 0 to 100) is displayed next to each level if this feature is enabled.
5- Breakout Probability
The indicator estimates the probability of breaking each level based on momentum (ROC), the strength of the level, and the distance between the current price and the level.
The probability is displayed as a percentage if the option is enabled, helping traders anticipate potential moves.
6- Historical Liquidity Analysis
The indicator measures liquidity around each level based on the trading volume in the ranges near it.
The liquidity values can be displayed in the labels or used to adjust the width of the lines (the most liquid lines appear wider).
7- Price Targets
When this feature is enabled, the indicator calculates price targets for breakout and reversal based on momentum, level strength and ATR.
These targets can be displayed as text in the labels or as horizontal lines on the chart.
8- Fibonacci Levels
The indicator plots Fibonacci levels (0.0, 0.236, 0.382, 0.5, 0.618, 0.786, 1.0) based on the highest and lowest price in the lookback period.
The user can choose which of these levels to display or hide.
9- Comprehensive Breakout Alert
The indicator provides a single alert that includes all levels, where the alert is triggered when the price breaks any support or resistance level with a message explaining the type of breakout and the level broken.
How the indicator works
Step 1: The indicator identifies the bars with high volume during the specified Lookback Period.
Step 2: Draws support and resistance levels based on the highest and lowest prices in those bars, taking into account the number of lines selected by the user.
Step 3: Apply the trend filter (if enabled) to reduce the number of levels in case of a strong trend.
Step 4: Adds additional analyses such as strength, liquidity, breakout probability, and price targets, and draws confidence zones and Fibonacci levels according to the settings.
Step 5: Monitors the price and triggers an alert when the breakout occurs.
Customizable Settings
1- Lookback Period: Number of bars to analyze (default 300).
2- Number of Lines: From 1 to 6 support and resistance levels.
3- Colors and Styles: Line colors and styles can be changed (filled, dashed, dotted).
4- Labels: Enable/disable labels, their size, location, and text color.
5- Trend Filter: Enable/disable ADX, and modify its length and threshold.
6- Confidence Zones: Enable/disable, and modify the ATR length and multiplier.
7- Strength and Breakout Probability: Enable/disable the display, and modify the ROC length.
8- Liquidity: Enable/disable the effect of liquidity on the display of the lines and their values in the labels.
9- Price Targets: Enable/disable the targets and display them as lines.
10- Fibonacci: Choose the displayed levels and the color of the lines.
Indicator Benefits
High Accuracy: It relies on trading volume to determine the levels, which makes it more reliable than random levels.
Flexibility: It provides extensive customization options that allow traders to adapt it to their strategies.
Comprehensive Analysis: Combines support and resistance, trend, liquidity, and targets in one tool. Ease of Use: Labels and alerts make it easy to follow the market without complexity.
Labels next to each support and resistance level contain accurate numbers and information that reflect the market situation. These labels are not just decorations, but analytical tools that help traders make informed decisions based on market data. In this explanation, we will review each number or value that appears in the labels and their practical meaning.
Label Components
Labels appear next to each support and resistance level and begin with the letter "S" for support or "R" for resistance, followed by a set of numbers and values that can be enabled or disabled according to the user's settings. Here is a breakdown of each element:
1- Touch Count
Symbol: Appears immediately after "S" or "R" (example: "R: 5" or "S: 3").
Meaning: Indicates the number of times the price has tested this level without breaking it.
Benefit: The more touches, the stronger and more important the level. For example, if it is "R: 5", it means that the price has bounced off this level 5 times, making it a potentially strong resistance.
2- Strength Rating
Symbol: Appears between square brackets (example: " ").
Meaning: A value from 0 to 100 that reflects the strength of the level based on factors such as trading volume, number of touches, and proximity of the current price to the level.
Benefit: High values (such as 75 or more) indicate a strong level that is difficult to break, while low values (such as 30 or less) indicate a weak level that is easy to break. A trader can use this to determine the most reliable levels.
3- Breakout Probability
Symbol: Starts with the letter "B" followed by a percentage (example: "B: 60%").
Meaning: A percentage from 0% to 100% that shows the probability of the price breaking the level based on the current momentum, the strength of the level, and the distance between the price and the level.
Interest: A high percentage (such as 60% or more) means that the price may soon break through the level, while low percentages (such as 20%) indicate that the price may bounce. This is useful for anticipating the next move.
4- Liquidity Value
Symbol: Starts with the letter "L" followed by a number (example: "L: 1200").
Meaning: Represents the average trading volume in the range near the level, reflecting historical liquidity around it.
Interest: High values indicate high liquidity, meaning that the price may react strongly to this level (either by bouncing or breaking through). Low values indicate low liquidity, which may make the level less influential.
5- Price Targets
Symbol: Starts with "BT" (breakout target) and "RT" (rebound target) followed by numbers (example: "BT: 150.50 RT: 148.20").
Meaning:
BT (Breakout Target): The potential price that the price may reach after breaking the level.
RT (Reversal Target): The potential price that the price may reach if it rebounds from the level.
Utility: Helps traders identify potential exit points after a breakout or rebound, making it easier to develop an accurate trading plan.
Working examples
Resistance label: "R: 4 B: 25% L: 1500 BT: 155.00 RT: 152.00"
Level tested 4 times, strength 80 (very strong), probability of breakout 25% (low, i.e. higher probability of rebound), liquidity 1500 (high), breakout target 155.00, rebound target 152.00.
Conclusion: The level is strong and the price is likely to rebound from it, but if it breaks, it may reach 155.00.
Support Label: "S: 2 B: 70% L: 800 BT: 145.00 RT: 147.50"
Level tested twice, Strength 40 (medium to weak), Breakout Probability 70% (high), Liquidity 800 (medium), Breakout Target 145.00, Rebound Target 147.50.
Conclusion: The level is weak and the price is likely to break it to drop to 145.00.
How to use labels
Determine strength and weakness: Use the level's strength to see if the level is reliable for a bounce or vulnerable to a breakout.
Predict the move: Look at the Breakout Probability to determine whether to wait for a breakout or a bounce.
Risk Management: Use price targets (BT and RT) to set take profit or stop loss points.
Liquidity Evaluation: Focus on levels with high liquidity as they are often key turning points in the market.
Analysis Confirmation: Combine the number of touches with strength and liquidity to get a complete picture of the level’s importance.
Customize Labels
The user can enable or disable any of these values (strength, probability, liquidity, targets) from the indicator settings.
The size of the labels (small, normal, large), their position (right, left, top, bottom), and the color of the text can also be changed to suit your needs.
The labels in this indicator act as a small dashboard next to each support and resistance level, providing you with instant information about its strength, probability of breakout, liquidity, and price targets. By understanding these numbers, you can improve your trading decisions, whether you are looking for entry points, exit points, or risk management. If you want a tool that combines simplicity with analytical depth.
Disclaimer:
The indicator is an auxiliary tool only and should be used in conjunction with technical and fundamental analysis for best results.
Disclaimer
The information and posts are not intended to be, or constitute, any financial, investment, trading or other types of advice or recommendations provided or endorsed by TradingView.

Auto-Length Moving Average + Trend Signals (Zeiierman)█ Overview
The Auto-Length Moving Average + Trend Signals (Zeiierman) is an easy-to-use indicator designed to help traders dynamically adjust their moving average length based on market conditions. This tool adapts in real-time, expanding and contracting the moving average based on trend strength and momentum shifts.
The indicator smooths out price fluctuations by modifying its length while ensuring responsiveness to new trends. In addition to its adaptive length algorithm, it incorporates trend confirmation signals, helping traders identify potential trend reversals and continuations with greater confidence.
This indicator suits scalpers, swing traders, and trend-following investors who want a self-adjusting moving average that adapts to volatility, momentum, and price action dynamics.
█ How It Works
⚪ Dynamic Moving Average Length
The core feature of this indicator is its ability to automatically adjust the length of the moving average based on trend persistence and market conditions:
Expands in strong trends to reduce noise.
Contracts in choppy or reversing markets for faster reaction.
This allows for a more accurate moving average that aligns with current price dynamics.
⚪ Trend Confirmation & Signals
The indicator includes built-in trend detection logic, classifying trends based on market structure. It evaluates trend strength based on consecutive bars and smooths out transitions between bullish, bearish, and neutral conditions.
Uptrend: Price is persistently above the adjusted moving average.
Downtrend: Price remains below the adjusted moving average.
Neutral: Price fluctuates around the moving average, indicating possible consolidation.
⚪ Adaptive Trend Smoothing
A smoothing factor is applied to enhance trend readability while minimizing excessive lag. This balances reactivity with stability, making it easier to follow longer-term trends while avoiding false signals.
█ How to Use
⚪ Trend Identification
Bullish Trend: The indicator confirms an uptrend when the price consistently stays above the dynamically adjusted moving average.
Bearish Trend: A downtrend is recognized when the price remains below the moving average.
⚪ Trade Entry & Exit
Enter long when the dynamic moving average is green and a trend signal occurs. Exit when the price crosses below the dynamic moving average.
Enter short when the dynamic moving average is red and a trend signal occurs. Exit when the price crosses above the dynamic moving average.
█ Slope-Based Reset
This mode resets the trend counter when the moving average slope changes direction.
⚪ Interpretation & Insights
Best for trend-following traders who want to filter out noise and only reset when a clear shift in momentum occurs.
Higher slope length (N): More stable trends, fewer resets.
Lower slope length (N): More reactive to small price swings, frequent resets.
Useful in swing trading to track significant trend reversals.
█ RSI-Based Reset
The counter resets when the Relative Strength Index (RSI) crosses predefined overbought or oversold levels.
⚪ Interpretation & Insights
Best for reversal traders who look for extreme overbought/oversold conditions.
High RSI threshold (e.g., 80/20): Fewer resets, only extreme conditions trigger adjustments.
Lower RSI threshold (e.g., 60/40): More frequent resets, detecting smaller corrections.
Great for detecting exhaustion in trends before potential reversals.
█ Volume-Based Reset
A reset occurs when current volume significantly exceeds its moving average, signaling a shift in market participation.
⚪ Interpretation & Insights
Best for traders who follow institutional activity (high volume often means large players are active).
Higher volume SMA length: More stable trends, only resets on massive volume spikes.
Lower volume SMA length: More reactive to short-term volume shifts.
Useful in identifying breakout conditions and trend acceleration points.
█ Bollinger Band-Based Reset
A reset occurs when price closes above the upper Bollinger Band or below the lower Bollinger Band, signaling potential overextension.
⚪ Interpretation & Insights
Best for traders looking for volatility-based trend shifts.
Higher Bollinger Band multiplier (k = 2.5+): Captures only major price extremes.
Lower Bollinger Band multiplier (k = 1.5): Resets on moderate volatility changes.
Useful for detecting overextensions in strong trends before potential retracements.
█ MACD-Based Reset
A reset occurs when the MACD line crosses the signal line, indicating a momentum shift.
⚪ Interpretation & Insights
Best for momentum traders looking for trend continuation vs. exhaustion signals.
Longer MACD lengths (260, 120, 90): Captures major trend shifts.
Shorter MACD lengths (10, 5, 3): Reacts quickly to momentum changes.
Useful for detecting strong divergences and market shifts.
█ Stochastic-Based Reset
A reset occurs when Stochastic %K crosses overbought or oversold levels.
⚪ Interpretation & Insights
Best for short-term traders looking for fast momentum shifts.
Longer Stochastic length: Filters out false signals.
Shorter Stochastic length: Captures quick intraday shifts.
█ CCI-Based Reset
A reset occurs when the Commodity Channel Index (CCI) crosses predefined overbought or oversold levels. The CCI measures the price deviation from its statistical mean, making it a useful tool for detecting overextensions in price action.
⚪ Interpretation & Insights
Best for cycle traders who aim to identify overextended price deviations in trending or ranging markets.
Higher CCI threshold (e.g., ±200): Detects extreme overbought/oversold conditions before reversals.
Lower CCI threshold (e.g., ±10): More sensitive to trend shifts, useful for early signal detection.
Ideal for detecting momentum shifts before price reverts to its mean or continues trending strongly.
█ Momentum-Based Reset
A reset occurs when Momentum (Rate of Change) crosses zero, indicating a potential shift in price direction.
⚪ Interpretation & Insights
Best for trend-following traders who want to track acceleration vs. deceleration.
Higher momentum length: Captures longer-term shifts.
Lower momentum length: More responsive to short-term trend changes.
█ How to Interpret the Trend Strength Table
The Trend Strength Table provides valuable insights into the current market conditions by tracking how the dynamic moving average is adjusting based on trend persistence. Each metric in the table plays a role in understanding the strength, longevity, and stability of a trend.
⚪ Counter Value
Represents the current length of trend persistence before a reset occurs.
The higher the counter, the longer the current trend has been in place without resetting.
When this value reaches the Counter Break Threshold, the moving average resets and contracts to become more reactive.
Example:
A low counter value (e.g., 10) suggests a recent trend reset, meaning the market might be changing directions frequently.
A high counter value (e.g., 495) means the trend has been ongoing for a long time, indicating strong trend persistence.
⚪ Trend Strength
Measures how strong the current trend is based on the trend confirmation logic.
Higher values indicate stronger trends, while lower values suggest weaker trends or consolidations.
This value is dynamic and updates based on price action.
Example:
Trend Strength of 760 → Indicates a high-confidence trend.
Trend Strength of 50 → Suggests weak price action, possibly a choppy market.
⚪ Highest Trend Score
Tracks the strongest trend score recorded during the session.
Helps traders identify the most dominant trend observed in the timeframe.
This metric is useful for analyzing historical trend strength and comparing it with current conditions.
Example:
Highest Trend Score = 760 → Suggests that at some point, there was a strong trend in play.
If the current trend strength is much lower than this value, it could indicate trend exhaustion.
⚪ Average Trend Score
This is a rolling average of trend strength across the session.
Provides a bigger picture of how the trend strength fluctuates over time.
If the average trend score is high, the market has had persistent trends.
If it's low, the market may have been choppy or sideways.
Example:
Average Trend Score of 147 vs. Current Trend Strength of 760 → Indicates that the current trend is significantly stronger than the historical average, meaning a breakout might be occurring.
Average Trend Score of 700+ → Suggests a strong trending market overall.
█ Settings
⚪ Dynamic MA Controls
Base MA Length – Sets the starting length of the moving average before dynamic adjustments.
Max Dynamic Length – Defines the upper limit for how much the moving average can expand.
Trend Confirmation Length – The number of bars required to validate an uptrend or downtrend.
⚪ Reset & Adaptive Conditions
Reset Condition Type – Choose what triggers the moving average reset (Slope, RSI, Volume, MACD, etc.).
Trend Smoothing Factor – Adjusts how smoothly the moving average responds to price changes.
-----------------
Disclaimer
The content provided in my scripts, indicators, ideas, algorithms, and systems is for educational and informational purposes only. It does not constitute financial advice, investment recommendations, or a solicitation to buy or sell any financial instruments. I will not accept liability for any loss or damage, including without limitation any loss of profit, which may arise directly or indirectly from the use of or reliance on such information.
All investments involve risk, and the past performance of a security, industry, sector, market, financial product, trading strategy, backtest, or individual's trading does not guarantee future results or returns. Investors are fully responsible for any investment decisions they make. Such decisions should be based solely on an evaluation of their financial circumstances, investment objectives, risk tolerance, and liquidity needs.

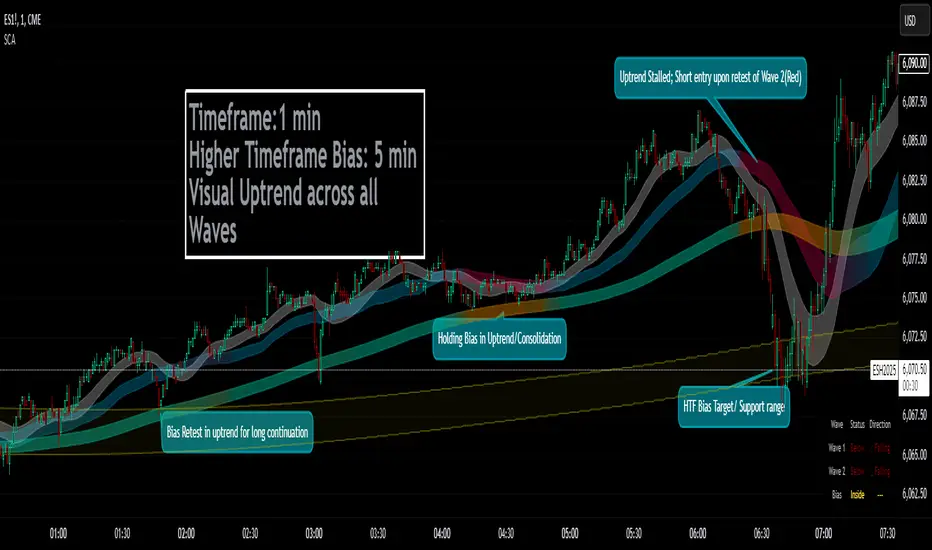
Smoothed Candle Averages- NovaTheMachineThis script utilizes a series of moving averages that the user is able to change as they see fit for their own use.
The averages plotted for the first 2 waves are the High-Low rays of the selected period of time with the chosen moving average style.
The Bias is the Heikin Ashi High-Low ray plotted over the chosen time period, while the Secondary Bias is a higher Timeframe Bias for the same period of time on a selected higher timeframe.
The visuals for each ray are able to be changed to either; lines, solid wave, or dynamic wave.
The Dynamic waves will change color according to the total dissection and utilize the Min-Max range selected as a weight for the strength of the trend. Thus providing an at-a-glance overview of the price relative to trend.
The key objective with this script is to gauge the longer term trend with the current price action, to establish patterns and determine strength of moves both away from and towards the moving average/bias.
When both waves are trending with the Bias, it can be reasoned that there is a strong trend established, when waves and Bias are mixed or trending sideways it can be reasoned there is a range forming or potential for a direction change. When price has broken the waves and biases we can reasonably assume that a new trend has been formed, using the waves and biases again to determine the strength and length of the trend.
The Table will display whether the current price is above or below each wave, and whether the price is continuing or retracing. The Signals plotted are used to help identify when price has broken a wave more swiftly.
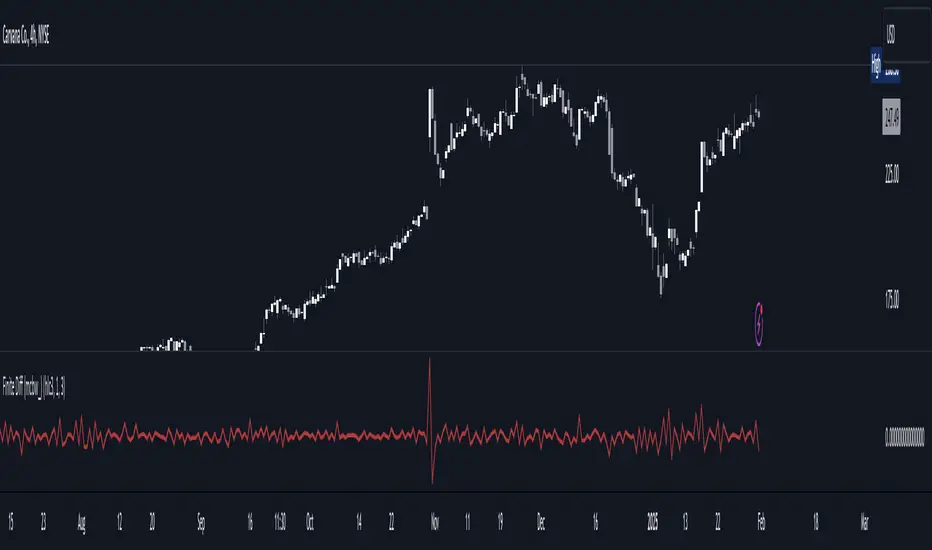
Finite Difference - Backward (mcbw_)In calculus there exists a 'derivative', which simply just measures the difference between two points on a curve. For well behaved mathematical functions there are infinitely many points and so there exists a derivative at every point. Where there are infinitely many points in a curve that curve is called 'continuous'. Continuous curves are very nice to deal with since each point on it exists almost exactly where its neighbors are. However, if the curve does not have infinitely many points on it, but instead has a finite number of points on it, that curve is called 'discrete' instead of continuous. Taking the derivative of discrete curves is much trickier business since there are none of the mathematical conveniences that a continuous offers. In the real world everything we measure is a discrete curve, including Price (since we measure it a finite number of times, aka each candlestick)!
The branch of Discrete Mathematics has found an approach to measure the derivative along a discrete curve, that approach is aptly called " Finite Difference ". To get a more accurate approximation of a discrete derivative, the finite difference approach uses weighted combinations of neighboring points. The most common type of finite difference is a 'central' difference, this uses a combination of points before and after the point of interest to approximate the discrete derivative. This is great for historical analysis but is not of much use for trading algorithms since it technically means using future prices to calculate the derivative of the current point. Instead we can use a less common variant called a ' Backwards Difference ' that only uses a combination of points before the current one to help approximate the current derivative.
In this script you can choose the " Order " of your derivative and the " Accuracy " of its approximation. This script is for educational purposes for folks building trading algorithms. Many trading algorithms often have an element of seeing how much Price has changed from the previous candle to the current candle. This approach is the lowest accuracy derivative possible, and using the backwards finite differences, made available for the first time on TradingView (!!), algorithms that use derivatives can now have higher orders of accuracy!
Happy Trading/Developing!
Drawdown from 22-Day High (Daily Anchored)This Pine Script indicator, titled "Drawdown from 22-Day High (Daily Anchored)," is designed to plot various drawdown levels from the highest high over the past 22 days. This helps traders visualize the performance and potential risk of the security in terms of its recent high points.
Key Features:
Daily High Data:
Fetches daily high prices using the request.security function with a daily timeframe.
Highest High Calculation:
Calculates the highest high over the last 22 days using daily data. This represents the highest price the security has reached in this period.
Drawdown Levels:
Computes various drawdown levels from the highest high:
2% Drawdown
5% Drawdown
10% Drawdown
15% Drawdown
25% Drawdown
45% Drawdown
50% Drawdown
Dynamic Line Coloring:
The color of the 2% drawdown line changes dynamically based on the current closing price:
Green (#02ff0b) if the close is above the 2% drawdown level.
Red (#ff0000) if the close is below the 2% drawdown level.
Plotting Drawdown Levels:
Plots each drawdown level on the chart with specific colors and line widths for easy visual distinction:
2% Drawdown: Green or Red, depending on the closing price.
5% Drawdown: Orange.
10% Drawdown: Blue.
15% Drawdown: Maroon.
25% Drawdown: Purple.
45% Drawdown: Yellow.
50% Drawdown: Black.
Labels for Drawdown Levels:
Adds labels at the end of each drawdown line to indicate the percentage drawdown:
Labels display "2% WVF," "5% WVF," "10% WVF," "15% WVF," "25% WVF," "45% WVF," and "50% WVF" respectively.
The labels are positioned dynamically at the latest bar index to ensure they are always visible.
Explanation of Williams VIX Fix (WVF)
The Williams VIX Fix (WVF) is a volatility indicator designed to replicate the behavior of the VIX (Volatility Index) using price data instead of options prices. It helps traders identify market bottoms and volatility spikes.
Key Aspects of WVF:
Calculation:
The WVF measures the highest high over a specified period (typically 22 days) and compares it to the current closing price.
It is calculated as:
WVF
=
highest high over period
−
current close
highest high over period
×
100
This formula provides a percentage measure of how far the price has fallen from its recent high.
Interpretation:
High WVF Values: Indicate increased volatility and potential market bottoms, suggesting oversold conditions.
Low WVF Values: Suggest lower volatility and potentially overbought conditions.
Usage:
WVF can be used in conjunction with other indicators (e.g., moving averages, RSI) to confirm signals.
It is particularly useful for identifying periods of significant price declines and potential reversals.
In the script, the WVF concept is incorporated into the drawdown levels, providing a visual representation of how far the price has fallen from its 22-day high.
Example Use Cases:
Risk Management: Quickly identify significant drawdown levels to assess the risk of current positions.
Volatility Monitoring: Use the WVF-based drawdown levels to gauge market volatility.
Support Levels: Utilize drawdown levels as potential support levels where price might find buying interest.
This script offers traders and analysts an efficient way to visualize and track important drawdown levels from recent highs, helping in better risk management and decision-making. The dynamic color and label features enhance the readability and usability of the indicator.

Emergent Rays - NovaTheMachineEmergent Rays
An emergent ray is a refracted ray of light that exits a medium or channel. Emergent rays can be created when light passes through a prism, glass slab, or mirror
This visual indicator has been designed to aid in developing psychological understanding of price action. Many traders often struggle with developing strategy that they can act on, repeatedly. The difference between gambling and trading successfully comes down to following a plan, that you have tested and determined to be profitable over the long term.
Some traders experience anxiety when trading trends, trying to time a reversal, or entering a trade based on emotions and are unsure where they should place a stop - if they bother to place one at all.
I developed this indicator to help traders practice responsible trading practices and develop discipline. When applied to a chart an array of light rays will be plotted, similarly to those that are emitted from light passing through a medium such as a prism. These rays are a series of EMAs high & low values, filled with an assigned color.
The indicator does not suggest an entry or exit, it allows for freedom of user interpretation, however - when in a trending market you may notice that the rays are tested multiple times when the market is trending in the same direction. When trading trends it makes sense to enter at the discounted value (pullbacks) and exit on extensions. There are two main reasons for this; first is manage risk, second is to profit from a successful trade.
To practice discipline and remove emotions from trading, one must be willing to accept the outcome of a trade - regardless of whether it was profitable or not, based on their strategy.
The visual gradient of the rays signifies the pullback to stoploss risk. As price expands it is clear to see that the distance from red to blue rays increases, which means entering a trade on a touch of the red ray requires a larger stoploss than entering a pullback to the green or blue rays. When price closes on the opposite side of a ray from where it was trending - we accept the trend may have ended and must wait for the next trend cycle. If the price action is range bound we will notice the rays melting together to create a grey ray that signifies this is not the best place to be trading any type of trend following strategy.
Using this indicator in an uptrend (price expansion upwards), we look to enter long positions of retests (pullbacks) into the rays - with a stoploss set below the lowest rays; as we do not believe the uptrend is over until the trend has been broken.
Using this indicator in a downtrend (price expansion downwards), we look to enter short positions of retests (pullbacks) into the rays - with a stoploss set below the lowest rays; as we do not believe the uptrend is over until the trend has been broken.
When price is range bound or consolidating, we do not enter trades; wait for clear trend to be established.
By practicing discipline, we are able to overcome the emotions involved with trading, remove hesitation, and trade our plans more confidently through appropriate risk management and radical acceptance.
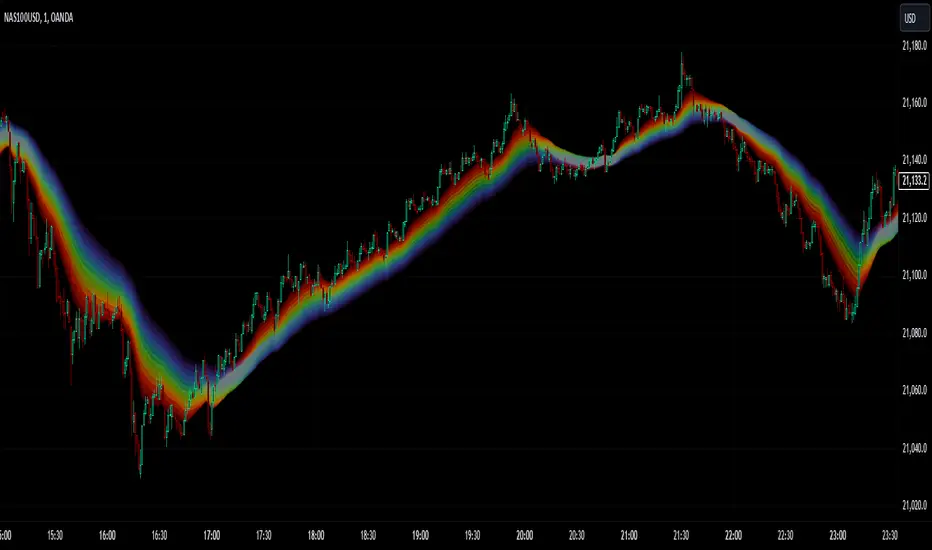
VPSA-VTDDear Sir/Madam,
I am pleased to present the next iteration of my indicator concept, which, in my opinion, serves as a highly useful tool for analyzing markets using the Volume Spread Analysis (VSA) method or the Wyckoff methodology.
The VPSA (Volume-Price Spread Analysis), the latest version in the family of scripts I’ve developed, appears to perform its task effectively. The combination of visualizing normalized data alongside their significance, achieved through the application of Z-Score standardization, proved to be a sound solution. Therefore, I decided to take it a step further and expand my project with a complementary approach to the existing one.
Theory
At the outset, I want to acknowledge that I’m aware of the existence of other probabilistic models used in financial markets, which may describe these phenomena more accurately. However, in line with Occam's Razor, I aimed to maintain simplicity in the analysis and interpretation of the concepts below. For this reason, I focused on describing the data using the Gaussian distribution.
The data I read from the chart — primarily the closing price, the high-low price difference (spread), and volume — exhibit cyclical patterns. These cycles are described by Wyckoff's methodology, while VSA complements and presents them from a different perspective. I will refrain from explaining these methods in depth due to their complexity and broad scope. What matters is that within these cycles, various events occur, described by candles or bars in distinct ways, characterized by different spreads and volumes. When observing the chart, I notice periods of lower volatility, often accompanied by lower volumes, as well as periods of high volatility and significant volumes. It’s important to find harmony within this apparent chaos. I think that chart interpretation cannot happen without considering the broader context, but the more variables I include in the analytical process, the more challenges arise. For instance, how can I determine if something is large (wide) or small (narrow)? For elements like volume or spread, my script provides a partial answer to this question. Now, let’s get to the point.
Technical Overview
The first technique I applied is Min-Max Normalization. With its help, the script adjusts volume and spread values to a range between 0 and 1. This allows for a comparable bar chart, where a wide bar represents volume, and a narrow one represents spread. Without normalization, visually comparing values that differ by several orders of magnitude would be inconvenient. If the indicator shows that one bar has a unit spread value while another has half that value, it means the first bar is twice as large. The ratio is preserved.
The second technique I used is Z-Score Standardization. This concept is based on the normal distribution, characterized by variables such as the mean and standard deviation, which measures data dispersion around the mean. The Z-Score indicates how many standard deviations a given value deviates from the population mean. The higher the Z-Score, the more the examined object deviates from the mean. If an object has a Z-Score of 3, it falls within 0.1% of the population, making it a rare occurrence or even an anomaly. In the context of chart analysis, such strong deviations are events like climaxes, which often signal the end of a trend, though not always. In my script, I assigned specific colors to frequently occurring Z-Score values:
Below 1 – Blue
Above 1 – Green
Above 2 – Red
Above 3 – Fuchsia
These colors are applied to both spread and volume, allowing for quick visual interpretation of data.
Volume Trend Detector (VTD)
The above forms the foundation of VPSA. However, I have extended the script with a Volume Trend Detector (VTD). The idea is that when I consider market structure - by market structure, I mean the overall chart, support and resistance levels, candles, and patterns typical of spread and volume analysis as well as Wyckoff patterns - I look for price ranges where there is a lack of supply, demand, or clues left behind by Smart Money or the market's enigmatic identity known as the Composite Man. This is essential because, as these clues and behaviors of market participants — expressed through the chart’s dynamics - reflect the actions, decisions, and emotions of all players. These behaviors can help interpret the bull-bear battle and estimate the probability of their next moves, which is one of the key factors for a trader relying on technical analysis to make a trade decision.
I enhanced the script with a Volume Trend Detector, which operates in two modes:
Step-by-Step Logic
The detector identifies expected volume dynamics. For instance, when looking for signs of a lack of bullish interest, I focus on setups with decreasing volatility and volume, particularly for bullish candles. These setups are referred to as No Demand patterns, according to Tom Williams' methodology.
Simple Moving Average (SMA)
The detector can also operate based on a simple moving average, helping to identify systematic trends in declining volume, indicating potential imbalances in market forces.
I’ve designed the program to allow the selection of candle types and volume characteristics to which the script will pay particular attention and notify me of specific market conditions.
Advantages and Disadvantages
Advantages:
Unified visualization of normalized spread and volume, saving time and improving efficiency.
The use of Z-Score as a consistent and repeatable relative mechanism for marking examined values.
The use of colors in visualization as a reference to Z-Score values.
The possibility to set up a continuous alert system that monitors the market in real time.
The use of EMA (Exponential Moving Average) as a moving average for Z-Score.
The goal of these features is to save my time, which is the only truly invaluable resource.
Disadvantages:
The assumption that the data follows a normal distribution, which may lead to inaccurate interpretations.
A fixed analysis period, which may not be perfectly suited to changing market conditions.
The use of EMA as a moving average for Z-Score, listed both as an advantage and a disadvantage depending on market context.
I have included comments within the code to explain the logic behind each part. For those who seek detailed mathematical formulas, I invite you to explore the code itself.
Defining Program Parameters:
Numerical Conditions:
VPSA Period for Analysis – The number of candles analyzed.
Normalized Spread Alert Threshold – The expected normalized spread value; defines how large or small the spread should be, with a range of 0-1.00.
Normalized Volume Alert Threshold – The expected normalized volume value; defines how large or small the volume should be, with a range of 0-1.00.
Spread Z-SCORE Alert Threshold – The Z-SCORE value for the spread; determines how much the spread deviates from the average, with a range of 0-4 (a higher value can be entered, but from a logical standpoint, exceeding 4 is unnecessary).
Volume Z-SCORE Alert Threshold – The Z-SCORE value for volume; determines how much the volume deviates from the average, with a range of 0-4 (the same logical note as above applies).
Logical Conditions:
Logical conditions describe whether the expected value should be less than or equal to or greater than or equal to the numerical condition.
All four parameters accept two possibilities and are analogous to the numerical conditions.
Volume Trend Detector:
Volume Trend Detector Period for Analysis – The analysis period, indicating the number of candles examined.
Method of Trend Determination – The method used to determine the trend. Possible values: Step by Step or SMA.
Trend Direction – The expected trend direction. Possible values: Upward or Downward.
Candle Type – The type of candle taken into account. Possible values: Bullish, Bearish, or Any.
The last available setting is the option to enable a joint alert for VPSA and VTD.
When enabled, VPSA will trigger on the last closed candle, regardless of the VTD analysis period.
Example Use Cases (Labels Visible in the Script Window Indicate Triggered Alerts):
The provided labels in the chart window mark where specific conditions were met and alerts were triggered.
Summary and Reflections
The program I present is a strong tool in the ongoing "game" with the Composite Man.
However, it requires familiarity and understanding of the underlying methodologies to fully utilize its potential.
Of course, like any technical analysis tool, it is not without flaws. There is no indicator that serves as a perfect Grail, accurately signaling Buy or Sell in every case.
I would like to thank those who have read through my thoughts to the end and are willing to take a closer look at my work by using this script.
If you encounter any errors or have suggestions for improvement, please feel free to contact me.
I wish you good health and accurately interpreted market structures, leading to successful trades!
CatTheTrader

Uptrick: Volatility Reversion BandsUptrick: Volatility Reversion Bands is an indicator designed to help traders identify potential reversal points in the market by combining volatility and momentum analysis within one comprehensive framework. It calculates dynamic bands around a simple moving average and issues signals when price interacts with these bands. Below is a fully expanded description, structured in multiple sections, detailing originality, usefulness, uniqueness, and the purpose behind blending standard deviation-based and ATR-based concepts. All references to code have been removed to focus on the written explanation only.
Section 1: Overview
Uptrick: Volatility Reversion Bands centers on a moving average around which various bands are constructed. These bands respond to changes in price volatility and can help gauge potential overbought or oversold conditions. Signals occur when the price moves beyond certain thresholds, which may imply a reversal or significant momentum shift.
Section 2: Originality, Usefulness, Uniqness, Purpose
This indicator merges two distinct volatility measurements—Bollinger Bands and ATR—into one cohesive system. Bollinger Bands use standard deviation around a moving average, offering a baseline for what is statistically “normal” price movement relative to a recent mean. When price hovers near the upper band, it may indicate overbought conditions, whereas price near the lower band suggests oversold conditions. This straightforward construction often proves invaluable in moderate-volatility settings, as it pinpoints likely turning points and gauges a market’s typical trading range.
Yet Bollinger Bands alone can falter in conditions marked by abrupt volatility spikes or sudden gaps that deviate from recent norms. Intraday news, earnings releases, or macroeconomic data can alter market behavior so swiftly that standard-deviation bands do not keep pace. This is where ATR (Average True Range) adds an important layer. ATR tracks recent highs, lows, and potential gaps to produce a dynamic gauge of how much price is truly moving from bar to bar. In quieter times, ATR contracts, reflecting subdued market activity. In fast-moving markets, ATR expands, exposing heightened volatility on each new bar.
By overlaying Bollinger Bands and ATR-based calculations, the indicator achieves a broader situational awareness. Bollinger Bands excel at highlighting relative overbought or oversold areas tied to an established average. ATR simultaneously scales up or down based on real-time market swings, signaling whether conditions are calm or turbulent. When combined, this means a price that barely crosses the Bollinger Band but also triggers a high ATR-based threshold is likely experiencing a volatility surge that goes beyond typical market fluctuations. Conversely, a price breach of a Bollinger Band when ATR remains low may still warrant attention, but not necessarily the same urgency as in a high-volatility regime.
The resulting synergy offers balanced, context-rich signals. In a strong trend, the ATR layer helps confirm whether an apparent price breakout really has momentum or if it is just a temporary spike. In a range-bound market, standard deviation-based Bollinger Bands define normal price extremes, while ATR-based extensions highlight whether a breakout attempt has genuine force behind it. Traders gain clarity on when a move is both statistically unusual and accompanied by real volatility expansion, thus carrying a higher probability of a directional follow-through or eventual reversion.
Practical advantages emerge across timeframes. Scalpers in fast-paced markets appreciate how ATR-based thresholds update rapidly, revealing if a sudden price push is routine or exceptional. Swing traders can rely on both indicators to filter out false signals in stable conditions or identify truly notable moves. By calibrating to changes in volatility, the merged system adapts naturally whether the market is trending, ranging, or transitioning between these phases.
In summary, combining Bollinger Bands (for a static sense of standard-deviation-based overbought/oversold zones) with ATR (for a dynamic read on current volatility) yields an adaptive, intuitive indicator. Traders can better distinguish fleeting noise from meaningful expansions, enabling more informed entries, exits, and risk management. Instead of relying on a single yardstick for all market conditions, this fusion provides a layered perspective, encouraging traders to interpret price moves in the broader context of changing volatility.
Section 3: Why Bollinger Bands and ATR are combined
Bollinger Bands provide a static snapshot of volatility by computing a standard deviation range above and below a central average. ATR, on the other hand, adapts in real time to expansions or contractions in market volatility. When combined, these measures offset each other’s limitations: Bollinger Bands add structure (overbought and oversold references), and ATR ensures responsiveness to rapid price shifts. This synergy helps reduce noisy signals, particularly during sudden market turbulence or extended consolidations.
Section 4: User Inputs
Traders can adjust several parameters to suit their preferences and strategies. These typically include:
1. Lookback length for calculating the moving average and standard deviation.
2. Multipliers to control the width of Bollinger Bands.
3. An ATR multiplier to set the distance for additional reversal bands.
4. An option to display weaker signals when the price merely approaches but does not cross the outer bands.
Section 5: Main Calculations
At the core of this indicator are four important steps:
1. Calculate a basis using a simple moving average.
2. Derive Bollinger Bands by adding and subtracting a product of the standard deviation and a user-defined multiplier.
3. Compute ATR over the same lookback period and multiply it by the selected factor.
4. Combine ATR-based distance with the Bollinger Bands to set the outer reversal bands, which serve as stronger signal thresholds.
Section 6: Signal Generation
The script interprets meaningful reversal points when the price:
1. Crosses below the lower outer band, potentially highlighting oversold conditions where a bullish reversal may occur.
2. Crosses above the upper outer band, potentially indicating overbought conditions where a bearish reversal may develop.
Section 7: Visualization
The indicator provides visual clarity through labeled signals and color-coded references:
1. Distinct colors for upper and lower reversal bands.
2. Markers that appear above or below bars to denote possible buying or selling signals.
3. A gradient bar color scheme indicating a bar’s position between the lower and upper bands, helping traders quickly see if the price is near either extreme.
Section 8: Weak Signals (Optional)
For those preferring early cues, the script can highlight areas where the price nears the outer bands. When weak signals are enabled:
1. Bars closer to the upper reversal zone receive a subtle marker suggesting a less robust, yet still noteworthy, potential selling area.
2. Bars closer to the lower reversal zone receive a subtle marker suggesting a less robust, yet still noteworthy, potential buying area.
Section 9: Simplicity, Effectiveness, and Lower Timeframes
Although combining standard deviation and ATR involves sophisticated volatility concepts, this indicator is visually straightforward. Reversal bands and gradient-colored bars make it easy to see at a glance when price approaches or crosses a threshold. Day traders operating on lower timeframes benefit from such clarity because it helps filter out minor fluctuations and focus on more meaningful signals.
Section 10: Adaptability across Market Phases
Because both the standard deviation (for Bollinger Bands) and ATR adapt to changing volatility, the indicator naturally adjusts to various environments:
1. Trending: The additional ATR-based outer bands help distinguish between temporary pullbacks and deeper reversals.
2. Ranging: Bollinger Bands often remain narrower, identifying smaller reversals, while the outer ATR bands remain relatively close to the main bands.
Section 11: Reduced Noise in High-Volatility Scenarios
By factoring ATR into the band calculations, the script widens or narrows the thresholds during rapid market fluctuations. This reduces the amount of false triggers typically found in indicators that rely solely on fixed calculations, preventing overreactions to abrupt but short-lived price spikes.
Section 12: Incorporation with Other Technical Tools
Many traders combine this indicator with oscillators such as RSI, MACD, or Stochastic, as well as volume metrics. Overbought or oversold signals in momentum oscillators can provide additional confirmation when price reaches the outer bands, while volume spikes may reinforce the significance of a breakout or potential reversal.
Section 13: Risk Management Considerations
All trading strategies carry risk. This indicator, like any tool, can and does produce losing trades if price unexpectedly reverses again or if broader market conditions shift rapidly. Prudent traders employ protective measures:
1. Stop-loss orders or trailing stops.
2. Position sizing that accounts for market volatility.
3. Diversification across different asset classes when possible.
Section 14: Overbought and Oversold Identification
Standard Bollinger Bands highlight regions where price might be overextended relative to its recent average. The extended ATR-based reversal bands serve as secondary lines of defense, identifying moments when price truly stretches beyond typical volatility bounds.
Section 15: Parameter Customization for Different Needs
Users can tailor the script to their unique preferences:
1. Shorter lookback settings yield faster signals but risk more noise.
2. Higher multipliers spread the bands further apart, filtering out small moves but generating fewer signals.
3. Longer lookback periods smooth out market noise, often leading to more stable but less frequent trading cues.
Section 16: Examples of Different Trading Styles
1. Day Traders: Often reduce the length to capture quick price swings.
2. Swing Traders: May use moderate lengths such as 20 to 50 bars.
3. Position Traders: Might opt for significantly longer settings to detect macro-level reversals.
Section 17: Performance Limitations and Reality Check
No technical indicator is free from false signals. Sudden fundamental news events, extreme sentiment changes, or low-liquidity conditions can render signals less reliable. Backtesting and forward-testing remain essential steps to gauge whether the indicator aligns well with a trader’s timeframe, risk tolerance, and instrument of choice.
Section 18: Merging Volatility and Momentum
A critical uniqueness of this indicator lies in how it merges Bollinger Bands (standard deviation-based) with ATR (pure volatility measure). Bollinger Bands provide a relative measure of price extremes, while ATR dynamically reacts to market expansions and contractions. Together, they offer an enhanced perspective on potential market turns, ideally reducing random noise and highlighting moments where price has traveled beyond typical bounds.
Section 19: Purpose of this Merger
The fundamental purpose behind blending standard deviation measures with real-time volatility data is to accommodate different market behaviors. Static standard deviation alone can underreact or overreact in abnormally volatile conditions. ATR alone lacks a baseline reference to normality. By merging them, the indicator aims to provide:
1. A versatile dynamic range for both typical and extreme moves.
2. A filter against frequent whipsaws, especially in choppy environments.
3. A visual framework that novices and experts can interpret rapidly.
Section 20: Summary and Practical Tips
Uptrick: Volatility Reversion Bands offers a powerful tool for traders looking to combine volatility-based signals with momentum-derived reversals. It emphasizes clarity through color-coded bars, defined reversal zones, and optional weak signal markers. While potentially useful across all major timeframes, it demands ongoing risk management, realistic expectations, and careful study of how signals behave under different market conditions. No indicator serves as a crystal ball, so integrating this script into an overall strategy—possibly alongside volume data, fundamentals, or momentum oscillators—often yields the best results.
Disclaimer and Educational Use
This script is intended for educational and informational purposes. It does not constitute financial advice, nor does it guarantee trading success. Sudden economic events, low-liquidity times, and unexpected market behaviors can all undermine technical signals. Traders should use proper testing procedures (backtesting and forward-testing) and maintain disciplined risk management measures.

Line Break Chart StrategyHello All!
We should not pass this year without a gift!
My last publication in 2024 is Complete Line Break Chart Strategy with many features!
What is Line Break Chart?
" Line Break is a Japanese chart style that disregards time intervals and only focuses on price movements, similar to the Kagi and Renko chart styles. Line Break charts form a series of up and down bars (referred to as lines). Up lines represent rising prices, and down lines represent falling prices. New confirmed lines only form on the chart when closing prices break the range covered by previous lines. Users can control the number of past lines used in the calculation via the "Number of Lines" input in the chart settings. The typical "Number of Lines" setting is 3, meaning the chart forms a new up line when the closing price is above the high prices of the last three lines, and it forms a new down line when the closing price is below the past three lines' low prices. If the current price is higher, it is an up line and if it is lower, it is a down line. If the current closing price is the same or the move in the opposite direction is not large enough to warrant a reversal, l then no new line is draw n" by Tradingview. You can find it here
Now let's start examining the features of the indicator:
By using Line break reversals it shows trend on the main chart. You can create alert .
Moreover, you can decide which trade should be taken by using Risk Management in the indicator. You can set the " Maximum Risk " and then if the risk is more than you set then the trade is not taken. When trend changed it checks the distance between reversal level and open price and compare it with the Maximum Risk
Breakout:
It can find breakouts and shows on the chart. You can create alert for breakouts
It can show breakouts on the main chart:
Flip-Flops:
Upon looking at set of price break charts, the trader will notice that there are instances when uptrend blocks is followed by one reversal block, and then by a reversal to a series of uptrend blocks. The opposite is also possible: a series of downtrend blocks is followed by one reversal box and then by an immediate reversal to downtrend. This price action is called a " Flip-Flop ". This structure usually produces trend continuation signal. when we see this then we better use Buy/Sell stop order. lets see this on the chart:
Temporal Sequence Table:
Sequence frequency shows the frequency distribution of the number of sequential highs and the number of sequential lows that have been generated. This is quite important to the trader who is seeking to join a trend or put on a trade when the price break reverses into a new trend direction. For example, if the pattern over the past year has been that there never were more than nine consecutive high closes, it would make sense not to enter a position late into the sequence of new high closes.
also you can see market structure. I have tried to formalize it and show it under the table. so you can understand if it's choppy market.
"Number of Lines" has very important role. While using low time frames such seconds/minutes time frame you may want to choose higher number of lines such 5,6. ( this may minimize the risk of a whipsaw )
Gaps feature:
You can set Gaps on/off. if Gaps on then you can see how long it takes for each box
Reversal and Continuation Probability:
The script calculated Reversal level and Continuation probability of the trend by using Sequence frequency.
It also shows unconfirmed box and current closing price level:
Last but not least it has Overlay option for all items, and can show all items in the main chart!
P.S. I added alerts :)
Wish you all a happy new year!
Enjoy!

three Supertrend EMA Strategy by Prasanna +DhanuThe indicator described in your Pine Script is a Supertrend EMA Strategy that combines the Supertrend and EMA (Exponential Moving Average) to create a trend-following strategy. Here’s a detailed breakdown of how this indicator works:
1. EMA (Exponential Moving Average):
The EMA is a moving average that places more weight on recent prices, making it more responsive to price changes compared to a simple moving average (SMA). In this strategy, the EMA is used to determine the overall trend direction.
Input Parameter:
ema_length: This is the period for the EMA, set to 50 periods by default. A shorter EMA will respond more quickly to price movements, while a longer EMA is smoother and less sensitive to short-term fluctuations.
How it's used:
If the price is above the EMA, it indicates an uptrend.
If the price is below the EMA, it indicates a downtrend.
2. Supertrend Indicator:
The Supertrend indicator is a trend-following tool based on the Average True Range (ATR), which is a volatility measure. It helps to identify the direction of the trend by setting a dynamic support or resistance level.
Input Parameters:
supertrend_atr_period: The period used for calculating the ATR, set to 10 periods by default.
supertrend_multiplier1: Multiplier for the first Supertrend, set to 3.0.
supertrend_multiplier2: Multiplier for the second Supertrend, set to 2.0.
supertrend_multiplier3: Multiplier for the third Supertrend, set to 1.0.
Each Supertrend line has a different multiplier, which affects its sensitivity to price changes. The ATR period defines how many periods of price data are used to calculate the ATR.
How the Supertrend works:
If the Supertrend value is below the price, the trend is considered bullish (uptrend).
If the Supertrend value is above the price, the trend is considered bearish (downtrend).
The Supertrend will switch between up and down based on price movement and ATR, providing a dynamic trend-following signal.
3. Three Supertrend Lines:
In this strategy, three Supertrend lines are calculated with different multipliers and the same ATR period (10 periods). Each line is more or less sensitive to price changes, and they are plotted on the chart in different colors based on whether the trend is bullish (green) or bearish (red).
Supertrend 1: The most sensitive Supertrend with a multiplier of 3.0.
Supertrend 2: A moderately sensitive Supertrend with a multiplier of 2.0.
Supertrend 3: The least sensitive Supertrend with a multiplier of 1.0.
Each Supertrend line signals a bullish trend when its value is below the price and a bearish trend when its value is above the price.
4. Strategy Rules:
This strategy uses the three Supertrend lines combined with the EMA to generate trade signals.
Entry Conditions:
A long entry is triggered when all three Supertrend lines are in an uptrend (i.e., all three Supertrend lines are below the price), and the price is above the EMA. This suggests a strong bullish market condition.
A short entry is triggered when all three Supertrend lines are in a downtrend (i.e., all three Supertrend lines are above the price), and the price is below the EMA. This suggests a strong bearish market condition.
Exit Conditions:
A long exit occurs when the third Supertrend (the least sensitive one) switches to a downtrend (i.e., the price falls below it).
A short exit occurs when the third Supertrend switches to an uptrend (i.e., the price rises above it).
5. Visualization:
The strategy also plots the following on the chart:
The EMA is plotted as a blue line, which helps identify the overall trend.
The three Supertrend lines are plotted with different colors:
Supertrend 1: Green (for uptrend) and Red (for downtrend).
Supertrend 2: Green (for uptrend) and Red (for downtrend).
Supertrend 3: Green (for uptrend) and Red (for downtrend).
Summary of the Strategy:
The strategy combines three Supertrend indicators (with different multipliers) and an EMA to capture both short-term and long-term trends.
Long positions are entered when all three Supertrend lines are bullish and the price is above the EMA.
Short positions are entered when all three Supertrend lines are bearish and the price is below the EMA.
Exits occur when the third Supertrend line (the least sensitive) signals a change in trend direction.
This combination of indicators allows for a robust trend-following strategy that adapts to both short-term volatility and long-term trend direction. The Supertrend lines provide quick reaction to price changes, while the EMA offers a smoother, more stable trend direction for confirmation.
The indicator described in your Pine Script is a Supertrend EMA Strategy that combines the Supertrend and EMA (Exponential Moving Average) to create a trend-following strategy. Here’s a detailed breakdown of how this indicator works:
1. EMA (Exponential Moving Average):
The EMA is a moving average that places more weight on recent prices, making it more responsive to price changes compared to a simple moving average (SMA). In this strategy, the EMA is used to determine the overall trend direction.
Input Parameter:
ema_length: This is the period for the EMA, set to 50 periods by default. A shorter EMA will respond more quickly to price movements, while a longer EMA is smoother and less sensitive to short-term fluctuations.
How it's used:
If the price is above the EMA, it indicates an uptrend.
If the price is below the EMA, it indicates a downtrend.
2. Supertrend Indicator:
The Supertrend indicator is a trend-following tool based on the Average True Range (ATR), which is a volatility measure. It helps to identify the direction of the trend by setting a dynamic support or resistance level.
Input Parameters:
supertrend_atr_period: The period used for calculating the ATR, set to 10 periods by default.
supertrend_multiplier1: Multiplier for the first Supertrend, set to 3.0.
supertrend_multiplier2: Multiplier for the second Supertrend, set to 2.0.
supertrend_multiplier3: Multiplier for the third Supertrend, set to 1.0.
Each Supertrend line has a different multiplier, which affects its sensitivity to price changes. The ATR period defines how many periods of price data are used to calculate the ATR.
How the Supertrend works:
If the Supertrend value is below the price, the trend is considered bullish (uptrend).
If the Supertrend value is above the price, the trend is considered bearish (downtrend).
The Supertrend will switch between up and down based on price movement and ATR, providing a dynamic trend-following signal.
3. Three Supertrend Lines:
In this strategy, three Supertrend lines are calculated with different multipliers and the same ATR period (10 periods). Each line is more or less sensitive to price changes, and they are plotted on the chart in different colors based on whether the trend is bullish (green) or bearish (red).
Supertrend 1: The most sensitive Supertrend with a multiplier of 3.0.
Supertrend 2: A moderately sensitive Supertrend with a multiplier of 2.0.
Supertrend 3: The least sensitive Supertrend with a multiplier of 1.0.
Each Supertrend line signals a bullish trend when its value is below the price and a bearish trend when its value is above the price.
4. Strategy Rules:
This strategy uses the three Supertrend lines combined with the EMA to generate trade signals.
Entry Conditions:
A long entry is triggered when all three Supertrend lines are in an uptrend (i.e., all three Supertrend lines are below the price), and the price is above the EMA. This suggests a strong bullish market condition.
A short entry is triggered when all three Supertrend lines are in a downtrend (i.e., all three Supertrend lines are above the price), and the price is below the EMA. This suggests a strong bearish market condition.
Exit Conditions:
A long exit occurs when the third Supertrend (the least sensitive one) switches to a downtrend (i.e., the price falls below it).
A short exit occurs when the third Supertrend switches to an uptrend (i.e., the price rises above it).
5. Visualization:
The strategy also plots the following on the chart:
The EMA is plotted as a blue line, which helps identify the overall trend.
The three Supertrend lines are plotted with different colors:
Supertrend 1: Green (for uptrend) and Red (for downtrend).
Supertrend 2: Green (for uptrend) and Red (for downtrend).
Supertrend 3: Green (for uptrend) and Red (for downtrend).
Summary of the Strategy:
The strategy combines three Supertrend indicators (with different multipliers) and an EMA to capture both short-term and long-term trends.
Long positions are entered when all three Supertrend lines are bullish and the price is above the EMA.
Short positions are entered when all three Supertrend lines are bearish and the price is below the EMA.
Exits occur when the third Supertrend line (the least sensitive) signals a change in trend direction.
This combination of indicators allows for a robust trend-following strategy that adapts to both short-term volatility and long-term trend direction. The Supertrend lines provide quick reaction to price changes, while the EMA offers a smoother, more stable trend direction for confirmation.

Smart DCA Strategy (Public)INSPIRATION
While Dollar Cost Averaging (DCA) is a popular and stress-free investment approach, I noticed an opportunity for enhancement. Standard DCA involves buying consistently, regardless of market conditions, which can sometimes mean missing out on optimal investment opportunities. This led me to develop the Smart DCA Strategy – a 'set and forget' method like traditional DCA, but with an intelligent twist to boost its effectiveness.
The goal was to build something more profitable than a standard DCA strategy so it was equally important that this indicator could backtest its own results in an A/B test manner against the regular DCA strategy.
WHY IS IT SMART?
The key to this strategy is its dynamic approach: buying aggressively when the market shows signs of being oversold, and sitting on the sidelines when it's not. This approach aims to optimize entry points, enhancing the potential for better returns while maintaining the simplicity and low stress of DCA.
WHAT THIS STRATEGY IS, AND IS NOT
This is an investment style strategy. It is designed to improve upon the common standard DCA investment strategy. It is therefore NOT a day trading strategy. Feel free to experiment with various timeframes, but it was designed to be used on a daily timeframe and that's how I recommend it to be used.
You may also go months without any buy signals during bull markets, but remember that is exactly the point of the strategy - to keep your buying power on the sidelines until the markets have significantly pulled back. You need to be patient and trust in the historical backtesting you have performed.
HOW IT WORKS
The Smart DCA Strategy leverages a creative approach to using Moving Averages to identify the most opportune moments to buy. A trigger occurs when a daily candle, in its entirety including the high wick, closes below the threshold line or box plotted on the chart. The indicator is designed to facilitate both backtesting and live trading.
HOW TO USE
Settings:
The input parameters for tuning have been intentionally simplified in an effort to prevent users falling into the overfitting trap.
The main control is the Buying strictness scale setting. Setting this to a lower value will provide more buying days (less strict) while higher values mean less buying days (more strict). In my testing I've found level 9 to provide good all round results.
Validation days is a setting to prevent triggering entries until the asset has spent a given number of days (candles) in the overbought state. Increasing this makes entries stricter. I've found 0 to give the best results across most assets.
In the backtest settings you can also configure how much to buy for each day an entry triggers. Blind buy size is the amount you would buy every day in a standard DCA strategy. Smart buy size is the amount you would buy each day a Smart DCA entry is triggered.
You can also experiment with backtesting your strategy over different historical datasets by using the Start date and End date settings. The results table will not calculate for any trades outside what you've set in the date range settings.
Backtesting:
When backtesting you should use the results table on the top right to tune and optimise the results of your strategy. As with all backtests, be careful to avoid overfitting the parameters. It's better to have a setup which works well across many currencies and historical periods than a setup which is excellent on one dataset but bad on most others. This gives a much higher probability that it will be effective when you move to live trading.
The results table provides a clear visual representation as to which strategy, standard or smart, is more profitable for the given dataset. You will notice the columns are dynamically coloured red and green. Their colour changes based on which strategy is more profitable in the A/B style backtest - green wins, red loses. The key metrics to focus on are GOA (Gain on Account) and Avg Cost.
Live Trading:
After you've finished backtesting you can proceed with configuring your alerts for live trading.
But first, you need to estimate the amount you should buy on each Smart DCA entry. We can use the Total invested row in the results table to calculate this. Assuming we're looking to trade on
BTCUSD
Decide how much USD you would spend each day to buy BTC if you were using a standard DCA strategy. Lets say that is $5 per day
Enter that USD amount in the Blind buy size settings box
Check the Blind Buy column in the results table. If we set the backtest date range to the last 10 years, we would expect the amount spent on blind buys over 10 years to be $18,250 given $5 each day
Next we need to tweak the value of the Smart buy size parameter in setting to get it as close as we can to the Total Invested amount for Blind Buy
By following this approach it means we will invest roughly the same amount into our Smart DCA strategy as we would have into a standard DCA strategy over any given time period.
After you have calculated the Smart buy size, you can go ahead and set up alerts on Smart DCA buy triggers.
BOT AUTOMATION
In an effort to maintain the 'set and forget' stress-free benefits of a standard DCA strategy, I have set my personal Smart DCA Strategy up to be automated. The bot runs on AWS and I have a fully functional project for the bot on my GitHub account. Just reach out if you would like me to point you towards it. You can also hook this into any other 3rd party trade automation system of your choice using the pre-configured alerts within the indicator.
PLANNED FUTURE DEVELOPMENTS
Currently this is purely an accumulation strategy. It does not have any sell signals right now but I have ideas on how I will build upon it to incorporate an algorithm for selling. The strategy should gradually offload profits in bull markets which generates more USD which gives more buying power to rinse and repeat the same process in the next cycle only with a bigger starting capital. Watch this space!
MARKETS
Crypto:
This strategy has been specifically built to work on the crypto markets. It has been developed, backtested and tuned against crypto markets and I personally only run it on crypto markets to accumulate more of the coins I believe in for the long term. In the section below I will provide some backtest results from some of the top crypto assets.
Stocks:
I've found it is generally more profitable than a standard DCA strategy on the majority of stocks, however the results proved to be a lot more impressive on crypto. This is mainly due to the volatility and cycles found in crypto markets. The strategy makes its profits from capitalising on pullbacks in price. Good stocks on the other hand tend to move up and to the right with less significant pullbacks, therefore giving this strategy less opportunity to flourish.
Forex:
As this is an accumulation style investment strategy, I do not recommend that you use it to trade Forex.
For more info about this strategy including backtest results, please see the full description on the invite only version of this strategy named "Smart DCA Strategy"

300-Candle Weighted Average Zones w/50 EMA SignalsThis indicator is designed to deliver a more nuanced view of price dynamics by combining a custom, weighted price average with a volatility-based zone and a trend filter (in this case, a 50-period exponential moving average). The core concept revolves around capturing the overall price level over a relatively large lookback window (300 candles) but with an intentional bias toward recent market activity (the most recent 20 candles), thereby offering a balance between long-term context and short-term responsiveness. By smoothing this weighted average and establishing a “zone” of standard deviation bands around it, the indicator provides a refined visualization of both average price and its recent volatility envelope. Traders can then look for confluence with a standard trend filter, such as the 50 EMA, to identify meaningful crossover signals that may represent trend shifts or opportunities for entry and exit.
What the Indicator Does:
Weighted Price Average:
Instead of using a simple or exponential moving average, this indicator calculates a custom weighted average price over the past 300 candles. Most historical candles receive a base weight of 1.0, but the most recent 20 candles are assigned a higher weight (for example, a weight of 2.0). This weighting scheme ensures that the calculation is not simply a static lookback average; it actively emphasizes current market conditions. The effect is to generate an average line that is more sensitive to the most recent price swings while still maintaining the historical context of the previous 280 candles.
Smoothing of the Weighted Average:
Once the raw weighted average is computed, an exponential smoothing function (EMA) is applied to reduce noise and produce a cleaner, more stable average line. This smoothing helps traders avoid reacting prematurely to minor price fluctuations. By stabilizing the average line, traders can more confidently identify actual shifts in market direction.
Volatility Zone via Standard Deviation Bands:
To contextualize how far price can deviate from this weighted average, the indicator uses standard deviation. Standard deviation is a statistical measure of volatility—how spread out the price values are around the mean. By adding and subtracting one standard deviation from the smoothed weighted average, the indicator plots an upper band and a lower band, creating a zone or channel. The area between these bands is filled, often with a semi-transparent color, highlighting a volatility corridor within which price and the EMA might oscillate.
This zone is invaluable in visualizing “normal” price behavior. When the 50 EMA line and the weighted average line are both within this volatility zone, it indicates that the market’s short- to mid-term trend and its average pricing are aligned well within typical volatility bounds.
Incorporation of a 50-Period EMA:
The inclusion of a commonly used trend filter, the 50 EMA, adds another layer of context to the analysis. The 50 EMA, being a widely recognized moving average length, is often considered a baseline for intermediate trend bias. It reacts faster than a long-term average (like a 200 EMA) but is still stable enough to filter out the market “chop” seen in very short-term averages.
By overlaying the 50 EMA on this custom weighted average and the surrounding volatility zone, the trader gains a dual-dimensional perspective:
Trend Direction: If the 50 EMA is generally above the weighted average, the short-term trend is gaining bullish momentum; if it’s below, the short-term trend has a bearish tilt.
Volatility Normalization: The bands, constructed from standard deviations, provide a sense of whether the price and the 50 EMA are operating within a statistically “normal” range. If the EMA crosses the weighted average within this zone, it signals a potential trend initiation or meaningful shift, as opposed to a random price spike outside normal volatility boundaries.
Why a Trader Would Want to Use This Indicator:
Contextualized Price Level:
Standard MAs may not fully incorporate the most recent price dynamics in a large lookback window. By weighting the most recent candles more heavily, this indicator ensures that the trader is always anchored to what the market is currently doing, not just what it did 100 or 200 candles ago.
Reduced Whipsaw with Smoothing:
The smoothed weighted average line reduces noise, helping traders filter out inconsequential price movements. This makes it easier to spot genuine changes in trend or sentiment.
Visual Volatility Gauge:
The standard deviation bands create a visual representation of “normal” price movement. Traders can quickly assess if a breakout or breakdown is statistically significant or just another oscillation within the expected volatility range.
Clear Trade Signals with Confirmation:
By integrating the 50 EMA and designing signals that trigger only when the 50 EMA crosses above or below the weighted average while inside the zone, the indicator provides a refined entry/exit criterion. This avoids chasing breakouts that occur in abnormal volatility conditions and focuses on those crossovers likely to have staying power.
How to Use It in an Example Strategy:
Imagine you are a swing trader looking to identify medium-term trend changes. You apply this indicator to a chart of a popular currency pair or a leading tech stock. Over the past few days, the 50 EMA has been meandering around the weighted average line, both confined within the standard deviation zone.
Bullish Example:
Suddenly, the 50 EMA crosses decisively above the weighted average line while both are still hovering within the volatility zone. This might be your cue: you interpret this crossover as the 50 EMA acknowledging the recent upward shift in price dynamics that the weighted average has highlighted. Since it occurred inside the normal volatility range, it’s less likely to be a head-fake. You place a long position, setting an initial stop just below the lower band to protect against volatility.
If the price continues to rise and the EMA stays above the average, you have confirmation to hold the trade. As the price moves higher, the weighted average may follow, reinforcing your bullish stance.
Bearish Example:
On the flip side, if the 50 EMA crosses below the weighted average line within the zone, it suggests a subtle but meaningful change in trend direction to the downside. You might short the asset, placing your protective stop just above the upper band, expecting that the statistically “normal” level of volatility will contain the price action. If the price does break above those bands later, it’s a sign your trade may not work out as planned.
Other Indicators for Confluence:
To strengthen the reliability of the signals generated by this weighted average zone approach, traders may want to combine it with other technical studies:
Volume Indicators (e.g., Volume Profile, OBV):
Confirm that the trend crossover inside the volatility zone is supported by volume. For instance, an uptrend crossover combined with increasing On-Balance Volume (OBV) or volume spikes on up candles signals stronger buying pressure behind the price action.
Momentum Oscillators (e.g., RSI, Stochastics):
Before taking a crossover signal, check if the RSI is above 50 and rising for bullish entries, or if the Stochastics have turned down from overbought levels for bearish entries. Momentum confirmation can help ensure that the trend change is not just an isolated random event.
Market Structure Tools (e.g., Pivot Points, Swing High/Low Analysis):
Identify if the crossover event coincides with a break of a previous pivot high or low. A bullish crossover inside the zone aligned with a break above a recent swing high adds further strength to your conviction. Conversely, a bearish crossover confirmed by a breakdown below a previous swing low can make a short trade setup more compelling.
Volume-Weighted Average Price (VWAP):
Comparing where the weighted average zone lies relative to VWAP can provide institutional insight. If the bullish crossover happens while the price is also holding above VWAP, it can mean that the average participant in the market is in profit and that the trend is likely supported by strong hands.
This indicator serves as a tool to balance long-term perspective, short-term adaptability, and volatility normalization. It can be a valuable addition to a trader’s toolkit, offering enhanced clarity and precision in detecting meaningful shifts in trend, especially when combined with other technical indicators and robust risk management principles.

Enigma End Game Indicator
Enigma End Game Indicator Description
The Enigma End Game indicator is a powerful tool designed to enhance the way traders approach support and resistance, combining mainstream technical analysis with a unique, dynamic perspective. At its core, this indicator enables traders to adapt to market conditions in real time by applying a blend of classic and modern interpretations of support and resistance levels.
In traditional support and resistance analysis, we recognize the significant price points where the market has historically reversed or consolidated. However, the *Enigma End Game* indicator takes this one step further by analyzing each individual candle's high as a potential resistance level and each low as support. This allows the trader to stay more agile, as the market constantly updates and evolves. The dynamic nature of this method acknowledges that price movements are fractal in nature, meaning that these levels are not static but adjust in response to price action on multiple timeframes.
### How It Works:
When using the *Enigma End Game* indicator, it doesn't simply plot buy and sell signals automatically. Instead, the indicator highlights key levels based on the interaction between price and historical price action. Here's how it operates:
1. **Buy Logic:**
The indicator identifies bullish signals based on the *Enigma* logic, but it does not trigger an immediate buy. Instead, it plots arrows above or below the candles, indicating the key price levels where price action has shifted. Traders then focus on these areas, particularly looking for buy opportunities *below* these levels during key market sessions (such as London or New York) while aligning with both mainstream support and resistance and *Enigma* levels.
2. **Sell Logic:**
Similarly, when the indicator identifies a sell signal, it plots an arrow above the candle where price action has reversed. This does not immediately suggest selling. Traders wait for a price retracement back to the previously breached low (for a sell order) or high (for a buy order), observing price action closely on lower timeframes (such as the 1-minute chart) to refine entry points. The entry is triggered when price starts to show signs of reversing at these levels, further validated by mainstream and *Enigma* support/resistance.
### Practical Example – XAU/USD (Gold):
For instance, in the settings of the *Enigma End Game* indicator, if we select the 5-minute (5MN) timeframe as the key level, the indicator will only plot the first 3 arrows following the *Enigma* logic. The arrows will appear above or below the candle that was breached, indicating a potential trend reversal. In this scenario, the first arrow marks the point where price broke a significant support or resistance level. Afterward, the trader watches for a subsequent candle to close below (in the case of a sell) the previous candle’s low, confirming a bearish bias.
Now, the trader does not rush into a sell order. Instead, they wait for the price to pull back towards the previously breached low. At this point, the trader can use a lower timeframe (like the 1-minute chart) to identify both mainstream support and resistance levels and *Enigma* levels above the main 5-minute key level. These additional levels provide a clearer understanding of where price might reverse and give the trader a stronger edge in refining their entry point.
The trader then sets a sell order *above* the price level of the previous low, but only once signs show that price is retracing and ready to fall again. The price point where this retracement occurs, confirmed by both mainstream and *Enigma* levels, becomes the entry signal for the trade.
### Summary:
The *Enigma End Game* indicator combines time-tested principles of support and resistance with a more modern, adaptive view, empowering traders to read the market with greater precision. It guides you to wait for optimal entries, based on dynamic support and resistance levels that change with each price movement. By combining signals on higher timeframes with refined entries on lower timeframes, traders gain a unique advantage in navigating both obvious and hidden levels of support and resistance, ultimately improving their ability to time trades with higher probability of success.
This indicator allows for a more calculated, strategic approach to trading—highlighting the right moments to enter the market while providing the flexibility to adjust to different market conditions.
The *ENIGMA Signals with Retests* indicator is a versatile trading tool that combines key market sessions with dynamic support and resistance levels. It uses logic to identify potential buy and sell signals based on the behavior of recent price swings (highs and lows) and offers flexibility with the number of arrows plotted per session. The user can customize settings like arrow frequency, line styles, and session times, allowing for personalized trading strategies.
The indicator detects buy and sell signals by checking if the price breaks the previous swing high (for buy signals) or swing low (for sell signals). It then stores these levels and draws horizontal lines on the chart, representing critical price levels where traders can expect potential price reactions.
A key feature of this indicator is its ability to limit the number of arrows per session, ensuring a cleaner chart and reducing signal clutter. Horizontal lines are drawn at the identified buy or sell levels, with the option to display labels like "BUY - AT OR BELOW" and "SELL - AT OR ABOVE" to further clarify entry points.
The indicator also incorporates session filtering, allowing traders to focus on specific market sessions (Asia, London, and New York) for more relevant signals, and it ensures that no more than a user-defined number of arrows are plotted within a session.

lib_smcLibrary "lib_smc"
This is an adaptation of LuxAlgo's Smart Money Concepts indicator with numerous changes. Main changes include integration of object based plotting, plenty of performance improvements, live tracking of Order Blocks, integration of volume profiles to refine Order Blocks, and many more.
This is a library for developers, if you want this converted into a working strategy, let me know.
buffer(item, len, force_rotate)
Parameters:
item (float)
len (int)
force_rotate (bool)
buffer(item, len, force_rotate)
Parameters:
item (int)
len (int)
force_rotate (bool)
buffer(item, len, force_rotate)
Parameters:
item (Profile type from robbatt/lib_profile/32)
len (int)
force_rotate (bool)
swings(len)
INTERNAL: detect swing points (HH and LL) in given range
Parameters:
len (simple int) : range to check for new swing points
Returns: values are the price level where and if a new HH or LL was detected, else na
method init(this)
Namespace types: OrderBlockConfig
Parameters:
this (OrderBlockConfig)
method delete(this)
Namespace types: OrderBlock
Parameters:
this (OrderBlock)
method clear_broken(this, broken_buffer)
INTERNAL: delete internal order blocks box coordinates if top/bottom is broken
Namespace types: map
Parameters:
this (map)
broken_buffer (map)
Returns: any_bull_ob_broken, any_bear_ob_broken, broken signals are true if an according order block was broken/mitigated, broken contains the broken block(s)
create_ob(id, mode, start_t, start_i, top, end_t, end_i, bottom, break_price, early_confirmation_price, config, init_plot, force_overlay)
INTERNAL: set internal order block coordinates
Parameters:
id (int)
mode (int) : 1: bullish, -1 bearish block
start_t (int)
start_i (int)
top (float)
end_t (int)
end_i (int)
bottom (float)
break_price (float)
early_confirmation_price (float)
config (OrderBlockConfig)
init_plot (bool)
force_overlay (bool)
Returns: signals are true if an according order block was broken/mitigated
method align_to_profile(block, align_edge, align_break_price)
Namespace types: OrderBlock
Parameters:
block (OrderBlock)
align_edge (bool)
align_break_price (bool)
method create_profile(block, opens, tops, bottoms, closes, values, resolution, vah_pc, val_pc, args, init_calculated, init_plot, force_overlay)
Namespace types: OrderBlock
Parameters:
block (OrderBlock)
opens (array)
tops (array)
bottoms (array)
closes (array)
values (array)
resolution (int)
vah_pc (float)
val_pc (float)
args (ProfileArgs type from robbatt/lib_profile/32)
init_calculated (bool)
init_plot (bool)
force_overlay (bool)
method create_profile(block, resolution, vah_pc, val_pc, args, init_calculated, init_plot, force_overlay)
Namespace types: OrderBlock
Parameters:
block (OrderBlock)
resolution (int)
vah_pc (float)
val_pc (float)
args (ProfileArgs type from robbatt/lib_profile/32)
init_calculated (bool)
init_plot (bool)
force_overlay (bool)
track_obs(swing_len, hh, ll, top, btm, bull_bos_alert, bull_choch_alert, bear_bos_alert, bear_choch_alert, min_block_size, max_block_size, config_bull, config_bear, init_plot, force_overlay, enabled, extend_blocks, clear_broken_buffer_before, align_edge_to_value_area, align_break_price_to_poc, profile_args_bull, profile_args_bear, use_soft_confirm, soft_confirm_offset, use_retracements_with_FVG_out)
Parameters:
swing_len (int)
hh (float)
ll (float)
top (float)
btm (float)
bull_bos_alert (bool)
bull_choch_alert (bool)
bear_bos_alert (bool)
bear_choch_alert (bool)
min_block_size (float)
max_block_size (float)
config_bull (OrderBlockConfig)
config_bear (OrderBlockConfig)
init_plot (bool)
force_overlay (bool)
enabled (bool)
extend_blocks (simple bool)
clear_broken_buffer_before (simple bool)
align_edge_to_value_area (simple bool)
align_break_price_to_poc (simple bool)
profile_args_bull (ProfileArgs type from robbatt/lib_profile/32)
profile_args_bear (ProfileArgs type from robbatt/lib_profile/32)
use_soft_confirm (simple bool)
soft_confirm_offset (float)
use_retracements_with_FVG_out (simple bool)
method draw(this, config, extend_only)
Namespace types: OrderBlock
Parameters:
this (OrderBlock)
config (OrderBlockConfig)
extend_only (bool)
method draw(blocks, config)
INTERNAL: plot order blocks
Namespace types: array
Parameters:
blocks (array)
config (OrderBlockConfig)
method draw(blocks, config)
INTERNAL: plot order blocks
Namespace types: map
Parameters:
blocks (map)
config (OrderBlockConfig)
method cleanup(this, ob_bull, ob_bear)
removes all Profiles that are older than the latest OrderBlock from this profile buffer
Namespace types: array
Parameters:
this (array type from robbatt/lib_profile/32)
ob_bull (OrderBlock)
ob_bear (OrderBlock)
_plot_swing_points(mode, x, y, show_swing_points, linecolor_swings, keep_history, show_latest_swings_levels, trail_x, trail_y, trend)
INTERNAL: plot swing points
Parameters:
mode (int) : 1: bullish, -1 bearish block
x (int) : x-coordingate of swing point to plot (bar_index)
y (float) : y-coordingate of swing point to plot (price)
show_swing_points (bool) : switch to enable/disable plotting of swing point labels
linecolor_swings (color) : color for swing point labels and lates level lines
keep_history (bool) : weater to remove older swing point labels and only keep the most recent
show_latest_swings_levels (bool)
trail_x (int) : x-coordinate for latest swing point (bar_index)
trail_y (float) : y-coordinate for latest swing point (price)
trend (int) : the current trend 1: bullish, -1: bearish, to determine Strong/Weak Low/Highs
_pivot_lvl(mode, trend, hhll_x, hhll, super_hhll, filter_insignificant_internal_breaks)
INTERNAL: detect whether a structural level has been broken and if it was in trend direction (BoS) or against trend direction (ChoCh), also track the latest high and low swing points
Parameters:
mode (simple int) : detect 1: bullish, -1 bearish pivot points
trend (int) : current trend direction
hhll_x (int) : x-coordinate of newly detected hh/ll (bar_index)
hhll (float) : y-coordinate of newly detected hh/ll (price)
super_hhll (float) : level/y-coordinate of superior hhll (if this is an internal structure pivot level)
filter_insignificant_internal_breaks (bool) : if true pivot points / internal structure will be ignored where the wick in trend direction is longer than the opposite (likely to push further in direction of main trend)
Returns: coordinates of internal structure that has been broken (x,y): start of structure, (trail_x, trail_y): tracking hh/ll after structure break, (bos_alert, choch_alert): signal whether a structural level has been broken
_plot_structure(x, y, is_bos, is_choch, line_color, line_style, label_style, label_size, keep_history)
INTERNAL: plot structural breaks (BoS/ChoCh)
Parameters:
x (int) : x-coordinate of newly broken structure (bar_index)
y (float) : y-coordinate of newly broken structure (price)
is_bos (bool) : whether this structural break was in trend direction
is_choch (bool) : whether this structural break was against trend direction
line_color (color) : color for the line connecting the structural level and the breaking candle
line_style (string) : style (line.style_dashed/solid) for the line connecting the structural level and the breaking candle
label_style (string) : style (label.style_label_down/up) for the label above/below the line connecting the structural level and the breaking candle
label_size (string) : size (size.small/tiny) for the label above/below the line connecting the structural level and the breaking candle
keep_history (bool) : weater to remove older swing point labels and only keep the most recent
structure_values(length, super_hh, super_ll, filter_insignificant_internal_breaks)
detect (and plot) structural breaks and the resulting new trend
Parameters:
length (simple int) : lookback period for swing point detection
super_hh (float) : level/y-coordinate of superior hh (for internal structure detection)
super_ll (float) : level/y-coordinate of superior ll (for internal structure detection)
filter_insignificant_internal_breaks (bool) : if true pivot points / internal structure will be ignored where the wick in trend direction is longer than the opposite (likely to push further in direction of main trend)
Returns: trend: direction 1:bullish -1:bearish, (bull_bos_alert, bull_choch_alert, top_x, top_y, trail_up_x, trail_up): whether and which level broke in a bullish direction, trailing high, (bbear_bos_alert, bear_choch_alert, tm_x, btm_y, trail_dn_x, trail_dn): same in bearish direction
structure_plot(trend, bull_bos_alert, bull_choch_alert, top_x, top_y, trail_up_x, trail_up, hh, bear_bos_alert, bear_choch_alert, btm_x, btm_y, trail_dn_x, trail_dn, ll, color_bull, color_bear, show_swing_points, show_latest_swings_levels, show_bos, show_choch, line_style, label_size, keep_history)
detect (and plot) structural breaks and the resulting new trend
Parameters:
trend (int) : crrent trend 1: bullish, -1: bearish
bull_bos_alert (bool) : if there was a bullish bos alert -> plot it
bull_choch_alert (bool) : if there was a bullish choch alert -> plot it
top_x (int) : latest shwing high x
top_y (float) : latest swing high y
trail_up_x (int) : trailing high x
trail_up (float) : trailing high y
hh (float) : if there was a higher high
bear_bos_alert (bool) : if there was a bearish bos alert -> plot it
bear_choch_alert (bool) : if there was a bearish chock alert -> plot it
btm_x (int) : latest swing low x
btm_y (float) : latest swing low y
trail_dn_x (int) : trailing low x
trail_dn (float) : trailing low y
ll (float) : if there was a lower low
color_bull (color) : color for bullish BoS/ChoCh levels
color_bear (color) : color for bearish BoS/ChoCh levels
show_swing_points (bool) : whether to plot swing point labels
show_latest_swings_levels (bool) : whether to track and plot latest swing point levels with lines
show_bos (bool) : whether to plot BoS levels
show_choch (bool) : whether to plot ChoCh levels
line_style (string) : whether to plot BoS levels
label_size (string) : label size of plotted BoS/ChoCh levels
keep_history (bool) : weater to remove older swing point labels and only keep the most recent
structure(length, color_bull, color_bear, super_hh, super_ll, filter_insignificant_internal_breaks, show_swing_points, show_latest_swings_levels, show_bos, show_choch, line_style, label_size, keep_history, enabled)
detect (and plot) structural breaks and the resulting new trend
Parameters:
length (simple int) : lookback period for swing point detection
color_bull (color) : color for bullish BoS/ChoCh levels
color_bear (color) : color for bearish BoS/ChoCh levels
super_hh (float) : level/y-coordinate of superior hh (for internal structure detection)
super_ll (float) : level/y-coordinate of superior ll (for internal structure detection)
filter_insignificant_internal_breaks (bool) : if true pivot points / internal structure will be ignored where the wick in trend direction is longer than the opposite (likely to push further in direction of main trend)
show_swing_points (bool) : whether to plot swing point labels
show_latest_swings_levels (bool) : whether to track and plot latest swing point levels with lines
show_bos (bool) : whether to plot BoS levels
show_choch (bool) : whether to plot ChoCh levels
line_style (string) : whether to plot BoS levels
label_size (string) : label size of plotted BoS/ChoCh levels
keep_history (bool) : weater to remove older swing point labels and only keep the most recent
enabled (bool)
_check_equal_level(mode, len, eq_threshold, enabled)
INTERNAL: detect equal levels (double top/bottom)
Parameters:
mode (int) : detect 1: bullish/high, -1 bearish/low pivot points
len (int) : lookback period for equal level (swing point) detection
eq_threshold (float) : maximum price offset for a level to be considered equal
enabled (bool)
Returns: eq_alert whether an equal level was detected and coordinates of the first and the second level/swing point
_plot_equal_level(show_eq, x1, y1, x2, y2, label_txt, label_style, label_size, line_color, line_style, keep_history)
INTERNAL: plot equal levels (double top/bottom)
Parameters:
show_eq (bool) : whether to plot the level or not
x1 (int) : x-coordinate of the first level / swing point
y1 (float) : y-coordinate of the first level / swing point
x2 (int) : x-coordinate of the second level / swing point
y2 (float) : y-coordinate of the second level / swing point
label_txt (string) : text for the label above/below the line connecting the equal levels
label_style (string) : style (label.style_label_down/up) for the label above/below the line connecting the equal levels
label_size (string) : size (size.tiny) for the label above/below the line connecting the equal levels
line_color (color) : color for the line connecting the equal levels (and it's label)
line_style (string) : style (line.style_dotted) for the line connecting the equal levels
keep_history (bool) : weater to remove older swing point labels and only keep the most recent
equal_levels_values(len, threshold, enabled)
detect (and plot) equal levels (double top/bottom), returns coordinates
Parameters:
len (int) : lookback period for equal level (swing point) detection
threshold (float) : maximum price offset for a level to be considered equal
enabled (bool) : whether detection is enabled
Returns: (eqh_alert, eqh_x1, eqh_y1, eqh_x2, eqh_y2) whether an equal high was detected and coordinates of the first and the second level/swing point, (eql_alert, eql_x1, eql_y1, eql_x2, eql_y2) same for equal lows
equal_levels_plot(eqh_x1, eqh_y1, eqh_x2, eqh_y2, eql_x1, eql_y1, eql_x2, eql_y2, color_eqh, color_eql, show, keep_history)
detect (and plot) equal levels (double top/bottom), returns coordinates
Parameters:
eqh_x1 (int) : coordinates of first point of equal high
eqh_y1 (float) : coordinates of first point of equal high
eqh_x2 (int) : coordinates of second point of equal high
eqh_y2 (float) : coordinates of second point of equal high
eql_x1 (int) : coordinates of first point of equal low
eql_y1 (float) : coordinates of first point of equal low
eql_x2 (int) : coordinates of second point of equal low
eql_y2 (float) : coordinates of second point of equal low
color_eqh (color) : color for the line connecting the equal highs (and it's label)
color_eql (color) : color for the line connecting the equal lows (and it's label)
show (bool) : whether plotting is enabled
keep_history (bool) : weater to remove older swing point labels and only keep the most recent
Returns: (eqh_alert, eqh_x1, eqh_y1, eqh_x2, eqh_y2) whether an equal high was detected and coordinates of the first and the second level/swing point, (eql_alert, eql_x1, eql_y1, eql_x2, eql_y2) same for equal lows
equal_levels(len, threshold, color_eqh, color_eql, enabled, show, keep_history)
detect (and plot) equal levels (double top/bottom)
Parameters:
len (int) : lookback period for equal level (swing point) detection
threshold (float) : maximum price offset for a level to be considered equal
color_eqh (color) : color for the line connecting the equal highs (and it's label)
color_eql (color) : color for the line connecting the equal lows (and it's label)
enabled (bool) : whether detection is enabled
show (bool) : whether plotting is enabled
keep_history (bool) : weater to remove older swing point labels and only keep the most recent
Returns: (eqh_alert) whether an equal high was detected, (eql_alert) same for equal lows
_detect_fvg(mode, enabled, o, h, l, c, filter_insignificant_fvgs, change_tf)
INTERNAL: detect FVG (fair value gap)
Parameters:
mode (int) : detect 1: bullish, -1 bearish gaps
enabled (bool) : whether detection is enabled
o (float) : reference source open
h (float) : reference source high
l (float) : reference source low
c (float) : reference source close
filter_insignificant_fvgs (bool) : whether to calculate and filter small/insignificant gaps
change_tf (bool) : signal when the previous reference timeframe closed, triggers new calculation
Returns: whether a new FVG was detected and its top/mid/bottom levels
_clear_broken_fvg(mode, upper_boxes, lower_boxes)
INTERNAL: clear mitigated FVGs (fair value gaps)
Parameters:
mode (int) : detect 1: bullish, -1 bearish gaps
upper_boxes (array) : array that stores the upper parts of the FVG boxes
lower_boxes (array) : array that stores the lower parts of the FVG boxes
_plot_fvg(mode, show, top, mid, btm, border_color, extend_box)
INTERNAL: plot (and clear broken) FVG (fair value gap)
Parameters:
mode (int) : plot 1: bullish, -1 bearish gap
show (bool) : whether plotting is enabled
top (float) : top level of fvg
mid (float) : center level of fvg
btm (float) : bottom level of fvg
border_color (color) : color for the FVG box
extend_box (int) : how many bars into the future the FVG box should be extended after detection
fvgs_values(o, h, l, c, filter_insignificant_fvgs, change_tf, enabled)
detect (and plot / clear broken) FVGs (fair value gaps), and return alerts and level values
Parameters:
o (float) : reference source open
h (float) : reference source high
l (float) : reference source low
c (float) : reference source close
filter_insignificant_fvgs (bool) : whether to calculate and filter small/insignificant gaps
change_tf (bool) : signal when the previous reference timeframe closed, triggers new calculation
enabled (bool) : whether detection is enabled
Returns: (bullish_fvg_alert, bull_top, bull_mid, bull_btm): whether a new bullish FVG was detected and its top/mid/bottom levels, (bearish_fvg_alert, bear_top, bear_mid, bear_btm): same for bearish FVGs
fvgs_plot(bullish_fvg_alert, bull_top, bull_mid, bull_btm, bearish_fvg_alert, bear_top, bear_mid, bear_btm, color_bull, color_bear, extend_box, show)
Parameters:
bullish_fvg_alert (bool)
bull_top (float)
bull_mid (float)
bull_btm (float)
bearish_fvg_alert (bool)
bear_top (float)
bear_mid (float)
bear_btm (float)
color_bull (color) : color for bullish FVG boxes
color_bear (color) : color for bearish FVG boxes
extend_box (int) : how many bars into the future the FVG box should be extended after detection
show (bool) : whether plotting is enabled
Returns: (bullish_fvg_alert, bull_top, bull_mid, bull_btm): whether a new bullish FVG was detected and its top/mid/bottom levels, (bearish_fvg_alert, bear_top, bear_mid, bear_btm): same for bearish FVGs
fvgs(o, h, l, c, filter_insignificant_fvgs, change_tf, color_bull, color_bear, extend_box, enabled, show)
detect (and plot / clear broken) FVGs (fair value gaps)
Parameters:
o (float) : reference source open
h (float) : reference source high
l (float) : reference source low
c (float) : reference source close
filter_insignificant_fvgs (bool) : whether to calculate and filter small/insignificant gaps
change_tf (bool) : signal when the previous reference timeframe closed, triggers new calculation
color_bull (color) : color for bullish FVG boxes
color_bear (color) : color for bearish FVG boxes
extend_box (int) : how many bars into the future the FVG box should be extended after detection
enabled (bool) : whether detection is enabled
show (bool) : whether plotting is enabled
Returns: (bullish_fvg_alert): whether a new bullish FVG was detected, (bearish_fvg_alert): same for bearish FVGs
OrderBlock
Fields:
id (series int)
dir (series int)
left_top (chart.point)
right_bottom (chart.point)
break_price (series float)
early_confirmation_price (series float)
ltf_high (array)
ltf_low (array)
ltf_volume (array)
plot (Box type from robbatt/lib_plot_objects/49)
profile (Profile type from robbatt/lib_profile/32)
trailing (series bool)
extending (series bool)
awaiting_confirmation (series bool)
touched_break_price_before_confirmation (series bool)
soft_confirmed (series bool)
has_fvg_out (series bool)
hidden (series bool)
broken (series bool)
OrderBlockConfig
Fields:
show (series bool)
show_last (series int)
show_id (series bool)
show_profile (series bool)
args (BoxArgs type from robbatt/lib_plot_objects/49)
txt (series string)
txt_args (BoxTextArgs type from robbatt/lib_plot_objects/49)
delete_when_broken (series bool)
broken_args (BoxArgs type from robbatt/lib_plot_objects/49)
broken_txt (series string)
broken_txt_args (BoxTextArgs type from robbatt/lib_plot_objects/49)
broken_profile_args (ProfileArgs type from robbatt/lib_profile/32)
use_profile (series bool)
profile_args (ProfileArgs type from robbatt/lib_profile/32)

Potential Upcoming Trend ToolThis Script has the specific use of identifying when and how a new trend may start to take form, rather than focusing on how a trend has already formed on a longer term basis.
This Script is useful on it's own and not in conjunction with another. It works by taking on the most recent price data rather than a long term historical string.
It differs from standard trend following indicators because it's use is far less historical, and more present. It requires less pivot points than normal to be validated as a strong trend.
It works by taking local pivot points and fractals to form its parallel basis. The Trend lines will continually move as more recent price action data appears and the the channel will get thinner, until it is clear a trend has arrived and consolidated.
The idea really is to see a constantly evolving picture of a sudden change in movement, allowing you to have an earlier eye on what is potentially to come.
The faint mid-point line gives a reasonable reading of where you would find yourself halfway within a new trend and will also move inline with the shown trendlines.
This allows you to easily track when sentiment and therefore trends are about to change. It's much more useful on lower timeframes because they will often give the first indication something is changing.
Colours are fully customisable.

Enigma UnlockedENIGMA Indicator: A Comprehensive Market Bias & Success Tracker
The ENIGMA Indicator is a powerful tool designed for traders who aim to identify market bias, track price movements, and evaluate trade performance using multiple timeframes. It combines multiple indicators and advanced logic to provide real-time insights into market trends, helping traders make more informed decisions.
Key Features
1. Multi-Timeframe Bias Calculation:
The ENIGMA Indicator tracks the market bias across multiple timeframes—Daily (D), 4-Hour (H4), 1-Hour (H1), 30-Minute (30M), 15-Minute (15M), 5-Minute (5M), and 1-Minute (1M).
How the Bias is Created:
The Bias is a key feature of the ENIGMA Indicator and is determined by comparing the current price with previous price levels for each timeframe.
- Bullish Bias (1): The market is considered **bullish** if the **current closing price** is higher than the **previous timeframe’s high**. This suggests that the market is trending upwards, and buyers are in control.
- Bearish Bias (-1): The market is considered **bearish** if the **current closing price** is lower than the **previous timeframe’s low**. This suggests that the market is trending downwards, and sellers are in control.
- Neutral Bias (0): The market is considered **neutral** if the price is between the **previous high** and **previous low**, indicating indecision or a range-bound market.
This bias calculation is performed independently for each timeframe. The **Bias** for each timeframe is then displayed in the **Bias Table** on your chart, providing a clear view of market direction across multiple timeframes.
2. **Customizable Table Display:**
- The indicator provides a table that displays the bias for each selected timeframe, clearly marking whether the market is **Bullish**, **Bearish**, or **Neutral**.
- Users can choose where to place the table on the chart: top-left, top-right, bottom-left, bottom-right, or center positions, allowing for easy and personalized chart management.
3. **Win/Loss Tracker:**
- The table also tracks the **success rate** of **buy** and **sell** trades based on price retests of key bias levels.
- For each period (Day, Week, Month), it tracks how often the price has moved in the direction of the initial bias, counting **Buy Wins**, **Sell Wins**, **Buy Losses**, and **Sell Losses**.
- This helps traders assess the effectiveness of the market bias over time and adjust their strategies accordingly.
#### **How the Success Calculation Determines the Success Rate:**
The **Success Calculation** is designed to track how often the price follows the direction of the market bias. It does this by evaluating how the price retests key levels associated with the identified market bias:
1. **Buy Success Calculation**:
- The success of a **Buy Trade** is determined when the price breaks above the **previous high** after a **bullish bias** has been identified.
- If the price continues to move higher (i.e., makes a new high) after breaking the previous high, the **buy trade is considered successful**.
- The indicator tracks how many times this condition is met and counts it as a **Buy Win**.
2. **Sell Success Calculation**:
- The success of a **Sell Trade** is determined when the price breaks below the **previous low** after a **bearish bias** has been identified.
- If the price continues to move lower (i.e., makes a new low) after breaking the previous low, the **sell trade is considered successful**.
- The indicator tracks how many times this condition is met and counts it as a **Sell Win**.
3. **Failure Calculations**:
- If the price does not move as expected (i.e., it does not continue in the direction of the identified bias), the trade is considered a **loss** and is tracked as **Buy Loss** or **Sell Loss**, depending on whether it was a bullish or bearish trade.
The ENIGMA Indicator keeps a running tally of **Buy Wins**, **Sell Wins**, **Buy Losses**, and **Sell Losses** over a set period (which can be customized to Days, Weeks, or Months). These statistics are updated dynamically in the **Bias Table**, allowing you to track your success rate in real-time and gain insights into the effectiveness of the market bias.
#### **Customizable Period Tracking:**
- The ENIGMA Indicator allows you to set custom tracking periods (e.g., 30 days, 2 weeks, etc.). The performance metrics reset after each tracking period, helping you monitor your success in different market conditions.
5. **Interactive Settings:**
- **Lookback Period**: Define how many bars the indicator should consider for bias calculations.
- **Success Tracking**: Set the number of candles to track for calculating the win/loss performance.
- **Time Threshold**: Set a time threshold to help define the period during which price retests are considered valid.
- **Info Tooltip**: You can enable the information tool in the settings to view detailed explanations of how wins and losses are calculated, ensuring you understand how the indicator works and how the results are derived.
#### **How to Use the ENIGMA Indicator:**
1. **Install the Indicator**:
- Add the ENIGMA Indicator to your chart. It will automatically calculate and display the bias for multiple timeframes.
2. **Interpret the Bias Table**:
- The bias table will show whether the market is **Bullish**, **Bearish**, or **Neutral** across different timeframes.
- Look for alignment between the timeframes—when multiple timeframes show the same bias, it may indicate a stronger trend.
3. **Use the Win/Loss Tracker**:
- Track how well your trades align with the bias using the **Win/Loss Tracker**. This helps you refine your strategy by understanding which timeframes and biases lead to higher success rates.
- For example, if you see a high number of **Buy Wins** and a low number of **Sell Wins**, you may decide to focus more on buying during bullish trends and avoid selling during bearish retracements.
4. **Track Your Period Performance**:
- The indicator will automatically track your performance over the set period (Days, Weeks, Months). Use this data to adjust your approach and evaluate the effectiveness of your trading strategy.
5. **Position the Table**:
- Customize the placement of the table on your chart based on your preferences. You can choose from options like **Top Left**, **Top Right**, **Bottom Left**, **Bottom Right**, or **Center** to keep the chart uncluttered.
6. **Adjust Settings**:
- Modify the indicator settings according to your trading style. You can adjust the **Lookback Period**, **Number of Candles to Track**, and **Time Threshold** to match the pace of your trading.
7. **Use the Info Tooltip**:
- Enable the **Info Tool** in the settings to understand how the Buy/Sell Wins and Losses are calculated. The tooltip provides a breakdown of how the indicator tracks price movements and calculates the success rate.
**Conclusion:**
The **ENIGMA Indicator** is designed to help traders make informed decisions by providing a clear view of the market bias and performance data. With the ability to track bias across multiple timeframes and evaluate your trading success, it can be a powerful tool for refining your trading strategies.
Whether you're looking to focus on a single timeframe or analyze multiple timeframes for a stronger bias, the ENIGMA Indicator adapts to your needs, providing both real-time market insights and performance feedback.
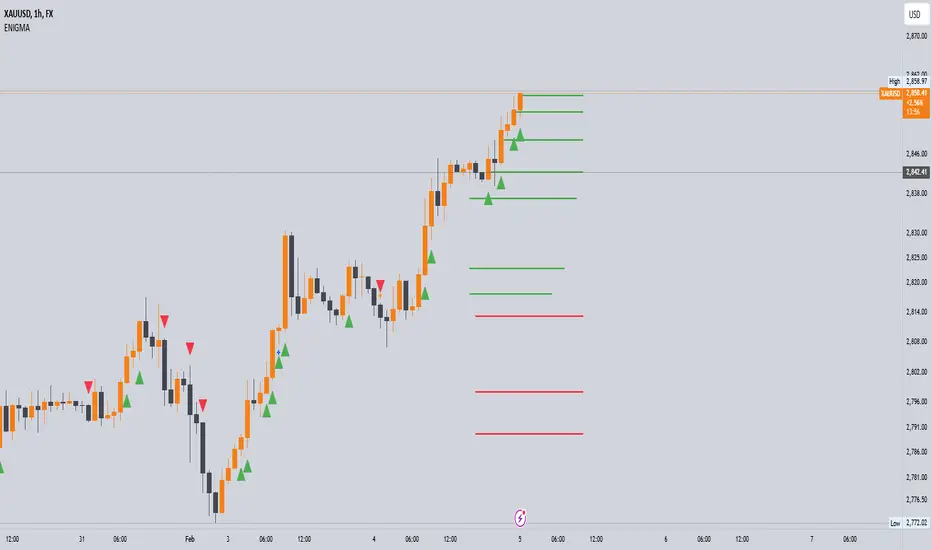
Candlestick Pattern ScannerCandlestick Pattern Scanner
This indicator identifies popular candlestick patterns on the chart and provides visual and alert-based support for traders. Based on technical analysis, it provides insights into potential trend reversals or continuation signals in price action. The following patterns are detected and marked:
1. Bullish Engulfing
Definition: Considered a strong bullish signal. A small red candle is followed by a large green candle that completely engulfs the previous one.
Chart Display: Marked with a green arrow below the price bar.
Alert Message: "Bullish Engulfing Pattern Detected!"
2. Bearish Engulfing
Definition: Considered a strong bearish signal. A small green candle is followed by a large red candle that completely engulfs the previous one.
Chart Display: Marked with a red arrow above the price bar.
Alert Message: "Bearish Engulfing Pattern Detected!"
3. Doji
Definition: Indicates indecision in the market. The candlestick has an opening and closing price that are almost the same, forming a very small body.
Chart Display: Marked with a blue triangle below the price bar.
Alert Message: "Doji Pattern Detected!"
4. Hammer
Definition: Can signal a strong bullish reversal. It has a long lower shadow and a small body, often appearing at the end of a downtrend.
Chart Display: Marked with an orange triangle below the price bar.
Alert Message: "Hammer Pattern Detected!"
5. Shooting Star
Definition: Can signal a strong bearish reversal. It has a long upper shadow and a small body, often appearing at the end of an uptrend.
Chart Display: Marked with a purple triangle above the price bar.
Alert Message: "Shooting Star Pattern Detected!"
Features:
Visual Support: Patterns are clearly marked on the chart using distinct shapes (arrows and triangles).
Alerts: Receive real-time notifications through TradingView’s alert system when a pattern is detected.
Versatility: Useful for identifying both trend reversals and continuation signals.
User-Friendly: Patterns are easily distinguishable with unique color coding.
Purpose:
This indicator helps traders identify potential reversal points or strong trend beginnings in price action. It can be used as a supportive tool in scalping, swing trading, or long-term investment strategies.
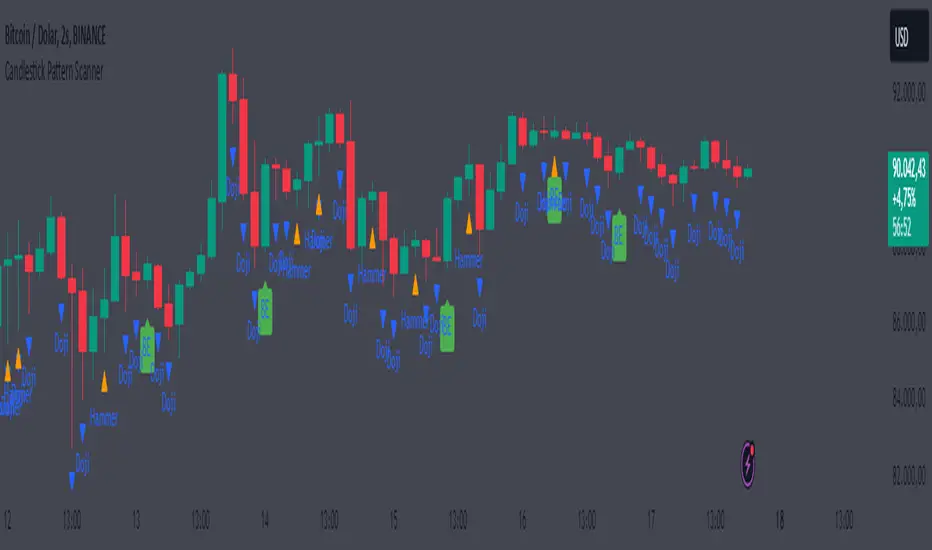
Conditional Value at Risk (CVaR)This Pine Script implements the Conditional Value at Risk (CVaR), a risk metric that evaluates the potential losses in a financial portfolio beyond a certain confidence level, incorporating both the Value at Risk (VaR) and the expected loss given that the VaR threshold has been breached.
Key Features:
Input Parameters:
length: Defines the observation period in days (default is 252, typically used to represent the number of trading days in a year).
confidence: Specifies the confidence interval for calculating VaR and CVaR, with values between 0.5 and 0.99 (default is 0.95, indicating a 95% confidence level).
Logarithmic Returns Calculation: The script computes the logarithmic returns based on the daily closing prices, a common method to measure financial asset returns, given by:
Log Return=ln(PtPt−1)
Log Return=ln(Pt−1Pt)
where PtPt is the price at time tt, and Pt−1Pt−1 is the price at the previous time point.
VaR Calculation: Value at Risk (VaR) is estimated as the percentile of the returns array corresponding to the given confidence interval. This represents the maximum loss expected over a given time horizon under normal market conditions at the specified confidence level.
CVaR Calculation: The Conditional VaR (CVaR) is calculated as the average of the returns that fall below the VaR threshold. This represents the expected loss given that the loss has exceeded the VaR threshold.
Visualization: The script plots two key risk measures:
VaR: The maximum potential loss at the specified confidence level.
CVaR: The average of the losses beyond the VaR threshold.
The script also includes a neutral line at zero to help visualize the losses and their magnitude.
Source and Scientific Background:
The concept of Value at Risk (VaR) was popularized by J.P. Morgan in the 1990s, and it has since become a widely-used tool for risk management (Jorion, 2007). Conditional Value at Risk (CVaR), also known as Expected Shortfall, addresses the limitation of VaR by considering the severity of losses beyond the VaR threshold (Rockafellar & Uryasev, 2002). CVaR provides a more comprehensive risk measure, especially in extreme tail risk scenarios.
References:
Jorion, P. (2007). Value at Risk: The New Benchmark for Managing Financial Risk. McGraw-Hill Education.
Rockafellar, R.T., & Uryasev, S. (2002). Conditional Value-at-Risk for General Loss Distributions. Journal of Banking & Finance, 26(7), 1443–1471.

Systematic Investment Tracker by Ceyhun Gonul### English Description
**Systematic Investment Tracker with Enhanced Features**
This script, titled **Systematic Investment Tracker with Enhanced Features**, is a TradingView tool designed to support systematic investments across different market conditions. It provides traders with two customizable investment strategies — **Continuous Buying** and **Declining Buying** — and includes advanced dynamic investment adjustment features for each.
#### Detailed Explanation of Script Features and Originality
1. **Two Investment Strategies**:
- **Continuous Buying**: This strategy performs purchases consistently at each interval, as set by the user, regardless of market price changes. It follows the principle of dollar-cost averaging, allowing users to build an investment position over time.
- **Declining Buying**: Unlike Continuous Buying, this strategy triggers purchases only when the asset's price has declined from the previous interval's closing price. This approach helps users capitalize on lower price points, potentially improving average costs during downward trends.
2. **Dynamic Investment Adjustment**:
- For both strategies, the script includes a **Dynamic Investment Adjustment** feature. If enabled, this feature increases the purchasing amount by 50% if the current price has fallen by a specific user-defined percentage relative to the previous price. This allows users to accumulate a larger position when the asset is declining, which may benefit long-term cost-averaging strategies.
3. **Customizable Time Frames**:
- Users can specify a **start and end date** for investment, allowing them to restrict or backtest strategies within a specific timeframe. This feature is valuable for evaluating strategy performance over specific market cycles or historical periods.
4. **Graphical Indicators and Labels**:
- The script provides graphical labels on the chart that display purchase points. These indicators help users visualize their investment entries based on the strategy selected.
- A summary **performance label** is also displayed, providing real-time updates on the total amount spent, accumulated quantity, average cost, portfolio value, and profit percentage for each strategy.
5. **Language Support**:
- The script includes English and Turkish language options. Users can toggle between these languages, allowing the summary label text and descriptions to be displayed in their preferred language.
6. **Performance Comparison Table**:
- An optional **Performance Comparison Table** is available, offering a side-by-side analysis of net profit, total investment, and profit percentage for both strategies. This comparison table helps users assess which strategy has yielded better returns, providing clarity on each approach's effectiveness under the chosen parameters.
#### How the Script Works and Its Uniqueness
This closed-source script brings together two established investment strategies in a single, dynamic tool. By integrating continuous and declining purchase strategies with advanced settings for dynamic investment adjustment, the script offers a powerful, flexible tool for both passive and active investors. The design of this script provides unique benefits:
- Enables automated, systematic investment tracking, allowing users to build positions gradually.
- Empowers users to leverage declines through dynamic adjustments to optimize average cost over time.
- Presents an easy-to-read performance label and table, enabling an efficient and transparent performance comparison for informed decision-making.
---
### Türkçe Açıklama
**Gelişmiş Özellikli Sistematik Yatırım Takipçisi**
**Gelişmiş Özellikli Sistematik Yatırım Takipçisi** adlı bu TradingView scripti, çeşitli piyasa koşullarında sistematik yatırım stratejilerini desteklemek üzere tasarlanmış bir araçtır. Script, kullanıcıya iki özelleştirilebilir yatırım stratejisi — **Sürekli Alım** ve **Düşen Alım** — ve her strateji için gelişmiş dinamik yatırım ayarlama seçenekleri sunar.
#### Script Özelliklerinin Detaylı Açıklaması ve Özgünlük
1. **İki Yatırım Stratejisi**:
- **Sürekli Alım**: Bu strateji, fiyat değişimlerine bakılmaksızın kullanıcının belirlediği her aralıkta sabit bir miktar yatırım yapar. Bu yaklaşım, uzun vadede pozisyonu kademeli olarak oluşturmak isteyenler için idealdir.
- **Düşen Alım**: Sürekli Alım’ın aksine, bu strateji yalnızca fiyat bir önceki aralığın kapanış fiyatına göre düştüğünde alım yapar. Bu yöntem, yatırımcıların daha düşük fiyatlardan alım yaparak ortalama maliyeti potansiyel olarak iyileştirmelerine yardımcı olur.
2. **Dinamik Yatırım Ayarlaması**:
- Her iki strateji için de **Dinamik Yatırım Ayarlaması** özelliği bulunmaktadır. Bu özellik aktif edildiğinde, mevcut fiyatın bir önceki fiyata göre kullanıcı tarafından belirlenen bir yüzde oranında düşmesi durumunda alım miktarını %50 artırır. Bu durum, uzun vadede maliyet ortalaması stratejilerine katkıda bulunur.
3. **Özelleştirilebilir Tarih Aralığı**:
- Kullanıcılar, yatırımı belirli bir tarih aralığında sınırlandırmak veya test etmek için bir **başlangıç ve bitiş tarihi** belirleyebilir. Bu özellik, strateji performansını geçmiş piyasa döngüleri veya belirli dönemlerde değerlendirmek için kullanışlıdır.
4. **Grafiksel İşaretleyiciler ve Etiketler**:
- Script, grafik üzerinde alım noktalarını gösteren işaretleyiciler sağlar. Bu görsel göstergeler, kullanıcıların seçilen stratejiye göre yatırım girişlerini görselleştirmesine yardımcı olur.
- Ayrıca, her strateji için harcanan toplam tutar, biriken miktar, ortalama maliyet, portföy değeri ve kâr yüzdesi gibi bilgileri gerçek zamanlı olarak gösteren bir **performans etiketi** sunar.
5. **Dil Desteği**:
- Script, İngilizce ve Türkçe dillerini desteklemektedir. Kullanıcılar, performans etiketi metninin ve açıklamalarının tercih ettikleri dilde görüntülenmesi için dil seçimini yapabilir.
6. **Performans Karşılaştırma Tablosu**:
- İsteğe bağlı olarak kullanılabilen bir **Performans Karşılaştırma Tablosu**, her iki strateji için net kâr, toplam yatırım ve kâr yüzdesi gibi bilgileri yan yana analiz eder. Bu tablo, kullanıcıların hangi stratejinin daha yüksek getiri sağladığını değerlendirmesine yardımcı olur.
#### Scriptin Çalışma Prensibi ve Özgünlüğü
Bu script, iki yatırım stratejisini gelişmiş bir araçta birleştirir. Sürekli ve düşen fiyatlara dayalı alım stratejilerini dinamik yatırım ayarlama özelliğiyle entegre ederek yatırımcılar için güçlü ve esnek bir çözüm sunar. Script’in tasarımı aşağıdaki benzersiz faydaları sağlamaktadır:
- Otomatik, sistematik yatırım takibi yaparak kullanıcıların pozisyonlarını kademeli olarak oluşturmalarına olanak tanır.
- Dinamik ayarlama ile düşüşlerden yararlanarak zaman içinde ortalama maliyeti optimize etme olanağı sağlar.
- Her iki stratejinin performansını basit ve anlaşılır bir şekilde karşılaştıran etiket ve tablo ile verimli bir performans değerlendirmesi sunar.
