Balanced Delta Volume Profile (Zeiierman)█ Overview
Balanced Delta Volume Profile (Zeiierman) builds a vertical, price-by-price profile that blends total participation with balance quality. Instead of plotting raw volume alone, it weights each price bin by:
how balanced buyers vs. sellers were,
how compressed price was inside that bin,
how often price revisited it.
The result spotlights fair value and acceptance zones while still revealing momentum/imbalance areas—ideal for reading rotation vs. trend, continuation vs. exhaustion, and the prices that truly matter.
Highlights
Balanced score that fuses delta symmetry, price compression, and hit frequency.
Optional heat spectrum for instant read of participation density and balance strength.
POC-like auto highlight of the dominant price level within the lookback window.
Works across timeframes for session profiling, swing context, or regime shifts.
█ How It Works
⚪ Profile Construction
The script scans a fixed History Length and divides the full high–low span into Bin Count price bins. For every bar in the window, its volume is proportionally distributed across the bins it overlaps, so wide-range bars contribute across multiple bins, while narrow bars concentrate where they traded most. This yields per-bin totals for:
Total Volume (participation)
Positive / Negative Volume (up vs. down bar contribution)
Hit Count (how often price touched the bin)
Average Price Range (mean bar range inside the bin; a proxy for compression)
⚪ Delta & Direction
For each bin, delta symmetry is measured via the ratio of |pos − neg| to total volume. Bins with balanced two-sided flow score higher than one-sided, runaway bins. This curbs the tendency of raw volume profiles to over-reward impulsive bursts.
⚪ Balance Score
Each price bin gets a balance score that multiplies three normalized components:
Delta Balance: rewards bins where buy/sell pressure is symmetrical (configurable via Volume Momentum Weight).
Price Compression: rewards bins where average bar range is relatively small (configurable via Price Momentum Weight).
Durability: rewards bins revisited often (configurable via Hits Weight).
A Min Hits Filter removes flimsy, single-touch bins from dominating the score. The profile can display pure totals or Average Mode (Vol/Hit) to compare bins fairly when hit counts differ.
⚪ Display & Heat Spectrum
The final plotted bar length per bin is the display volume (total or average) weighted by the balance score and normalized to 100.
POC-like Highlight: The 100% bin is outlined (and labeled) when Highlight Max Volume Bin is ON.
Heat Spectrum (optional): A background gradient scales with normalized bar length and balance hue.
Balance Hue: Interpolates between Balance Low/High Colors so high-balance bins visually pop as “accepted value.”
█ How to Use
The profile is effectively a map of price acceptance:
High, bright bars = strong participation at balanced prices → fair value/rotation zones.
Thin, muted bars = poor acceptance → imbalance or transition areas.
POC-style level = most influential price in the lookback window.
⚪ Find Fair Value & Acceptance
Thick, high-balance bins mark value. Expect rotation: price often revisits or oscillates around these areas. They’re prime zones for mean-reversion fades, scale-ins, and risk-defined trades against the edges.
⚪ Identify Imbalance & Funnels
Low-balance, low-hit bins often act like air pockets—price can move through them quickly. These zones are helpful for continuation trades into thin areas or for timing breakout pulls back into acceptance.
⚪ POC Dynamics
When price leaves the POC and returns, watch for re-acceptance (price comes back into the POC or high-balance zone and stays there.) vs. rejection (trend continuation away from value). The auto-highlight makes this quick to judge.
█ Settings
History Length – Bars scanned for the profile. Longer = broader context, slower to adapt.
Bin Count – Vertical resolution of bins between the window’s min and max price.
Display Shift – Offsets the rendering rightward for clarity.
Average Mode (Vol/Hit) – ON uses average volume per visit; OFF uses total volume.
Volume Momentum Weight – Emphasizes two-way flow; higher values favor balanced bins over one-sided deltas.
Price Momentum Weight – Emphasizes compression; higher values favor narrow-range, coiling price action.
Hits Weight – Rewards bins revisited often; higher values favor durable acceptance.
Min Hits Filter – Minimum visits a bin needs to qualify for the balance score.
Show Heat Spectrum – Background gradient for quick read of density and balance.
Highlight Max Volume Bin – Outline + raw volume label for the dominant bin.
Max Volume Color – Color used for that highlight.
Balance Low/High Colors – Gradient endpoints for balance hue across the profile.
-----------------
Disclaimer
The content provided in my scripts, indicators, ideas, algorithms, and systems is for educational and informational purposes only. It does not constitute financial advice, investment recommendations, or a solicitation to buy or sell any financial instruments. I will not accept liability for any loss or damage, including without limitation any loss of profit, which may arise directly or indirectly from the use of or reliance on such information.
All investments involve risk, and the past performance of a security, industry, sector, market, financial product, trading strategy, backtest, or individual's trading does not guarantee future results or returns. Investors are fully responsible for any investment decisions they make. Such decisions should be based solely on an evaluation of their financial circumstances, investment objectives, risk tolerance, and liquidity needs.
Cerca negli script per "high low"

FVG MagicFVG Magic — Fair Value Gaps with Smart Mitigation, Inversion & Auto-Clean-up
FVG Magic finds every tradable Fair Value Gap (FVG), shows who powered it, and then manages each gap intelligently as price interacts with it—so your chart stays actionable and clean.
Attribution
This tool is inspired by the idea popularized in “Volumatic Fair Value Gaps ” by BigBeluga (licensed CC BY-NC-SA 4.0). Credit to BigBeluga for advancing FVG visualization in the community.
Important: This is a from-scratch implementation—no code was copied from the original. I expanded the concept substantially with a different detection stack, a gap state machine (ACTIVE → 50% SQ → MITIGATED → INVERSED), auto-clean up rules, lookback/nearest-per-side pruning, zoom-proof volume meters, and timeframe auto-tuning for 15m/H1/H4.
What makes this version more accurate
Full-coverage detection (no “missed” gaps)
Default ICT-minimal rule (Bullish: low > high , Bearish: high < low ) catches all valid 3-candle FVGs.
Optional Strict filter (stricter structure checks) for traders who prefer only “clean” gaps.
Optional size percentile filter—off by default so nothing is hidden unless you choose to filter.
Correct handling of confirmations (wick vs close)
Mitigation Source is user-selectable: high/low (wick-based) or close (strict).
This avoids false “misses” when you expect wick confirmations (50% or full fill) but your logic required closes.
State-aware labelling to prevent misleading data
The Bull%/Bear% meter is shown only while a gap is ACTIVE.
As soon as a gap is 50% SQ, MITIGATED, or INVERSED, the meter is hidden and replaced with a clear tag—so you never read stale participation stats.
Robust zoom behaviour
The meter uses a fixed bar-width (not pixels), so it stays proportional and readable at any zoom level.
Deterministic lifecycle (no stale boxes)
Remove on 50% SQ (instant or delayed).
Inversion window after first entry: if price enters but doesn’t invert within N bars, the box auto-removes once fully filled.
Inversion clean up: after a confirmed flip, keep for N bars (context) then delete (or 0 = immediate).
Result: charts auto-maintain themselves and never “lie” about relevance.
Clarity near current price
Nearest-per-side (keep N closest bullish & bearish gaps by distance to the midpoint) focuses attention where it matters without altering detection accuracy.
Lookback (bars) ensures reproducible behaviour across accounts with different data history.
Timeframe-aware defaults
Sensible auto-tuning for 15m / H1 / H4 (right-extension length, meter width, inversion windows, clean up bars) to reduce setup friction and improve consistency.
What it does (under the hood)
Detects FVGs using ICT-minimal (default) or a stricter rule.
Samples volume from a 10× lower timeframe to split participation into Bull % / Bear % (sum = 100%).
Manages each gap through a state machine:
ACTIVE → 50% SQ (midline) → MITIGATED (full) → INVERSED (SR flip after fill).
Auto-clean up keeps only relevant levels, per your rules.
Dashboard (top-right) displays counts by side and the active state tags.
How to use it
First run (show everything)
Use Strict FVG Filter: OFF
Enable Size Filter (percentile): OFF
Mitigation Source: high/low (wick-based) or close (stricter), as you prefer.
Remove on 50% SQ: ON, Delay: 0
Read the context
While ACTIVE, use the Bull%/Bear% meter to gauge demand/supply behind the impulse that created the gap.
Confluence with your HTF structure, sessions, VWAP, OB/FVG, RSI/MACD, etc.
Trade interactions
50% SQ: often the highest-quality interaction; if removal is ON, the box clears = “job done.”
Full mitigation then rejection through the other side → tag changes to INVERSED (acts like SR). Keep for N bars, then auto-remove.
Keep the chart tidy (optional)
If too busy, enable Size Filter or set Nearest per side to 2–4.
Use Lookback (bars) to make behaviour consistent across symbols and histories.
Inputs (key ones)
Use Strict FVG Filter: OFF(default)/ON
Enable Size Filter (percentile): OFF(default)/ON + threshold
Mitigation Source: high/low or close
Remove on 50% SQ + Delay
Inversion window after entry (bars)
Remove inversed after (bars)
Lookback (bars), Nearest per side (N)
Right Extension Bars, Max FVGs, Meter width (bars)
Colours: Bullish, Bearish, Inversed fill
Suggested defaults (per TF)
15m: Extension 50, Max 12, Inversion window 8, Clean up 8, Meter width 20
H1: Extension 25, Max 10, Inversion window 6, Clean up 6, Meter width 15
H4: Extension 15, Max 8, Inversion window 5, Clean up 5, Meter width 10
Notes & edge cases
If a wick hits 50% or the far edge but state doesn’t change, you’re likely on close mode—switch to high/low for wick-based behaviour.
If a gap disappears, it likely met a clean up condition (50% removal, inversion window, inversion clean up, nearest-per-side, lookback, or max-cap).
Meters are hidden after ACTIVE to avoid stale percentages.

Buying/Selling PressureBuying/Selling Pressure - Volume-Based Market Sentiment
Buying/Selling Pressure identifies market dominance by separating volume into buying and selling components. The indicator uses Volume ATR normalization to create a universal pressure oscillator that works consistently across all markets and timeframes.
What is Buying/Selling Pressure?
This indicator answers a fundamental question: Are buyers or sellers in control? By analyzing how volume distributes within each bar, it calculates cumulative buying and selling pressure, then normalizes the result using Volume ATR for cross-market comparability.
Formula: × 100
Where Delta = Buying Volume - Selling Volume
Calculation Methods
Money Flow (Recommended):
Volume weighted by close position in bar range. Close near high = buying pressure, close near low = selling pressure.
Formula: / (high - low)
Simple Delta:
Basic approach where bullish bars = 100% buying, bearish bars = 100% selling.
Weighted Delta:
Volume weighted by body size relative to total range, focusing on candle strength.
Key Features
Volume ATR Normalization: Adapts to volume volatility for consistent readings across assets
Cumulative Delta: Tracks net buying/selling pressure over time (similar to OBV)
Signal Line: EMA smoothing for trend identification and crossover signals
Zero Line: Clear visual separation between buyer and seller dominance
Color-Coded Display: Green area = buyers control, red area = sellers control
Interpretation
Above Zero: Buyers dominating - cumulative buying pressure exceeds selling
Below Zero: Sellers dominating - cumulative selling pressure exceeds buying
Cross Signal Line: Momentum shift - pressure trend changing direction
Increasing Magnitude: Strengthening pressure in current direction
Decreasing Magnitude: Weakening pressure, potential reversal
Volume vs Pressure
High volume with low pressure indicates balanced battle between buyers and sellers. High pressure with high volume confirms strong directional conviction. This separation provides insights beyond traditional volume analysis.
Best Practices
Use with price action for confirmation
Divergences signal potential reversals (price makes new high/low but pressure doesn't)
Large volume with near-zero pressure = indecision, breakout preparation
Signal line crossovers provide momentum change signals
Extreme readings suggest potential exhaustion
Settings
Calculation Method: Choose Money Flow, Simple Delta, or Weighted Delta
EMA Length: Period for cumulative delta smoothing (default: 21)
Signal Line: Optional EMA of oscillator for crossover signals (default: 9)
Buying/Selling Pressure transforms volume analysis into actionable market sentiment, revealing whether buyers or sellers control price action beneath surface volatility.
This indicator is designed for educational and analytical purposes. Past performance does not guarantee future results. Always conduct thorough research and consider consulting with financial professionals before making investment decisions.

Historical Matrix Analyzer [PhenLabs]📊Historical Matrix Analyzer
Version: PineScriptv6
📌Description
The Historical Matrix Analyzer is an advanced probabilistic trading tool that transforms technical analysis into a data-driven decision support system. By creating a comprehensive 56-cell matrix that tracks every combination of RSI states and multi-indicator conditions, this indicator reveals which market patterns have historically led to profitable outcomes and which have not.
At its core, the indicator continuously monitors seven distinct RSI states (ranging from Extreme Oversold to Extreme Overbought) and eight unique indicator combinations (MACD direction, volume levels, and price momentum). For each of these 56 possible market states, the system calculates average forward returns, win rates, and occurrence counts based on your configurable lookback period. The result is a color-coded probability matrix that shows you exactly where you stand in the historical performance landscape.
The standout feature is the Current State Panel, which provides instant clarity on your active market conditions. This panel displays signal strength classifications (from Strong Bullish to Strong Bearish), the average return percentage for similar past occurrences, an estimated win rate using Bayesian smoothing to prevent small-sample distortions, and a confidence level indicator that warns you when insufficient data exists for reliable conclusions.
🚀Points of Innovation
Multi-dimensional state classification combining 7 RSI levels with 8 indicator combinations for 56 unique trackable market conditions
Bayesian win rate estimation with adjustable smoothing strength to provide stable probability estimates even with limited historical samples
Real-time active cell highlighting with “NOW” marker that visually connects current market conditions to their historical performance data
Configurable color intensity sensitivity allowing traders to adjust heat-map responsiveness from conservative to aggressive visual feedback
Dual-panel display system separating the comprehensive statistics matrix from an easy-to-read current state summary panel
Intelligent confidence scoring that automatically warns traders when occurrence counts fall below reliable thresholds
🔧Core Components
RSI State Classification: Segments RSI readings into 7 distinct zones (Extreme Oversold <20, Oversold 20-30, Weak 30-40, Neutral 40-60, Strong 60-70, Overbought 70-80, Extreme Overbought >80) to capture momentum extremes and transitions
Multi-Indicator Condition Tracking: Simultaneously monitors MACD crossover status (bullish/bearish), volume relative to moving average (high/low), and price direction (rising/falling) creating 8 binary-encoded combinations
Historical Data Storage Arrays: Maintains rolling lookback windows storing RSI states, indicator states, prices, and bar indices for precise forward-return calculations
Forward Performance Calculator: Measures price changes over configurable forward bar periods (1-20 bars) from each historical state, accumulating total returns and win counts per matrix cell
Bayesian Smoothing Engine: Applies statistical prior assumptions (default 50% win rate) weighted by user-defined strength parameter to stabilize estimated win rates when sample sizes are small
Dynamic Color Mapping System: Converts average returns into color-coded heat map with intensity adjusted by sensitivity parameter and transparency modified by confidence levels
🔥Key Features
56-Cell Probability Matrix: Comprehensive grid displaying every possible combination of RSI state and indicator condition, with each cell showing average return percentage, estimated win rate, and occurrence count for complete statistical visibility
Current State Info Panel: Dedicated display showing your exact position in the matrix with signal strength emoji indicators, numerical statistics, and color-coded confidence warnings for immediate situational awareness
Customizable Lookback Period: Adjustable historical window from 50 to 500 bars allowing traders to focus on recent market behavior or capture longer-term pattern stability across different market cycles
Configurable Forward Performance Window: Select target holding periods from 1 to 20 bars ahead to align probability calculations with your trading timeframe, whether day trading or swing trading
Visual Heat Mapping: Color-coded cells transition from red (bearish historical performance) through gray (neutral) to green (bullish performance) with intensity reflecting statistical significance and occurrence frequency
Intelligent Data Filtering: Minimum occurrence threshold (1-10) removes unreliable patterns with insufficient historical samples, displaying gray warning colors for low-confidence cells
Flexible Layout Options: Independent positioning of statistics matrix and info panel to any screen corner, accommodating different chart layouts and personal preferences
Tooltip Details: Hover over any matrix cell to see full RSI label, complete indicator status description, precise average return, estimated win rate, and total occurrence count
🎨Visualization
Statistics Matrix Table: A 9-column by 8-row grid with RSI states labeling vertical axis and indicator combinations on horizontal axis, using compact abbreviations (XOverS, OverB, MACD↑, Vol↓, P↑) for space efficiency
Active Cell Indicator: The current market state cell displays “⦿ NOW ⦿” in yellow text with enhanced color saturation to immediately draw attention to relevant historical performance
Signal Strength Visualization: Info panel uses emoji indicators (🔥 Strong Bullish, ✅ Bullish, ↗️ Weak Bullish, ➖ Neutral, ↘️ Weak Bearish, ⛔ Bearish, ❄️ Strong Bearish, ⚠️ Insufficient Data) for rapid interpretation
Histogram Plot: Below the price chart, a green/red histogram displays the current cell’s average return percentage, providing a time-series view of how historical performance changes as market conditions evolve
Color Intensity Scaling: Cell background transparency and saturation dynamically adjust based on both the magnitude of average returns and the occurrence count, ensuring visual emphasis on reliable patterns
Confidence Level Display: Info panel bottom row shows “High Confidence” (green), “Medium Confidence” (orange), or “Low Confidence” (red) based on occurrence counts relative to minimum threshold multipliers
📖Usage Guidelines
RSI Period
Default: 14
Range: 1 to unlimited
Description: Controls the lookback period for RSI momentum calculation. Standard 14-period provides widely-recognized overbought/oversold levels. Decrease for faster, more sensitive RSI reactions suitable for scalping. Increase (21, 28) for smoother, longer-term momentum assessment in swing trading. Changes affect how quickly the indicator moves between the 7 RSI state classifications.
MACD Fast Length
Default: 12
Range: 1 to unlimited
Description: Sets the faster exponential moving average for MACD calculation. Standard 12-period setting works well for daily charts and captures short-term momentum shifts. Decreasing creates more responsive MACD crossovers but increases false signals. Increasing smooths out noise but delays signal generation, affecting the bullish/bearish indicator state classification.
MACD Slow Length
Default: 26
Range: 1 to unlimited
Description: Defines the slower exponential moving average for MACD calculation. Traditional 26-period setting balances trend identification with responsiveness. Must be greater than Fast Length. Wider spread between fast and slow increases MACD sensitivity to trend changes, impacting the frequency of indicator state transitions in the matrix.
MACD Signal Length
Default: 9
Range: 1 to unlimited
Description: Smoothing period for the MACD signal line that triggers bullish/bearish state changes. Standard 9-period provides reliable crossover signals. Shorter values create more frequent state changes and earlier signals but with more whipsaws. Longer values produce more confirmed, stable signals but with increased lag in detecting momentum shifts.
Volume MA Period
Default: 20
Range: 1 to unlimited
Description: Lookback period for volume moving average used to classify volume as “high” or “low” in indicator state combinations. 20-period default captures typical monthly trading patterns. Shorter periods (10-15) make volume classification more reactive to recent spikes. Longer periods (30-50) require more sustained volume changes to trigger state classification shifts.
Statistics Lookback Period
Default: 200
Range: 50 to 500
Description: Number of historical bars used to calculate matrix statistics. 200 bars provides substantial data for reliable patterns while remaining responsive to regime changes. Lower values (50-100) emphasize recent market behavior and adapt quickly but may produce volatile statistics. Higher values (300-500) capture long-term patterns with stable statistics but slower adaptation to changing market dynamics.
Forward Performance Bars
Default: 5
Range: 1 to 20
Description: Number of bars ahead used to calculate forward returns from each historical state occurrence. 5-bar default suits intraday to short-term swing trading (5 hours on hourly charts, 1 week on daily charts). Lower values (1-3) target short-term momentum trades. Higher values (10-20) align with position trading and longer-term pattern exploitation.
Color Intensity Sensitivity
Default: 2.0
Range: 0.5 to 5.0, step 0.5
Description: Amplifies or dampens the color intensity response to average return magnitudes in the matrix heat map. 2.0 default provides balanced visual emphasis. Lower values (0.5-1.0) create subtle coloring requiring larger returns for full saturation, useful for volatile instruments. Higher values (3.0-5.0) produce vivid colors from smaller returns, highlighting subtle edges in range-bound markets.
Minimum Occurrences for Coloring
Default: 3
Range: 1 to 10
Description: Required minimum sample size before applying color-coded performance to matrix cells. Cells with fewer occurrences display gray “insufficient data” warning. 3-occurrence default filters out rare patterns. Lower threshold (1-2) shows more data but includes unreliable single-event statistics. Higher thresholds (5-10) ensure only well-established patterns receive visual emphasis.
Table Position
Default: top_right
Options: top_left, top_right, bottom_left, bottom_right
Description: Screen location for the 56-cell statistics matrix table. Position to avoid overlapping critical price action or other indicators on your chart. Consider chart orientation and candlestick density when selecting optimal placement.
Show Current State Panel
Default: true
Options: true, false
Description: Toggle visibility of the dedicated current state information panel. When enabled, displays signal strength, RSI value, indicator status, average return, estimated win rate, and confidence level for active market conditions. Disable to declutter charts when only the matrix table is needed.
Info Panel Position
Default: bottom_left
Options: top_left, top_right, bottom_left, bottom_right
Description: Screen location for the current state information panel (when enabled). Position independently from statistics matrix to optimize chart real estate. Typically placed opposite the matrix table for balanced visual layout.
Win Rate Smoothing Strength
Default: 5
Range: 1 to 20
Description: Controls Bayesian prior weighting for estimated win rate calculations. Acts as virtual sample size assuming 50% win rate baseline. Default 5 provides moderate smoothing preventing extreme win rate estimates from small samples. Lower values (1-3) reduce smoothing effect, allowing win rates to reflect raw data more directly. Higher values (10-20) increase conservatism, pulling win rate estimates toward 50% until substantial evidence accumulates.
✅Best Use Cases
Pattern-based discretionary trading where you want historical confirmation before entering setups that “look good” based on current technical alignment
Swing trading with holding periods matching your forward performance bar setting, using high-confidence bullish cells as entry filters
Risk assessment and position sizing, allocating larger size to trades originating from cells with strong positive average returns and high estimated win rates
Market regime identification by observing which RSI states and indicator combinations are currently producing the most reliable historical patterns
Backtesting validation by comparing your manual strategy signals against the historical performance of the corresponding matrix cells
Educational tool for developing intuition about which technical condition combinations have actually worked versus those that feel right but lack historical evidence
⚠️Limitations
Historical patterns do not guarantee future performance, especially during unprecedented market events or regime changes not represented in the lookback period
Small sample sizes (low occurrence counts) produce unreliable statistics despite Bayesian smoothing, requiring caution when acting on low-confidence cells
Matrix statistics lag behind rapidly changing market conditions, as the lookback period must accumulate new state occurrences before updating performance data
Forward return calculations use fixed bar periods that may not align with actual trade exit timing, support/resistance levels, or volatility-adjusted profit targets
💡What Makes This Unique
Multi-Dimensional State Space: Unlike single-indicator tools, simultaneously tracks 56 distinct market condition combinations providing granular pattern resolution unavailable in traditional technical analysis
Bayesian Statistical Rigor: Implements proper probabilistic smoothing to prevent overconfidence from limited data, a critical feature missing from most pattern recognition tools
Real-Time Contextual Feedback: The “NOW” marker and dedicated info panel instantly connect current market conditions to their historical performance profile, eliminating guesswork
Transparent Occurrence Counts: Displays sample sizes directly in each cell, allowing traders to judge statistical reliability themselves rather than hiding data quality issues
Fully Customizable Analysis Window: Complete control over lookback depth and forward return horizons lets traders align the tool precisely with their trading timeframe and strategy requirements
🔬How It Works
1. State Classification and Encoding
Each bar’s RSI value is evaluated and assigned to one of 7 discrete states based on threshold levels (0: <20, 1: 20-30, 2: 30-40, 3: 40-60, 4: 60-70, 5: 70-80, 6: >80)
Simultaneously, three binary conditions are evaluated: MACD line position relative to signal line, current volume relative to its moving average, and current close relative to previous close
These three binary conditions are combined into a single indicator state integer (0-7) using binary encoding, creating 8 possible indicator combinations
The RSI state and indicator state are stored together, defining one of 56 possible market condition cells in the matrix
2. Historical Data Accumulation
As each bar completes, the current state classification, closing price, and bar index are stored in rolling arrays maintained at the size specified by the lookback period
When the arrays reach capacity, the oldest data point is removed and the newest added, creating a sliding historical window
This continuous process builds a comprehensive database of past market conditions and their subsequent price movements
3. Forward Return Calculation and Statistics Update
On each bar, the indicator looks back through the stored historical data to find bars where sufficient forward bars exist to measure outcomes
For each historical occurrence, the price change from that bar to the bar N periods ahead (where N is the forward performance bars setting) is calculated as a percentage return
This percentage return is added to the cumulative return total for the specific matrix cell corresponding to that historical bar’s state classification
Occurrence counts are incremented, and wins are tallied for positive returns, building comprehensive statistics for each of the 56 cells
The Bayesian smoothing formula combines these raw statistics with prior assumptions (neutral 50% win rate) weighted by the smoothing strength parameter to produce estimated win rates that remain stable even with small samples
💡Note:
The Historical Matrix Analyzer is designed as a decision support tool, not a standalone trading system. Best results come from using it to validate discretionary trade ideas or filter systematic strategy signals. Always combine matrix insights with proper risk management, position sizing rules, and awareness of broader market context. The estimated win rate feature uses Bayesian statistics specifically to prevent false confidence from limited data, but no amount of smoothing can create reliable predictions from fundamentally insufficient sample sizes. Focus on high-confidence cells (green-colored confidence indicators) with occurrence counts well above your minimum threshold for the most actionable insights.

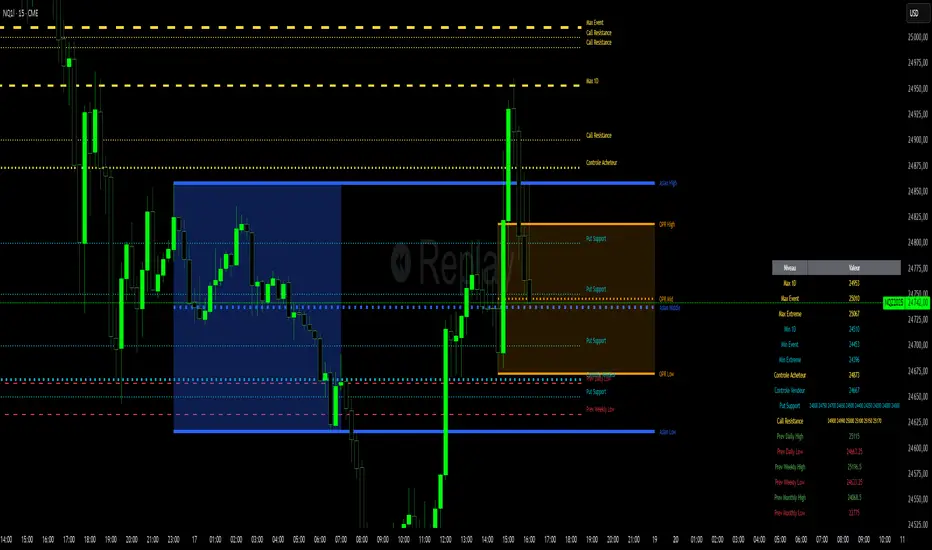
Niv Deal + Previ D W M + OPR + Asian🧭 Indicator Description (English)
Name: Niveaux Dealers + Previous D/W/M Auto + OPR + Asian Session
Platform: TradingView (Pine Script v6)
Type: Multi-module visual indicator for market structure and session ranges
🧩 Overview
This indicator combines three complementary modules to help traders visualize key market levels, opening ranges, and session dynamics — all in one comprehensive tool.
It is designed primarily for index and futures trading (e.g. NQ, ES, DAX), but can be applied to any market or timeframe.
MODULE 1 — Dealers Levels + Previous High/Low (Auto)
This first module automatically extracts and plots custom Dealer Levels and Previous Period Levels.
It can parse manually entered price levels (from a single text input) such as daily max/min, control levels, put supports, and call resistances — then draw horizontal lines and labels on the chart.
Features:
One text input for all dealer levels (easy copy-paste format).
Automatic parsing of prices from text (ignores irrelevant characters).
Groups of levels:
Maxima (Max 1D / Event / Extreme)
Minima (Min 1D / Event / Extreme)
Buyer/Seller Controls
Put Supports and Call Resistances
Independent color, style, and width for each line.
Transparent rectangular labels positioned perfectly on the levels.
Previous Daily, Weekly, and Monthly High/Low levels added automatically.
Optional summary table showing all levels and values in real time.
MODULE 2 — OPR (Opening Price Range)
The second module highlights the Opening Price Range, defined by the first 15 minutes (or any chosen period) of the trading session.
Features:
Fully configurable start and end time (local chart timezone).
Displays:
High, Low, and Midline (median)
Optional rectangle between high/low
Optional labels on each line
Independent color, line style, and thickness.
Works perfectly with non-standard sessions (e.g. 13:30–22:00 UTC for U.S. futures).
Uses local chart time instead of exchange time for intuitive control.
MODULE 3 — Asian Session Range
The third module draws the Asian trading session range, automatically detecting price action between configurable hours (default 17:00 → 01:00).
Features:
Adjustable start and end time (supports overnight sessions).
Plots Asian High, Asian Low, and Asian Middle (mid-range line).
Highlights the Asian box area with semi-transparent color.
Optional labels at the end of each level.
Fully synchronized with the chart’s local timezone (same logic as OPR).
Simple toggle to enable or disable the entire Asian module.
⚙️ Customization & Display
Each module can be toggled independently.
Colors, line styles (solid, dashed, dotted), and thickness are customizable.
Label visibility and extensions (left/right) can be adjusted.
The indicator is lightweight and optimized for real-time performance.
💡 Use Case
Traders can use this multi-module setup to:
Identify dealer reaction zones and institutional levels.
Track previous highs/lows for potential liquidity sweeps.
Monitor session ranges (Opening and Asian) for volatility shifts.
Combine all three perspectives (Dealer, Session, Historical) into one unified view.
Would you like me to rewrite this description in TradingView publication form
GRG/RGR Signal, MA, Ranges and PivotsThis indicator is a combination of several indicators.
It is a combination of two of my indicators which I solely use for trading
1. EMA 10-20-50-200, Pivots and Previous Day/Week/Month range
2. 3/4-Bar GRG / RGR Pattern (Conditional 4th Candle)
You can use them individually if you already have some of them or just use this one. Belive me when I say, this is all you need, along with market structure knowlege and even if you don’t have that, this indicator has been doing wonders for me. This is all I use. I do not use anything else.
**Note - Do checkout the indicators individually as I have added valuable information in the comment section.
It contains the following,
1. 10 EMA/SMA - configurable
2. 20 EMA/SMA - configurable
3. 50 EMA/SMA - configurable
4. 200 EMA/SMA - configurable
5. Previous Day's Range - configurable
6. Previous Week's Range - configurable
7. Previous Month's Range - configurable
8. Pivots - configurable
9. Buy Sell Signal - configurable
The Moving Averages
It is a very important combination and using it correctly with price action will strengthen your entries and exits.
The ema's or sma's added are the most powerful ones and they do definitely act as support and resistance.
The Daily/Weekly/Monthly Ranges
The Daily/Weekly/Monthly ranges are extremely important for any trader and should be used for targets and reversals.
Pivots
Pivots can provide support and resistance level. R5 and S5 can be used to check for over stretched conditions. You can customise them however you like. It is a full pivot indicator.
It is defaulted to show R5 and S5 only to reduce noise in the chart but it can be customised.
The 3/4 RGR or GRG Signal Generator
Combined with a 3/4 RGR or GRG setup can be all a trader needs.
You don't need complex strategies and SMC concepts to trade. Simple EMAs, ranges and RGR/GRG setup is the most winning combination.
This indicator can be used to identify the Green-Red-Green or Red-Green-Red pattern.
It is a price action indicator where a price action which identifies the defeat of buyers and sellers.
If the buyers comprehensively defeat the sellers then the price moves up and if the sellers defeat the buyers then the price moves down.
In my trading experience this is what defines the price movement.
It is a 3 or 4 candle pattern, beyond that i.e, 5 or more candles could mean a very sideways market and unnecessary signal generation.
How does it work?
Upside/Green signal
1. Say candle 1 is Green, which means buyers stepped in, then candle 2 is Red or a Doji, that means sellers brought the price down. Then if candle 3 is forming to be Green and breaks the closing of the 1st candle and opening of the 2nd candle, then a green arrow will appear and that is the place where you want to take your trade.
2. Here the buyers defeated the sellers.
3. Sometimes candle 3 falls short but candle 4 breaks candle 1's closing and candle 2's opening price. We can enter on candle 4.
4. Important - We need to enter the trade as soon as the price moves above the candle 1 and 2's body and should not wait for the 3rd or 4th candle to close. Ignore wicks.
5. But for a more optimised entry I have added an option to use candle’s highs and lows instead of open and close. This reduces lot of noise and provides us with more precise entry. This setting is turned on by default.
6. I have restricted it to 4 candles and that is all that is needed. More than that is a longer sideways market.
7. I call it the +-+ or GRG pattern or Green-Red-Green or Buyer-Seller-Buyer or Seller defeated or just Buyer pattern.
8. Stop loss can be candle 2's mid for safe traders (that includes me) or candle 2's body low for risky traders.
9. Back testing suggests that body low will be useless and result in more points in loss because for the bigger move this point will not be touched, so why not get out faster.
Downside/Red signal
1. Say candle 1 is Red, which means sellers stepped in, then candle 2 is Green or a Doji, that means buyers took the price up. Then if candle 3 is forming to be Red and breaks the closing of the 1st candle and opening of the 2nd candle then a Red arrow will appear and that is the place where you want to take your trade.
2. Sometimes candle 3 falls short but candle 4 breaks candle 1's closing and candle 2's opening price. We can enter on candle 4.
3. We need to enter the trade as soon as the price moves below the candle 1 and 2's body and should not wait for the 3rd or 4th candle to close.
4. But for a more optimised entry I have added an option to use candle’s highs and lows instead of open and close. This reduces lot of noise and provides us with more precise entry. This setting is turned on by default.
5. I have restricted it to 4 candles and that is all that is needed. More than that is a longer sideways market.
6. I call it the -+- or RGR pattern or Red-Green-Red or Seller-Buyer-Seller or Buyer defeated or just Seller pattern.
7. Stop loss can be candle 2's mid for safe traders ( that includes me) or candle 2's body high for risky traders.
8. Back testing suggests that body high will be useless and result in more points in loss because for the bigger move this point will not be touched, so why not get out faster.
Combining Indicators and Signal
Combining these indicators with GRG/RGR signal can be very powerful and can provide big moves.
1. MA crossover and Signal - This is very powerful and provides a very big move. Trades can be held for longer. If after taking the trade we notice that the MA crossover has happened then trades can be held for higher targets.
2. Pivots and Signal - Pivots and add a support or resistance point. Take profits on these points. R5/S5 are over streched conditions so we can start looking for reversal signals and ignore other signals
3. Intraday Range - first 1, 5, 15 min of the day - Sideways days is when price will stay in these ranges. You can take profits at these ranges or if the range is broken and we get a signal, then it can mean that the direction will be sustained.
4. Previous Day/Week/Month Ranges - These can be used as Take Profit points if the price is moving towards them after getting the signal. If the range is broken and we get a signal then it can be a strong signal. They can also be used as reversal points if a strong signal is generated.
Important Settings
1. Include 4th Candle Confirmation - You can enable or disable the 4th candle signal to avoid the noise, but at times I have noticed that the 4th candle gives a very strong signal or I can say that the strong signal falls on the 4th candle. This is mostly a coincidence.
2. Bars to check (default 10) - You can also configure how many previous bars should the signal be generated for. 10 to 30 is good enough. To backtest increase it to 2000 or 5000 for example.
3. Use Candle High/Low for confirmation instead of Candle Open/Close - More optimized entry and noise reduction. This option is now defaulted to false.
4. Show Green-Red-Green (bull) signals - Show only bull entries. Useful when I have a predefined view i.e, I know market is going to go up today.
5. Show Red-Green-Red (bear) signals - Show only bear entries. Useful when I have a predefined view i.e, I know market is going to go down today.
6. 3rd candle should be a Strong candle before considering 4th candle - This will enforce additional logic in 4 candle setup that the 3rd candle is the candle in our direction of breakout. This means something like GRGG is mandatory, which is still the default behaviour. If disabled, the 3rd candle can be any candle and 4th candle will act as our breakout candle. This behaviour has led to breakouts and breakdowns as times, hence I added this as a separate feature. Vice-versa for a RGGR.
For a 4 candle setup till now we were expecting GRGG or RGRR but we can let the system ignore the 3rd candle completely if needed.
This will result in additional signals.
7. Three intraday ranges added for index and stock traders - 1 min, 5 min and 15 min ranges will be displayed. These are disabled by default except 15 min. These are very important ranges and in sideways days the price will usually move within the 15 min. A breakout of this range and a positive signal can be a very powerful setup.
Safe traders can avoid taking a trade in this range as it can lead to fakeouts.
The line style, width, color and opacity are configurable.
Pointers/Golden Rules
1. If after taking the trade, the next candle moves in your direction and closes strong bullish or bearish, then move SL to break even and after that you can trail it.
2. If a upside trade hits SL and immediately a down side trade signal is generated on the next candle then take it. Vice versa is true.
3. Trades need to be taken on previous 2 candle's body high or low combined and not the wicks.
4. The most losses a trader takes is on a sideways day and because in our strategy the stop loss is so small that even on a sideways day we'll get out with a little profit or worst break even.
5. Hold trades for longer targets and don't panic.
6. If last 3-4 days have been sideways then there is a good probability that today will be trending so we can hold our trade for longer targets. Inverse is true when the market has been trending for 2-3 days then volatility followed by sideways is coming (DOW theory). Target to hold the trade for whole day and not exit till the day closes.
7. In general avoid trading in the middle of the day for index and stocks. Divide the day into 3 parts and avoid the middle.
8. Use Support/Resistance, 10, 20, 50, 200 EMA/SMA, Gaps, Whole/Round numbers(very imp) for identifying targets.
9. Trail your SL.
10. For indexes I would use 5 min and 15 min timeframe and at times 10 mins.
11. For commodities and crypto we can use higher timeframe as well. Look for signals during volatile time durations and avoid trading the whole day. Signal usually gives good targets on those times.
12. If a GRG or RGR pattern appears on a daily timeframe then this is our time to go big.
13. Minimum Risk to Reward should be 1:2 and for longer targets can be 1:4 to 1:10.
14. Trade with small lot size. Money management will happen automatically.
15. With small lot size and correct Risk-Reward we can be very profitable. Don't trade with big lot size.
16. Stay in the market for longer and collect points not money.
17. Very imp - Watch market and learn to generate a market view.
18. Very imp - Only 3 type of candles are needed in trading -
Strong Bullish (Big Green candle), Strong Bearish (Big Red candle),
Hammer (it is Strong Bullish), Inverse Hammer (it is Strong Bearish)
and Doji (indecision or confusion).
If on daily timeframe I see Strong Bullish candle previous day then I am biased to the upside the next day, if I see Strong Bearish candle the previous day then I am biased to the downside the next day, if I see Doji on the previous day then I am cautious the next day, if there are back to back Dojis forming in daily or weekly then I am preparing for big move so time to go big once I get the signal.
19. Most Important Candlestick pattern - Bullish and Bearish Engulfing
20. The only Chart patterns I need -
a) Falling Wedge/Channel Bullish Pattern Uptrend or Bull Flag - Buying - Forming over a couple days for intraday and forming over a couple of weeks for swing
b) Falling Wedge/Channel Bullish Pattern Downtrend or Falling Channel - Buying
c) Rising Wedge Bearish Pattern Uptrend or Rising Channel - Selling
d) Rising Wedge Bearish Pattern Downtrend or Bear flag - Selling
e) Head and Shoulder - Over a longer period not for intraday. In 15 min takes few days and for swing 1hr or 4h or daily can take few days
f) M and W pattern - Reversal Patterns - They form within the above 4 patterns, usually resulting in the break of trend line
21. How Gaps work -
a) Small Gap up in Uptrend - Market can fill the gap and reverse. The perception is that people are buying. If previous day candle was Strong Bullish then market view is up.
b) Big Gap up in Uptrend - Not news driven - Profit booking will come but may not fill the entire gap
c) Big Gap up in Uptrend - News driven, war related, tax, interest rate - Market can keep going up without stopping.
c) Flat opening in Uptrend - Big chance of market going up. If previous day candle was Strong Bullish then view is upwards, if it was Doji then still upwards.
d) Gap down in Uptrend - Market is surprised. After going down initially it can go up
e) Small Gap down in Downtrend - Market can fill the gap and keep moving down. If previous day candle was Strong Bearish then view is still down.
f) Flat opening in Downtrend - View is down, short today.
g) Big Gap down in Downtrend - Profit booking and foolish buying will come but market view is still down.
h) Gap down with News - Volatility, sideways then down.
i) Gap Up in Downtrend - Can move up - Price can move up during 2/3rd of the day and End of the day revert and close in red.
22. Go big on bearish days for option traders. Puts are better bought and Calls are better sold.
23. Cluster of green signals can lead to bigger move on the upside and vice versa for red signals.
24. Most of this is what I learned from successful traders (from the top 2%) only the indicator is mine.

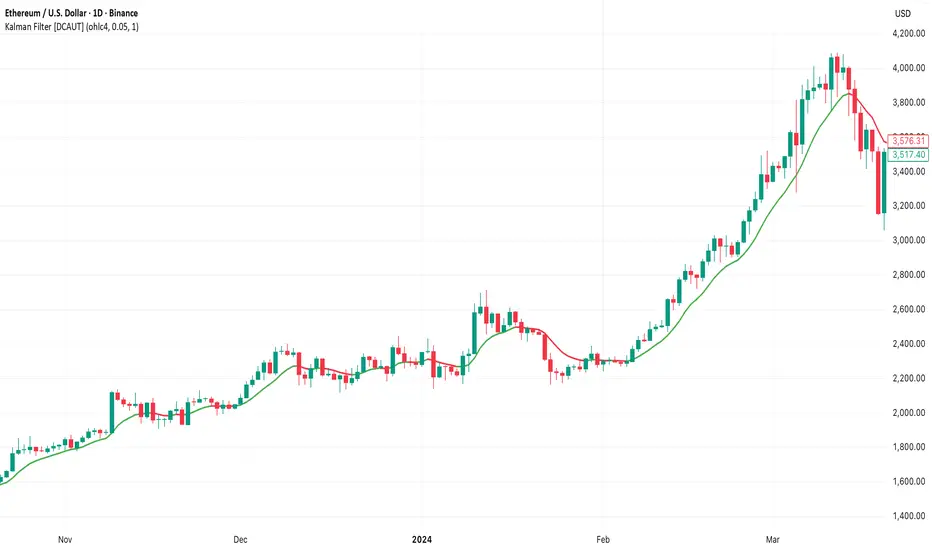
Kalman Filter [DCAUT]█ Kalman Filter
📊 ORIGINALITY & INNOVATION
The Kalman Filter represents an important adaptation of aerospace signal processing technology to financial market analysis. Originally developed by Rudolf E. Kalman in 1960 for navigation and guidance systems, this implementation brings the algorithm's noise reduction capabilities to price trend analysis.
This implementation addresses a common challenge in technical analysis: the trade-off between smoothness and responsiveness. Traditional moving averages must choose between being smooth (with increased lag) or responsive (with increased noise). The Kalman Filter improves upon this limitation through its recursive estimation approach, which continuously balances historical trend information with current price data based on configurable noise parameters.
The key advancement lies in the algorithm's adaptive weighting mechanism. Rather than applying fixed weights to historical data like conventional moving averages, the Kalman Filter dynamically adjusts its trust between the predicted trend and observed prices. This allows it to provide smoother signals during stable periods while maintaining responsiveness during genuine trend changes, helping to reduce whipsaws in ranging markets while not missing significant price movements.
📐 MATHEMATICAL FOUNDATION
The Kalman Filter operates through a two-phase recursive process:
Prediction Phase:
The algorithm first predicts the next state based on the previous estimate:
State Prediction: Estimates the next value based on current trend
Error Covariance Prediction: Calculates uncertainty in the prediction
Update Phase:
Then updates the prediction based on new price observations:
Kalman Gain Calculation: Determines the weight given to new measurements
State Update: Combines prediction with observation based on calculated gain
Error Covariance Update: Adjusts uncertainty estimate for next iteration
Core Parameters:
Process Noise (Q): Represents uncertainty in the trend model itself. Higher values indicate the trend can change more rapidly, making the filter more responsive to price changes.
Measurement Noise (R): Represents uncertainty in price observations. Higher values indicate less trust in individual price points, resulting in smoother output.
Kalman Gain Formula:
The Kalman Gain determines how much weight to give new observations versus predictions:
K = P(k|k-1) / (P(k|k-1) + R)
Where:
K is the Kalman Gain (0 to 1)
P(k|k-1) is the predicted error covariance
R is the measurement noise parameter
When K approaches 1, the filter trusts new measurements more (responsive).
When K approaches 0, the filter trusts its prediction more (smooth).
This dynamic adjustment mechanism allows the filter to adapt to changing market conditions automatically, providing an advantage over fixed-weight moving averages.
📊 COMPREHENSIVE SIGNAL ANALYSIS
Visual Trend Indication:
The Kalman Filter line provides color-coded trend information:
Green Line: Indicates the filter value is rising, suggesting upward price momentum
Red Line: Indicates the filter value is falling, suggesting downward price momentum
Gray Line: Indicates sideways movement with no clear directional bias
Crossover Signals:
Price-filter crossovers generate trading signals:
Golden Cross: Price crosses above the Kalman Filter line, suggests potential bullish momentum development, may indicate a favorable environment for long positions, filter will naturally turn green as it adapts to price moving higher
Death Cross: Price crosses below the Kalman Filter line, suggests potential bearish momentum development, may indicate consideration for position reduction or shorts, filter will naturally turn red as it adapts to price moving lower
Trend Confirmation:
The filter serves as a dynamic trend baseline:
Price Consistently Above Filter: Confirms established uptrend
Price Consistently Below Filter: Confirms established downtrend
Frequent Crossovers: Suggests ranging or choppy market conditions
Signal Reliability Factors:
Signal quality varies based on market conditions:
Higher reliability in trending markets with sustained directional moves
Lower reliability in choppy, range-bound conditions with frequent reversals
Parameter adjustment can help adapt to different market volatility levels
🎯 STRATEGIC APPLICATIONS
Trend Following Strategy:
Use the Kalman Filter as a dynamic trend baseline:
Enter long positions when price crosses above the filter
Enter short positions when price crosses below the filter
Exit when price crosses back through the filter in the opposite direction
Monitor filter slope (color) for trend strength confirmation
Dynamic Support/Resistance:
The filter can act as a moving support or resistance level:
In uptrends: Filter often provides dynamic support for pullbacks
In downtrends: Filter often provides dynamic resistance for bounces
Price rejections from the filter can offer entry opportunities in trend direction
Filter breaches may signal potential trend reversals
Multi-Timeframe Analysis:
Combine Kalman Filters across different timeframes:
Higher timeframe filter identifies primary trend direction
Lower timeframe filter provides precise entry and exit timing
Trade only in direction of higher timeframe trend for better probability
Use lower timeframe crossovers for position entry/exit within major trend
Volatility-Adjusted Configuration:
Adapt parameters to match market conditions:
Low Volatility Markets (Forex majors, stable stocks): Use lower process noise for stability, use lower measurement noise for sensitivity
Medium Volatility Markets (Most equities): Process noise default (0.05) provides balanced performance, measurement noise default (1.0) for general-purpose filtering
High Volatility Markets (Cryptocurrencies, volatile stocks): Use higher process noise for responsiveness, use higher measurement noise for noise reduction
Risk Management Integration:
Use filter as a trailing stop-loss level in trending markets
Tighten stops when price moves significantly away from filter (overextension)
Wider stops in early trend formation when filter is just establishing direction
Consider position sizing based on distance between price and filter
📋 DETAILED PARAMETER CONFIGURATION
Source Selection:
Determines which price data feeds the algorithm:
OHLC4 (default): Uses average of open, high, low, close for balanced representation
Close: Focuses purely on closing prices for end-of-period analysis
HL2: Uses midpoint of high and low for range-based analysis
HLC3: Typical price, gives more weight to closing price
HLCC4: Weighted close price, emphasizes closing values
Process Noise (Q) - Adaptation Speed Control:
This parameter controls how quickly the filter adapts to changes:
Technical Meaning:
Represents uncertainty in the underlying trend model
Higher values allow the estimated trend to change more rapidly
Lower values assume the trend is more stable and slow-changing
Practical Impact:
Lower Values: Produces very smooth output with minimal noise, slower to respond to genuine trend changes, best for long-term trend identification, reduces false signals in choppy markets
Medium Values: Balanced responsiveness and smoothness, suitable for swing trading applications, default (0.05) works well for most markets
Higher Values: More responsive to price changes, may produce more false signals in ranging markets, better for short-term trading and day trading, captures trend changes earlier, adjust freely based on market characteristics
Measurement Noise (R) - Smoothing Control:
This parameter controls how much the filter trusts individual price observations:
Technical Meaning:
Represents uncertainty in price measurements
Higher values indicate less trust in individual price points
Lower values make each price observation more influential
Practical Impact:
Lower Values: More reactive to each price change, less smoothing with more noise in output, may produce choppy signals
Medium Values: Balanced smoothing and responsiveness, default (1.0) provides general-purpose filtering
Higher Values: Heavy smoothing for very noisy markets, reduces whipsaws significantly but increases lag in trend change detection, best for cryptocurrency and highly volatile assets, can use larger values for extreme smoothing
Parameter Interaction:
The ratio between Process Noise and Measurement Noise determines overall behavior:
High Q / Low R: Very responsive, minimal smoothing
Low Q / High R: Very smooth, maximum lag reduction
Balanced Q and R: Middle ground for most applications
Optimization Guidelines:
Start with default values (Q=0.05, R=1.0)
If too many false signals: Increase R or decrease Q
If missing trend changes: Decrease R or increase Q
Test across different market conditions before live use
Consider different settings for different timeframes
📈 PERFORMANCE ANALYSIS & COMPETITIVE ADVANTAGES
Comparison with Traditional Moving Averages:
Versus Simple Moving Average (SMA):
The Kalman Filter typically responds faster to genuine trend changes
Produces smoother output than SMA of comparable length
Better noise reduction in ranging markets
More configurable for different market conditions
Versus Exponential Moving Average (EMA):
Similar responsiveness but with better noise filtering
Less prone to whipsaws in choppy conditions
More adaptable through dual parameter control (Q and R)
Can be tuned to match or exceed EMA responsiveness while maintaining smoothness
Versus Hull Moving Average (HMA):
Different noise reduction approach (recursive estimation vs. weighted calculation)
Kalman Filter offers more intuitive parameter adjustment
Both reduce lag effectively, but through different mechanisms
Kalman Filter may handle sudden volatility changes more gracefully
Response Characteristics:
Lag Time: Moderate and configurable through parameter adjustment
Noise Reduction: Good to excellent, particularly in volatile conditions
Trend Detection: Effective across multiple timeframes
False Signal Rate: Typically lower than simple moving averages in ranging markets
Computational Efficiency: Efficient recursive calculation suitable for real-time use
Optimal Use Cases:
Markets with mixed trending and ranging periods
Assets with moderate to high volatility requiring noise filtering
Multi-timeframe analysis requiring consistent methodology
Systematic trading strategies needing reliable trend identification
Situations requiring balance between responsiveness and smoothness
Known Limitations:
Parameters require adjustment for different market volatility levels
May still produce false signals during extreme choppy conditions
No single parameter set works optimally for all market conditions
Requires complementary indicators for comprehensive analysis
Historical performance characteristics may not persist in changing market conditions
USAGE NOTES
This indicator is designed for technical analysis and educational purposes. The Kalman Filter's effectiveness varies with market conditions, tending to perform better in markets with clear trending phases interrupted by consolidation. Like all technical indicators, it has limitations and should not be used as the sole basis for trading decisions, but rather as part of a comprehensive trading approach.
Algorithm performance varies with market conditions, and past characteristics do not guarantee future results. Always test thoroughly with different parameter settings across various market conditions before using in live trading. No technical indicator can predict future price movements with certainty, and all trading involves risk of loss.
Breaout and followthroughThis indicator is designed to identify and highlight a single, powerful entry signal at the beginning of a new trend. It filters for high-volatility breakout bars that show strong directional conviction, helping traders catch the initial momentum of a potential move. It will only paint one bullish or bearish signal after a trend change is detected, preventing repeat signals during a sustained move.
Core Concept
The indicator combines four key concepts to generate high-probability signals:
Trend Direction: It first establishes the overall trend (bullish or bearish) using a configurable Exponential or Simple Moving Average (EMA/SMA).
Volatility Expansion: It looks for bars with a larger-than-average range by comparing the bar's size to the Average True Range (ATR). This helps identify moments of increased market interest.
Closing Strength (IBS): It uses the Internal Bar Strength (IBS) to measure directional conviction. A high IBS (closing near the top) suggests bullish strength, while a low IBS (closing near the bottom) suggests bearish pressure.
Breakout Confirmation: As an optional but powerful filter, it can confirm the signal by ensuring the bar is breaking above the high or below the low of a user-defined number of previous bars.
A signal is only generated on the first bar that meets all these criteria after the price crosses the trend-defining moving average, making it ideal for capturing the start of a new swing.
Features
Bullish Signals (Green): Highlights the first bar in an uptrend that is larger than the ATR, closes with a high IBS (>70), and optionally breaks out above the recent highs.
Bearish Signals (Red): Highlights the first bar in a downtrend that is larger than the ATR, closes with a low IBS (<30), and optionally breaks out below the recent lows.
"First Signal Only" Logic: The script is hard-coded to show only the initial signal in a new trend, filtering out noise and redundant signals.
Fully Customizable Trend Filter:
Choose between EMA or SMA for trend definition.
Set the MA length (default is a short-term 7-period MA).
Option to show or hide the moving average on the chart.
Optional Breakout Filter:
Enable or disable the requirement for the signal bar to break the high/low of previous bars.
Customize the lookback period for the breakout confirmation.
How to Use
This indicator can be used as a primary signal for a trend-following or momentum-based trading system.
Look for a Green Bar (Bullish Signal): This suggests the start of a potential uptrend. Consider it a signal for a long entry. A logical stop-loss could be placed below the low of the highlighted signal bar.
Look for a Red Bar (Bearish Signal): This suggests the start of a potential downtrend. Consider it a signal for a short entry. A logical stop-loss could be placed above the high of the highlighted signal bar.
Adjust Settings: Use the settings menu to configure the indicator to your preferred market and timeframe. A longer Trend MA Length will result in fewer, more long-term signals, while a shorter length will be more responsive.
As with any tool, this indicator is best used in conjunction with other forms of analysis, such as market structure, support/resistance levels, and proper risk management.

Daily/Weekly Wick (Shadow) Range📈 Detailed Guide to the Daily/Weekly Wick (Shadow) Range Indicator
This indicator is a powerful visualization tool designed to map the key price levels established during the previous trading period (either the previous day or the previous week). Instead of just showing a single line for the high and low, it highlights the entire range of the upper and lower wicks (shadows), representing the "battleground" where buyers and sellers were most active.
How It Works
The Wick (Shadow) Range indicator fetches the Open, High, Low, and Close data from the last completed daily or weekly candle and projects those levels onto your current chart. This creates two distinct colored zones.
Upper Wick (Green Zone): This area spans from the Previous High down to the top of the Previous Candle's Body. It visually represents the territory where sellers successfully pushed the price down from its peak. This entire zone can be considered a resistance area.
Lower Wick (Red Zone): This area spans from the bottom of the Previous Candle's Body down to the Previous Low. It shows where buyers stepped in to defend a price level and push it back up. This entire zone can be considered a support area.
How to Use It in Your Trading
This indicator isn't meant to give direct buy or sell signals on its own. Instead, it provides crucial context about market structure. Here are several ways to incorporate it into your strategy:
1. Identifying Key Support & Resistance
This is the indicator's primary function. The most significant levels are:
Key Resistance: The top edge of the green zone (the previous period's high).
Key Support: The bottom edge of the red zone (the previous period's low).
Look for the current price to react when it approaches these boundaries. These are high-probability areas for price to pause or reverse.
2. Watching for Price Rejection (Reversal Trading)
The colored zones are perfect for spotting rejection signals.
Bearish Rejection 📉: If the current price enters the green zone but fails to stay there, closing back below it (often forming a new wick), it's a strong sign that sellers are still in control at that level. This can be an excellent entry signal for a short position.
Bullish Rejection 📈: If the current price dips into the red zone and is quickly bought back up, it shows that buyers are actively defending that area. This can be a great entry signal for a long position.
3. Confirming Breakouts (Trend Trading)
The zones also help validate breakouts.
Bullish Breakout: If the price pushes decisively through the entire green zone and closes above the previous high, it signals that the previous resistance has been broken and the trend may continue upward.
Bearish Breakdown: If the price falls decisively through the entire red zone and closes below the previous low, it confirms that support has failed and the price may continue downward.
4. Setting Context with Timeframes
Weekly Setting: Use the "Weekly" option to identify major, significant support and resistance levels that can influence the market for the entire week. These are powerful levels for swing trading.
Daily Setting: Use the "Daily" option for intraday trading. The previous day's high and low are critical pivot points that many day traders watch.
⚙️ Indicator Settings
The indicator has one simple setting, which you can access by clicking the gear icon ⚙️ next to its name on the chart.
Select Wick Timeframe: This dropdown menu allows you to switch the indicator's calculation between the Daily and Weekly timeframe instantly.

Higher High Lower Low Higher High Lower Low 🦉{Phanchai} — TradingView Description
Structure detector with dynamic Support/Resistance, customizable labels, and ready-made alerts (Pine v6).
This script marks market structure turning points — HH (Higher High), HL (Higher Low), LH (Lower High), LL (Lower Low) — and builds segmented Support/Resistance lines from those turns. Labels and colors are fully customizable and the script ships with multiple alert conditions.
What it does
Detects swing pivots using left/right bar windows, then classifies each confirmed swing as HH/HL/LH/LL.
Plots compact labels at the confirmed pivot bars with tooltips (English).
Derives dynamic Support / Resistance : every time structure flips, the previous level is closed and a new segment starts, extending to the right .
Provides alert conditions for any label and for specific first-occurrence shifts (e.g., first HH after a bearish label).
How it works (in short)
A pivot high/low confirms only after Right Bars candles have closed; labels and S/R appear at that confirmation bar.
An internal backbone (zigzag-like) is built from confirmed pivots, with light consistency checks to avoid contradictory sequences.
Structure rules compare the recent five pivots (A…E) to decide HH/HL/LH/LL.
S/R is updated from structure: e.g., in an up leg, new HLs refresh Support; in a down leg, new LHs refresh Resistance.
Alerts included
Any structure label (HH/HL/LH/LL) — Fires on any new label.
First LL after HL/HH — First bearish break after a bullish label.
First HH after LL/LH — First bullish break after a bearish label.
LL or HL formed — Any low-side label.
LH or HH formed — Any high-side label.
HL formed
HH formed
LL formed
LH formed
How to use (quick start)
Add the indicator to your chart.
Choose Left/Right Bars for your timeframe (e.g., 5–10 for intraday; larger for higher timeframes).
Pick your label colors/sizes and S/R style.
Right-click the chart → Add alert… → Condition: this indicator → select the desired alert.
Notes & tips
Because pivots require Right Bars to confirm, labels and S/R appear with a natural delay of that many bars. This avoids repainting.
Raising Left/Right Bars reduces noise and increases the average distance between pivots; lowering them increases sensitivity.
Structure is strict: sometimes you may see two HL (or two LH) in a row if the intermediate opposite swing didn’t qualify as HH/LH (or LL/HL).
S/R segments are drawn with line objects ; they are controlled via Inputs (style/width/color), not the Style tab.
This tool highlights structure; it’s not a standalone entry/exit system. Combine with volume, trend, or risk management rules.
Built with Pine v6. Clean, compact labels; segmented S/R that updates only on confirmed changes; comprehensive alerts ready for automation.

RSI Divergence + Hidden RSI Divergence + Hidden (TV-like pairing, final)
What it does
This indicator plots RSI and automatically detects both regular and hidden divergences by pairing RSI pivots with price pivots. It supports a TradingView-like loose pairing (within a user-defined bar tolerance) and a strict same-bar pairing. Detected signals are drawn with lines and optional labels on the RSI pane for quick visual verification.
Divergence logic
Regular Bullish (label: Bull)
Price makes a lower low while RSI makes a higher low → potential upward reversal.
Regular Bearish (label: Bear)
Price makes a higher high while RSI makes a lower high → potential downward reversal.
Hidden Bullish (label: H_Bull)
Price makes a higher low while RSI makes a lower low → trend-continuation bias upward.
Hidden Bearish (label: H_Bear)
Price makes a lower high while RSI makes a higher high → trend-continuation bias downward.
All conditions use pivot-to-pivot comparisons with optional equality tolerance for price and RSI to reduce false “equal” mismatches.
Pairing modes
TV-like
Pairs the latest price and RSI pivots if their pivot bars occur within ±tolBars.
A lightweight “pending” buffer allows pairing a newly detected pivot with a recent opposite pivot that arrived a few bars earlier/later (within tolerance).
Same Bar
Price and RSI pivots must occur on the exact same bar to form a pair.
Key inputs
RSI Source & Length: srcRsi, rsiLen (default 14). RSI line and reference levels (70/50/30) can be shown/hidden.
Pivot Window: leftBars, rightBars for both price and RSI pivots.
Pairing: pairMode = TV-like or Same Bar; tolBars for bar tolerance (TV-like only).
Price Pivot Basis: priceMode = High/Low (default) or Close.
Equality Tolerance:
allowEqual (use >=/<=),
priceEpsTks (ticks) for price equality slack,
rsiEps (points) for RSI equality slack.
Visibility: showRSI, showRegular, showHidden, showLabels.
Visuals
Lines (on RSI):
Regular Bearish: red
Regular Bullish: lime
Hidden Bearish: orange
Hidden Bullish: teal
Labels (optional): "Bear", "Bull", "H_Bear", "H_Bull" placed on the RSI series at the second pivot.
Alerts
Four alert conditions are provided and fire when the corresponding divergence is confirmed:
Bear (Regular)
Bull (Regular)
H_Bear (Hidden)
H_Bull (Hidden)
Notes & tips
Divergences are evaluated only when both price and RSI pivots exist and can be paired under the selected mode.
Pivot sensitivity: smaller leftBars/rightBars → earlier but noisier signals; larger values → fewer, more stable pivots.
Tolerance: If you miss valid setups because pivots land a few bars apart, use TV-like with a small tolBars (e.g., 1–2). If you prefer stricter confirmation, use Same Bar.
Equality slack: Use priceEpsTks and rsiEps to avoid rejecting near-equal highs/lows due to tiny differences.
Works on any symbol/timeframe; as with all divergence tools, treat signals as context—combine with trend, structure, and risk management.

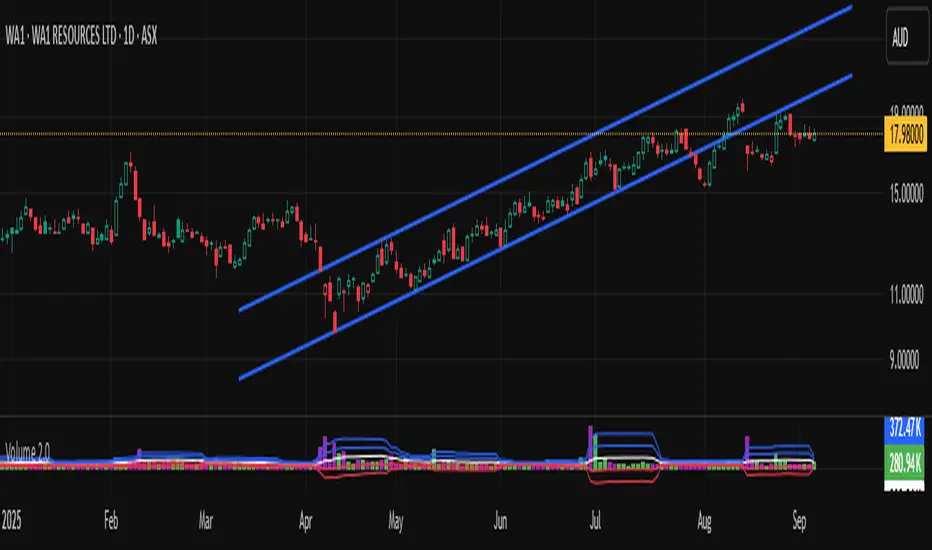
Volume 2.0Volume with standard deviations.
Helps to identify moderately high/low volume and very high/low volume.
Low volume indicates less market participation. High volume indicates higher market participation.
It forecasts potential changes of sentiment.
Volume with standard deviations (n=14).
Helps to identify moderately high/low volume and very high/low volume. Low volume indicates less market participation. High volume indicates higher market participation.
It forecasts potential changes of sentiment. This indicator has to be used with others. It is an adjunct tool, but a powerful one.
NB:
My previous version "Volume" violated the Pine Code house rules, so it got shielded from public view. This is my first experience with writing in Pine Code and publishing. I suspect it was because I didn't publish with a clean chart without other indicators added. My apologies in advance if version 2.0 is again another violation, which will then get shielded again. I am only publishing out of good will to share that's all.
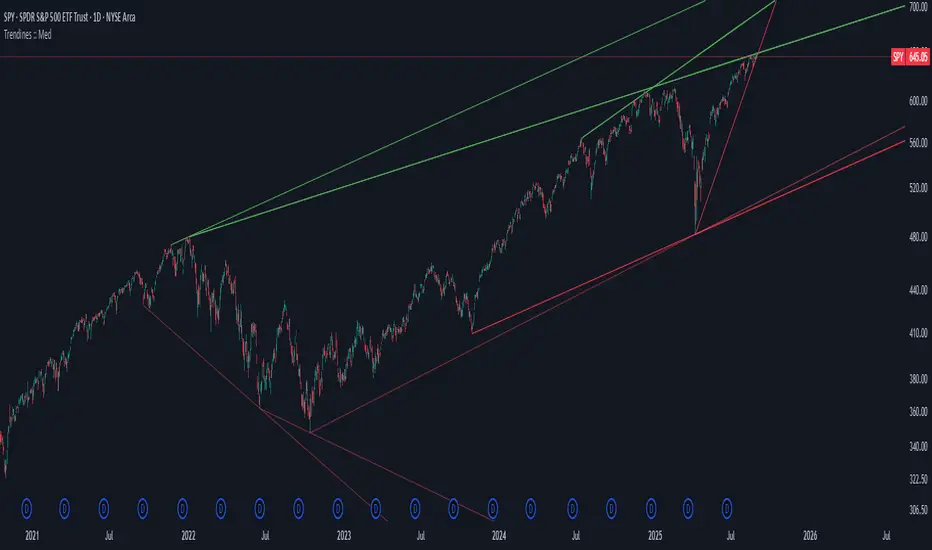
Algo + Trendlines :: Medium PeriodThis indicator helps me to avoid overlooking Trendlines / Algolines. So far it doesn't search explicitly for Algolines (I don't consider volume at all), but it's definitely now already not horribly bad.
These are meant to be used on logarithmic charts btw! The lines would be displayed wrong on linear charts.
The biggest challenge is that there are some technical restrictions in TradingView, f. e. a script stops executing if a for-loop would take longer than 0.5 sec.
So in order to circumvent this and still be able to consider as many candles from the past as possible, I've created multiple versions for different purposes that I use like this:
Algo + Trendlines :: Medium Period : This script looks for "temporary highs / lows" (meaning the bar before and after has lower highs / lows) on the daily chart, connects them and shows the 5 ones that are the closest to the current price (=most relevant). This one is good to find trendlines more thoroughly, but only up to 4 years ago.
Algo + Trendlines :: Long Period : This version looks instead at the weekly charts for "temporary highs / lows" and finds out which days caused these highs / lows and connects them, Taking data from the weekly chart means fewer data points to check whether a trendline is broken, which allows to detect trendlines from up to 12 years ago! Therefore it misses some trendlines. Personally I prefer this one with "Only Confirmed" set to true to really show only the most relevant lines. This means at least 3 candle highs / lows touched the line. These are more likely stronger resistance / support lines compared to those that have been touched only twice.
Very important: sometimes you might see dotted lines that suddenly stop after a few months (after 100 bars to be precise). This indicates you need to zoom further out for TradingView to be able to load the full line. Unfortunately TradingView doesn't render lines if the starting point was too long ago, so this is my workaround. This is also the script's biggest advantage: showing you lines that you might have missed otherwise since the starting bars were outside of the screen, and required you to scroll f. e back to 2015..
One more thing to know:
Weak colored line = only 2 "collision" points with candle highs/lows (= not confirmed)
Usual colored line = 3+ "collision" points (= confirmed)
Make sure to move this indicator above the ticker in the Object Tree, so that it is drawn on top of the ticker's candles!
More infos: www.reddit.com
Algo + Trendlines :: Long PeriodThis indicator helps me to avoid overlooking Trendlines / Algolines. So far it doesn't search explicitly for Algolines (I don't consider volume at all), but it's definitely now already not horribly bad.
These are meant to be used on logarithmic charts btw! The lines would be displayed wrong on linear charts.
The biggest challenge is that there are some technical restrictions in TradingView, f. e. a script stops executing if a for-loop would take longer than 0.5 sec.
So in order to circumvent this and still be able to consider as many candles from the past as possible, I've created multiple versions for different purposes that I use like this:
Algo + Trendlines :: Medium Period : This script looks for "temporary highs / lows" (meaning the bar before and after has lower highs / lows) on the daily chart, connects them and shows the 5 ones that are the closest to the current price (=most relevant). This one is good to find trendlines more thoroughly, but only up to 4 years ago.
Algo + Trendlines :: Long Period : This version looks instead at the weekly charts for "temporary highs / lows" and finds out which days caused these highs / lows and connects them, Taking data from the weekly chart means fewer data points to check whether a trendline is broken, which allows to detect trendlines from up to 12 years ago! Therefore it misses some trendlines. Personally I prefer this one with "Only Confirmed" set to true to really show only the most relevant lines. This means at least 3 candle highs / lows touched the line. These are more likely stronger resistance / support lines compared to those that have been touched only twice.
Very important: sometimes you might see dotted lines that suddenly stop after a few months (after 100 bars to be precise). This indicates you need to zoom further out for TradingView to be able to load the full line. Unfortunately TradingView doesn't render lines if the starting point was too long ago, so this is my workaround. This is also the script's biggest advantage: showing you lines that you might have missed otherwise since the starting bars were outside of the screen, and required you to scroll f. e back to 2015..
One more thing to know:
Weak colored line = only 2 "collision" points with candle highs/lows (= not confirmed)
Usual colored line = 3+ "collision" points (= confirmed)
Make sure to move this indicator above the ticker in the Object Tree, so that it is drawn on top of the ticker's candles!
More infos: www.reddit.com

Untouched ExtremesWhat it is
Untouched Extremes plots horizontal levels at green-candle highs and red-candle lows. Each level is considered “untouched” (clean liquidity) until price revisits it; on the first valid touch the line auto-deletes, keeping only live targets on your chart.
How it works (logic)
Bar close event
If close > open, the script draws a line at that bar’s high and extends it to the right.
If close < open, it draws a line at that bar’s low and extends it to the right.
(Optional) Perfect/almost-dojis can be classified as green or red via settings.
Touch & removal
A green-high line is removed when any later bar’s high ≥ level (optionally within a tick tolerance).
A red-low line is removed when any later bar’s low ≤ level (optionally within a tick tolerance).
You can delay deletion by N bars to make the touch visible before the line disappears.
Housekeeping
Maximum active lines per side and line styling are user-configurable.
Why it’s useful
Untouched highs/lows often coincide with resting liquidity and incomplete price probes. Tracking them helps:
Define targets and magnets price may seek.
Frame mean-reversion rotations after a failed push.
Keep the chart clean: only levels that have not been traded are displayed.
How to use it (trading idea)
Confirmation rule: Treat the line as a level/zone. Price can pierce it; wait for a clear reversal candle pattern (e.g., pin bar, engulfing, strong momentum shift) at or immediately after the touch.
Directional play:
If a bullish reversal pattern forms at/around a red-low line, the working assumption is that price will move toward the first untouched upper line (nearest green-high line above). Many traders use that as the primary target.
Conversely, if a bearish reversal pattern forms at/around a green-high line, expect rotation toward the first untouched lower line.
Risk management: Stops typically go just beyond the level or beyond the pattern’s wick. Consider a fixed R:R (e.g., 1:2) and partials at intermediate levels.
Settings
Doji handling: Choose how to classify close ≈ open bars (Green / Red / Ignore). A small equality margin (ticks) helps with rounding on some symbols.
Touch tolerance (ticks): Counts near-misses as touches if desired.
Deletion delay (bars): Wait N bars after creation before a line becomes eligible for deletion.
Max lines per side / width / colors: Keep the view readable.
Tips
Works on any symbol/timeframe; lower TFs produce more levels—adjust Max lines accordingly.
Combining with a trend filter (e.g., EMA-200), ATR distance, or volume clues can improve selectivity.
If spreads or wicks are noisy, increase tolerance slightly and/or use deletion delay to visualize touches.
Note: This tool provides structure and potential targets, not signals by itself. Always require your reversal pattern as confirmation and manage risk appropriately.
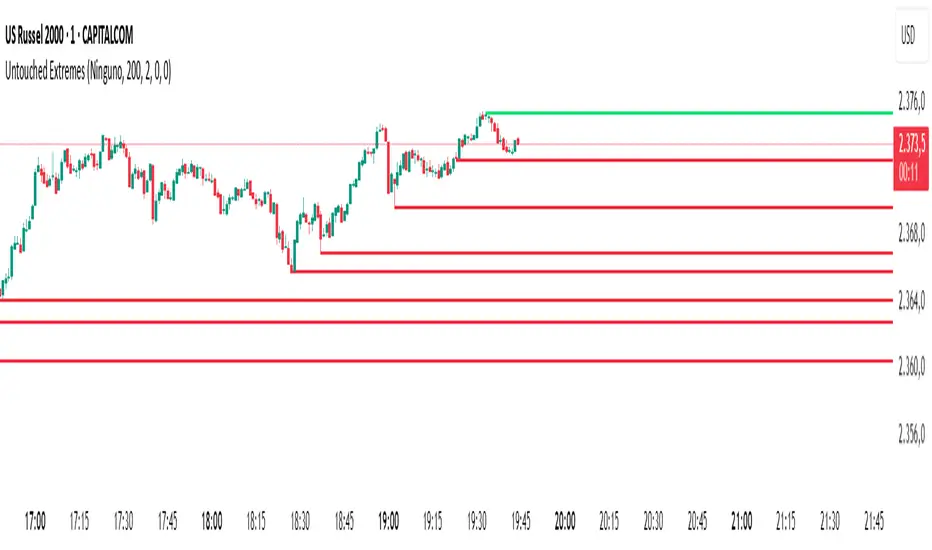
Strong Trend CandlesThis indicator highlights trend candles using a mathematically grounded method designed to identify moments when the market is truly dominated by buyers or sellers
Up-Trend Candle (UP):
The open is close to the session’s low.
The close is close to the session’s high.
This structure reflects sustained bullish control from start to finish.
Down-Trend Candle (DOWN):
The open is near the high.
The close is near the low.
This reflects clear bearish control throughout the session.
Precise Definitions Used:
UP-Trend Candle:
Open ≤ Low + 10% of range
Close ≥ High - 20% of range
DOWN-Trend Candle:
Open ≥ High - 10% of range
Close ≤ Low + 20% of range
Here, the range is simply High - Low.
Why are the thresholds different (10% vs 20%)?
This is intentional and based on how markets behave:
The opening price tends to be precise and stable in trend days. A strong trending candle usually opens very close to one end (high or low), reflecting a clean start without hesitation.
The closing price, however, often pulls back slightly before the end of the session—even during strong trends—due to profit-taking or last-minute volatility.
That’s why the close is allowed more tolerance (20%), while the open is held to a stricter threshold (10%). This balance allows the indicator to be strict enough to filter noise, yet flexible enough to capture real trends.
✅ Why this is useful
Unlike vague candle patterns like "bullish engulfing" or "marubozu," this method focuses strictly on structure and positioning, not color or subjective shape. It isolates the candles where one side clearly dominated, offering cleaner entries for breakout, continuation, or confirmation strategies.
You can use this tool to:
Spot high-momentum price action
Confirm breakouts or directional bias
Filter setups based on strong market conviction
🔹 How it works
An Up-Trend Candle is detected when the open is close to the daily low and the close is close to the daily high.
A Down-Trend Candle is detected when the open is close to the daily high and the close is close to the daily low.
The thresholds for “close to high/low” are configurable through the Open % of Range and Close % of Range inputs.
🔹 How to use it
Candles are colored according to their classification.
Colors can be customized in the settings.
This tool can be applied in any timeframe.
⚠️ Notes:
This script does not generate buy/sell signals.
It is designed to help visualize strong candles based on intraday range conditions.
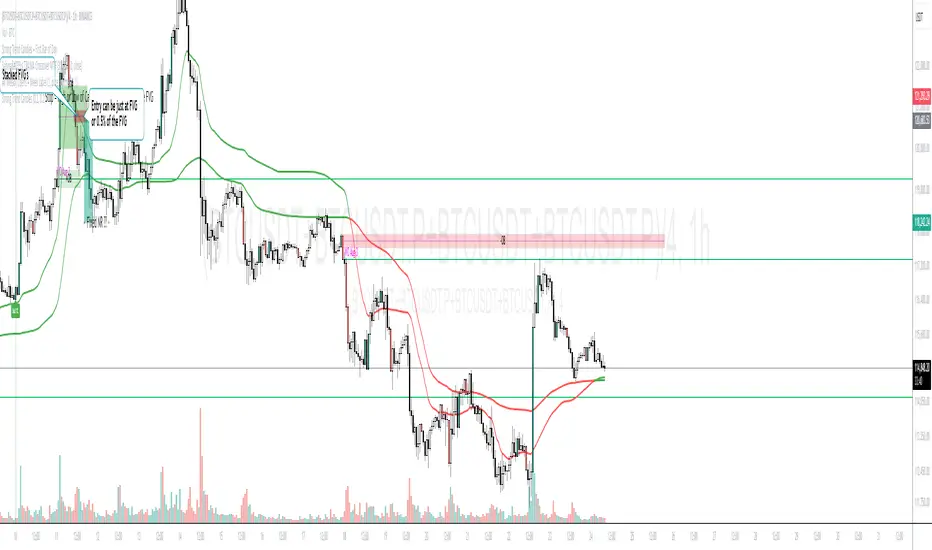
Pure Price Zone Flow🔎 What this indicator is
It’s a price-action-based zone indicator. Unlike moving average systems, this one relies only on:
1. Swing Highs & Swing Lows → The highest and lowest points within a recent lookback period (like "mini support & resistance").
2. ATR (Average True Range) → A volatility measure that expands the zone, making it more adaptive to different market conditions.
3. Breakouts & Retests → When price breaks above a swing high (bullish) or below a swing low (bearish), the indicator marks it and highlights the new trend.
👉 The goal is to spot clean structure shifts and define clear trend zones where traders can position themselves.
________________________________________
⚙️ How it is calculated
1. Swing High & Swing Low
o We look back len candles (default 20).
o Find the highest high (swingHigh) and the lowest low (swingLow) in that window.
o This forms the price range zone.
2. ATR Expansion
o We calculate ATR over the same len.
o Add/subtract it (multiplied by atrMult) to the zone edges to expand them.
o This ensures the zones breathe with volatility (tight in quiet markets, wide in choppy ones).
3. Mid-Zone
o Simply the average of swingHigh and swingLow.
o If price is above mid → bullish bias.
o If below mid → bearish bias.
o This gives us the trend color for candles.
4. Breakouts
o If the close crosses above swingHigh, we mark a bullish breakout with a label.
o If the close crosses below swingLow, we mark a bearish breakdown.
________________________________________
📊 How it helps traders
This indicator helps by:
1. Identifying Structure Shifts
o Many traders watch swing highs/lows for breakouts or reversals.
o This automates the process and visually confirms when structure is broken.
2. Dynamic Zone Trading
o Instead of fixed support/resistance, the ATR expansion adapts to volatility.
o This avoids false signals in high-volatility conditions.
3. Trend Bias at a Glance
o Candle coloring instantly tells you whether price is in bullish or bearish territory relative to the mid-zone.
4. Breakout Confirmation
o The labels show when a breakout has occurred, so traders can react quickly (e.g., enter with trend, wait for retest, or avoid fading moves).
________________________________________
🌍 Markets it works best in
• Crypto (Bitcoin, Ethereum, etc.): Very effective since crypto is breakout-driven and respects swing levels.
• Forex: Good for volatility-adaptive structure analysis, especially in trending pairs.
• Indices (SPX, NASDAQ, DAX, NIFTY): Useful for breakout trading during session opens or key news events.
• Commodities (Gold, Oil, Silver): Works well to define intraday ranges and breakout levels.
⚠️ Less useful in low-volatility, mean-reverting assets (like some penny stocks or sideways ranges), because breakouts may be rare or fake.
________________________________________
💡 How it adds value
• Strips away unnecessary complexity (no lagging averages).
• Focuses directly on what price is doing structurally.
• Adaptive → works across different markets & timeframes.
• Easy visualization → zones, trend coloring, breakout markers.
• Helps traders trade with the flow of the market, instead of guessing tops/bottoms.
________________________________________
👉 In short:
This indicator turns raw price action into clear, actionable zones.
It highlights when the market shifts from balance to breakout, so traders can align with momentum rather than fighting it.

Multi-Band Trend LineThis Pine Script creates a versatile technical indicator called "Multi-Band Trend Line" that builds upon the concept of the popular "Follow Line Indicator" by Dreadblitz. While the original Follow Line Indicator uses simple trend detection to place a line at High or Low levels, this enhanced version combines multiple band-based trading strategies with dynamic trend line generation. The indicator supports five different band types and provides more sophisticated buy/sell signals based on price breakouts from various technical analysis bands.
Key Features
Multi-Band Support
The indicator supports five different band types:
- Bollinger Bands: Uses standard deviation to create bands around a moving average
- Keltner Channels: Uses ATR (Average True Range) to create bands around a moving average
- Donchian Channels: Uses the highest high and lowest low over a specified period
- Moving Average Envelopes: Creates bands as a percentage above and below a moving average
- ATR Bands: Uses ATR multiplier to create bands around a moving average
Dynamic Trend Line Generation (Enhanced Follow Line Concept)
- Similar to the Follow Line Indicator, the trend line is placed at High or Low levels based on trend direction
- Key Enhancement: Instead of simple trend detection, this version uses band breakouts to trigger trend changes
- When price breaks above the upper band (bullish signal), the trend line is set to the low (optionally adjusted with ATR) - similar to Follow Line's low placement
- When price breaks below the lower band (bearish signal), the trend line is set to the high (optionally adjusted with ATR) - similar to Follow Line's high placement
- The trend line acts as dynamic support/resistance, following the price action more precisely than the original Follow Line
ATR Filter (Follow Line Enhancement)
- Like the original Follow Line Indicator, an ATR filter can be selected to place the line at a more distance level than the normal mode settled at candles Highs/Lows
- When enabled, it adds/subtracts ATR value to provide more conservative trend line placement
- Helps reduce false signals in volatile markets
- This feature maintains the core philosophy of the Follow Line while adding more precision through band-based triggers
Signal Generation
- Buy Signal: Generated when trend changes from bearish to bullish (trend line starts rising)
- Sell Signal: Generated when trend changes from bullish to bearish (trend line starts falling)
- Signals are displayed as labels on the chart
Visual Elements
- Upper and lower bands are plotted in gray
- Trend line changes color based on direction (green for bullish, red for bearish)
- Background color changes based on trend direction
- Buy/sell signals are marked with labeled shapes
How It Works
Band Calculation: Based on the selected band type, upper and lower boundaries are calculated
Signal Detection: When price closes above the upper band or below the lower band, a breakout signal is generated
Trend Line Update: The trend line is updated based on the breakout direction and previous trend line value
Trend Direction: Determined by comparing current trend line with the previous value
Alert Generation: Buy/sell conditions trigger alerts and visual signals
Use Cases
Enhanced trend following strategies: More precise than basic Follow Line due to band-based triggers
Breakout trading: Multiple band types provide various breakout opportunities
Dynamic support/resistance identification: Combines Follow Line concept with band analysis
Multi-timeframe analysis with different band types: Choose the most suitable band for your timeframe
Reduced false signals: Band confirmation provides better entry/exit points compared to simple trend following

ORB & Sessions [Capitalize Labs]ORB & Sessions Indicator
The ORB & Sessions Indicator provides a structured way to analyze intraday price action by combining two well-established concepts: global trading sessions and Opening Range Breakouts (ORB). It is designed to help traders identify where liquidity forms, when volatility expands, and how price behaves around key session and range levels.
Market Sessions Framework
Displays New York, London, and Asian sessions directly on the chart.
Each session can be shown as a highlighted background zone, or with extended highs and lows for liquidity tracking.
Session highs and lows remain projected forward after the session ends, allowing traders to monitor sweeps, retests, and reactions throughout the day.
Session times are fully customizable and can be aligned with the trader’s own timezone or broker feed.
This structure helps traders place price action into context, whether during quiet Asian trading, London-driven volatility, or New York reversals.
Opening Range Breakouts (ORB)
Supports three independent ORBs, each with configurable session times.
During the defined ORB window, the indicator captures the high and low of the range and plots a live updating box.
Once the ORB closes, the range locks and projects breakout targets (T1 and T2) based on user-defined risk-to-reward multiples.
Alerts are included for breakouts of highs, lows, or target levels.
Traders can use a single ORB or multiple—for example, tracking an Asian ORB into London, or London into New York.
Visualization and Clarity
Color-coded boxes and levels for sessions and ORBs.
Labels such as “Range High” and “Range Low” ensure clarity without clutter.
Flexible display settings allow highlighting full zones, just lines, or minimal markers depending on preference.
Practical Applications
This indicator is useful for:
Liquidity and volatility analysis: Observe where session highs and lows form and how they influence later trading.
Breakout and reversal strategies: Use ORB ranges to define risk and plan target projections.
Time-based research: Explore how different session overlaps or ORBs affect markets like indices, FX, and commodities.
Risk planning: Built-in R-multiple targets provide a consistent framework for evaluating setups.
Why It’s Different
Instead of showing sessions and ORBs separately, this indicator integrates them into one framework. Traders can:
See when and where sessions open and establish range levels.
Define precise ORBs with customizable timing.
Track breakout levels and targets in real time with alerts.
The result is a clear, time-structured view of the trading day, helping traders align setups with session dynamics and opening range behavior.
This indicator does not generate buy or sell signals. It is an analytical and visualization tool, providing structure for traders to better interpret intraday price action.

Trishul Tap Signals (v6) — Liquidity Sweep + Imbalanced RetestTrishul Tap Signals — Liquidity Sweep + Imbalanced Retest
Type: Signal-only indicator (non-repainting)
Style: Price-action + Liquidity + Trend-following
Best for: Intraday & Swing Trading — any liquid market (stocks, futures, crypto, FX)
Timeframes: Any (5m–1D recommended)
Concept
The Trishul Tap setup is a liquidity-driven retest play inspired by order-flow and Smart Money Concepts.
It identifies one-sided impulse candles that also sweep liquidity (grab stops above/below a recent swing), then waits for price to retest the origin of that candle to enter in the trend direction.
Think of it as the three points of a trident:
Trend filter — Only signals with the prevailing trend.
Liquidity sweep — Candle takes out a recent swing high/low (stop-hunt).
Imbalanced retest — Price taps the candle’s open/low (bull) or open/high (bear).
Bullish Setup
Trend Filter: Price above EMA(200).
Impulse Candle:
Green close.
Upper wick ≥ (wickRatio × lower wick).
Lower wick ≤ (oppWickMaxFrac × full range).
Liquidity Sweep: Candle’s high exceeds the highest high of the last sweepLookback bars (excluding current).
Tap Entry: Buy signal triggers when price later taps the candle’s low or open (user choice) within expireBars.
Bearish Setup
Trend Filter: Price below EMA(200).
Impulse Candle:
Red close.
Lower wick ≥ (wickRatio × upper wick).
Upper wick ≤ (oppWickMaxFrac × full range).
Liquidity Sweep: Candle’s low breaks the lowest low of the last sweepLookback bars (excluding current).
Tap Entry: Sell signal triggers when price later taps the candle’s high or open (user choice) within expireBars.
Inputs
Trend EMA Length: Default 200.
Sweep Lookback: Number of bars for liquidity sweep check (default 20).
Wick Ratio: Required size ratio of dominant wick to opposite wick (default 2.0).
Opposite Wick Max %: Opposite wick must be ≤ this fraction of the candle’s range (default 25%).
Tap Tolerance (ticks): How close price must come to the level to count as a tap.
Expire Bars: Max bars after setup to allow a valid tap.
One Signal per Level: If ON, a base is “consumed” after first signal.
Plot Tap Levels: Show horizontal lines for active bases.
Show Setup Labels: Mark the origin sweep candle.
Plots & Visuals
EMA Trend Line — trend filter reference.
Tap Levels —
Green = bullish base (origin candle’s low/open).
Red = bearish base (origin candle’s high/open).
Labels — Show where the setup candle formed.
Signals —
BUY: triangle-up below bar at bullish tap.
SELL: triangle-down above bar at bearish tap.
Alerts
Two built-in conditions:
BUY Signal (Trishul Tap) — triggers on bullish tap.
SELL Signal (Trishul Tap) — triggers on bearish tap.
Set via Alerts panel → Condition = this indicator → Choose signal type.
How to Trade It
Use in liquid markets with clean price structure.
Confirm with HTF structure, volume spikes, or other confluence if desired.
Place stop just beyond the tap level (or ATR-based).
Target 1–2R or trail behind structure.
Why It Works
Liquidity sweep traps traders entering late (breakout buyers or panic sellers) and forces them to exit in the opposite direction, fueling your entry.
Wick imbalance confirms directional aggression by one side.
Trend filter keeps you aligned with the market’s dominant flow.
Retest entry lets you enter at a better price with reduced risk.
Non-Repainting
Setups form only on confirmed bar closes.
Signals trigger only on later bars that tap the stored level.
No lookahead functions are used.
Disclaimer
This script is for educational purposes only and does not constitute financial advice. Test thoroughly in a simulator or demo before using in live markets. Trading involves risk.

Engulfing Pattern[SpeculationLab]Overview
This script detects two types of engulfing / outer bar patterns and marks them directly on the chart:
Body Engulfing – The current candle’s body range (open–close) completely covers the entire range (high–low) of the previous candle.
Range Engulfing – The current candle’s full range (high–low, including wicks) completely covers the entire range (high–low) of the previous candle.
Direction logic:
Bull – The previous candle is bearish and the selected engulfing rule is met.
Bear – The previous candle is bullish and the selected engulfing rule is met.
Optional: Require the current candle to have the opposite color of the previous one.
This is an open-source pattern recognition tool for learning, backtesting, and chart review. It is not financial advice.
Key Features
Two detection modes:
body – Body engulfs previous entire range
range – Wicks engulf previous entire range
Direction detection based on the previous candle’s color, with optional opposite-color confirmation
Chart markers: “BULL” /“BEAR” above bars
Alert-ready: built-in conditions for bullish and bearish engulfing patterns
Parameters
Engulfing Type: body / range
body: Current body must fully cover the previous candle’s high–low range
range: Current full range (high–low) must fully cover the previous candle’s high–low range
Require Opposite Previous Candle (default: off):
When enabled, the engulfing pattern must also have the opposite color from the previous candle to trigger
Usage Tips
Engulfing patterns are price action structures; combine with trend, key levels, and volume for context
Signals confirm on bar close (barstate.isconfirmed) to reduce repainting
Can be used with personal risk management rules (stop-loss, take-profit, filters)
Disclaimer
For educational and research purposes only – not financial advice
Past performance of patterns does not guarantee future results
Trading involves risk; always manage it responsibly
This script is open-source – feel free to learn from or modify it, but credit the original source and author (SpeculationLab)
脚本简介
本脚本用于识别两类包裹/外包形态,并在图表上以标记提示:
Body(实体包裹):当前K线的实体区间(开—收)完全覆盖上一根K线的整个区间(上一根的高—低)。
Range(影线外包):当前K线的影线区间(高—低)完全覆盖上一根K线的整个区间(上一根的高—低)。
方向判定:
Bull(多):上一根为阴线且满足所选包裹规则;
Bear(空):上一根为阳线且满足所选包裹规则;
可选项:要求“当前K线颜色与上一根相反”后再确认(见参数)。
本脚本为开源形态识别工具,适合技术分析学习、回测与复盘,不构成任何投资建议。
主要功能
两种识别模式:body(实体包裹上一根整段) / range(影线包裹上一根整段)。
方向识别:按上一根K线颜色判断多空;可选“当前颜色与上一根相反”的二次确认。
图表提示:plotshape 在K线上方标注 “BULL / BEAR”。
提醒支持:内置 Bullish Engulf / Bearish Engulf 提醒条件。
参数说明
Engulfing Type:body / range
body:当前实体须完全覆盖上一根的高—低整段;
range:当前高—低须完全覆盖上一根的高—低整段。
Require Opposite Previous Candle(默认关闭):
开启后,除满足包裹规则外,还需当前K线颜色与上一根相反才触发标记。
使用建议
包裹/外包是价格行为结构,建议结合趋势、关键价位、成交量等因素综合判断。
信号在收盘时确认(barstate.isconfirmed),以减少重绘干扰。
可与个人风格的风险控制规则(止损、止盈、过滤条件)配合使用。
合规与免责声明
本脚本仅用于技术研究与学习,不构成任何形式的投资建议或收益承诺。
历史形态并不代表未来结果,交易有风险,请自行评估并承担责任。
本脚本开源,欢迎学习与二次开发;转载或改用请注明来源与作者(SpeculationLab / 投机实验室)。
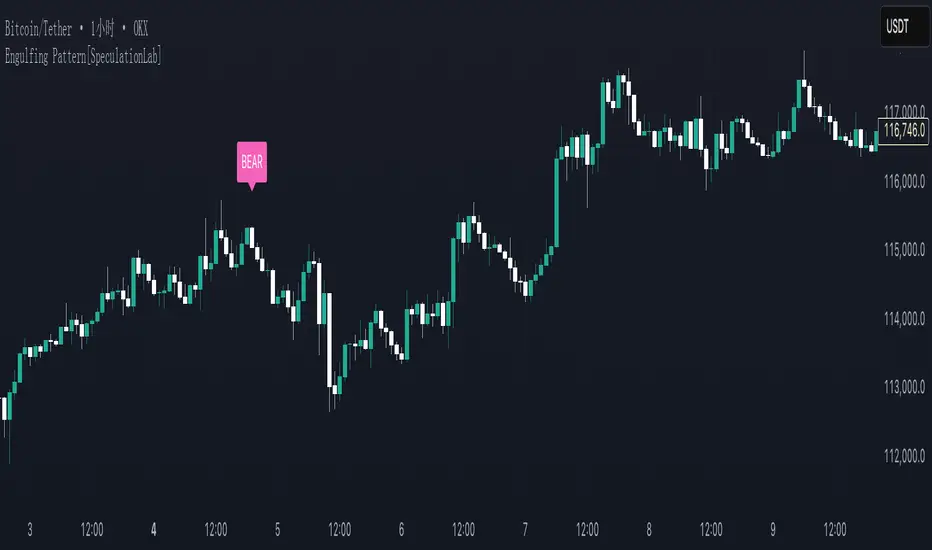
Awesome Indicator# Moving Average Ribbon with ADR% - Complete Trading Indicator
## Overview
The **Moving Average Ribbon with ADR%** is a comprehensive technical analysis indicator that combines multiple analytical tools to provide traders with a complete picture of price trends, volatility, relative performance, and position sizing guidance. This multi-faceted indicator is designed for both swing and positional traders looking for data-driven entry and exit signals.
## Key Components
### 1. Moving Average Ribbon System
- **4 Customizable Moving Averages** with default periods: 13, 21, 55, and 189
- **Multiple MA Types**: SMA, EMA, SMMA (RMA), WMA, VWMA
- **Color-coded visualization** for easy trend identification
- **Flexible configuration** allowing users to modify periods, types, and colors
### 2. Average Daily Range Percentage (ADR%)
- Calculates the average daily volatility as a percentage
- Uses a 20-period simple moving average of (High/Low - 1) * 100
- Helps traders understand the stock's typical daily movement range
- Essential for position sizing and stop-loss placement
### 3. Volume Analysis (Up/Down Ratio)
- Analyzes volume distribution over the last 55 periods
- Calculates the ratio of volume on up days vs down days
- Provides insight into buying vs selling pressure
- Values > 1 indicate more buying volume, < 1 indicate more selling volume
### 4. Absolute Relative Strength (ARS)
- **Dual timeframe analysis** with customizable reference points
- **High ARS**: Performance relative to benchmark from a high reference point (default: Sep 27, 2024)
- **Low ARS**: Performance relative to benchmark from a low reference point (default: Apr 7, 2025)
- Uses NSE:NIFTY as default comparison symbol
- Color-coded display: Green for outperformance, Red for underperformance
### 5. Relative Performance Table
- **5 timeframes**: 1 Week, 1 Month, 3 Months, 6 Months, 1 Year
- Shows stock performance **relative to benchmark index**
- Formula: (Stock Return - Index Return) for each period
- **Color coding**:
- Lime: >5% outperformance
- Yellow: -5% to +5% relative performance
- Red: <-5% underperformance
### 6. Dynamic Position Allocation System
- **6-factor scoring system** based on price vs EMAs (21, 55, 189)
- Evaluates:
- Price above/below each EMA
- EMA alignment (21>55, 55>189, 21>189)
- **Allocation recommendations**:
- 100% allocation: Score = 6 (all bullish signals)
- 75% allocation: Score = 4
- 50% allocation: Score = 2
- 25% allocation: Score = 0
- 0% allocation: Score = -2, -4, -6 (bearish signals)
## Display Tables
### Performance Table (Top Right)
Shows relative performance vs benchmark across multiple timeframes with intuitive color coding for quick assessment.
### Metrics Table (Bottom Right)
Displays key statistics:
- **ADR%**: Average Daily Range percentage
- **U/D**: Up/Down volume ratio
- **Allocation%**: Recommended position size
- **High ARS%**: Relative strength from high reference
- **Low ARS%**: Relative strength from low reference
## How to Use This Indicator
### For Trend Analysis
1. **Moving Average Ribbon**: Look for price above ascending MAs for bullish trends
2. **MA Alignment**: Bullish when shorter MAs are above longer MAs
3. **Color coordination**: Use consistent color scheme for quick visual analysis
### For Entry/Exit Timing
1. **Performance Table**: Enter when showing consistent outperformance across timeframes
2. **Volume Analysis**: Confirm entries with U/D ratio > 1.5 for strong buying
3. **ARS Values**: Look for positive ARS readings for relative strength confirmation
### For Position Sizing
1. **Allocation System**: Use the recommended allocation percentage
2. **ADR% Consideration**: Adjust position size based on volatility
3. **Risk Management**: Lower allocation in high ADR% stocks
### For Risk Management
1. **ADR% for Stop Loss**: Set stops at 1-2x ADR% below entry
2. **Relative Performance**: Reduce positions when consistently underperforming
3. **Volume Confirmation**: Be cautious when U/D ratio deteriorates
## Best Practices
### Timeframe Recommendations
- **Intraday**: Use lower MA periods (5, 13, 21, 55)
- **Swing Trading**: Default settings work well (13, 21, 55, 189)
- **Position Trading**: Consider higher periods (21, 50, 100, 200)
### Market Conditions
- **Trending Markets**: Focus on MA alignment and relative performance
- **Sideways Markets**: Rely more on ADR% for range trading
- **Volatile Markets**: Reduce allocation percentage regardless of signals
### Customization Tips
1. Adjust reference dates for ARS calculation based on significant market events
2. Change comparison symbol to sector-specific indices for better relative analysis
3. Modify MA periods based on your trading style and market characteristics
## Technical Specifications
- **Version**: Pine Script v6
- **Overlay**: Yes (plots on price chart)
- **Real-time Updates**: Yes
- **Data Requirements**: Minimum 252 bars for complete calculations
- **Compatible Timeframes**: All standard timeframes
## Limitations
- Performance calculations require sufficient historical data
- ARS calculations depend on selected reference dates
- Volume analysis may be less reliable in low-volume stocks
- Relative performance is only as good as the chosen benchmark
This indicator is designed to provide a comprehensive analysis framework rather than simple buy/sell signals. It's recommended to use this in conjunction with your overall trading strategy and risk management rules.

Prev D/W/M + Asia & London Levels [Oeditrades]Prev D/W/M + Asia & London Levels
Author: Oeditrades
Platform: Pine Script® v6
What it does
Plots only the most recent, fully completed:
Previous Day / Week / Month highs & lows
Asia and London session highs & lows
Levels are drawn as true horizontal lines from the period/session start and extended to the right for easy confluence reading. The script is non-repainting.
How it works
Prev Day/Week/Month: Uses completed HTF candles (high / low ) so values are fixed for the entire next period.
Sessions (NY time): Asia (default 20:00–03:00) and London (default 03:00–08:00) are tracked in America/New_York time. High/low are locked when the session ends, and the line is anchored at that session’s start.
Inputs & customization
Visibility: toggle Previous Day/Week/Month, Asia, London, and labels.
Colors: highs default red; lows default green (user-configurable). Session highs default pink, lows aqua (also editable).
Style: line style (solid/dotted/dashed) and width.
Sessions: editable time windows for Asia and London (still interpreted in New York time).
Disclaimer: optional on-chart disclaimer panel with editable text.
Notes
Works on any timeframe. For intraday charts, the HTF values remain constant until the next HTF bar completes.
If your market’s overnight hours differ, simply adjust the session windows in Inputs.
Lines intentionally show only the latest completed period/session to keep charts clean.
Use cases
Quick view of PDH/PDL, PWH/PWL, PMH/PML for bias and liquidity.
Intraday planning around Asia/London range breaks, retests, and overlaps with prior levels.
Disclaimer
This tool is for educational purposes only and is not financial advice. Markets involve risk; past performance does not guarantee future results.
