Sessions High/Low with Break LogicSessions High/Low with Break Logic – Indicator Description
Update 27.10.25
Overview
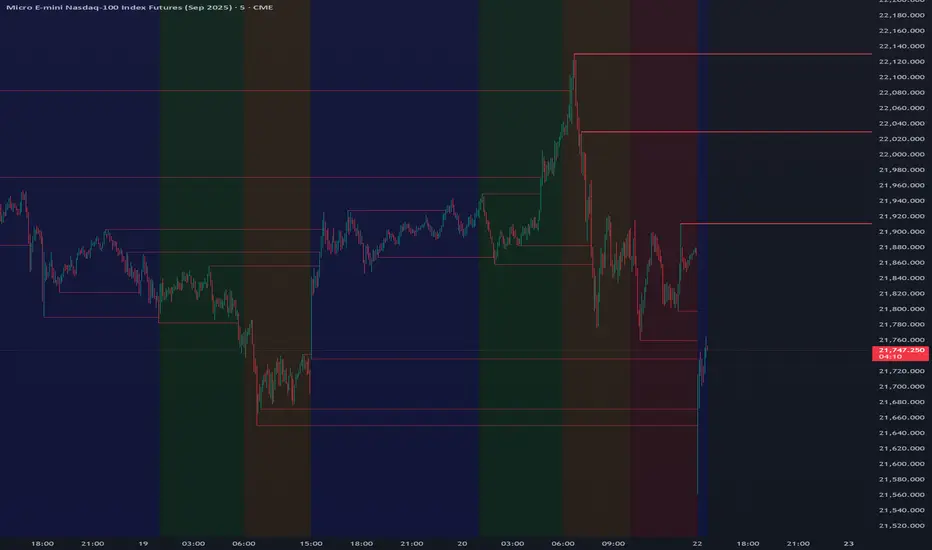
This indicator marks the highs and lows of key trading sessions (Tokyo, London, New York) and highlights when these levels are broken. It is ideal for traders using session-based strategies to monitor breakouts or support/resistance levels in real time.
Key Features
Session-Based Highs/Lows:
Tracks highs and lows for three trading sessions:
Tokyo: 02:00–09:00 (UTC+1)
London: 09:00–17:00 (UTC+1)
New York: 15:30–22:00 (UTC+1)
Break Logic:
Detects when the current price breaks a session high or low.
Labels are updated with a "Break" note when a level is breached.
Visual Display:
Draws horizontal lines for highs and lows of each session.
Adds labels with values (optionally including price).
Colors are customizable for each session:
Tokyo: Purple
London: Teal
New York: Orange
Customizable Settings:
Horizontal Offset: Shifts lines and labels horizontally for clarity.
Time Zone: Adjustable to UTC+1 (default).
Price Display: Option to show the exact price next to the label.
Settings and Translations
Display Settings
Horizontal Offset: Horizontal shift for lines and labels.
Show Price with Text: Displays the price next to the label (e.g., "London High: 123.45").
Time Settings
UTC: Time zone (default: UTC+1).
Session 1 (Tokyo)
Session 1: 02:00–09:00
High Text: "Tokyo High"
Low Text: "Tokyo Low"
High Color: Purple
Low Color: Purple
Session 2 (London)
Session 2: 09:00–17:00
High Text: "London High"
Low Text: "London Low"
High Color: Teal
Low Color: Teal
Session 3 (New York)
Session 3: 15:30–22:00
High Text: "New York High"
Low Text: "New York Low"
High Color: Orange
Low Color: Orange
Indicatore Pine Script®