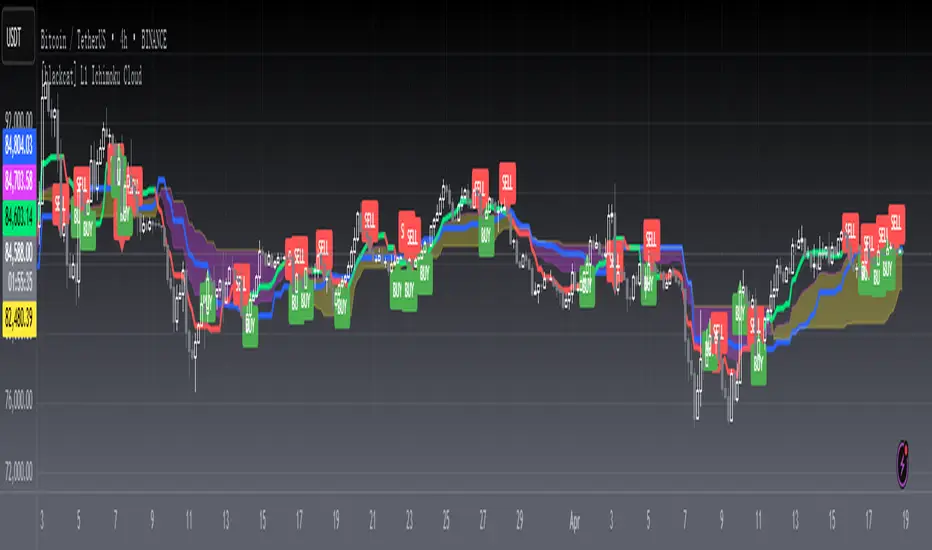
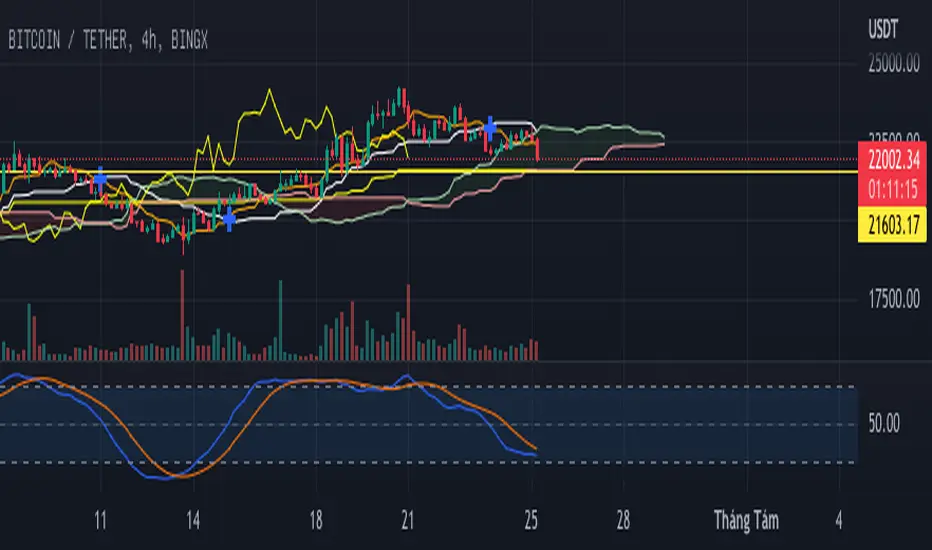
Combo Ichimoku + CDC Action Zone by fukuizThis indicator combines the famous indicators Ichimoku and CDC ActionZone.
#A brief introduction to Ichimoku #
The Ichimoku Cloud is a collection of technical indicators that show support and resistance levels, as well as momentum and trend direction. It does this by taking multiple averages and plotting them on a chart. It also uses these figures to compute a “cloud” that attempts to forecast where the price may find support or resistance in the future.
#A brief introduction to CDC ActionZone #
CDC ActionZone is a very simple system, utilizing just two exponential moving averages. The 'zones' in which different 'actions' should be taken are highlighted in different colors. Calculations for the zones
They are based on the relative position of price to the two EMA lines and the relationship between the two EMAs.
The CDC ActionZone was developed by Piriya333, a Thai technical analyst.
#How to use #
The basic method for using Ichimoku+CDC ActionZone is to follow the green/red color and the cloud.
Buy condition
-Buy when the bar closes in green and closes above the cloud
Sell condition
-sell when the bar closes in red.
Cerca negli script per "ichimoku"

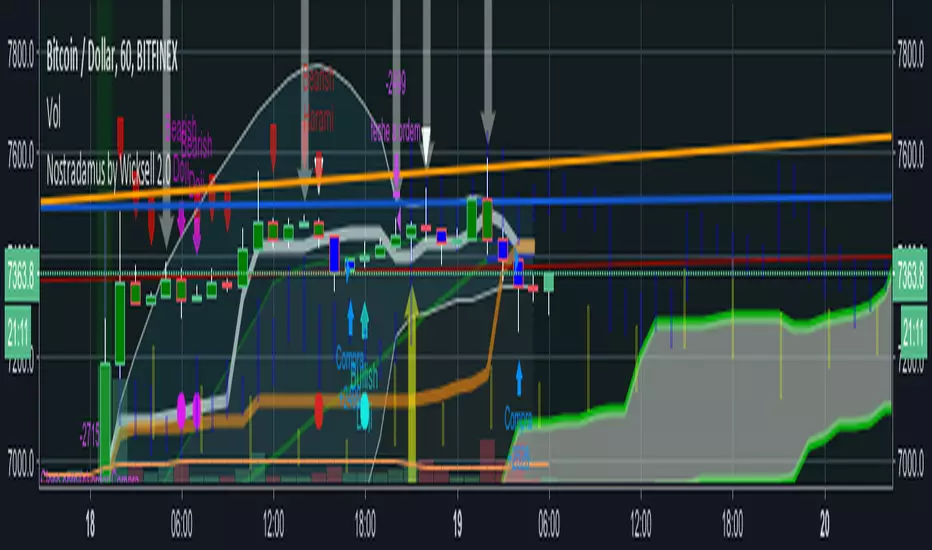
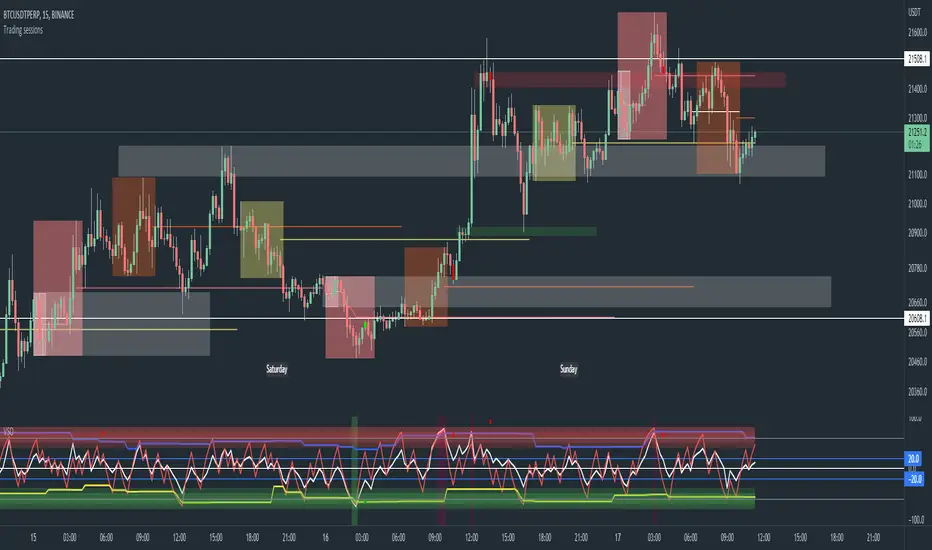
Trading sessions, Ichimoku and Classic Pivots█ OVERVIEW
This a self contained intraday trading style for crypto/forex made to be on and traded on 15-min.
This Script Creates a box around each major session to a trading range, include highlights for the first 12 15-min candles, classic Pivot points and ichimoku cloud.
█ CONCEPTS
1 — Session boxes and ranges are based of the times from Steve from Beat the market maker, and you have the option in setting to have an extension for the high/low until the start of the next box calculation.
2 — 12 candle window, this marks the first 3 hours after a open;
The first hour - stop hunt
The second hour - big moves
The third hour - tend continuation or reversal
3 — The Days of the weeks are labelled and coloured;
Weekends are in grey, ideally no trade days.
Monday, Tuesday, Thursday are green, to mark the week days
Wednesday is red to be mindful of mid week reversal
Friday is red to mark the end of week
4 — Ichimoku cloud, by default the only thing visible is the kumo cloud, but in setting you can turn the line back on. Ichimoku proves a great mark for areas to look for support and resistances.
5 — Lastly, you have classic pivots, by default they are extend to the right and on weekly, Each level act as support and resistance. Look for Bullish momentum at R3 for a larger moves to the upside.
Ichimoku and the pivot are here mainly for when you want to do higher time frame analysis.
█ OTHER SECTIONS
• HOW TO USE
Example of a trade
**Key thing to remember is London will set the high in a down trend and the low in an up trend
you can see the first hour look for stops and stopped at 50% of the range set coming into the session, the second hour a big move to the down side hitting 200% expansion then the third hour reversal stopping wick up then
back down from from London low. before continuing down.
• LIMITATIONS: I have not test this on Stock, as I have a different strategies for those market
• NOTES : I know a lot of people have moving averages on their chart, I have another separate one with all MA types, and it something that will not fit into one script, Other things you can add with this Bollinger bands, and
fib tool with 50%, 100%, 150% and 200%
[blackcat] L1 Ichimoku CloudLevel: 1
Background
In Muranaka's article, "Ichimoku Cloud" was described. It contains Ichimoku - Lines and Ichimoku - Cloud.
Function
In the article, Muranaka states that the "market has improved when the delayed line is above the closing prices at that past date." Thus, for this indicator, when the delayed line is above the closing prices at the past date, the turning line will be Green. When the delayed line is below the closing prices at the past date, the turning line will be Red. I eliminate the need to display the delayed line (Silver color). Of course, you can choose to display the delayed line by setting the ShowDelayLine input to true.
Key Signal
Standard Line --> Blue line;
Turning Line --> Green and Red;
Delayed --> Not shown, Silver.
Span1 and Span 2 --> Ichimoku Cloud, Yellow for up trend and Fuchsia for down trend.
Remarks
This is a Level 1 free and open source indicator.
Feedbacks are appreciated.
MACD/EMA/SMA/Ichimoku Confluence StrategyThis strategy uses a number of chart indicators to provide a Bullish/Bearish signal. Using a combination of the 200 SMA, the 20 EMA, the MACD and the Ichimoku cloud, the strategy logic will adjust the amount of confluence required between the indicators depending on how bullish or bearish the chart is looking. The logic looks for the following:
- Are we above or below the 200 SMA?
- Are we above or below the 20 EMA?
- Have we had a bullish MACD cross?
- Where are we in relation to the Ichimoku cloud?
If the coin is below the 200 SMA, then the strategy will only give a buy signal if the coin closes a candle above the 20 EMA AND the MACD is bullish and either the Ichimoku cloud is green, or the coin is above the Ichimoku cloud (regardless of colour).
If the coin is above the 200 SMA, Then the strategy will give a buy signal if the coin closes a candle above the 20 EMA AND the MACD is bullish and the coin is either IN the cloud (not necessarily above it) or the cloud is green.
The reverse is true for a sell signal, i.e. when the coin is above the 200 SMA it must close a candle below the Ichimoku cloud and be bearish in relation to the 20 EMA and MACD. If it is below the 200 SMA, then the strategy will give a sell signal if the the EMA/MACD conditions are true and the coin enters the cloud.
This strategy gives a fairly conservative signal for entry and exit points, but is fairly successful across a number of time frames, both short term and long term. As with all my strategies, I only include LONG entries and closes, not SHORT entries (as I find they make for inaccurate backtesting).
Please feel free to like, share, critique and suggest any improvements to this strategy. All feedback, positive and negative, is appreciated.

Price Forecast - Future price Ichimoku ATR RSI Kumo It predicts
Future price (projected close)
future high-low (ATR projection)
Ichimoku Future Span overlay
alerts "future price above/below threshold".
Ichimoku Kumo Projection (Leading Span A & B). Senkou Span A (Future A) Senkou Span B (Future B).
ATR Projection Channel (ATR Bands/Volatility Forecast).
Linear regression forecast for +1 bar.
Multi timeframe
RSI+Kumo filter for clearer signals.

PIVOT AND ICHIMOKU BACKGROUND BY PRANOJIT DEYIt shows pivot bias in relation to day open line and it also shows ichimoku bullish trend background. good for option buyers to understand market bias.

Backtest - Ichimoku CloudThis script find the entry position on a chart using Ichimoku clud conditions.
and also exit condition based on base line & price close w.r.t to Ichi cloud.

HTS-Ichimoku CloudAdd more a Longline into the basic ichimoku in order to see the support or assistant especially when the price is outside of cloud.
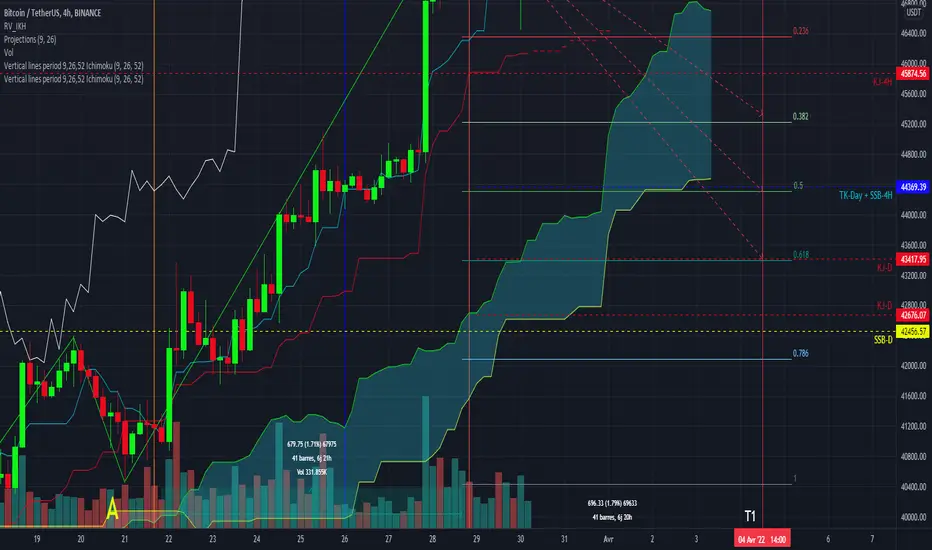
Vertical lines period 9,26,51 Ichimokuallows you to view the old prices on periods 9, 26 and 51 on the Ichimoku indicator. Periods and color can be changed. Can be used on all products. it saves you from having to count the old candles
MultiScripts: EMAs + ST + S & R + IchimokuMulti scripts:
Multi EMAs
Super-Trend
Support and Resistence
Ichimoku Cloud

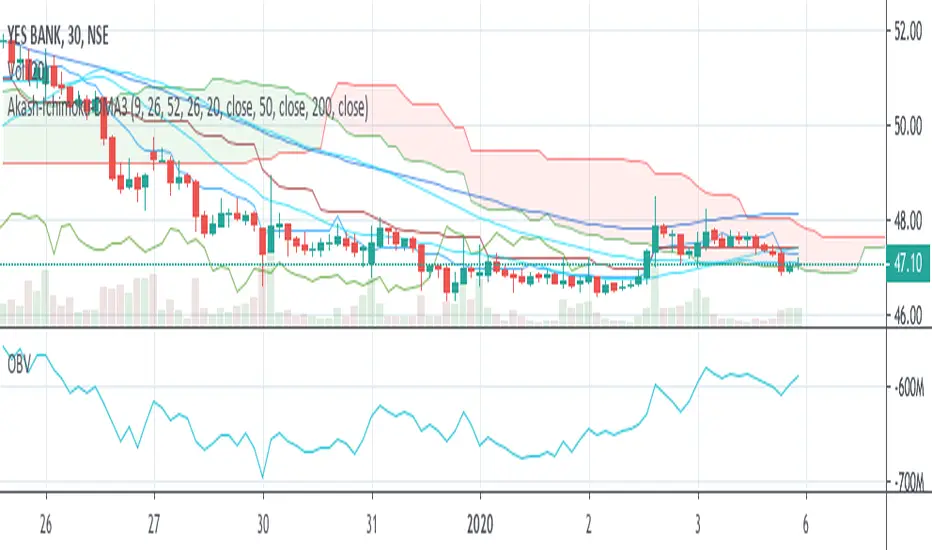
Akash-Ichimoku Cloud + Moving avg of 20-50-200Its a convenient combo indicator of ichimoku cloud and moving averages of 20-50-200
This can help save on limit of indicators in free version.
Most of the positional trading calls can be done with this combo indicator.
Akash Rajpal
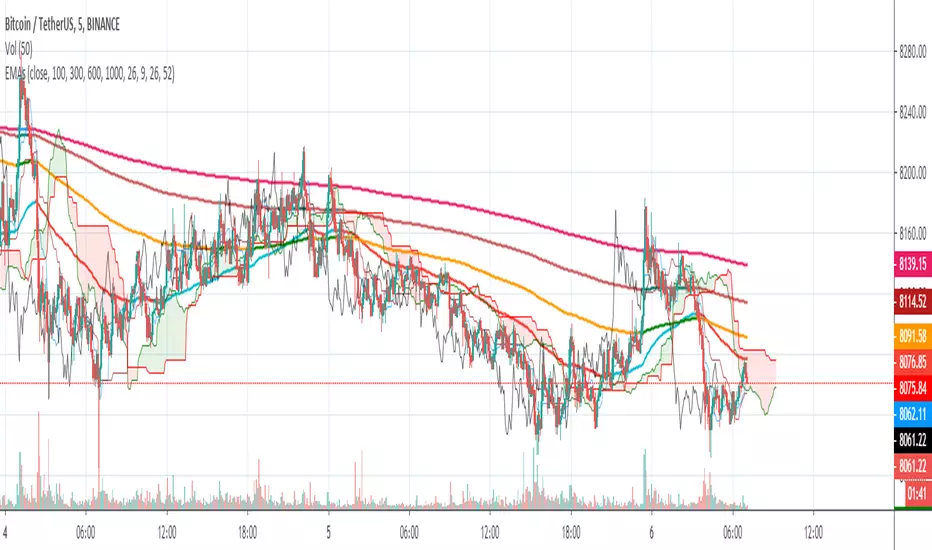
4 EMAs With Colors(100,300,600,1000)+ichimoku Cloud4 EMAs With Colors(100,300,600,1000) To detect trend
+ichimoku Cloud to have successful trading
Most Important Moving Averages for Me with Ichimoku+ Pivot StratMost Important Moving Averages for Me with Ichimoku+ Pivot Strat
All in One Chart
It's easy for me


Auto IchimokuA strategy where entries are calculated for you using the Ichimoku Cloud. The IC isn't plotted though, just a heads up.

Geometric Ichimoku CloudThis version of the Ichimoku Cloud indicator uses the geometric mean rather than the arithmetic mean.


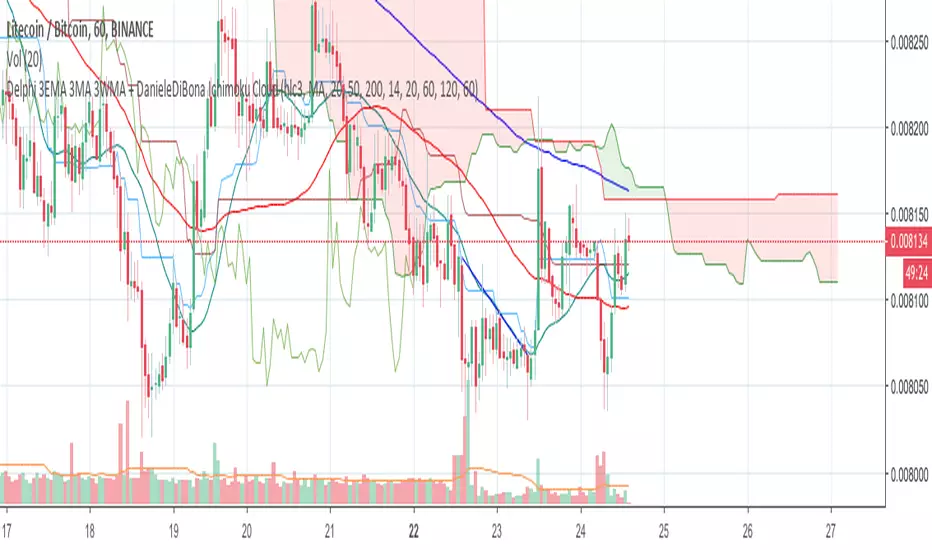
Delphi 3EMA 3MA 3WMA + DanieleDiBona Ichimoku Cloudadded Ichimoku Cloud with amazing settings included ;)))

MACD + RSI + EMA + SMA + Ichimoku + overbought + buy, sell +Doji// MACD + EMA 200 *** buy and sell strategy (RSI, EMA, SMA) *** Doji Harami *** overbought and oversold *** trend direction *** divergence *** Ichimoku
Use this script in time 1h