Ichimoku_RSI_MACDIchimoku cloud + RSI + MACD. Combined indicators with signals, indicating whether it is bullish or bearish (BUY or SELL).
Cerca negli script per "ichimoku"

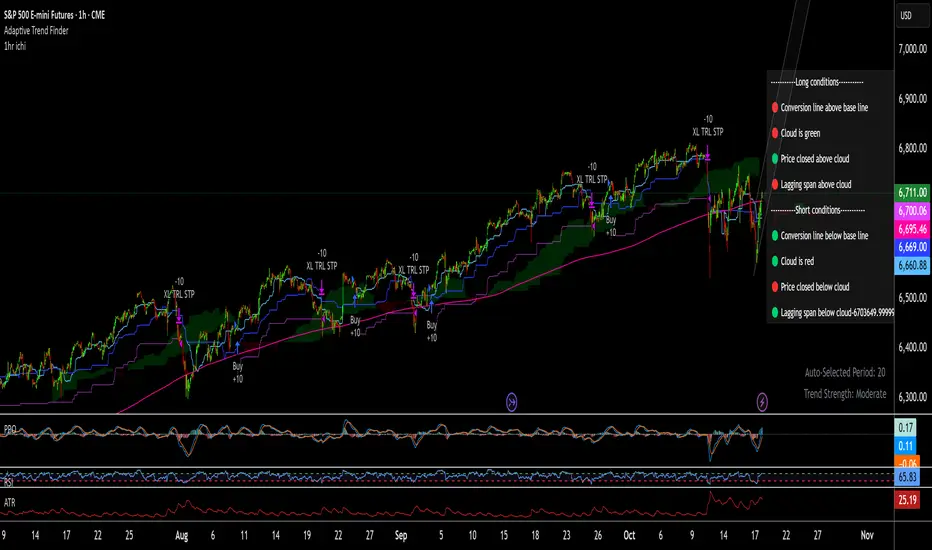
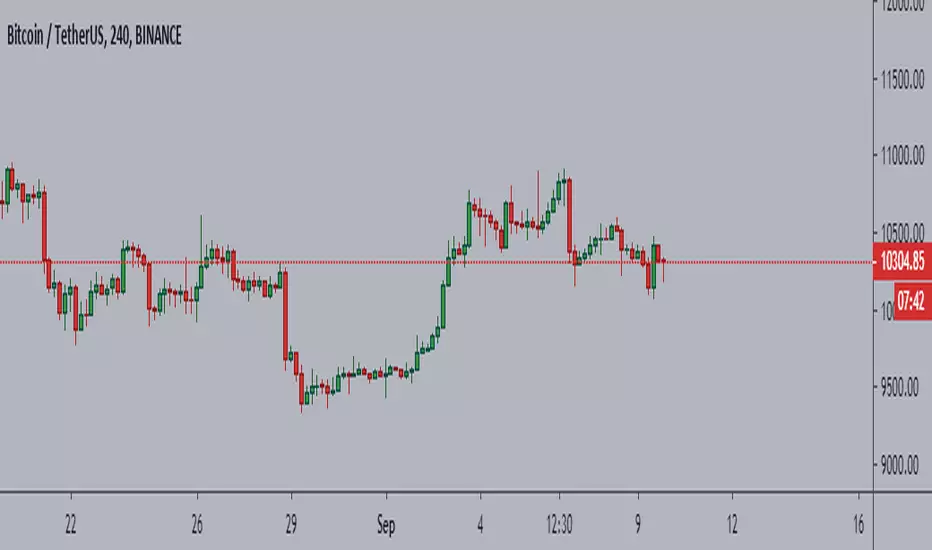
1hr ichi v6Ichimoku adapted to a 1hr chart
Set margin for positions to "0"
Adjust the number of contracts to the maximum drawdown you will accept. I use 11-13%
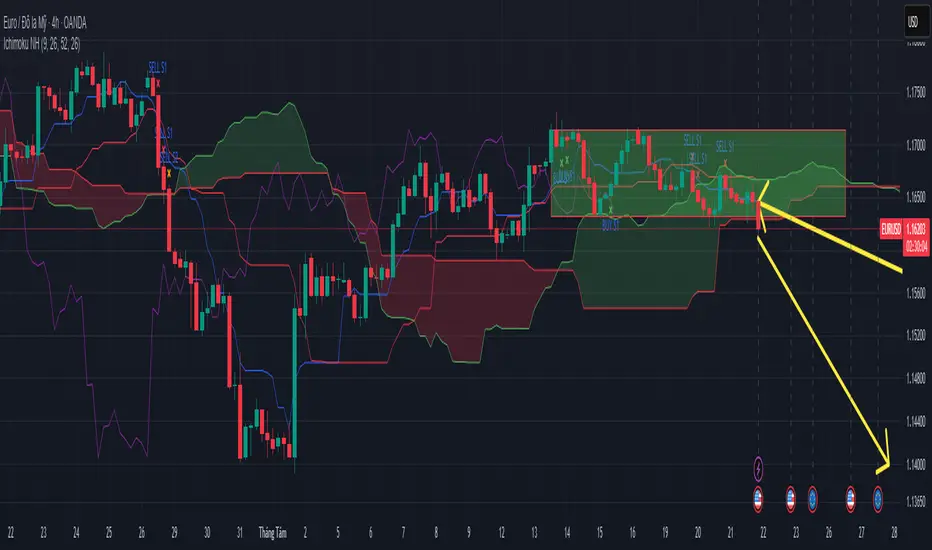
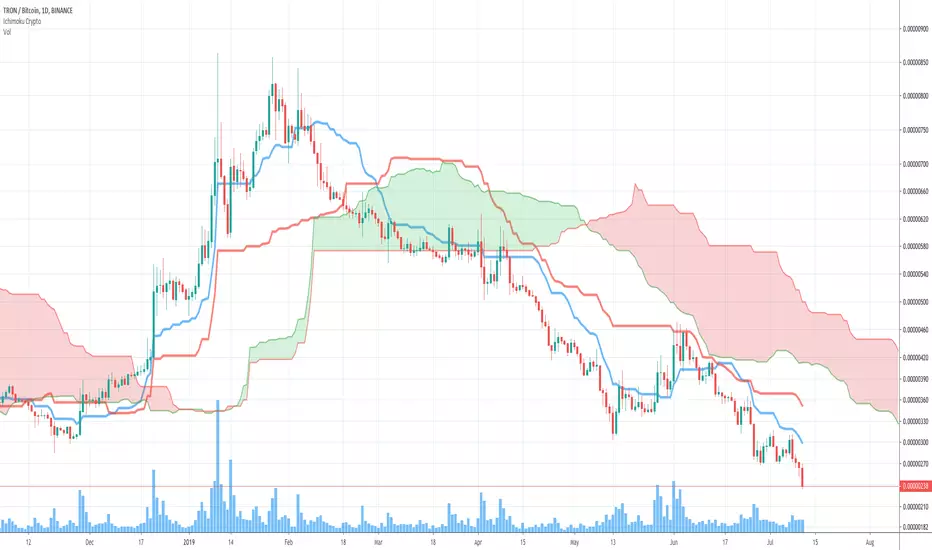
Ichimoku Trading Signals 1Swing Trading (Strategy 1, H4+ timeframes)
Use the Kumo Cloud to identify the trend: price above a green cloud = uptrend; price below a red cloud = downtrend.
Entry signals occur when price or the Tenkan-sen line crosses the Kijun-sen line, confirmed by Chikou Span momentum.
Exit triggers when price crosses back through the Kijun-sen or when Tenkan-sen crosses back below (for long positions) or above (for short positions).
Place stop-loss orders just beyond the nearest swing low/high candle cluster to manage risk tightly.
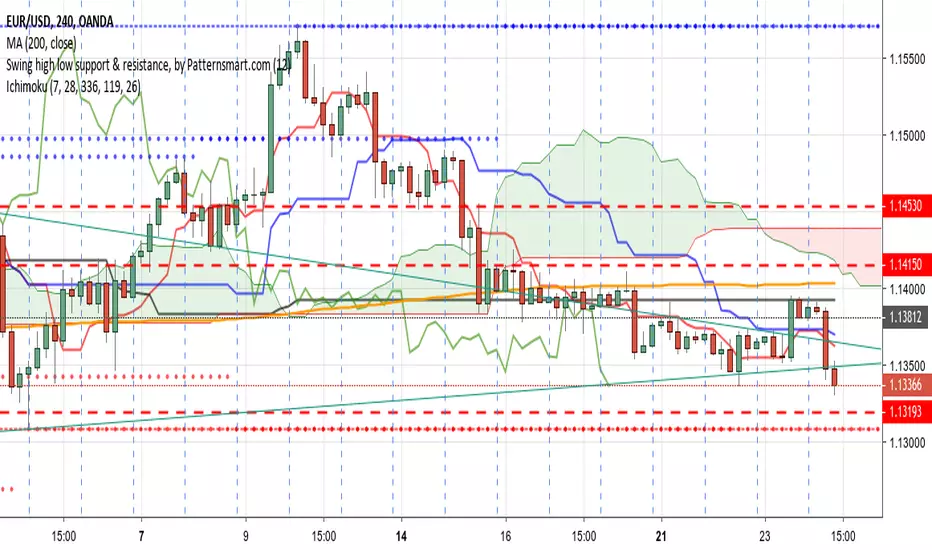
Ichimoku Trading Signals 2Swing Trading (Strategy 1, H4+ timeframes)
Use the Kumo Cloud to identify the trend: price above a green cloud = uptrend; price below a red cloud = downtrend.
Entry signals occur when price or the Tenkan-sen line crosses the Kijun-sen line, confirmed by Chikou Span momentum.
Exit triggers when price crosses back through the Kijun-sen or when Tenkan-sen crosses back below (for long positions) or above (for short positions).
Place stop-loss orders just beyond the nearest swing low/high candle cluster to manage risk tightly.

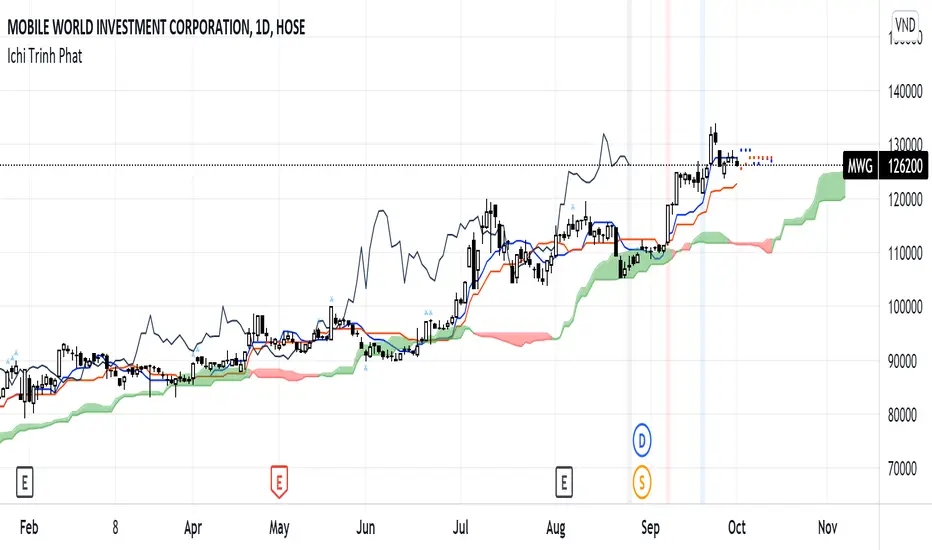
Ichimoku Trinh Phat - By NicolasShow the potential movement of Tenkan & Kijun in the future with assumption that the current highest price and lowest price of their period is unchanged
Show where the Tenkan and Kijun unite that preapre for a potential big movement
Alert for Union Signal, Breakout, Breakdown signal
Background Color Based on EMAHello Traders,
this is a very simple script. It paints the background color based on the close price in reference to an exponential moving average.
If the close is above the EMA the background color will be green.
If the close is under the EMA the background color will be red.
You can adjust colors and the EMA period by yourself.
This little indicator script is just to get a better overview, for example in combination with other indicators.
Hope you guys like this script. Wish you a great trading week.

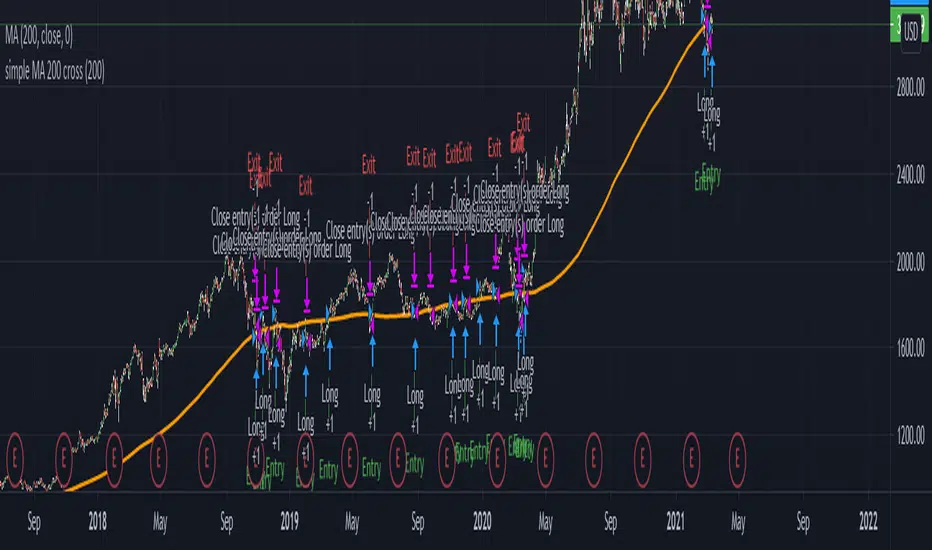
Basic SMA 200 StrategyThe SMA 200 basic strategy will be more than familiar to most traders.
This strategy is to stay with the programming language so to say the "Hello World" of trading.
The SMA 200 basic strategy is also one of the simplest strategies in trading. All that is required is the price and a 200 period moving average. Usually the strategy is used in the daily chart.
The rules are as follows:
Entry: A position is opened when the price crosses the moving average 200 from the bottom to the top.
Exit: The position is closed when the price crosses the moving average from top to bottom.
This is a trend following system and was originally used for trading stocks.
In my opinion, trading with the strategy is recommended to every beginner. There are strategies with better performance, but they are much more complicated to implement. And that's where the big advantage of the strategy can be seen.
Beginners are more than overwhelmed at the beginning of their trading career. Often beginners trade in the 5 min chart with 6 different indicators some signals that they have seen in a Youtube video.
Comparable to a beginner driver who immediately gets into a Porsche as his first car.
Beginners should follow simple rules and avoid intraday charts. Above all, you should do the actual work of a trader.A trader does not just press the mouse twenty times a day and then has easily earned 2000 $. A trader tests systems down to the smallest detail, optimizes and tests again, until he has found an almost " waterproof " trading system. The 200 SMA basic strategy is excellent for gaining experience, learning to follow the rules of a system and not to burn your money right away.
With this script you can test how successful the "simplest strategy in the world" would have been in the past.
Small tip: Do not trade Forex with it it will never work. The strategy is made for long trends and you can find them for example in the stock market.
Have fun with it! About a positive feedback I would be very happy of course.


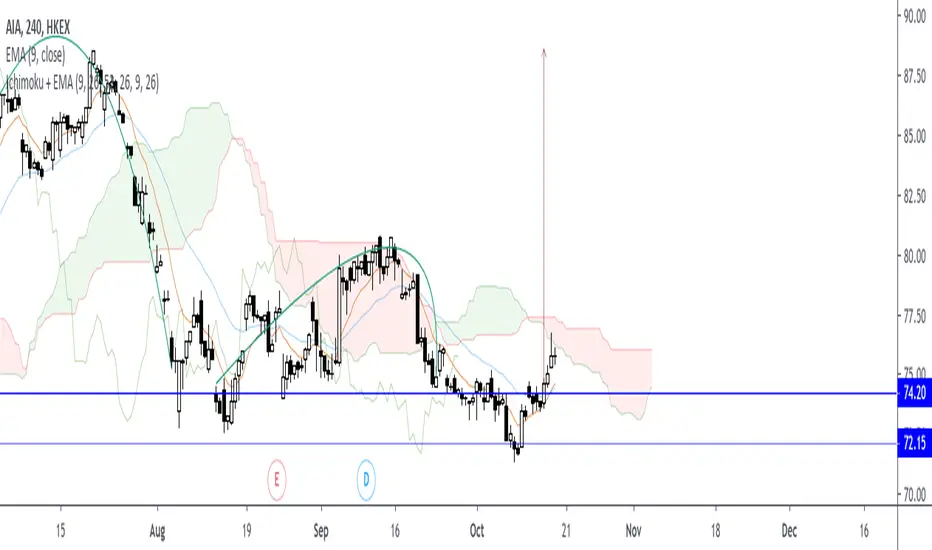
Ichimoku Cloud + EMA9,26instead of Base and Conversion, EMA9 and EMA26 is used to give more weight in recency of price movement


Ichimoku + Daily-Candle_X + Gaussian Smooth + MacDI take no credit for this script. I swapped the Hull moving average used the original program made by SeaSide420 for a gaussian smooth function made by jjaskulowski. This script seems to consistently outperform the original strategy for the long condition. I'm mainly focused on crypto, so I removed the "short" option because most crypto exchanges don't have this function as of right now.


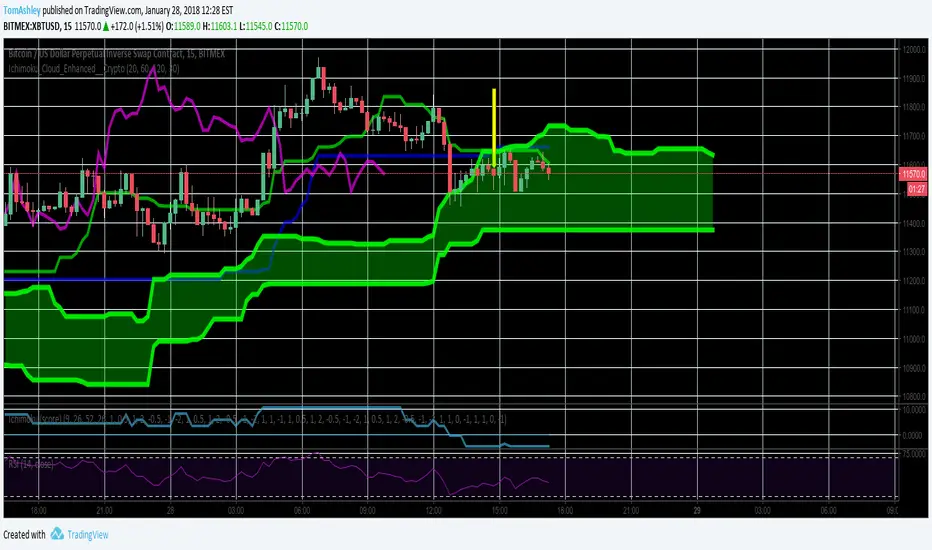
Ichimoku Cloud Enhanced For CryptoIntervals have been changed to account for a 24/7 cryptocurrency trading period. Values were then doubled so that the trader can avoid fakeout breakouts/traps. This leads to a bit less signals but rather, more sure signals instead. Very useful and more safe, even in smaller timeframes. Colors were set to the standard and breakout arrows are now enabled by default.
Ichimoku Cloud with Josh Olszewicz Crpyto Adjusted Settingslets you adjust your cloud to view higher timeframe cloud on lower timeframe by double or tripling timeframe

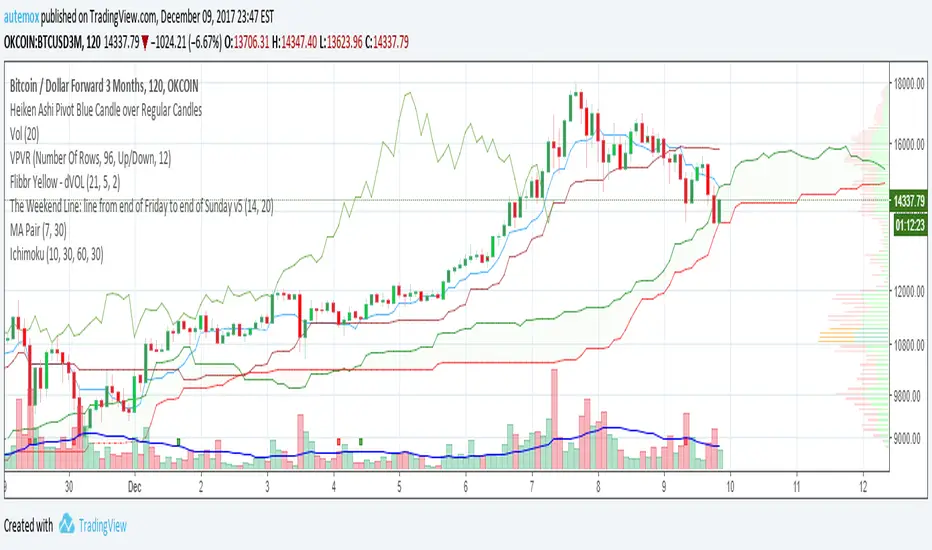
Ichimoku CriptomoneyConfigured for criptomonedas in its first version, testing the new configuration based on 10,30,60

Ichimoku PanOptic TM-V5 by BrainZZUpdate of the previous script.
New functions added:
- Highlight of price crossing KS
- Highlight of TS/KS crossing
- Highlight of rising/falling periods of KS
- Critical levels for SSB, KS and TS/
