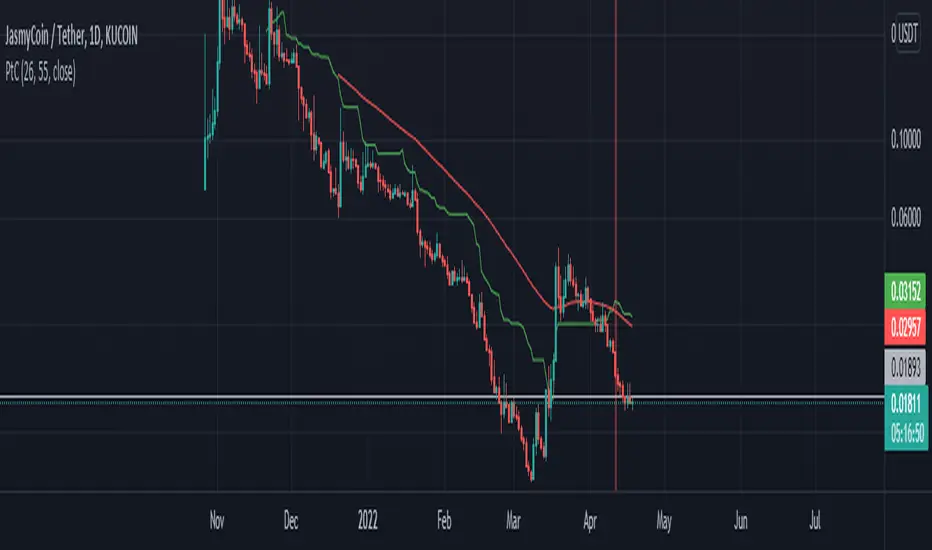
Playing the crossFor this script i used Kijun-sen from Ichimoku Cloud and Moving Average.
Kijun-sen is the base line of the Ichimoku Cloud or the midpoint price of the last 26 period.
Moving Average is a constantly updated average price of a given range.
In this script i used the standard Kijun-sen settings and the Moving Average, 55 length.
You will get an red or green signal when the lines cross each other.
Try the indicator yourself to see, why it could be useful.
A special thanks to @norok and @happyCloud1537 for teaching me!
This will lead to more scripts from my side, since i really like to code and trade.
Cerca negli script per "ichimoku"
Momentum CloudThis is a modified Ichimoku Cloud:
-The default Lookback-Length and Displacement settings have been modified to operate optimally on 24/7 markets - which is popular among Crypto analysts.
-The Lagging Span, Base Line, and Conversion Line have been removed - leaving just the bare cloud.
-Additionally, the Cloud's color will shift blue when it is compressed. (More specifically - when Leading Span A retreats to Leading Span B, the color changes.)
This allows the user to easily identify when the Cloud is "thinning", either to the upside, or the downside.
Being that the "spread" or "width" of an Ichimoku Cloud generally gauges it's efficacy as potential Support or Resistance, this tool is particularly useful for highlighting when momentum is weakening.
*This script will be updated in the future to allow the user to view the Momentum Cloud of alternate time-frames! (e.g, Viewing the 1D Momentum Cloud on the 1H timeframe)

1 Indicator to rule them allThe best combination indicator consisting of 4 SMA's, 4 EMA's, Donchian Channels, Parabolic SAR, Bollinger Bands, Ichimoku Cloud, a trend strength highlight for the bollinger bands background according to the ADX, labels on the chart to draw in when the Directional Index plus and minus cross, and a background highlight for low and high volatility according to the Historical Volatility Percentile.
The Indicators and placed and group intentionally, with the SMA and EMA's next to the Donchian Channels to draw in areas of support and resistance, with the parabolic SAR afterwards for confirmation on entries and exits.
Next are the Bollinger Bands and the Ichimoku cloud, which when used in combination by an experienced trader allows one to see the trend and spot any developing opportunities at a glance. These can be used in combination with the ADX background in the bolls to point out when trends start and end.
The Directional Indexes crossing implies a equilibrium point has been reached between the buy and selling pressure. Finally the background highlight according to low and high periods of volatility does well to ensure you're entering into the best trades at the best times.
These indicators used together in combo with momentum oscillators will lead to a full and complete picture of the trend and the most likely places for future price to come, allowing a holistic view and confluence between different, noncollinear indicators to paint occam's razor onto the charts.

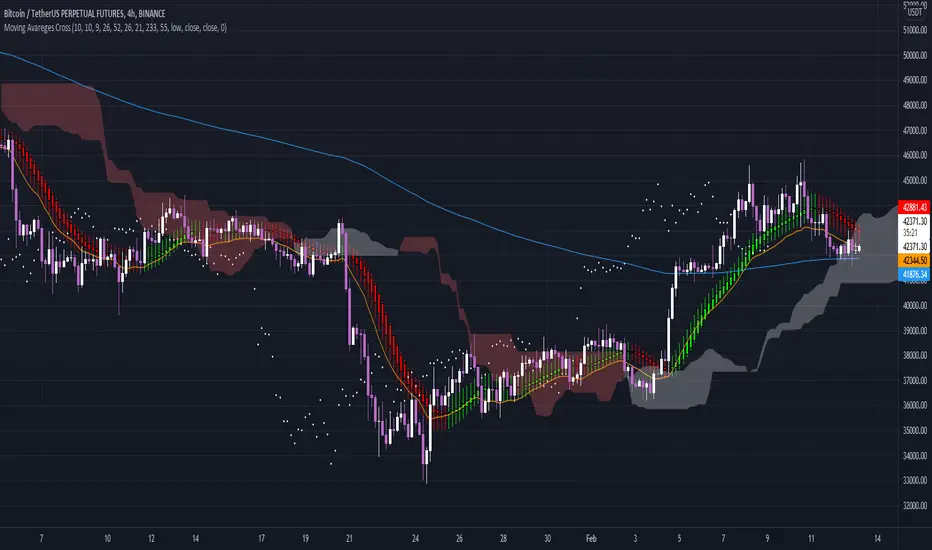
Moving Avareges CrossIn this script I have combined 3 indicators Ichimoku, Heiken Ashi and Moving Average Exponential.
In this strategy, you should first look for the current market trend in low time frames.
Then look at the higher time frames to decide if you are in the right place to enter the trade.
For example, in 1 minute time frame, we first look at whether the two averages 21 and 233 had a cross or not.
If the moving average of 21 crosses the moving average of 233 from the bottom up and the end of the line moves the moving average of 233 upwards, it can be concluded
The market trend in time frame has changed for 1 minute and is up.
Then we refer to the time frames of 3, 5 and 15 minutes and check the same conditions there.
If 3 of the 4 time frames have the same conditions, we use Heiken Ashi to check the strength of the wave that is formed.
And also by looking at Ichimoku we will see where this Kumo cloud formed this wave.
If these conditions are met, a serious decision can be made to enter the position.
Higher time frames such as 30 minutes or 1 hour and 4 hours can also be used to find important resistance and support pivots.
In this way, the average of 233 and 21 and the formation of the current candlestick give us an acceptable range for fluctuation.
Chikou Support and Resistance by TheSocialCryptoClubName: Chikou Supports and Resistances
Category: Indicator
Timeframe: Any Timeframe.
Description: Chikou Support and Resistance is an indicator which allows to represent on the chart the price structures identified by the cusps formed by the Ichimoku Kinko Hyo Chikou, Chikou is the line chart of close price projected in the past as per Kijun periods.
Suggested usage: Use on any timeframe. It is possible to calculate cusp only in a certain period and in a different time frame, and select those calculated by specific lines.
Technical Details: Internally it uses an Array to store the levels of when the Chikou bounces using the Zig-Zag indicator. At the last bar it prints the various lines on the screen.
Credits:
- Techniques has been explained by Corrado Rondelli in "Strategie di trading con l’indicatore Ichimoku Kinko Hyo"
- It is based on the Zig-Zag indicator of TradingView to calculate the Zig-Zag.

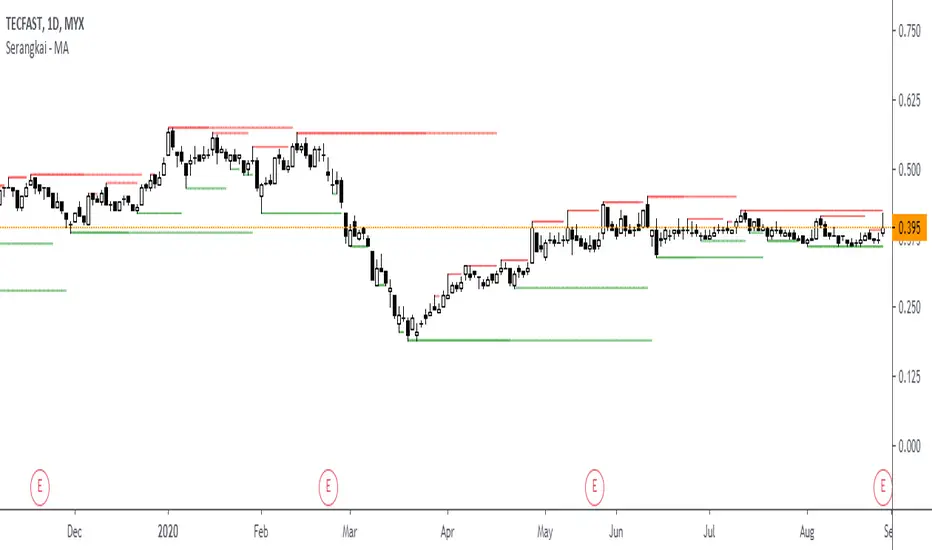
Kijun Trend IndicatorName: Kijun Trend Indicator
Category: Trend Analysis
Timeframe: All timeframes
Suggested usage: In a trending market, to understand when it is good to enter short (red line) and when to enter long (blue line).
Technical Analysis: The original idea was taken from Larry Williams: an uptrend is identified when the price is above an 18-period simple moving average (SMA) and when at least two candles do not touch the simple moving average with their lows. The opposite is true for a downtrend.
Corrado Rondelli has therefore reinterpreted with Ichimoku aka "ichimokized" replacing the 18-period Simple Moving Average with the 26-period Kijun - as per the original Ichimoku settings.
In order to make the indicator more flexible an Exponential Moving Average (EMA) has also been added.
The indicator plots the chosen line that becomes red when it is good to enter short and blue when it is good to enter long.
Configuration:
- Length: period to be used to calculate the line.
- Type: the line type that can be the Kijun (26-period) or SMA/EMA (18-period)

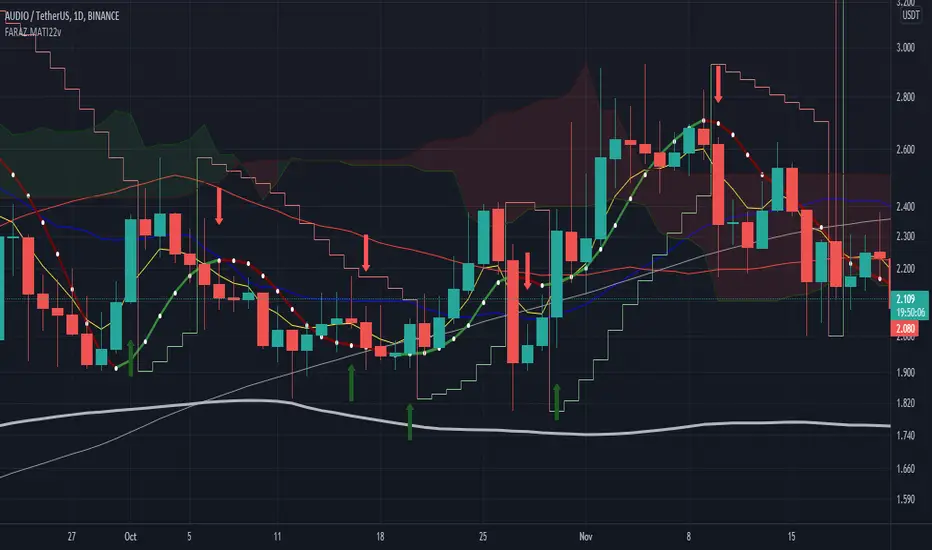
FARAZ.MATI20vA personal indicator.
This indicator has the following features :
Thanks to the managers and administrators of TradingView site for the appropriate space with wide facilities for optimal use. All (indicators) were available on the site and I only defined certain settings for them.
FARAZ.MATI20v
EMA: 5
SMA : 20
SMA : 50
Collision and interruption of Moving 20 by Moving 5 can be the beginning of an upward trend. Provided that the Moving 5 is placed under the candles. (The best signal for the Moving 5 is to collide with the Moving 20 under the candles). Also, the collision of the Moing 5 with the Moing 20 on top of the candles can be a sign of falling. Especially if this collision occurs above the candles.The cut of the Moving 20 and the Moving 50 indicate the intensity of the wave. If Moving 20 is above Moving 50 in this collision, it shows the intensity of the uptrend and if it is below Moving 50, it shows the intensity of the downtrend.
SMA : 100
SMA : 200
Both (resistance and support) are very strong, which is very effective in larger timeframes (such as 1 day).
HMA : 20
To determine the entry point. In such a way that whenever the seeds (HMA) are below the candlesticks. 3 seeds are in ascending position. The body of the candle and the shadow should not touch them. It can be a good signal to enter. Also if the seeds are placed on top of the candlesticks. Show the descending direction of 3 seeds. Provided that the body of the candle and the shadow have not hit them. It is a signal for the short position.
SAR : With the applied settings, it is a kind (trending view) that can evaluate the volume of input to any currency much sooner and determine the probability of rising or falling. If our wave lines (stairs) are at the bottom of the candles, it means an upward trend, and if they are at the top of the candles, it means a downward trend. As the volume of inputs increases, the trend increases, and as the volume of inputs decreases, the trend will also decrease.
Ichimoku Cloud : To determine the lines (support and resistance) the peaks formed by the cloud can represent a resistance area. Price To cross the area marked by the Ichimoku cloud must have a strong candle. This can be very effective in determining the point of entry and purchase.
zig zag : For better diagnosis of the process. Using it to determine areas of support and resistance can be useful. Determining the points of the Fibonacci table is also very effective.
taLibrary "ta"
█ OVERVIEW
This library holds technical analysis functions calculating values for which no Pine built-in exists.
Look first. Then leap.
█ FUNCTIONS
cagr(entryTime, entryPrice, exitTime, exitPrice)
It calculates the "Compound Annual Growth Rate" between two points in time. The CAGR is a notional, annualized growth rate that assumes all profits are reinvested. It only takes into account the prices of the two end points — not drawdowns, so it does not calculate risk. It can be used as a yardstick to compare the performance of two instruments. Because it annualizes values, the function requires a minimum of one day between the two end points (annualizing returns over smaller periods of times doesn't produce very meaningful figures).
Parameters:
entryTime : The starting timestamp.
entryPrice : The starting point's price.
exitTime : The ending timestamp.
exitPrice : The ending point's price.
Returns: CAGR in % (50 is 50%). Returns `na` if there is not >=1D between `entryTime` and `exitTime`, or until the two time points have not been reached by the script.
█ v2, Mar. 8, 2022
Added functions `allTimeHigh()` and `allTimeLow()` to find the highest or lowest value of a source from the first historical bar to the current bar. These functions will not look ahead; they will only return new highs/lows on the bar where they occur.
allTimeHigh(src)
Tracks the highest value of `src` from the first historical bar to the current bar.
Parameters:
src : (series int/float) Series to track. Optional. The default is `high`.
Returns: (float) The highest value tracked.
allTimeLow(src)
Tracks the lowest value of `src` from the first historical bar to the current bar.
Parameters:
src : (series int/float) Series to track. Optional. The default is `low`.
Returns: (float) The lowest value tracked.
█ v3, Sept. 27, 2022
This version includes the following new functions:
aroon(length)
Calculates the values of the Aroon indicator.
Parameters:
length (simple int) : (simple int) Number of bars (length).
Returns: ( [float, float ]) A tuple of the Aroon-Up and Aroon-Down values.
coppock(source, longLength, shortLength, smoothLength)
Calculates the value of the Coppock Curve indicator.
Parameters:
source (float) : (series int/float) Series of values to process.
longLength (simple int) : (simple int) Number of bars for the fast ROC value (length).
shortLength (simple int) : (simple int) Number of bars for the slow ROC value (length).
smoothLength (simple int) : (simple int) Number of bars for the weigted moving average value (length).
Returns: (float) The oscillator value.
dema(source, length)
Calculates the value of the Double Exponential Moving Average (DEMA).
Parameters:
source (float) : (series int/float) Series of values to process.
length (simple int) : (simple int) Length for the smoothing parameter calculation.
Returns: (float) The double exponentially weighted moving average of the `source`.
dema2(src, length)
An alternate Double Exponential Moving Average (Dema) function to `dema()`, which allows a "series float" length argument.
Parameters:
src : (series int/float) Series of values to process.
length : (series int/float) Length for the smoothing parameter calculation.
Returns: (float) The double exponentially weighted moving average of the `src`.
dm(length)
Calculates the value of the "Demarker" indicator.
Parameters:
length (simple int) : (simple int) Number of bars (length).
Returns: (float) The oscillator value.
donchian(length)
Calculates the values of a Donchian Channel using `high` and `low` over a given `length`.
Parameters:
length (int) : (series int) Number of bars (length).
Returns: ( [float, float, float ]) A tuple containing the channel high, low, and median, respectively.
ema2(src, length)
An alternate ema function to the `ta.ema()` built-in, which allows a "series float" length argument.
Parameters:
src : (series int/float) Series of values to process.
length : (series int/float) Number of bars (length).
Returns: (float) The exponentially weighted moving average of the `src`.
eom(length, div)
Calculates the value of the Ease of Movement indicator.
Parameters:
length (simple int) : (simple int) Number of bars (length).
div (simple int) : (simple int) Divisor used for normalzing values. Optional. The default is 10000.
Returns: (float) The oscillator value.
frama(source, length)
The Fractal Adaptive Moving Average (FRAMA), developed by John Ehlers, is an adaptive moving average that dynamically adjusts its lookback period based on fractal geometry.
Parameters:
source (float) : (series int/float) Series of values to process.
length (int) : (series int) Number of bars (length).
Returns: (float) The fractal adaptive moving average of the `source`.
ft(source, length)
Calculates the value of the Fisher Transform indicator.
Parameters:
source (float) : (series int/float) Series of values to process.
length (simple int) : (simple int) Number of bars (length).
Returns: (float) The oscillator value.
ht(source)
Calculates the value of the Hilbert Transform indicator.
Parameters:
source (float) : (series int/float) Series of values to process.
Returns: (float) The oscillator value.
ichimoku(conLength, baseLength, senkouLength)
Calculates values of the Ichimoku Cloud indicator, including tenkan, kijun, senkouSpan1, senkouSpan2, and chikou. NOTE: offsets forward or backward can be done using the `offset` argument in `plot()`.
Parameters:
conLength (int) : (series int) Length for the Conversion Line (Tenkan). The default is 9 periods, which returns the mid-point of the 9 period Donchian Channel.
baseLength (int) : (series int) Length for the Base Line (Kijun-sen). The default is 26 periods, which returns the mid-point of the 26 period Donchian Channel.
senkouLength (int) : (series int) Length for the Senkou Span 2 (Leading Span B). The default is 52 periods, which returns the mid-point of the 52 period Donchian Channel.
Returns: ( [float, float, float, float, float ]) A tuple of the Tenkan, Kijun, Senkou Span 1, Senkou Span 2, and Chikou Span values. NOTE: by default, the senkouSpan1 and senkouSpan2 should be plotted 26 periods in the future, and the Chikou Span plotted 26 days in the past.
ift(source)
Calculates the value of the Inverse Fisher Transform indicator.
Parameters:
source (float) : (series int/float) Series of values to process.
Returns: (float) The oscillator value.
kvo(fastLen, slowLen, trigLen)
Calculates the values of the Klinger Volume Oscillator.
Parameters:
fastLen (simple int) : (simple int) Length for the fast moving average smoothing parameter calculation.
slowLen (simple int) : (simple int) Length for the slow moving average smoothing parameter calculation.
trigLen (simple int) : (simple int) Length for the trigger moving average smoothing parameter calculation.
Returns: ( [float, float ]) A tuple of the KVO value, and the trigger value.
pzo(length)
Calculates the value of the Price Zone Oscillator.
Parameters:
length (simple int) : (simple int) Length for the smoothing parameter calculation.
Returns: (float) The oscillator value.
rms(source, length)
Calculates the Root Mean Square of the `source` over the `length`.
Parameters:
source (float) : (series int/float) Series of values to process.
length (int) : (series int) Number of bars (length).
Returns: (float) The RMS value.
rwi(length)
Calculates the values of the Random Walk Index.
Parameters:
length (simple int) : (simple int) Lookback and ATR smoothing parameter length.
Returns: ( [float, float ]) A tuple of the `rwiHigh` and `rwiLow` values.
stc(source, fast, slow, cycle, d1, d2)
Calculates the value of the Schaff Trend Cycle indicator.
Parameters:
source (float) : (series int/float) Series of values to process.
fast (simple int) : (simple int) Length for the MACD fast smoothing parameter calculation.
slow (simple int) : (simple int) Length for the MACD slow smoothing parameter calculation.
cycle (simple int) : (simple int) Number of bars for the Stochastic values (length).
d1 (simple int) : (simple int) Length for the initial %D smoothing parameter calculation.
d2 (simple int) : (simple int) Length for the final %D smoothing parameter calculation.
Returns: (float) The oscillator value.
stochFull(periodK, smoothK, periodD)
Calculates the %K and %D values of the Full Stochastic indicator.
Parameters:
periodK (simple int) : (simple int) Number of bars for Stochastic calculation. (length).
smoothK (simple int) : (simple int) Number of bars for smoothing of the %K value (length).
periodD (simple int) : (simple int) Number of bars for smoothing of the %D value (length).
Returns: ( [float, float ]) A tuple of the slow %K and the %D moving average values.
stochRsi(lengthRsi, periodK, smoothK, periodD, source)
Calculates the %K and %D values of the Stochastic RSI indicator.
Parameters:
lengthRsi (simple int) : (simple int) Length for the RSI smoothing parameter calculation.
periodK (simple int) : (simple int) Number of bars for Stochastic calculation. (length).
smoothK (simple int) : (simple int) Number of bars for smoothing of the %K value (length).
periodD (simple int) : (simple int) Number of bars for smoothing of the %D value (length).
source (float) : (series int/float) Series of values to process. Optional. The default is `close`.
Returns: ( [float, float ]) A tuple of the slow %K and the %D moving average values.
supertrend(factor, atrLength, wicks)
Calculates the values of the SuperTrend indicator with the ability to take candle wicks into account, rather than only the closing price.
Parameters:
factor (float) : (series int/float) Multiplier for the ATR value.
atrLength (simple int) : (simple int) Length for the ATR smoothing parameter calculation.
wicks (simple bool) : (simple bool) Condition to determine whether to take candle wicks into account when reversing trend, or to use the close price. Optional. Default is false.
Returns: ( [float, int ]) A tuple of the superTrend value and trend direction.
szo(source, length)
Calculates the value of the Sentiment Zone Oscillator.
Parameters:
source (float) : (series int/float) Series of values to process.
length (simple int) : (simple int) Length for the smoothing parameter calculation.
Returns: (float) The oscillator value.
t3(source, length, vf)
Calculates the value of the Tilson Moving Average (T3).
Parameters:
source (float) : (series int/float) Series of values to process.
length (simple int) : (simple int) Length for the smoothing parameter calculation.
vf (simple float) : (simple float) Volume factor. Affects the responsiveness.
Returns: (float) The Tilson moving average of the `source`.
t3Alt(source, length, vf)
An alternate Tilson Moving Average (T3) function to `t3()`, which allows a "series float" `length` argument.
Parameters:
source (float) : (series int/float) Series of values to process.
length (float) : (series int/float) Length for the smoothing parameter calculation.
vf (simple float) : (simple float) Volume factor. Affects the responsiveness.
Returns: (float) The Tilson moving average of the `source`.
tema(source, length)
Calculates the value of the Triple Exponential Moving Average (TEMA).
Parameters:
source (float) : (series int/float) Series of values to process.
length (simple int) : (simple int) Length for the smoothing parameter calculation.
Returns: (float) The triple exponentially weighted moving average of the `source`.
tema2(source, length)
An alternate Triple Exponential Moving Average (TEMA) function to `tema()`, which allows a "series float" `length` argument.
Parameters:
source (float) : (series int/float) Series of values to process.
length (float) : (series int/float) Length for the smoothing parameter calculation.
Returns: (float) The triple exponentially weighted moving average of the `source`.
trima(source, length)
Calculates the value of the Triangular Moving Average (TRIMA).
Parameters:
source (float) : (series int/float) Series of values to process.
length (int) : (series int) Number of bars (length).
Returns: (float) The triangular moving average of the `source`.
trima2(src, length)
An alternate Triangular Moving Average (TRIMA) function to `trima()`, which allows a "series int" length argument.
Parameters:
src : (series int/float) Series of values to process.
length : (series int) Number of bars (length).
Returns: (float) The triangular moving average of the `src`.
trix(source, length, signalLength, exponential)
Calculates the values of the TRIX indicator.
Parameters:
source (float) : (series int/float) Series of values to process.
length (simple int) : (simple int) Length for the smoothing parameter calculation.
signalLength (simple int) : (simple int) Length for smoothing the signal line.
exponential (simple bool) : (simple bool) Condition to determine whether exponential or simple smoothing is used. Optional. The default is `true` (exponential smoothing).
Returns: ( [float, float, float ]) A tuple of the TRIX value, the signal value, and the histogram.
uo(fastLen, midLen, slowLen)
Calculates the value of the Ultimate Oscillator.
Parameters:
fastLen (simple int) : (series int) Number of bars for the fast smoothing average (length).
midLen (simple int) : (series int) Number of bars for the middle smoothing average (length).
slowLen (simple int) : (series int) Number of bars for the slow smoothing average (length).
Returns: (float) The oscillator value.
vhf(source, length)
Calculates the value of the Vertical Horizontal Filter.
Parameters:
source (float) : (series int/float) Series of values to process.
length (simple int) : (simple int) Number of bars (length).
Returns: (float) The oscillator value.
vi(length)
Calculates the values of the Vortex Indicator.
Parameters:
length (simple int) : (simple int) Number of bars (length).
Returns: ( [float, float ]) A tuple of the viPlus and viMinus values.
vzo(length)
Calculates the value of the Volume Zone Oscillator.
Parameters:
length (simple int) : (simple int) Length for the smoothing parameter calculation.
Returns: (float) The oscillator value.
williamsFractal(period)
Detects Williams Fractals.
Parameters:
period (int) : (series int) Number of bars (length).
Returns: ( [bool, bool ]) A tuple of an up fractal and down fractal. Variables are true when detected.
wpo(length)
Calculates the value of the Wave Period Oscillator.
Parameters:
length (simple int) : (simple int) Length for the smoothing parameter calculation.
Returns: (float) The oscillator value.
█ v7, Nov. 2, 2023
This version includes the following new and updated functions:
atr2(length)
An alternate ATR function to the `ta.atr()` built-in, which allows a "series float" `length` argument.
Parameters:
length (float) : (series int/float) Length for the smoothing parameter calculation.
Returns: (float) The ATR value.
changePercent(newValue, oldValue)
Calculates the percentage difference between two distinct values.
Parameters:
newValue (float) : (series int/float) The current value.
oldValue (float) : (series int/float) The previous value.
Returns: (float) The percentage change from the `oldValue` to the `newValue`.
donchian(length)
Calculates the values of a Donchian Channel using `high` and `low` over a given `length`.
Parameters:
length (int) : (series int) Number of bars (length).
Returns: ( [float, float, float ]) A tuple containing the channel high, low, and median, respectively.
highestSince(cond, source)
Tracks the highest value of a series since the last occurrence of a condition.
Parameters:
cond (bool) : (series bool) A condition which, when `true`, resets the tracking of the highest `source`.
source (float) : (series int/float) Series of values to process. Optional. The default is `high`.
Returns: (float) The highest `source` value since the last time the `cond` was `true`.
lowestSince(cond, source)
Tracks the lowest value of a series since the last occurrence of a condition.
Parameters:
cond (bool) : (series bool) A condition which, when `true`, resets the tracking of the lowest `source`.
source (float) : (series int/float) Series of values to process. Optional. The default is `low`.
Returns: (float) The lowest `source` value since the last time the `cond` was `true`.
relativeVolume(length, anchorTimeframe, isCumulative, adjustRealtime)
Calculates the volume since the last change in the time value from the `anchorTimeframe`, the historical average volume using bars from past periods that have the same relative time offset as the current bar from the start of its period, and the ratio of these volumes. The volume values are cumulative by default, but can be adjusted to non-accumulated with the `isCumulative` parameter.
Parameters:
length (simple int) : (simple int) The number of periods to use for the historical average calculation.
anchorTimeframe (simple string) : (simple string) The anchor timeframe used in the calculation. Optional. Default is "D".
isCumulative (simple bool) : (simple bool) If `true`, the volume values will be accumulated since the start of the last `anchorTimeframe`. If `false`, values will be used without accumulation. Optional. The default is `true`.
adjustRealtime (simple bool) : (simple bool) If `true`, estimates the cumulative value on unclosed bars based on the data since the last `anchor` condition. Optional. The default is `false`.
Returns: ( [float, float, float ]) A tuple of three float values. The first element is the current volume. The second is the average of volumes at equivalent time offsets from past anchors over the specified number of periods. The third is the ratio of the current volume to the historical average volume.
rma2(source, length)
An alternate RMA function to the `ta.rma()` built-in, which allows a "series float" `length` argument.
Parameters:
source (float) : (series int/float) Series of values to process.
length (float) : (series int/float) Length for the smoothing parameter calculation.
Returns: (float) The rolling moving average of the `source`.
supertrend2(factor, atrLength, wicks)
An alternate SuperTrend function to `supertrend()`, which allows a "series float" `atrLength` argument.
Parameters:
factor (float) : (series int/float) Multiplier for the ATR value.
atrLength (float) : (series int/float) Length for the ATR smoothing parameter calculation.
wicks (simple bool) : (simple bool) Condition to determine whether to take candle wicks into account when reversing trend, or to use the close price. Optional. Default is `false`.
Returns: ( [float, int ]) A tuple of the superTrend value and trend direction.
vStop(source, atrLength, atrFactor)
Calculates an ATR-based stop value that trails behind the `source`. Can serve as a possible stop-loss guide and trend identifier.
Parameters:
source (float) : (series int/float) Series of values that the stop trails behind.
atrLength (simple int) : (simple int) Length for the ATR smoothing parameter calculation.
atrFactor (float) : (series int/float) The multiplier of the ATR value. Affects the maximum distance between the stop and the `source` value. A value of 1 means the maximum distance is 100% of the ATR value. Optional. The default is 1.
Returns: ( [float, bool ]) A tuple of the volatility stop value and the trend direction as a "bool".
vStop2(source, atrLength, atrFactor)
An alternate Volatility Stop function to `vStop()`, which allows a "series float" `atrLength` argument.
Parameters:
source (float) : (series int/float) Series of values that the stop trails behind.
atrLength (float) : (series int/float) Length for the ATR smoothing parameter calculation.
atrFactor (float) : (series int/float) The multiplier of the ATR value. Affects the maximum distance between the stop and the `source` value. A value of 1 means the maximum distance is 100% of the ATR value. Optional. The default is 1.
Returns: ( [float, bool ]) A tuple of the volatility stop value and the trend direction as a "bool".
Removed Functions:
allTimeHigh(src)
Tracks the highest value of `src` from the first historical bar to the current bar.
allTimeLow(src)
Tracks the lowest value of `src` from the first historical bar to the current bar.
trima2(src, length)
An alternate Triangular Moving Average (TRIMA) function to `trima()`, which allows a
"series int" length argument.

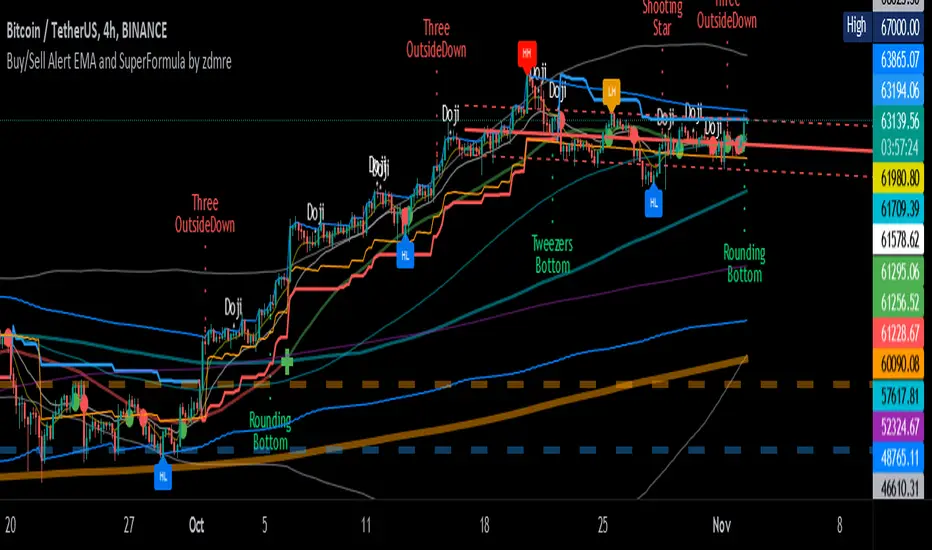
Buy/Sell Alert EMA with SuperFormula by zdmre*** Use it at your own risk
This indicator has 3 indicators and gives a buy/sell signal depending on the EMA.
3 indicators:
- Ichimoku
- Bollinger Band
- EMA
It also shows the value on the candle as a warning in the Buy and Sell signals. This value is calculated with a special formula I have created.
On the other hand Bollinger Band and Ichimoku Cloud are also included to check the accuracy of the signals.
For this indicator, I recommend a minimum of 4 hours chart.
Trend Indicators CollectionAnalyses MACD crosses with Ichimoku cloud direction and state
General idea:
- MACD crosses usually point to a change in trend direction and Kumo state and direction often act as a confirmation as well as a trend strength indicator. Using this, the script points out where there were was or can be a point where the trend change may have the strength to carry on.
Buy warnings:
- This warning will be triggered in two ways, both of them only if MACD is above EMA and the current close price is over Kumo:
- Senku span A crosses over Senku B (Kumo turns positive) when MACD is already positive
- MACD turns positive when Kumo is already positive
Sell warnings
- Triggered in two ways:
- Kumo turns negative when the current close price is bellow EMA
- The inverse of the above, the current close price falls bellow EMA when the Kumo is already negative
Trend Indicators Collection (TIC) contains:
- MACD, EMA, ADX, Mass index, Ichimoku Cloud, and Pivot points
- Best suited for monthly charts with 30m bars

7-EMA 3-SMA BB_FiboR Icnimoke and SNRContains of:-
7 EMA
3 SMA
Bollinger Bands
Fibonacci Retracement
Ichimoku
Support and resistance
The idea is, my technique required to use EMA and SMA and bollinger band to monitor trend whether strong or not, then I use Fibonacci retracement to monitor how far it will drop or how far it will go up.
On the other method, I'm using EMA and SMA and Ichimoku to monitor counter that have midterm potential.
The SNR is to calculate my support and resistance which is when to EP, TP and CL. RBS signal is when the price break the resistance, which the price exceed the top of latest length of bar you set. SBR signal indicate where we need to cutloss, when the price lower than bottom of latest of bar you set
All in one indicator. Saves all number of indicator you need. Convenience for free user

T3 ICL MACD STRATEGY
Backtested manually and received approx 60% winrate. Tradingview strategy tester is skewed because this program does not specify when to sell at profit target or at a stop loss.
Uses 1 min for entry and a longer time frame for confirmation (5,10,15, etc..) (Not sure what the yellow arrows are in the picture but they can be ignored)
Ideal Long Entry - The algo uses T3 moving average (T3) and the Ichimoku Conversion Line (ICL) to determine when to enter a long or short position. In this case we are going to showcase what causes the algo to alert long. It first checks to see if the the ICL is greater than T3. Once that condition is met T3 must be green in order to enter long and finally the last closing price has to be greater than the ICL. You can use the MACD to further verify a long trend as well!
Ideal Short Entry - The algo uses T3 moving average (T3) and the Ichimoku Conversion Line (ICL) to determine when to enter a long or short position. In this case we are going to showcase what causes the algo to alert short. It first checks to see if the the ICL is less than T3. Once that condition is met T3 must be red in order to enter short and finally the last closing price has to be less than the ICL. You can use the MACD to further verify a long trend as well!

MA 10,20,50,200Indicator consist of moving averages (MA).
This indicator make it easier for me to switch between few MA lines.
1. MA10
- used for intraday.
2. MA50 and Ichimoku
- to analyze swing trend
- display only MA50 and ichimoku cloud
3. MA20, MA50 and MA200
- to analyze the trend
- for swing trade
4. Lines 52 Week High / Low
- display both lines as guide when trading
IKAKOver2(LITE雲なし)
change point
I tried to make the operation lighter by removing the display of the Ichimoku balance table.
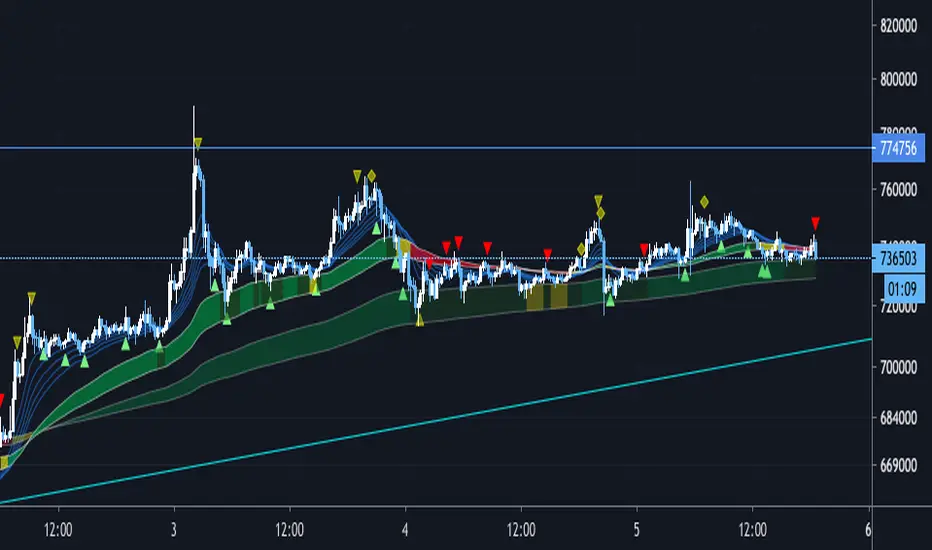
We have set a period such as EMA to use 5 minute bars and the first band is period 60 and 100 EMA . The color of the belt changes according to the position of the period 5EMA-25EMA-50EMA. The second sash is based on a 60- and 100-EMA period of 15 minutes. The change in the color of the obi is also a 15-minute specification.
Since the above period can be changed, I think that there are customs such as 1 hour and 4 hours.
Buying and selling signs are shown in green for buying and red for selling. (More frequent)
For the time being, it is also possible to display the Ichimoku balance table.
As for my usage method, when both the 15-minute and 5-minute bars have an uptrend (downtrend ), when each trading sign is confirmed, spread the limit just below the price. . (Because there is a commission in the market)
If the color of the obi becomes yellow, the trend may be over, so wait for the signature to reach the bundle of 15 minutes instead of 5 minutes, and after the signature is confirmed, it is the same as 5 minutes.
The loss cut line is often the latest low. Or when the obi is broken. .
I am still studying about profitability. Sometimes we use indicators, sometimes we reach the target horizon. I think each way is good.
It is a discretionary aid, and the head and tail are cut off, and the image is about 10 to 100 $.
Balanced/Unbalanced MarketWhen market chooses to go uptrend or downtrend, the equilibrium between buyers and sellers vanishes and the trend with the different qualifications forms. The number of balanced and unbalanced periods of a trend can relate to it's weakness/strength.
Using indicators like ichimoku can initially help us to simply understand these concept.
So simply:
1- When Kj (Kijunsen=Ichimoku baseline) become flat, it shows the equilibrium between buyers and sellers. In line 13 of the script code, we can see the condition for this. In this case, better to use Kj=52 as it's closer to the concept of equilibrium market and contains more flat periods.
Also we can use Kj ==Kj and Kj ==Kj instead, to filter the balanced bars more.
2- When Kj stand higher or lower than it's previous value, it can be used as determiner for bullishness and bearishness of the market. In lines 16,19 of the script code, we can see the conditions for this. In this case, better to use Kj=26 as it's closer to the concept of trend market.

Dr.ManiaTemel olarak teknik analizlerde kullanılabilecek en yaygın komutların hepsinin bir arada olduğu (Ichimoku, MavilimW, Bollinger, Oklar, Hareketli Ortalamaları) komuttur.
Ichimoku+MavilimW+BB+Arrow+MAVCOMBO

Cloud, MA & BB Signal ConvergenceA combination of 3 popular lagging indicators (Ichimoku Cloud, Moving Average and Bollinger Bands) that generates a signal when all 3 of those lagging indicators are bullish or bearish.
Bullish is represented with a green dot above price. Bearish is represented with a red dot below price.
PARAMETERS:
1) Ichimoku Cloud
-Bullish Kumo
-Price above Kumo
-Chikou span above price
-Tenkan-sen and Kijun-sen above Kumo
-Tenkan-sen above Kijun-sen
-Price above Tenkan-sen
*opposite for bearish
Note: cloud settings is the popular settings for cryptocurrency advocated by @CarpeNoctom.
2) Moving Average
-MA1 greater than MA2
-MA2 greater than MA3
-MA3 greater than MA4
-MA4 greater than MA5
*opposite for bearish
Note: Put your MA setting from lowest to highest on MA1-MA5 respectively to generate more accurate signals.
3) Bollinger Bands
-price closed above upper band at least once
*opposite for bearish
Note: Put your MA setting from lowest to highest on MA1-MA5 respectively to generate more accurate signals.
P.S. Still on early alpha stage.

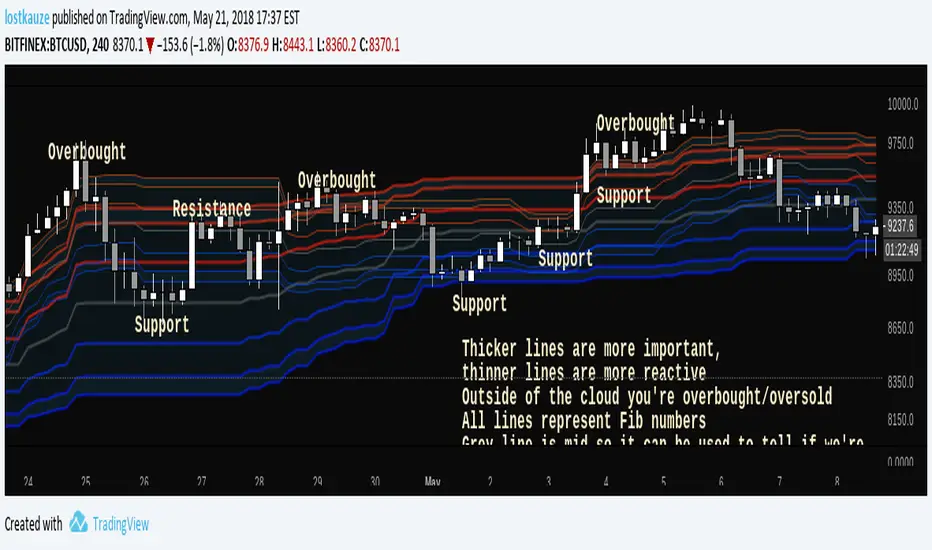
Fibonacci CloudInspired by Ichimoku Fibonacci Hybrid , this indicator is for those who don't mind a lot of lines. All lines represent Fib ratios: thicker lines are fibs for a longer period, while thinner lines are fibs for a shorter period.
- Dynamic S/R
- Overbought/Oversold zones
- Trend indicator
- Customisable periods
- Fast/Slow crossovers
See what works for you!
Gyspy Bot Trade Engine - V1.2B - Alerts - 12-7-25 - SignalLynxGypsy Bot Trade Engine (MK6 V1.2B) - Alerts & Visualization
Brought to you by Signal Lynx | Automation for the Night-Shift Nation 🌙
1. Executive Summary & Architecture
Gypsy Bot (MK6 V1.2B) is not merely a strategy; it is a massive, modular Trade Engine built specifically for the TradingView Pine Script V6 environment. While most tools rely on a single dominant indicator to generate signals, Gypsy Bot functions as a sophisticated Consensus Algorithm.
Note: This is the Indicator / Alerts version of the engine. It is designed for visual analysis and generating live alert signals for automation. If you wish to see Backtest data (Equity Curves, Drawdown, Profit Factors), please use the Strategy version of this script.
The engine calculates data from up to 12 distinct Technical Analysis Modules simultaneously on every bar closing. It aggregates these signals into a "Vote Count" and only fires a signal plot when a user-defined threshold of concurring signals is met. This "Voting System" acts as a noise filter, requiring multiple independent mathematical models—ranging from volume flow and momentum to cyclical harmonics and trend strength—to agree on market direction.
Beyond entries, Gypsy Bot features a proprietary Risk Management suite called the Dump Protection Team (DPT). This logic layer operates independently of the entry modules, specifically scanning for "Moon" (Parabolic) or "Nuke" (Crash) volatility events to signal forced exits, preserving capital during Black Swan events.
2. ⚠️ The Philosophy of "Curve Fitting" (Must Read)
One must be careful when applying Gypsy Bot to new pairs or charts.
To be fully transparent: Gypsy Bot is, by definition, a very advanced curve-fitting engine. Because it grants the user granular control over 12 modules, dozens of thresholds, and specific voting requirements, it is extremely easy to "over-fit" the data. You can easily toggle switches until the charts look perfect in hindsight, only to have the signals fail in live markets because they were tuned to historical noise rather than market structure.
To use this engine successfully:
Visual Verification: Do not just look for "green arrows." Look for signals that occur at logical market structure points.
Stability: Ensure signals are not flickering. This script uses closed-candle logic for key decisions to ensure that once a signal plots, it remains painted.
Regular Maintenance is Mandatory: Markets shift regimes (e.g., from Bull Trend to Crab Range). Gypsy Bot settings should be reviewed and adjusted at regular intervals to ensure the voting logic remains aligned with current market volatility.
Timeframe Recommendations:
Gypsy Bot is optimized for High Time Frame (HTF) trend following. It generally produces the most reliable results on charts ranging from 1-Hour to 12-Hours, with the 4-Hour timeframe historically serving as the "sweet spot" for most major cryptocurrency assets.
3. The Voting Mechanism: How Entries Are Generated
The heart of the Gypsy Bot engine is the ActivateOrders input (found in the "Order Signal Modifier" settings).
The engine constantly monitors the output of all enabled Modules.
Long Votes: GoLongCount
Short Votes: GoShortCount
If you have 10 Modules enabled, and you set ActivateOrders to 7:
The engine will ONLY plot a Buy Signal if 7 or more modules return a valid "Buy" signal on the same closed candle.
If only 6 modules agree, the signal is rejected.
4. Technical Deep Dive: The 12 Modules
Gypsy Bot allows you to toggle the following modules On/Off individually to suit the asset you are trading.
Module 1: Modified Slope Angle (MSA)
Logic: Calculates the geometric angle of a moving average relative to the timeline.
Function: Filters out "lazy" trends. A trend is only considered valid if the slope exceeds a specific steepness threshold.
Module 2: Correlation Trend Indicator (CTI)
Logic: Measures how closely the current price action correlates to a straight line (a perfect trend).
Function: Ensures that we are moving up with high statistical correlation, reducing fake-outs.
Module 3: Ehlers Roofing Filter
Logic: A spectral filter combining High-Pass (trend removal) and Super Smoother (noise removal).
Function: Isolates the "Roof" of price action to catch cyclical turning points before standard moving averages.
Module 4: Forecast Oscillator
Logic: Uses Linear Regression forecasting to predict where price "should" be relative to where it is.
Function: Signals when the regression trend flips. Offers "Aggressive" and "Conservative" calculation modes.
Module 5: Chandelier ATR Stop
Logic: A volatility-based trend follower that hangs a "leash" (ATR multiple) from extremes.
Function: Used as an entry filter. If price is above the Chandelier line, the trend is Bullish.
Module 6: Crypto Market Breadth (CMB)
Logic: Pulls data from multiple major tickers (BTC, ETH, and Perpetual Contracts).
Function: Calculates "Market Health." If Bitcoin is rising but the rest of the market is dumping, this module can veto a trade.
Module 7: Directional Index Convergence (DIC)
Logic: Analyzes the convergence/divergence between Fast and Slow Directional Movement indices.
Function: Identifies when trend strength is expanding.
Module 8: Market Thrust Indicator (MTI)
Logic: A volume-weighted breadth indicator using Advance/Decline and Volume data.
Function: One of the most powerful modules. Confirms that price movement is supported by actual volume flow. Recommended setting: "SSMA" (Super Smoother).
Module 9: Simple Ichimoku Cloud
Logic: Traditional Japanese trend analysis.
Function: Checks for a "Kumo Breakout." Price must be fully above/below the Cloud to confirm entry.
Module 10: Simple Harmonic Oscillator
Logic: Analyzes harmonic wave properties to detect cyclical tops and bottoms.
Function: Serves as a counter-trend or early-reversal detector.
Module 11: HSRS Compression / Super AO
Logic: Detects volatility compression (HSRS) or Momentum/Trend confluence (Super AO).
Function: Great for catching explosive moves resulting from consolidation.
Module 12: Fisher Transform (MTF)
Logic: Converts price data into a Gaussian normal distribution.
Function: Identifies extreme price deviations. Uses Multi-Timeframe (MTF) logic to ensure you aren't trading against the major trend.
5. Global Inhibitors (The Veto Power)
Even if 12 out of 12 modules vote "Buy," Gypsy Bot performs a final safety check using Global Inhibitors.
Bitcoin Halving Logic: Prevents trading during chaotic weeks surrounding Halving events (dates projected through 2040).
Miner Capitulation: Uses Hash Rate Ribbons to identify bearish regimes when miners are shutting down.
ADX Filter: Prevents trading in "Flat/Choppy" markets (Low ADX).
CryptoCap Trend: Checks the total Crypto Market Cap chart for broad market alignment.
6. Risk Management & The Dump Protection Team (DPT)
Even in this Indicator version, the RM logic runs to generate Exit Signals.
Dump Protection Team (DPT): Detects "Nuke" (Crash) or "Moon" (Pump) volatility signatures. If triggered, it plots an immediate Exit Signal (Yellow Plot).
Advanced Adaptive Trailing Stop (AATS): Dynamically tightens stops in low volatility ("Dungeon") and loosens them in high volatility ("Penthouse").
Staged Take Profits: Plots TP1, TP2, and TP3 events on the chart for visual confirmation or partial exit alerts.
7. Recommended Setup Guide
When applying Gypsy Bot to a new chart, follow this sequence:
Set Timeframe: 4 Hours (4H).
Tune DPT: Adjust "Dump/Moon Protection" inputs first. These filter out bad signals during high volatility.
Tune Module 8 (MTI): Experiment with the MA Type (SSMA is recommended).
Select Modules: Enable/Disable modules based on the asset's personality (Trending vs. Ranging).
Voting Threshold: Adjust ActivateOrders to filter out noise.
Alert Setup: Once visually satisfied, use the "Any Alert Function Call" option when creating an alert in TradingView to capture all Buy/Sell/Close events generated by the engine.
8. Technical Specs
Engine Version: Pine Script V6
Repainting: This indicator uses Closed Candle data for all Risk Management and Entry decisions. This ensures that signals do not vanish after the candle closes.
Visuals:
Blue Plot: Buy/Sell Signal.
Yellow Plot: Risk Management (RM) / DPT Close Signal.
Green/Lime/Olive Plots: Take Profit hits.
Disclaimer:
This script is a complex algorithmic tool for market analysis. Past performance is not indicative of future results. Cryptocurrency trading involves substantial risk of loss. Use this tool to assist your own decision-making, not to replace it.
9. About Signal Lynx
Automation for the Night-Shift Nation 🌙
Signal Lynx focuses on helping traders and developers bridge the gap between indicator logic and real-world automation. The same RM engine you see here powers multiple internal systems and templates, including other public scripts like the Super-AO Strategy with Advanced Risk Management.
We provide this code open source under the Mozilla Public License 2.0 (MPL-2.0) to:
Demonstrate how Adaptive Logic and structured Risk Management can outperform static, one-layer indicators
Give Pine Script users a battle-tested RM backbone they can reuse, remix, and extend
If you are looking to automate your TradingView strategies, route signals to exchanges, or simply want safer, smarter strategy structures, please keep Signal Lynx in your search.
License: Mozilla Public License 2.0 (Open Source).
If you make beneficial modifications, please consider releasing them back to the community so everyone can benefit.

Gyspy Bot Trade Engine - V1.2B - Strategy 12-7-25 - SignalLynxGypsy Bot Trade Engine (MK6 V1.2B) - Ultimate Strategy & Backtest
Brought to you by Signal Lynx | Automation for the Night-Shift Nation 🌙
1. Executive Summary & Architecture
Gypsy Bot (MK6 V1.2B) is not merely a strategy; it is a massive, modular Trade Engine built specifically for the TradingView Pine Script environment. While most strategies rely on a single dominant indicator (like an RSI cross or a MACD flip) to generate signals, Gypsy Bot functions as a sophisticated Consensus Algorithm.
The engine calculates data from up to 12 distinct Technical Analysis Modules simultaneously on every bar closing. It aggregates these signals into a "Vote Count" and only executes a trade entry when a user-defined threshold of concurring signals is met. This "Voting System" acts as a noise filter, requiring multiple independent mathematical models—ranging from volume flow and momentum to cyclical harmonics and trend strength—to agree on market direction before capital is committed.
Beyond entries, Gypsy Bot features a proprietary Risk Management suite called the Dump Protection Team (DPT). This logic layer operates independently of the entry modules, specifically scanning for "Moon" (Parabolic) or "Nuke" (Crash) volatility events to force-exit positions, overriding standard stops to preserve capital during Black Swan events.
2. ⚠️ The Philosophy of "Curve Fitting" (Must Read)
One must be careful when applying Gypsy Bot to new pairs or charts.
To be fully transparent: Gypsy Bot is, by definition, a very advanced curve-fitting engine. Because it grants the user granular control over 12 modules, dozens of thresholds, and specific voting requirements, it is extremely easy to "over-fit" the data. You can easily toggle switches until the backtest shows a 100% win rate, only to have the strategy fail immediately in live markets because it was tuned to historical noise rather than market structure.
To use this engine successfully, you must adopt a specific optimization mindset:
Ignore Raw Net Profit: Do not tune for the highest dollar amount. A strategy that makes $1M in the backtest but has a 40% drawdown is useless.
Prioritize Stability: Look for a high Profit Factor (1.5+), a high Percent Profitable, and a smooth equity curve.
Regular Maintenance is Mandatory: Markets shift regimes (e.g., from Bull Trend to Crab Range). Parameters that worked perfectly in 2021 may fail in 2024. Gypsy Bot settings should be reviewed and adjusted at regular intervals (e.g., quarterly) to ensure the voting logic remains aligned with current market volatility.
Timeframe Recommendations:
Gypsy Bot is optimized for High Time Frame (HTF) trend following. It generally produces the most reliable results on charts ranging from 1-Hour to 12-Hours, with the 4-Hour timeframe historically serving as the "sweet spot" for most major cryptocurrency assets.
3. The Voting Mechanism: How Entries Are Generated
The heart of the Gypsy Bot engine is the ActivateOrders input (found in the "Order Signal Modifier" settings).
The engine constantly monitors the output of all enabled Modules.
Long Votes: GoLongCount
Short Votes: GoShortCount
If you have 10 Modules enabled, and you set ActivateOrders to 7:
The engine will ONLY trigger a Buy Entry if 7 or more modules return a valid "Buy" signal on the same closed candle.
If only 6 modules agree, the trade is rejected.
This allows you to mix "Leading" indicators (Oscillators) with "Lagging" indicators (Moving Averages) to create a high-probability entry signal that requires momentum, volume, and trend to all be in alignment.
4. Technical Deep Dive: The 12 Modules
Gypsy Bot allows you to toggle the following modules On/Off individually to suit the asset you are trading.
Module 1: Modified Slope Angle (MSA)
Logic: Calculates the geometric angle of a moving average relative to the timeline.
Function: It filters out "lazy" trends. A trend is only considered valid if the slope exceeds a specific steepness threshold. This helps avoid entering trades during weak drifts that often precede a reversal.
Module 2: Correlation Trend Indicator (CTI)
Logic: Based on John Ehlers' work, this measures how closely the current price action correlates to a straight line (a perfect trend).
Function: It outputs a confidence score (-1 to 1). Gypsy Bot uses this to ensure that we are not just moving up, but moving up with high statistical correlation, reducing fake-outs.
Module 3: Ehlers Roofing Filter
Logic: A sophisticated spectral filter that combines a High-Pass filter (to remove long-term drift) with a Super Smoother (to remove high-frequency noise).
Function: It attempts to isolate the "Roof" of the price action. It is excellent at catching cyclical turning points before standard moving averages react.
Module 4: Forecast Oscillator
Logic: Uses Linear Regression forecasting to predict where price "should" be relative to where it is.
Function: When the Forecast Oscillator crosses its zero line, it indicates that the regression trend has flipped. We offer both "Aggressive" and "Conservative" calculation modes for this module.
Module 5: Chandelier ATR Stop
Logic: A volatility-based trend follower that hangs a "leash" (ATR multiple) from the highest high (for longs) or lowest low (for shorts).
Function: Used here as an entry filter. If price is above the Chandelier line, the trend is Bullish. It also includes a "Bull/Bear Qualifier" check to ensure structural support.
Module 6: Crypto Market Breadth (CMB)
Logic: This is a macro-filter. It pulls data from multiple major tickers (BTC, ETH, and Perpetual Contracts) across different exchanges.
Function: It calculates a "Market Health" percentage. If Bitcoin is rising but the rest of the market is dumping, this module can veto a trade, ensuring you don't buy into a "fake" rally driven by a single asset.
Module 7: Directional Index Convergence (DIC)
Logic: Analyzes the convergence/divergence between Fast and Slow Directional Movement indices.
Function: Identifies when trend strength is expanding. A buy signal is generated only when the positive directional movement overpowers the negative movement with expanding momentum.
Module 8: Market Thrust Indicator (MTI)
Logic: A volume-weighted breadth indicator. It uses Advance/Decline data and Up/Down Volume data.
Function: This is one of the most powerful modules. It confirms that price movement is supported by actual volume flow. We recommend using the "SSMA" (Super Smoother) MA Type for the cleanest signals on the 4H chart.
Module 9: Simple Ichimoku Cloud
Logic: Traditional Japanese trend analysis using the Tenkan-sen and Kijun-sen.
Function: Checks for a "Kumo Breakout." Price must be fully above the Cloud (for longs) or below it (for shorts). This is a classic "trend confirmation" module.
Module 10: Simple Harmonic Oscillator
Logic: Analyzes the harmonic wave properties of price action to detect cyclical tops and bottoms.
Function: Serves as a counter-trend or early-reversal detector. It tries to identify when a cycle has bottomed out (for buys) or topped out (for sells) before the main trend indicators catch up.
Module 11: HSRS Compression / Super AO
Logic: Two options in one.
HSRS: Hirashima Sugita Resistance Support. Detects volatility compression (squeezes) relative to dynamic support/resistance bands.
Super AO: A combination of the Awesome Oscillator and SuperTrend logic.
Function: Great for catching explosive moves that result from periods of low volatility (consolidation).
Module 12: Fisher Transform (MTF)
Logic: Converts price data into a Gaussian normal distribution.
Function: Identifies extreme price deviations. This module uses Multi-Timeframe (MTF) logic to look at higher-timeframe trends (e.g., looking at the Daily Fisher while trading the 4H chart) to ensure you aren't trading against the major trend.
5. Global Inhibitors (The Veto Power)
Even if 12 out of 12 modules vote "Buy," Gypsy Bot performs a final safety check using Global Inhibitors. If any of these are triggered, the trade is blocked.
Bitcoin Halving Logic:
Hardcoded dates for past and projected future Bitcoin halvings (up to 2040).
Trading is inhibited or restricted during the chaotic weeks immediately surrounding a Halving event to avoid volatility crushes.
Miner Capitulation:
Uses Hash Rate Ribbons (Moving averages of Hash Rate).
If miners are capitulating (Shutting down rigs due to unprofitability), the engine flags a "Bearish" regime and can flip logic to Short-only or flat.
ADX Filter (Flat Market Protocol):
If the Average Directional Index (ADX) is below a specific threshold (e.g., 20), the market is deemed "Flat/Choppy." The bot will refuse to open trend-following trades in a flat market.
CryptoCap Trend:
Checks the total Crypto Market Cap chart. If the broad market is in a downtrend, it can inhibit Long entries on individual altcoins.
6. Risk Management & The Dump Protection Team (DPT)
Gypsy Bot separates "Entry Logic" from "Risk Management Logic."
Dump Protection Team (DPT)
This is a specialized logic branch designed to save the account during Black Swan events.
Nuke Protection: If the DPT detects a volatility signature consistent with a flash crash, it overrides all other logic and forces an immediate exit.
Moon Protection: If a parabolic pump is detected that violates statistical probability (Bollinger deviations), DPT can force a profit take before the inevitable correction.
Advanced Adaptive Trailing Stop (AATS)
Unlike a static trailing stop (e.g., "trail by 5%"), AATS is dynamic.
Penthouse Level: If price is at the top of the HSRS channel (High Volatility), the stop loosens to allow for wicks.
Dungeon Level: If price is compressed at the bottom, the stop tightens to protect capital.
Staged Take Profits
TP1: Scalp a portion (e.g., 10%) to cover fees and secure a win.
TP2: Take the bulk of profit.
TP3: Leave a "Runner" position with a loose trailing stop to catch "Moon" moves.
7. Recommended Setup Guide
When applying Gypsy Bot to a new chart, follow this sequence:
Set Timeframe: 4 Hours (4H).
Reset: Turn OFF Trailing Stop, Stop Loss, and Take Profits. (We want to see raw entry performance first).
Tune DPT: Adjust "Dump/Moon Protection" inputs first. These have the highest impact on net performance.
Tune Module 8 (MTI): This module is a heavy filter. Experiment with the MA Type (SSMA is recommended).
Select Modules: Enable/Disable modules 1-12 based on the asset's personality (Trending vs. Ranging).
Voting Threshold: Adjust ActivateOrders. A lower number = More Trades (Aggressive). A higher number = Fewer, higher conviction trades (Conservative).
Final Polish: Re-enable Stop Losses, Trailing Stops, and Staged Take Profits to smooth the equity curve and define your max risk per trade.
8. Technical Specs
Engine Version: Pine Script V6
Repainting: This strategy uses Closed Candle data for all Risk Management and Entry decisions. This ensures that Backtest results align closely with real-time behavior (no repainting of historical signals).
Alerts: This script generates Strategy alerts. If you require visual-only alerts, see the source code header for instructions on switching to "Study" (Indicator) mode.
Disclaimer:
This script is a complex algorithmic tool for market analysis. Past performance is not indicative of future results. Use this tool to assist your own decision-making, not to replace it.
9. About Signal Lynx
Automation for the Night-Shift Nation 🌙
Signal Lynx focuses on helping traders and developers bridge the gap between indicator logic and real-world automation. The same RM engine you see here powers multiple internal systems and templates, including other public scripts like the Super-AO Strategy with Advanced Risk Management.
We provide this code open source under the Mozilla Public License 2.0 (MPL-2.0) to:
Demonstrate how Adaptive Logic and structured Risk Management can outperform static, one-layer indicators
Give Pine Script users a battle-tested RM backbone they can reuse, remix, and extend
If you are looking to automate your TradingView strategies, route signals to exchanges, or simply want safer, smarter strategy structures, please keep Signal Lynx in your search.
License: Mozilla Public License 2.0 (Open Source).
If you make beneficial modifications, please consider releasing them back to the community so everyone can benefit.

Enhanced Ichimoku CloudDYNAMIC INDICATOR... im a beginer at this so i like to enhance my indicator by adding Visual Elements so that its easier to read for me... here is a visual representation of trend changes.

Relative Volume EMA (RVOL)Relative Volume EMA (RVOL) measures the current bar’s volume relative to its typical volume over a selected lookback period.
It helps traders identify whether a price move is supported by real participation or if it’s occurring on weak, low-quality volume.
This version uses:
RVOL = Current Volume ÷ Volume EMA
Volume EMA Length: adjustable
Signal Threshold: a customizable horizontal line (default = 1.2)
How to Use
1. RVOL > 1.2 → High-Quality Momentum
A value above 1.2 indicates that the current bar has at least 20% more volume than normal, suggesting:
Strong conviction
Algorithmic activity
Momentum-backed breakout or breakdown
Higher probability trend continuation
These bars are ideal for confirming entries after a technical setup (e.g., pullback, engulfing pattern, Ichimoku trend confirmation, etc.).
2. RVOL < 1.0 → Weak or Low-Quality Move
When RVOL is below 1.0:
Volume is below average
Moves are more likely to fail or reverse
Breakouts are unreliable
Triggers lack institutional participation
These bars are best avoided for trade entries.
Why This Indicator Is Useful
In many strategies, price alone is not enough.
RVOL acts as a filter to ensure that your signals occur during times when the market is actually active and committed.
Typical use cases:
Confirm trend-following entries
Validate pullbacks and breakout candles
Filter out low-volume chop
Identify session-based volume surges
Improve risk-to-reward quality by entering only during true momentum
Recommended Settings
EMA Length: 20
Threshold Line: 1.2
Works well on Forex, Crypto, and Indices
Best used on 15m, 30m, 1H, and 4H charts

Super momentum DBSISuper momentum DBSI: The Ultimate Guide
1. What is this Indicator?
The Super momentum DBSI is a "Consensus Engine." Instead of relying on a single line (like an RSI) to tell you where the market is going, this tool calculates 33 distinct technical indicators simultaneously for every single candle.
It treats the market like a democracy. It asks 33 mathematical "voters" (Momentum, Trend, Volume, Volatility) if they are Bullish or Bearish.
If 30 out of 33 say "Buy," the score is high (Yellow), and the trend is extremely strong.
If only 15 say "Buy," the score is low (Teal), and the trend is weak or choppy.
2. Visual Guide: How to Read the Numbers
The Scores
Top Number (Bears): Represents Selling Pressure.
Bottom Number (Bulls): Represents Buying Pressure.
The Colors (The Traffic Lights)
The colors are your primary signal. They tell you who is currently winning the war.
🟡 YELLOW (Dominance):
This indicates the Winning Side.
If the Bottom Number is Yellow, Bulls are in control.
If the Top Number is Yellow, Bears are in control.
🔴 RED (Weakness):
This appears on the Top. It means Bears are present but losing.
🔵 TEAL (Weakness):
This appears on the Bottom. It means Bulls are present but losing.
3. Trading Strategy
Scenario A: The "Strong Buy" (Long Entry)
The Setup: You are looking for a shift in momentum where Buyers overwhelm Sellers.
Watch the Bottom Number: Wait for it to turn Yellow.
Confirm Strength: Ensure the score is above 15 and rising (e.g., 12 → 18 → 22).
Check the Top: The Top Number should be Red and low (below 10).
Trigger: Enter on the candle close.
Scenario B: The "Strong Sell" (Short Entry)
The Setup: You are looking for Sellers to crush the Buyers.
Watch the Top Number: Wait for it to turn Yellow.
Confirm Strength: Ensure the score is above 15 and rising.
Check the Bottom: The Bottom Number should be Teal and low.
Trigger: Enter on the candle close.
Scenario C: The "No Trade Zone" (Choppy Market)
The Setup: The market is confused.
Visual: Top is Red, Bottom is Teal.
Meaning: NOBODY IS WINNING. There is no Yellow number.
Action: Do not trade. This usually happens during lunch hours, weekends, or right before big news. This filter alone will save you from many false breakouts.
4. What is Inside? (The 33 Indicators)
To give you confidence in the signals, here is exactly what the script is checking:
Group 1: Momentum (Oscillators)
Detects if price is moving fast.
RSI (Relative Strength Index)
CCI (Commodity Channel Index)
Stochastic
Williams %R
Momentum
Rate of Change (ROC)
Ultimate Oscillator
Awesome Oscillator
True Strength Index (TSI)
Stoch RSI
TRIX
Chande Momentum Oscillator
Group 2: Trend Direction
Detects the general path of the market.
13. MACD
14. Parabolic SAR
15. SuperTrend
16. ALMA (Moving Average)
17. Aroon
18. ADX (Directional Movement)
19. Coppock Curve
20. Ichimoku Conversion Line
21. Hull Moving Average
Group 3: Price Action
Detects where price is relative to averages.
22. Price vs EMA 20
23. Price vs EMA 50
24. Price vs EMA 200
Group 4: Volume & Force
Detects if there is money behind the move.
25. Money Flow Index (MFI)
26. On Balance Volume (OBV)
27. Chaikin Money Flow (CMF)
28. VWAP (Intraday)
29. Elder Force Index
30. Ease of Movement
Group 5: Volatility
Detects if price is pushing the outer limits.
31. Bollinger Bands
32. Keltner Channels
33. Donchian Channels
5. Pro Tips for Success
Don't Catch Knives: If the Bear score (Top) is Yellow and 25+, do not try to buy the dip. Wait for the Yellow score to break.
Exit Early: If you are Long and the Yellow Bull score drops from 28 to 15 in one candle, TAKE PROFIT. The momentum has died.
Use Higher Timeframes: This indicator works best on 15m, 1H, and 4H charts. On the 1m chart, it may be too volatile.
