Ichimoku Crosses_RSI_AITIchimoku Crosser_RSI_AIT
Overview
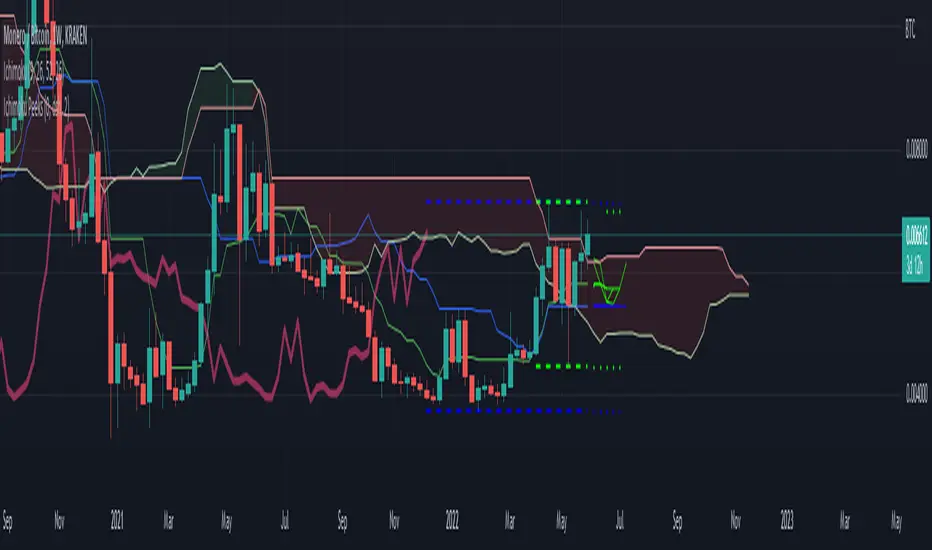
The "Ichimoku Cloud Crosses_AIT" strategy is a technical trading strategy that combines the Ichimoku Cloud components with the Relative Strength Index (RSI) to generate trade signals. This strategy leverages the crossovers of the Tenkan-sen and Kijun-sen lines of the Ichimoku Cloud, along with RSI levels, to identify potential entry and exit points for long and short trades. This guide explains the strategy components, conditions, and how to use it effectively in your trading.
1. Strategy Parameters
User Inputs
Tenkan-sen Period (tenkanLength): Default value is 21. This is the period used to calculate the Tenkan-sen line (conversion line) of the Ichimoku Cloud.
Kijun-sen Period (kijunLength): Default value is 120. This is the period used to calculate the Kijun-sen line (base line) of the Ichimoku Cloud.
Senkou Span B Period (senkouBLength): Default value is 52. This is the period used to calculate the Senkou Span B line (leading span B) of the Ichimoku Cloud.
RSI Period (rsiLength): Default value is 14. This period is used to calculate the Relative Strength Index (RSI).
RSI Long Entry Level (rsiLongLevel): Default value is 60. This level indicates the minimum RSI value for a long entry signal.
RSI Short Entry Level (rsiShortLevel): Default value is 40. This level indicates the maximum RSI value for a short entry signal.
2. Strategy Components
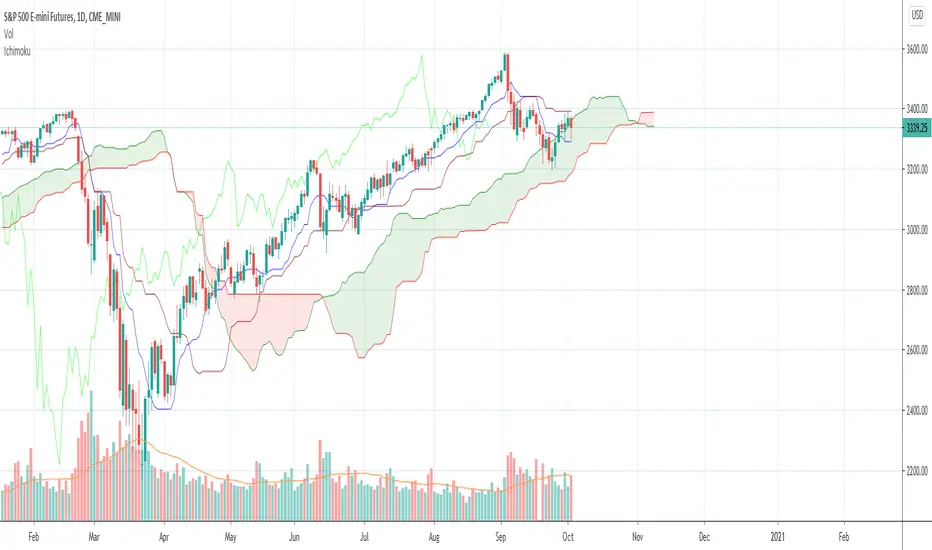
Ichimoku Cloud
Tenkan-sen: A short-term trend indicator calculated as the simple moving average (SMA) of the highest high and the lowest low over the Tenkan-sen period.
Kijun-sen: A medium-term trend indicator calculated as the SMA of the highest high and the lowest low over the Kijun-sen period.
Senkou Span A: Calculated as the average of the Tenkan-sen and Kijun-sen, plotted 26 periods ahead.
Senkou Span B: Calculated as the SMA of the highest high and lowest low over the Senkou Span B period, plotted 26 periods ahead.
Chikou Span: The closing price plotted 26 periods behind.
Relative Strength Index (RSI)
RSI: A momentum oscillator that measures the speed and change of price movements. It ranges from 0 to 100 and is used to identify overbought or oversold conditions.
3. Entry and Exit Conditions
Entry Conditions
Long Entry:
The Tenkan-sen crosses above the Kijun-sen (bullish crossover).
The RSI value is greater than or equal to the rsiLongLevel.
Short Entry:
The Tenkan-sen crosses below the Kijun-sen (bearish crossover).
The RSI value is less than or equal to the rsiShortLevel.
Exit Conditions
Exit Long Position: The Tenkan-sen crosses below the Kijun-sen.
Exit Short Position: The Tenkan-sen crosses above the Kijun-sen.
4. Visual Representation
Tenkan-sen Line: Plotted on the chart. The color changes based on its relation to the Kijun-sen (green if above, red if below) and is displayed with a line width of 2.
Kijun-sen Line: Plotted as a white line with a line width of 1.
Entry Arrows:
Long Entry: Displayed as a yellow triangle below the bar.
Short Entry: Displayed as a fuchsia triangle above the bar.
5. How to Use
Apply the Strategy: Apply the "Ichimoku Cloud Crosses_AIT" strategy to your chart in TradingView.
Configure Parameters: Adjust the strategy parameters (Tenkan-sen, Kijun-sen, Senkou Span B, and RSI settings) according to your trading preferences.
Interpret the Signals:
Long Entry: A yellow triangle appears below the bar when a long entry signal is generated.
Short Entry: A fuchsia triangle appears above the bar when a short entry signal is generated.
Monitor Open Positions: The strategy automatically exits positions based on the defined conditions.
Backtesting and Live Trading: Use the strategy for backtesting and live trading. Adjust risk management settings in the strategy properties as needed.
Conclusion
The "Ichimoku Cloud Crosses_AIT" strategy uses Ichimoku Cloud crossovers and RSI to generate trading signals. This strategy aims to capture market trends and potential reversals, providing a structured way to enter and exit trades. Make sure to backtest and optimize the strategy parameters to suit your trading style and market conditions before using it in a live trading environment.
Cerca negli script per "ichimoku"

Ichimoku RONIN [Lite]This Ichimoku is a Lite Edition of Ichimoku RONIN
Features :
- Ichimoku Default Lines
- Settings for Shift all of Lines
- Two Custom Periods Lines
- 9/26/52 Cycle Counter
- Optimized for Pine Script 5
- No Shifted Senko Span A Line
- New Cloud Alert
- KijunSen & TenkanSen Lines Crossed Alert
Good Trading to All ...

Ichimoku Cloud with ADX (By Coinrule)The Ichimoku Cloud is a collection of technical indicators that show support and resistance levels, as well as momentum and trend direction. It does this by taking multiple averages and plotting them on a chart. It also uses these figures to compute a “cloud” that attempts to forecast where the price may find support or resistance in the future.
The Ichimoku Cloud was developed by Goichi Hosoda, a Japanese journalist, and published in the late 1960s. It provides more data points than the standard candlestick chart. While it seems complicated at first glance, those familiar with how to read the charts often find it easy to understand with well-defined trading signals.
The Ichimoku Cloud is composed of five lines or calculations, two of which comprise a cloud where the difference between the two lines is shaded in.
The lines include a nine-period average, a 26-period average, an average of those two averages, a 52-period average, and a lagging closing price line.
The cloud is a key part of the indicator. When the price is below the cloud, the trend is down. When the price is above the cloud, the trend is up.
The above trend signals are strengthened if the cloud is moving in the same direction as the price. For example, during an uptrend, the top of the cloud is moving up, or during a downtrend, the bottom of the cloud is moving down.
DMI is simple to interpret. When +DI > - DI, it means the price is trending up. On the other hand, when -DI > +DI , the trend is weak or moving on the downside. The ADX does not give an indication about the direction but about the strength of the trend.
Typically values of ADX above 25 mean that the trend is steeply moving up or down, based on the -DI and +D positioning. This script aims to capture swings in the DMI, and thus, in the trend of the asset, using a contrarian approach.
Trading on high values of ADX , the strategy tries to spot extremely oversold and overbought conditions. Values of ADX above 45 may suggest that the trend has overextended and is may be about to reverse.
This strategy combines the Ichimoku Cloud with the ADX indicator to better enter trades.
Long/Short orders are placed when these basic signals are triggered.
Long Position:
Tenkan-Sen is above the Kijun-Sen
Chikou-Span is above the close of 26 bars ago
Close is above the Kumo Cloud
MACD line crosses over the signal line
-DI is greater than +DI
ADX is greater than 45
Short Position:
Tenkan-Sen is below the Kijun-Sen
Chikou-Span is below the close of 26 bars ago
Close is below the Kumo Cloud
MACD line crosses under the signal line
+DI is greater than -DI
ADX is less than 45
The script is backtested from 1 January 2022 and provides good returns.
The strategy assumes each order is using 30% of the available coins to make the results more realistic and to simulate you only ran this strategy on 30% of your holdings. A trading fee of 0.1% is also taken into account and is aligned to the base fee applied on Binance.
This script also works well on MATIC (15m timeframe), ETH (5m timeframe), and SOL (15m timeframe).

Ichimoku RONINA Full version of Ichimoku Kinko Hyo with many features ...
Features :
- Ichimoku Default Lines
- Settings for Shift all of Ichimoku Lines
- 52, 103, 108, 216 Periods Line
- Future TenkanSen, Kijunsen & Kumo Clouds
- 9/26/52 Cycle Counter
- Optimized for Pine Script 5

Ichimoku + RSI Crypto trending strategyThis is a crypto trending strategy designed for big timeframes such as 3-4h+.
Its components are:
RSI
ICHIMOKU full pack
Heikin Ashi candles for logic calculation inside
Rules for entry.
For long : we have a long cross condition on ichimoku and price is above the ichimoku lines, and at the same time RSI value is > 50.
For long : we have a short cross condition on ichimoku and price is below the ichimoku lines, and at the same time RSI value is < 50.
Rules for exit
We exit whenever we receive an opposite signal of the initial entry.
SInce this strategy is using no risk management inside, I recommend to be careful with it .
If you have any questions, let me know !

Ichimoku + 2 base linesIchimoku + 2 base line
This indicator is a combination of Ichimoku cloud indicator with two base lines.
The first base line is the same as the Ichimoku default settings but the baseline 2 indicates an average of 108 candles in the past and it acts as a strong support and resistance level.
How to use this indicator?
You can use this indicator to see if a break out is true or is a false break. For example if the price broke up the Ichimoku cloud and base line 2 is above the price, it will probably react to that area but if it's below the price, it is a good opportunity to buy. (for sell/short position it is in the opposite way the base line 2 should be above the price)
If you want to trade in support zones base line 2 (108) is a very good area that you can wait for a good candlestick pattern to enter a position.
Caution: before using this indicator please back test it and if the results were good enough, use it as a confirmation.

Ichimoku LiteIchimoku Kinko Hyo (often called Ichimoku Cloud) is a technical analysis method and trading system developed by Hosoda Goichi in 1935 and first published in 1975 under the pen-name Ichimoku Sanjin. The indicator shows the overall market state and reveals the equilibrium point of the price movement. The key idea of developing this indicator is to know the presence of the market. However, most of the default setting of this indicator is difficult to its elaborate visual presentation. Here, I modify the indicator by removing the lagging span and applying a lower color contrast of the cloud. This indicator can be combined with the turbulence indicator to provide a better confirmation of breakout signals.

Ichimoku ECC-11 As an IndicatorThis indicator is based on the famous ECC-11 strategy discussed on the Internet. It can be used on any timeframe, but ECC-11 is better suited for intraday 15min charts.
The various colour lines represent:
Black - Price
Orange - Chikou
Blue - Senkou A
Red - Senkou B
Green/Red - The Clouds
More information on how to follow the Ichimoku strategy can be found here:
www.investopedia.com
The main difference between the normal Ichimoku settings and ECC-11 are these ones are more sensitive by splitting them in half. Therefore beware sudden price change can be over amplified if you're used to the normal settings.
If you wish to have any changes, modifications or add some alerts please do not hesitate to message me.

Ichimoku with offset includedBased on the idea that some Donchian Channels in trading books have a lookback or offset of 1 in order to use it as a sort of trailing stop or so that the channels don't adjust. Ichimoku's Tenkan and Kijun lines have a very similar formula to Donchian Channels. In case anyone wants to use those lines as a sort of more fixed trailing stop, offset the Kijun, Tenkan, Span B, and/or treat it like Donchian Channels and such in the Ichimoku system, I included an offset of 1 as the default. To change this indicator to a standard regular looking Ichimoku, just change the offset value to 0.
The formula seems a bit different to what Tradingview has for their own version of Ichimoku but it's the same as many other programmers here. I made the colors as close to the traditional colors seen in books and other places and Tradingview as much as I could think of. Ichimoku has many different variations out there and to add the the confusion can have many different strategies to go with it. If you have any suggestions or tips, please let me know.
Ichimoku Cloud - AlertsIchimoku cloud
IC is a trend - following system with an indicator similar to moving averages
It predicts price movements
Offers a unique perspective of support and resistance levels.
Conversion Line (Turning Line)
- Measures Short Term Trend
- SIgnals an area of minor support and resistance
Base Line (Confirmation Line)
Measures Medium term trend
Used as Trailing Stop Level.
Lagging Span (Lagging Line)
Used for Confirmation of signals
Can also serve as Support and Resistance Level
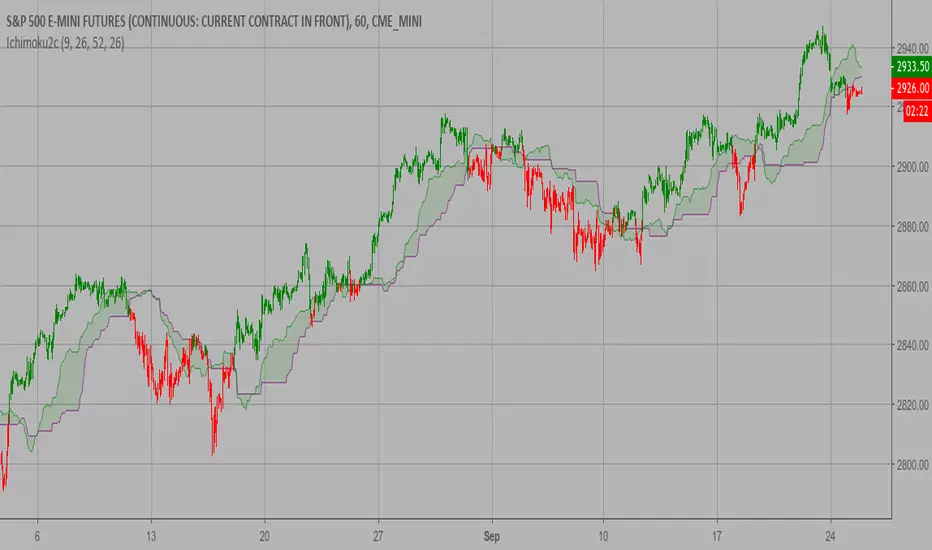
Kumo Cloud
Formed of two lines: Span A (Green Line) and Span B (Red Line)
Dynamic Support and Resistance .
HOW TO READ ICHIMOKU INDICATOR
Conversion Line
If the Market Price is above the Conversion Line = Short Term Upward Movement
If the Market Price is below the Conversion Line = Short Term Downward Movement
Increasing Conversion Line = Upward Short Term Trend
Decreasing Conversion Line = Downward Short Term Trend
Base Line
If the Market Price is above the baseline = Medium - term upward trend
If the Market price is below the baseline = Medium - Term downward Trend
Increasing Base Line = Upward Medium term trend
Decreasing Base Line = Downward Medium Term Trend
Lagging Span
The Evolution of the current price action in relation to previous price action
If the Lagging span is above the current price = Bullish Bias
If the Lagging span is below the current price = Bearish Bias
Lagging span near the current price = Trading range
Kumo Cloud
Dynamic Support and Resistance based upon price action.
The longer the price stays below/above the Kumo cloud, the STRONGER the trend is.
When the cloud is wide, the expected support or resistance is strong
When the cloud is thin, the expected support or resistance is weak
Never trade inside the KUMO CLOUD.
HOW TO TRADE WITH ICHIMOKU CLOUD
Baseline and conversion Line crossover (Lagging Span as a Filter)
crossover(conversion line, baseline) = Buy
crossunder(conversion line, baseline) = Sell
FILTER
crossover(conversion line, baseline) and lagging span is Bullish (i.e above the price) = Buy
Crossunder(conversion line, baseline) and lagging span is Bearish (i.e below the price) = Sell
2. Baseline - Conversion line crossover (Kumo cloud Filter)
crossover(conversion line, baseline) above the Kumo Cloud = Strong Buy
crossover(conversion line, baseline) below the Kumo cloud = Weak Buy
crossunder(conversion line, baseline) below the Kumo Cloud = Strong Sell
crossunder(conversion line, baseline) above the Kumo Cloud = Weak Sell
3. Kumo Cloud Breakout
When the price enters the Kumo Cloud, and breaks its Upper wall upward = Bullish Signal
When the price enters the Kumo Cloud, and breaks its Lower wall downward = Bearish Signal
4. Kumo Cloud Crossover
When Span A cuts the Span B from below to the upside and prices are positioned above the Kumo Cloud = Strong Buy Signal
When Span A cuts the Span B from upside to the bottom and the prices are positioned below the Kumo Cloud = Strong Sell
When Span A cuts Span B from bottom to the upside and prices are positioned below the Kumo Cloud = Weak Buy Signal
When Span A cuts Span B from the upside to the bottom and the prices are positioned above the Kumo Cloud = Weak Sell Signal.
NOTE:- Some of the signals collide with each other, but they collide for the same call, so shouldn't really be a problem overall. Let me know if you have any suggestions to nullify the trading Range. Though I do plan on adding my Renko code to it for filtering out Trading Range.

Ichimoku ATR Oscillator// An oscillator that visualizes Ichimoku trend line distances in terms of ATR.
// Public Domain
// By JollyWizard

Ichimoku (lib-hlm)An example of how to implement Ichimoku in other scripts using my `lib-hlm`.
You can copy and paste this code into any `\\@version=5` indicator to add Ichimoku to it.

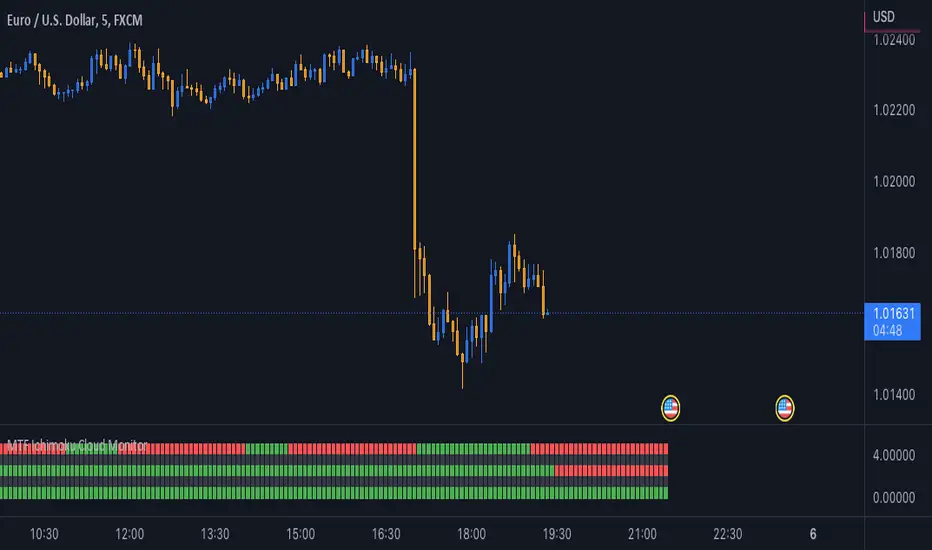
MTF Ichimoku Cloud MonitorIchimoku Kinko Hyo is a technical analysis method that builds on candlestick charting to improve the accuracy of forecast price moves.
his Indicator build for Monitor SenkouSpanA & SenkouSpanB Lines (Kumo Cloud) status and you can watch 3 Time Frames Status on one bar and in one timeframe.
You can select timeframe and set Inputs for lines from Indicator setting.
Good trading to all ...
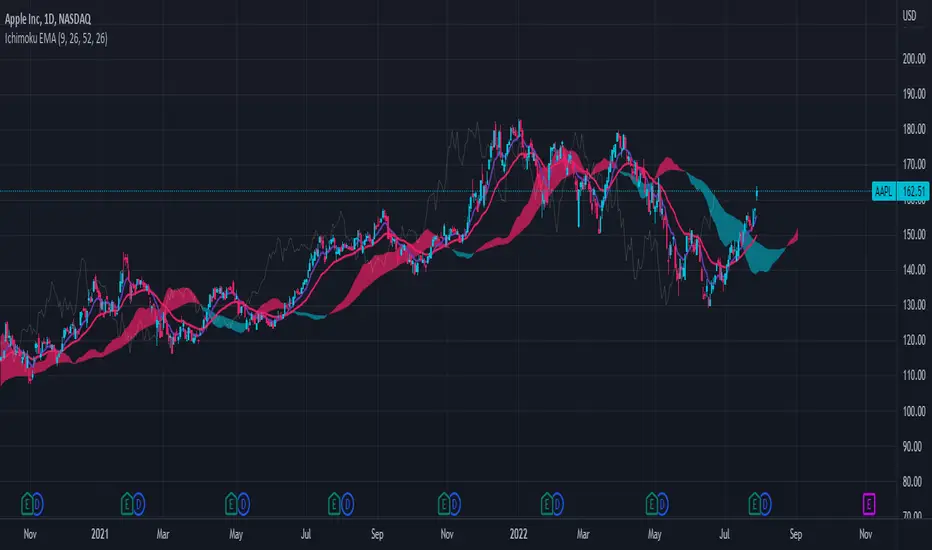
Ichimoku Cloud with EMAThis is a standard Ichimoku Cloud indicator that uses the exponential moving average (EMA) instead of the Tenkan and Kijun Sen.
It provides similar signals as the original but just looks nicer in my opinion.
Ichimoku PeeksThis indicator uses the Ichimoku Tenkan / Kijun trend line formulas to predict what those values will be in the future if current price action does not violate the period highs and lows.
Because of the way Ichimoku formulates the trend, it contains (but does not visualize) this predictive information in a way that moving averages do not.
Sharp chart readers can infer upcoming changes by counting back candles, but the process can be automated, as I've shown here.
This description does not seem to be editable so implementation details and usage will be covered in code commentary.
ICHIMOKU Crypto Swing AlertThis is a crypto swing alert for the strategy with the same name designed for timeframes bigger than 1h.
The main components are
ICHOMOKU
KDJ
Average High
Average Low
Rules for entry
For long: we have the ichimoku crosses between tenkan and baselines, we have a rising kdj line and at the same time we have a increase in the average high
For short: we have the ichimoku crosses between tenkan and baselines, we have a falling kdj line and at the same time we have an increase in the average low
Rules for exit
We exit when we have inverse conditions than the initial ones used for entry.
Caution
This strategy does not use a risk management, so be careful with it !
If you have any questions let me know !

Ichimoku Crypto Cloud 11-30-61A minor adjustment to the original Ichimoku Cloud, changing periods to reflect the 24/7 open market of cryptocurrency.
TENKAN: 11 - a week and a half
KIJUN: 30 - one month
SENKOU: 61 - two months
For a simpler visualization, I made the cloud limit lines and the Chikou line invisible by default.

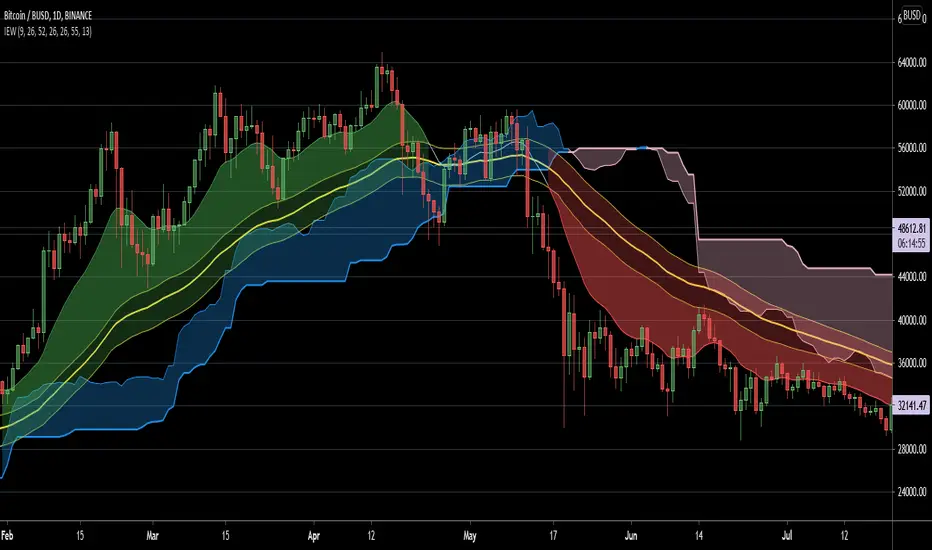
Ichimoku EMA WaveThis script combines a customizable Ichimoku Cloud/ EMA combination to provide a quick trend visualisation.
For example, long entries can be found when the green EMA wave rises above the Ichimoku cloud.
Combine it with some oscillators (like MACD) for good results.
Also, experimenting with a different "wavelength" (default 50) and/or EMA length (default10) for different securities is a good idea.
Script is free to use and to modify at ones liking.
Ichimoku Crypto LONG 3h ANY CRYPTO PairThis is a strategy which works with most of the crypto pairs on the 3H time frames.
It beats easily on the long term buy and hold strategy.
This strategy is made from the baseline from ichimoku together with ema 200
This is a long only strategy.
THe condition is : our candle is above ema 200 and our ichimoku its telling we have a long trend. We exit on the opposite signal.
If you have any questions private message me !

Ichimoku with MACD/ CMF/ TSI This is a strategy made from ichimoku cloud , together with MACD, Chaiking Money FLOW and True Strenght Index.
It can be adapted to any timeframe and any type of financial markets.
The idea behind its very simple,
We combine the long / short strategy from ichimoku, like cross between lines and below/above cloud together with histogram from MACD for positive/negative level. We use the same criteria for TSI and CMF, to check if its above or below 0 level.
Based on that we have a long or a short entry. The exit happens when the next options triggers, like for example we had long signal, we exit when we receive the short signal and viceversa.
It can be adapted with a risk management to apply a tp/sl level.
For any suggestion or details , let me know.

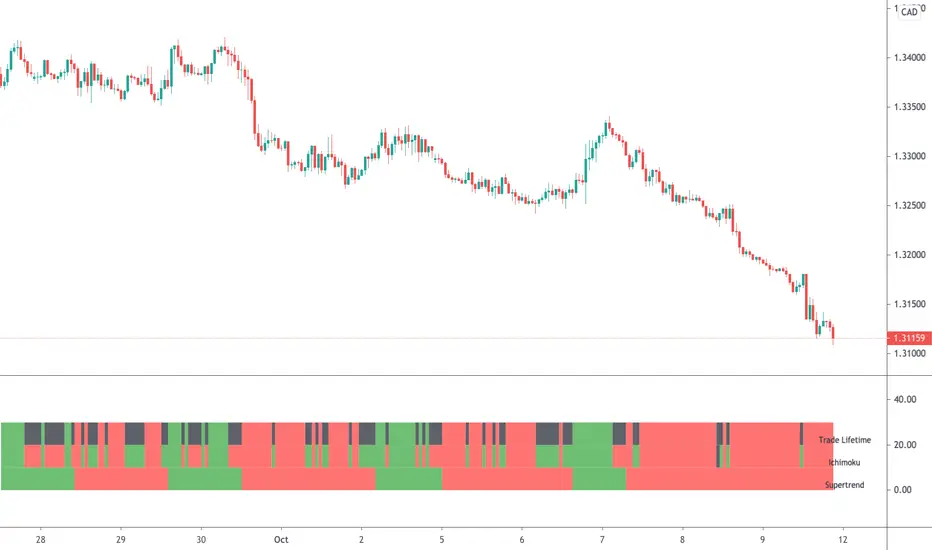
Ichimoku & Supertrend Combined StrategyOne of my mixed approach strategy indicators which include's:
- Ichimoku using much faster settings. (ECC-11)
- Supertrend
Whilst both Supertrend and Ichimoku are quite reliable, they do sometimes provide false signals. By combining both indicators, trading when both agree, it reduces the number of false alerts.
Using this indicator is simple. If the lifetime line is green then buy. If red then sell and when black don't trade. So...
Green Line - This strategy is in a buy position
Red Line - This strategy is in a sell position
Black Line - DON'T TRADE
The trader's approach is simple, when all indicators are green or red, then take the trade. As soon as one indicator changes, then re-evaluate using your normal process, such as price action, to determine whether to close the trade or continue.
There are also some alerts for opening and closing positions.
If you wish to make some changes or discuss, please don't hesitate to message me.
Ichimoku Clouds with Trend IdentificationThis is another version of the Ichimoku Clouds indicator where I have added logic to evaluate the current chart as either Bullish, Bearish, or Mixed, depending on 4 factors:
1. Is the price above/below the cloud?
2. Is the conversion line above/below the base line?
3. Is the lagging span above/below the cloud?
4. Is the rightmost cloud green/red?
If all conditions point the same direction, then the chart will be labelled "Bullish" or "Bearish". Otherwise it will be labelled "Mixed".
