Cerca negli script per "ichimoku"
vdub Atlasvdub Atlas, Multiple strategy combined indicator
ichmoku,
inside bollinger bands,
Multiple ma's,
Strength indicator MA's
Hull ma,
vdub binaryPro,
Session background colours.
Switch out any indicator you don't want.

Enhanced Multi-Indicator StrategyEnhanced Multi-Indicator Strategy v7 is a trend-following confirmation tool that combines several classic indicators into one clear “voting system.”
Instead of relying on a single signal, this script counts how many indicators agree on a bullish or bearish bias and only fires when the majority lines up and the trend is strong.
It’s designed to help you:
Filter out low-quality signals
Avoid trading against the dominant trend
Get clean, one-time BUY/SELL markers instead of noisy spam signals
How it Works
The indicator evaluates up to 10 components on each bar:
Trend & Structure
Moving Average (MA 50)
EMA Fast (20) vs EMA Slow (50)
Momentum
RSI (14)
MACD (12/26/9)
KDJ
Volatility & Price Location
Bollinger Bands (20, 2)
VWAP
Volume
Volume vs Volume MA (20)
Trend Strength & Direction
ADX + DMI (trend strength and up/down direction)
Optional
Ichimoku Cloud (price vs Senkou A/B)
Each indicator votes bullish or bearish.
The script then:
Counts how many are bullish → bullish_count
Counts how many are bearish → bearish_count
Requires at least Min Indicators for Entry (user-defined) to agree in one direction
Requires ADX above a threshold (default 20) to confirm trend strength
(Optionally) forces entries to follow the DMI trend:
Longs only in uptrends
Shorts only in downtrends
Only when these conditions are met does the script consider a valid long zone or short zone.
Signals: 1x Fire + Cooldown
To keep the chart clean and prevent over-trading:
A BUY arrow is plotted only on the first bar when price enters a new bullish zone.
A SELL arrow is plotted only on the first bar when price enters a new bearish zone.
A cooldown (in bars) can be configured separately for BUY and SELL so the script will not fire again in the same direction too frequently.
Background colors (optional):
Green background = bullish zone (majority indicators bullish + strong trend)
Red background = bearish zone (majority indicators bearish + strong trend)
This makes it easy to see when the “environment” is favorable for longs or shorts, while the arrows highlight the first opportunity in each zone.
Inputs & Tuning
Key inputs:
Min Indicators for Entry – how many indicators must agree (e.g. 5–7 for stricter filtering)
Strict Trend Filter – if enabled, entries must follow DMI trend (recommended for trend-following)
Cooldown BUY / SELL – minimum number of bars before a new signal in the same direction
Toggles to enable/disable each component (MA, EMA, RSI, MACD, KDJ, BB, Volume, VWAP, ADX, Ichimoku)
General ideas:
Increase Min Indicators for Entry and/or cooldown to reduce the number of signals and focus on stronger trends.
Lower values will make the indicator more active, suitable for shorter-term trading or scalping.
Important Note
This is an indicator, not a full trading system:
It does not manage entries/exits, position sizing, or risk by itself.
Always combine it with your own risk management, stop-loss / take-profit rules, and higher-timeframe context.
Use it as a confirmation / regime tool:
Trade only in the direction of the active zone,
Take BUY signals during bullish regimes,
Take SELL signals during bearish regimes.

Multitime TrendThis indicator combines 3 of the most powerful components:
Component Timeframe Purpose
EMA Fast & Slow Current chart timeframe Defines the dynamic trend (faster reaction to trend shifts)
Tchimoku (Tenkan / Kijun) Current chart timeframe Identifies the current price equilibrium zone (mean reversion)
Multi-Timeframe Ichimoku H5 (5 minutes) & H1 (1 hour) Confirms higher timeframe trend to filter noise & avoid trading against major trend.
EMA Trend (Primary Direction)
ema_fast = EMA 34
ema_slow = EMA 72
If EMA 34 crosses above EMA 72 → Bullish Trend
If EMA 34 crosses below EMA 72 → Bearish Trend
EMA color changes automatically (lime = buy, red = sell).
Tchimoku Tenkan-Kijun (Mean Reversion Logic)
Not using full Ichimoku — only Tenkan + Kijun, enhanced with ATR
If Tenkan > Kijun → short-term momentum is bullish
If Tenkan < Kijun → short-term momentum is bearish
Both lines are plotted and color-filled to visualize which side has control
→ More sensitive than EMA → reacts faster to real-time market flow.
Higher Timeframe Confirmation (H5 + H1)
Using the same Tenkan/Kijun algorithm, but calculated from:
H5 (5-minute timeframe)
H1 (1-hour timeframe)
If both H5 & H1 show the same fill color (teal = bullish, red = bearish):
→ Higher timeframe MTF confluence is confirmed
→ Helps avoid entering against dominant macro trend even if current chart shows minor reversal.
Role of This Indicator
Acts as a trend filter & smart bias detector, helping you decide BEFORE entering a trade.
It does not auto-execute trades, but instantly tells you:
✅ Should I BUY?
✅ Should I SELL?
❌ Should I STAY OUT because higher timeframe is against me?

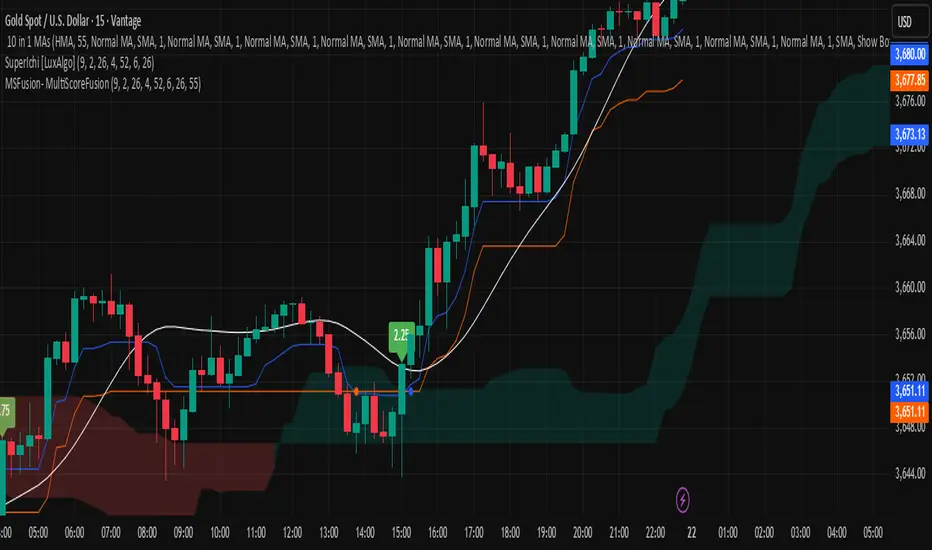
MSFusion- MultiScoreFusionThis Pine Script strategy, MSFusion - MultiScoreFusion, combines Ichimoku components and Hull Moving Average (HMA) signals to generate a composite score for each bar.
It evaluates several conditions—such as price crossing above HMA55, Tenkan and Kijun lines, and price position relative to the Ichimoku cloud—and assigns scores to each.
The script displays a label with the total score and a tooltip listing the contributing conditions when a strong bullish signal is detected. This approach helps traders quickly assess market momentum and trend strength using multiple technical criteria.
Consensus Signal Matrix Pro [By TraderMan] Consensus Signal Matrix Pro 🌟
What Does It Do? 📊
Consensus Signal Matrix Pro is a comprehensive technical analysis indicator designed for financial markets. 🧠 It aggregates signals from over 30 popular technical indicators (e.g., EMA, RSI, MACD, Bollinger Bands, Supertrend, Ichimoku, etc.) to provide a unified BUY, SELL, or NEUTRAL recommendation. 💡 This tool helps traders make informed decisions by consolidating signals and presenting them in a clear table format. 📈 It is particularly suited for leveraged trading (without built-in TP/SL). 🚀
How Does It Work? 🔍
Multi-Indicator Analysis 🛠️:
The indicator calculates signals from 30 different technical indicators (e.g., EMA 9/21, RSI, MACD, Supertrend, Ichimoku, Williams %R, etc.).
Each indicator generates a BUY, SELL, or NEUTRAL signal based on price action and volume data.
For example: RSI < 30 triggers a "BUY" signal, while RSI > 70 triggers a "SELL" signal. 🔔
Signal Aggregation and Consensus 🤝:
All indicator signals are collected into an array.
The number of BUY, SELL, and NEUTRAL signals is counted.
A percentage difference (percentDiff) is calculated by dividing the difference between BUY and SELL signals by the total number of indicators.
Based on this difference:
>20%: General status is GENERAL BUY. ✅
<-20%: General status is GENERAL SELL. ❎
In between: General status is NEUTRAL. ⚖️
Position Recommendation 💸:
The position type is determined based on the general status:
GENERAL BUY → LONG position recommended. 📈
GENERAL SELL → SHORT position recommended. 📉
NEUTRAL → No position (NONE). 🚫
Table Visualization 📋:
The indicator displays all signals and the general status in a table located in the top-right corner of the TradingView chart. 🎨
The table lists each indicator’s name, its signal (BUY/SELL/NEUTRAL), total indicator count, BUY/SELL/NEUTRAL counts, general status, and position type. 🖼️
Color coding is used: Green (BUY), Red (SELL), Gray (NEUTRAL), Orange (headers). 🌈
How to Use It? 🛠️
Setup ⚙️:
Copy and paste the indicator code into the Pine Editor on TradingView and compile it. 🖥️
Add it to your chart (works on any timeframe, though it uses D1 data for daily ATR). ⏰
Review the Table 📖:
Check the table displayed in the top-right corner of the chart.
Review each indicator’s signal (BUY/SELL/NEUTRAL) and the overall signal distribution.
Focus on the GENERAL STATUS and POSITION TYPE rows. 🔎
Position Opening Decision 💰:
LONG Position: If GENERAL STATUS is "GENERAL BUY" and the table shows mostly green (BUY) signals, consider opening a LONG position. 📈
SHORT Position: If GENERAL STATUS is "GENERAL SELL" and the table shows mostly red (SELL) signals, consider opening a SHORT position. 📉
NEUTRAL Status: If the status is "NEUTRAL," avoid opening a position. ⚖️
Risk Management ⚠️:
The indicator does not include Take Profit (TP) or Stop Loss (SL) levels. You must apply your own risk management strategy.
Recommended: Use ATR-based volatility (shown in the table as ATR signal) or support/resistance levels to set manual TP/SL. 🛡️
Timeframe and Asset ⏳:
Can be used on any financial asset (stocks, forex, crypto, etc.).
Works on short-term (1H, 4H) or long-term (D1, W1) charts. Evaluate signal speed based on your timeframe. 📅
How to Open Positions? 🎯
Trust the General Status: Use GENERAL STATUS (GENERAL BUY or GENERAL SELL) as the primary guide. A strong percentage difference (>20% or <-20%) indicates a more reliable signal. ✅
Check Signal Strength: Look at the table to assess the number of BUY or SELL signals. For example, if 20 out of 30 indicators signal BUY, it’s a strong LONG signal. 💪
Align with Market Conditions: Before acting, analyze the broader market trend (bullish, bearish, or sideways). For instance, SELL signals may be less reliable in a strong bull market. 📡
Combine with Other Analyses: Use the indicator alongside support/resistance levels, news flow, or fundamental analysis for confirmation. 🧩
Caution: The indicator is designed for leveraged trading but lacks TP/SL. Manage volatility and risk tolerance carefully. ⚠️
Advantages and Considerations 🌟
Advantages 😊:
Simplifies analysis by combining multiple indicators into one table.
Provides a quick overview of market direction.
User-friendly for both beginners and experienced traders.
Considerations ⚠️:
No signal is 100% accurate; markets can be unpredictable.
You must develop your own risk management strategy.
Signals may be misleading during high volatility; use additional confirmation.
Final Note 🎉:
Consensus Signal Matrix Pro is a powerful tool for traders seeking a consolidated view of multiple technical signals. 🚀 By combining diverse indicators into a single, easy-to-read table, it streamlines decision-making. However, always combine it with sound risk management and market context for the best results. 💸 Happy trading! 🤑

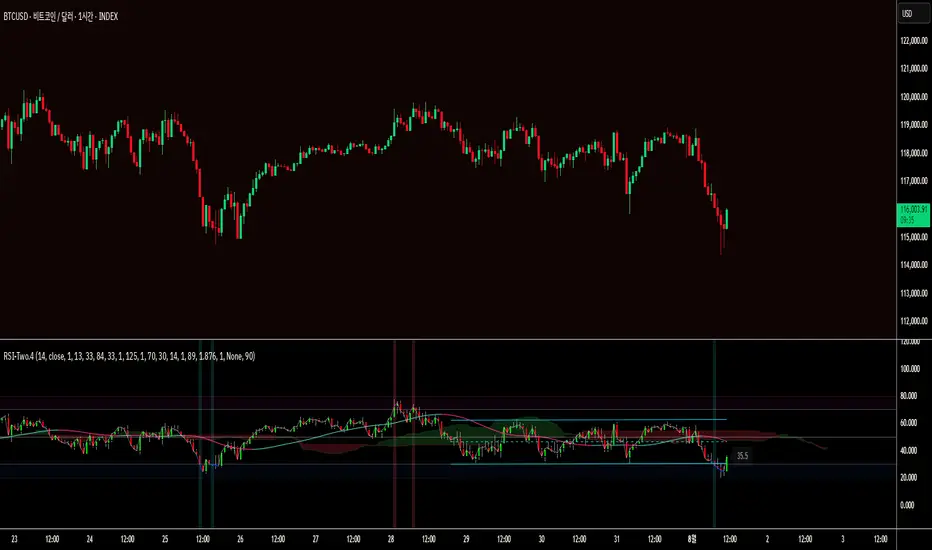
RSI-Two.4This looks like a detailed breakdown of a custom trading indicator based on the RSI (Relative Strength Index). It integrates various sub-indicators and visual analysis tools to precisely identify market strength and trend reversal signals.
Here is the English version of the provided text.
Overview
This indicator is designed to precisely identify market strength and trend reversal signals by integrating various sub-indicators and visual analysis tools centered around the RSI (Relative Strength Index).
On the chart, you can grasp the RSI trend, overbought/oversold zones, divergences, and trend reversal signals all at once, enabling more reliable trading decisions.
Detailed Feature Analysis
1. Basic RSI Calculation and Visualization
RSI Calculation:
Instead of the traditional RSI formula, a smoothed moving average method using ta.rma() is employed to reduce noise and provide a more intuitive RSI value.
Line Color and Display:
The RSI line is displayed in blue (#0B54FE) when the value is below 30, pink (#FC0FC0) when it's above 70, and semi-transparent white otherwise. This provides a clear, intuitive distinction of overbought and oversold zones.
Adjustable Line Thickness:
You can adjust the line thickness for customized chart readability.
2. RSI Candle Chart
Purpose:
The visual flow of the RSI is displayed in a candle chart format, allowing you to grasp the RSI's upward/downward trend at a glance.
Application:
Rising candles are shown in transparent green, while falling candles are shown in transparent red, allowing for an immediate assessment of market strength.
Utility:
This is far more intuitive than a regular RSI line and, when viewed alongside the main candle chart, helps you quickly recognize market turning points.
3. Ichimoku Cloud (RSI-based)
Cloud Concept:
This feature borrows the principles of the traditional Ichimoku Cloud to form an RSI-based cloud.
Leading Spans A and B:
The leading spans are calculated using the RSI's conversion and base lines, visualizing market support and resistance zones.
Colors:
Upward clouds are green, and downward clouds are brown.
How to Use:
Quickly identify bullish/bearish zones based on the cloud's color and position. A breakthrough of the cloud can be used as a strong trend reversal signal.
4. v.h.m. Moving Average Trend Length (Self-Calculated)
Color Change:
The color changes to green when the RSI rises and to pink when it falls, providing an intuitive grasp of the trend's direction.
Expert Tip:
A strong buy signal can be generated when the HMA (Hull Moving Average) turns upward, and a sell signal when it turns downward.
5. Overbought/Oversold Vertical Lines
Levels:
Based on the 70 (overbought) and 30 (oversold) thresholds.
Signals:
When the RSI crosses above 70 or below 30, colored vertical lines appear in the chart's background, quickly signaling an overbought or oversold state.
Expert Application:
Use overbought zones to identify potential selling opportunities and oversold zones to spot potential buying opportunities.
6. Divergence Detection
Function:
The indicator automatically detects bullish and bearish divergences, as well as hidden divergences, by analyzing the difference between price peaks and troughs and the RSI.
Signals:
Labels with "D," circles, or arrows are displayed on the chart to predict a trend reversal or weakening of momentum.
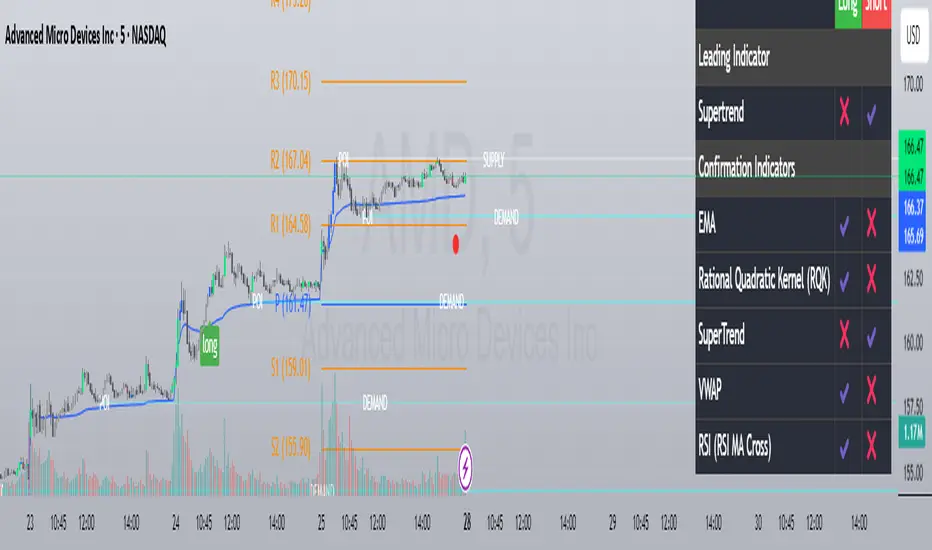
Custom Strategy Builder Raad V1This indicator is an advanced trading strategy builder that combines multiple technical indicators and analysis tools into a single script. Below is a simplified breakdown of its key components and functionalities.
Key Features & Components
1. Core Indicators
Moving Averages (EMA, SMA, WMA, HMA, VWMA) – Multiple types with customizable lengths.
Range Filter – A volatility-based trend filter.
SuperTrend – A trend-following indicator using ATR.
Half Trend – Another trend-following indicator.
Ichimoku Cloud – A comprehensive trend and support/resistance system.
2. Trend Indicators
Bollinger Bands – Volatility-based price channels.
MACD – Moving Average Convergence Divergence for momentum.
Parabolic SAR – A trailing stop indicator for trend direction.
Donchian Channel – Identifies breakout levels based on recent highs/lows.
3. Momentum Indicators
RSI (Relative Strength Index) – Measures overbought/oversold conditions.
Stochastic Oscillator – Another momentum indicator for reversals.
CCI (Commodity Channel Index) – Detects cyclical trends.
Awesome Oscillator (AO) – A histogram-based momentum tool.
4. Additional Analysis Tools
Fibonacci Retracement – Key support/resistance levels based on Fibonacci ratios.
Pivot Points – Calculates intraday support/resistance levels.
Supply/Demand Zones – Highlights key accumulation/distribution areas.
Volume Analysis – Includes VWAP and volume-based signals.
5. Dashboard & Customization
Switch Board – Enables/disables indicators on the chart.
Signal Filters – Adjusts confirmation rules for entries/exits.
Visual Customization – Change colors, line styles, and sizes.
How It Works
Leading Indicator – The primary signal generator (e.g., Range Filter, RSI, MACD).
Confirmation Indicators – Additional filters to validate signals (e.g., EMA cross, volume, trend strength).
Signal Expiry – Defines how long a signal remains valid before resetting.
Dashboard Display – Shows active signals and market conditions.
Best Use Cases
✅ Multi-Indicator Strategies – Combines multiple signals into one system.
✅ Trend & Momentum Trading – Works well for swing and intraday trading.
✅ Customizable Alerts – Can trigger buy/sell signals based on user-defined rules.
This indicator is ideal for traders who want a fully customizable and multi-strategy approach without manually overlaying multiple indicators.
هذا المؤشر هو أداة متقدمة لبناء استراتيجيات التداول تحتوي على مجموعة كبيرة من المؤشرات الفنية وأدوات التحليل. إليك شرح مبسط لمكوناته الرئيسية:
المكونات الرئيسية:
1. المؤشرات الأساسية:
المتوسطات المتحركة (EMA, SMA, WMA, HMA, VWMA): تسمح باختيار أنواع مختلفة من المتوسطات المتحركة بأطوال مختلفة.
Range Filter: مرشح يعتمد على مدى السعر لتحديد الاتجاه.
SuperTrend: مؤشر اتجاهي يعتمد على ATR.
Half Trend: مؤشر اتجاهي آخر.
Ichimoku Cloud: نظام إيشيموكو الكلاسيكي.
2. مؤشرات الاتجاه:
Bollinger Bands: نطاقات بولينجر.
MACD: مؤشر تقارب وتباعد المتوسطات المتحركة.
Parabolic SAR: مؤشر SAR القطعي المكافئ.
Donchian Channel: قناة دونشيان لتحديد القمم والقيعان.
3. مؤشرات الزخم:
RSI: مؤشر القوة النسبية.
Stochastic: مؤشر ستوكاستيك.
CCI: مؤشر قناة السلع.
Awesome Oscillator: مؤشر الزخم.
4. أدوات التحليل الأخرى:
Fibonacci Retracement: مستويات فيبوناتشي للتصحيح.
Pivot Points: نقاط محورية.
Supply/Demand Zones: مناطق العرض والطلب.
Volume Analysis: تحليل الحجم.
5. لوحة التحكم:
تسمح بتفعيل/تعطيل المؤشرات المختلفة.
تخصيص ألوان وعرض الخطوط.
ضبط معايير الإشارات.
طريقة العمل:
يحدد المؤشر إشارات شراء/بيع بناءً على تقاطعات المؤشرات المختلفة.
يمكن استخدام مؤشر رئيسي (Leading Indicator) مع مؤشرات تأكيد (Confirmation Indicators).
يوفر خيارات لتخصيص فترة انتهاء صلاحية الإشارة وطريقة العرض.
الاستخدام:
للمتداولين المتقدمين الذين يرغبون في بناء استراتيجيات معقدة.
يمكن استخدامه للتحليل الفني متعدد الأطر الزمنية.
يوفر مرونة كبيرة في تخصيص المؤشرات حسب احتياجات المستخدم.
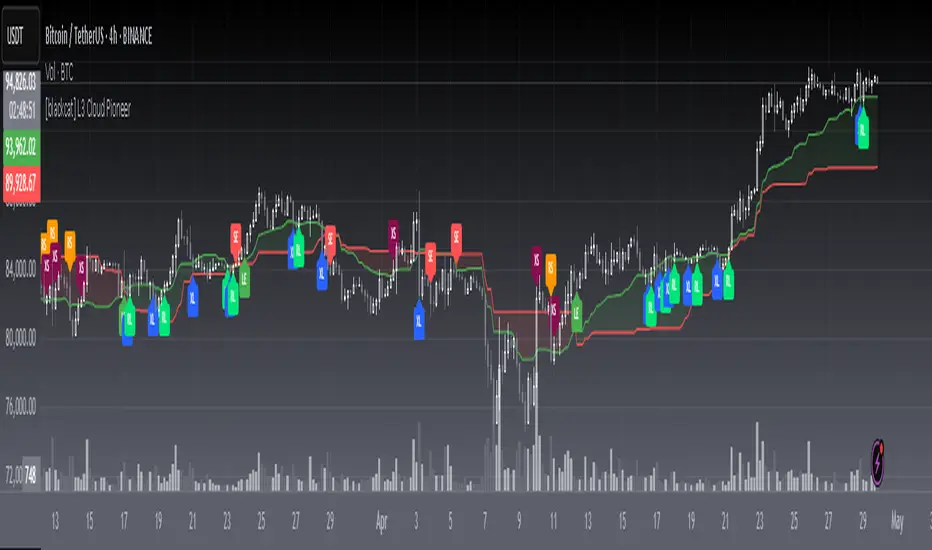
[blackcat] L3 Cloud PioneerOVERVIEW
The L3 Cloud Pioneer indicator combines elements of the Ichimoku Kinko Hyo system with Donchian Channels to provide a robust trend-following tool. This enhanced version includes detailed trade signal labels and alerts, helping traders identify potential entry and exit points more clearly. By plotting dynamic cloud areas and providing visual cues, this indicator aids in making informed trading decisions 📊📉↗️.
FEATURES
Calculates key Ichimoku components using custom Donchian Channel logic:
Conversion Line (based on highest/highest values over specified periods).
Base Line.
Leading Spans.
Lagging Span 2.
Plots a dynamic cloud area between Leading Span 1 and Leading Span 2, colored based on trend direction 🎨.
Identifies trend changes and provides clear entry/exit signals:
LE: Long Entry (when trend turns bullish).
SE: Short Entry (when trend turns bearish).
XL: Exit Long (price crosses below Leading Span 1 during an uptrend).
RL: Re-enter Long (price crosses above Leading Span 1 during an uptrend).
XS: Exit Short (price crosses above Leading Span 1 during a downtrend).
RS: Re-enter Short (price crosses below Leading Span 1 during a downtrend).
Displays corresponding labels on the chart for easy visualization, complete with tooltips for additional information 🏷️.
Generates alerts for each signal event to keep users informed about potential trades 🔔.
Supports customizable input parameters for conversion line, base line, and lagging span periods ⚙️.
HOW TO USE
Add the indicator to your TradingView chart by selecting it from the indicators list.
Adjust the input parameters (Conversion Line Periods, Base Line Periods, Lagging Span 2 Periods) to fit your preferences.
Observe the plotted cloud and labels for trend direction and potential trade opportunities.
Set up alerts based on the generated signals to receive notifications when conditions are met 📲.
Combine this indicator with other tools for confirmation before making trading decisions.
DETAILED SIGNAL LOGIC
Trend Determination:
The script determines the trend direction by comparing leading_line1 and leading_line2.
If leading_line1 is above leading_line2, the trend is considered bullish (isBullish). Otherwise, it's bearish (isBearish).
Signal Conditions:
Long Entry (LE): Triggered when the trend turns bullish from bearish.
Short Entry (SE): Triggered when the trend turns bearish from bullish.
Exit Long (XL): Triggered when the price crosses below leading_line1 during an uptrend.
Re-enter Long (RL): Triggered when the price crosses above leading_line1 during an uptrend.
Exit Short (XS): Triggered when the price crosses above leading_line1 during a downtrend.
Re-enter Short (RS): Triggered when the price crosses below leading_line1 during a downtrend.
Label Styling:
Labels are color-coded for quick identification:
Green for long entries and re-entries.
Red for short entries and exits.
Blue for exiting long positions.
Orange for re-entering short positions.
Tooltips provide additional context for each label.
Alert Configuration:
Alerts are generated for each signal condition, ensuring traders are notified promptly.
Users can set up these alerts within TradingView by creating new alerts and selecting the appropriate conditions.
LIMITATIONS
The indicator may lag behind price action due to its use of moving averages and channel calculations 🕒.
False signals can occur in choppy or sideways markets 🌪️.
Users should always confirm signals with other forms of analysis.
NOTES
Ensure that you have sufficient historical data available for accurate calculations.
Test the indicator thoroughly on demo accounts before applying it to live trading 🔍.
Customize the appearance and parameters as needed to fit your trading strategy.
For better risk management, consider integrating stop-loss and take-profit levels into your trading plan.
To optimize performance, manage old labels by deleting them after a certain period to avoid clutter on the chart.
Hosoda Time Cycles (Forward + Backward)Hosoda Time Cycles
Market Timing Projection Tool
The Hosoda Time Cycles indicator is inspired by the legendary Japanese trader Ichimoku Hosoda, who emphasized the power of time in forecasting market behavior. This tool visualizes forward and backward time cycles based on significant price pivots, enabling traders to anticipate potential trend shifts, consolidations, or continuations with high precision.
Key Features:
Forward & Backward Cycles: Projects future and past time intervals based on selected pivots to reveal cyclical patterns.
Manual & Auto Pivot Selection: Choose between automatic detection or manually selected swing highs/lows.
Cycle Ratios: Includes traditional Hosoda counts such as 9, 17, 26, 33, 42, and 65 — key numbers in Ichimoku time theory.
Multi-Timeframe Utility: Effective across intraday, swing, and long-term charts.
Minimalist Overlay: Clean design to avoid clutter while providing powerful cycle insights.
Customizable Visuals: Adjustable line styles, colors, and cycle projection lengths for clarity and personalization.
Ideal For:
Traders focused on time-based confluence, cycle forecasting, and market rhythm detection, especially those who blend price action with Japanese trading techniques.

TrendMasterPro_FekonomiTrend Change and Start Signals with Weighted Conditions
The Trend Change and Start Signals with Weighted Conditions indicator leverages various technical analysis tools to generate reliable buy and sell signals. This indicator helps investors more accurately identify trend changes and start signals in the market.
Features:
Utilizes popular technical analysis tools such as MACD, RSI, EMA, and Ichimoku Cloud.
Enhances signal accuracy with additional indicators like ADX and Volume Increase.
Allows users to adjust the weights of each condition to set their importance.
The Confidence Level parameter lets you adjust the accuracy rate of the signals.
Visual Signals make it easy to track buy and sell points directly on the chart.
How It Works:
Condition Weights: Users assign weights to indicators like MACD, RSI, EMA, and Ichimoku Cloud. If you have no idea, use default settings.
Condition Fulfillment: Checks if the conditions for each indicator are met.
Confidence Level: The total weight of the fulfilled conditions must exceed the user-defined confidence level.
Signal Generation: When these conditions are met, a buy or sell signal is generated and visually displayed on the chart.
Customization:
Personalize Signals: By adjusting the weights of the indicators used, you can personalize the signals to match your trading strategy and preferences.
Use Cases:
Short-Term Investments: Identify quick trend changes for short-term trading decisions.
Long-Term Investments: Detect long-term trend starts and changes for strategic investment decisions.
Technical Analysis: Combine different technical analysis tools for more comprehensive and reliable analyses.
With this indicator, you can better understand market movements and make more informed investment decisions. Try it now and enhance your trading strategy!
by Fekonomi

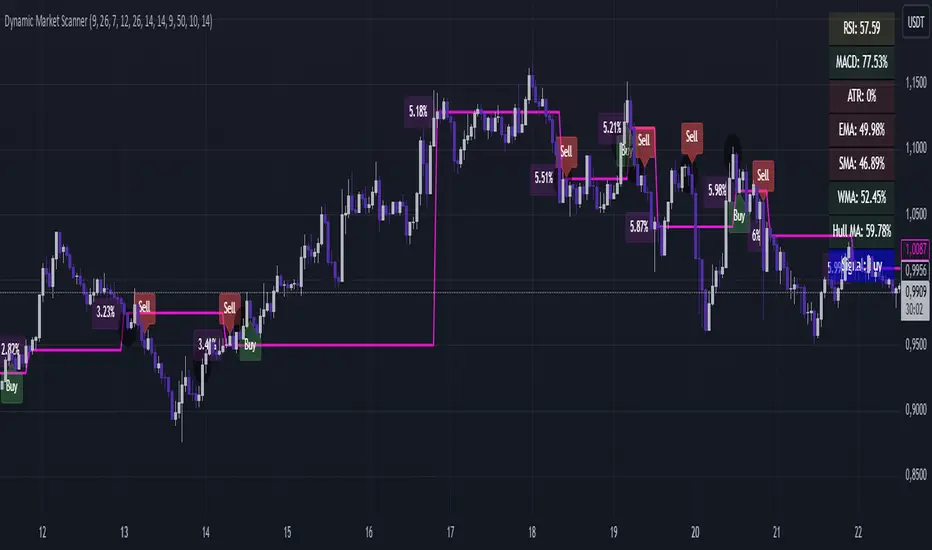
Dynamic Market ScannerDynamic Market Scanner is a powerful tool for analyzing financial markets, combining a variety of indicators to provide clear and understandable signals.
Key Features:
- Signal Generation:
The main signals "Buy", "Sell", and "Hold" are formed based on the analysis of indicators:
- MACD
- RSI
- SMA
- EMA
- WMA
- Hull MA
Additional Analytical Tools:
- ATR is used to assess volatility and helps to understand the risk of the current market situation.
- SMA Ichimoku does not generate signals but is used to assess their accuracy.
- If the price is above the SMA, "Buy" signals are more likely, as this confirms the strength of the upward movement.
- If the price is below the SMA, "Buy" signals require additional confirmations.
Dashboard:
Displays the current price position relative to the indicators, helping the trader understand how strong or weak the current signals are.
Advantages of Using:
1. Signal Filtering:
The price position relative to the SMA Ichimoku helps to assess the likelihood of successful trades.
2. Volatility Analysis:
ATR provides additional information about risks and market fluctuations.
3. Comprehensive Approach:
Signal generation is based on a combination of key indicators, offering a multifaceted view of the market.
Explanation of Percent Calculation in the Table:
- The table shows the values of indicators such as MACD, ATR, EMA, SMA, WMA, and Hull MA in percentages. Percentages are calculated based on the current value of the indicator relative to its maximum and minimum.
- Percentages are displayed for each indicator, allowing traders to assess market conditions based on their current values.
Dynamic Market Scanner will become a reliable assistant in your technical analysis toolkit, providing a comprehensive overview of market conditions and helping to make informed trading decisions.
Optimized Future Time CyclesThis script is based on time cycles and visually displays the cyclical fluctuations of the past and future, helping to predict trend reversal points and market turning points. Below, I will explain the main functions of this indicator and how to interpret it.
1. Main Features of the Indicator
Time Cycle Settings:
Users can set different time cycles (e.g., 9 days, 17 days, 26 days), and each cycle is visually distinguished by colors and labels.
A specific date is set as the reference date, from which the cycles are calculated. The cycles appear as vertical lines on the chart, both in the past and future, allowing you to spot trend reversals.
Future and Past Cycles:
Future cycles help predict when trend changes will occur in the future. Based on the set cycles, you can anticipate turning points in market trends.
Past cycles allow you to examine historical cycles, providing insights into past market movements, which can serve as a basis for predicting future patterns. This helps identify similar patterns from the past that might repeat.
2. How to Use and Interpret the Indicator
Reference Date Setting:
The reference date is a crucial factor in this indicator. For example, if you set the reference date as an important market turning point in the past, you can obtain a more accurate analysis.
If the reference date is too recent, multiple cycles may overlap on the chart, but this is a normal phenomenon. In this case, it is recommended to set the reference date further back in time for a clearer chart.
Cycle Analysis:
Each cycle represents cyclical market volatility. Shorter cycles like 9-day, 17-day, and 26-day cycles represent different timeframes' volatility. When multiple cycles overlap, this could indicate a significant trend reversal.
Pay attention to points where cycles overlap, as these could signal stronger trend changes.
Importance of Future Cycles:
It’s especially important to pay attention to future cycles as they provide insights into potential trend reversals. Future cycles can indicate likely points of trend reversal, helping you prepare in advance.
3. Additional Considerations
Vertical Line and Label Spacing:
Since multiple cycles are displayed on the chart simultaneously, you can customize the spacing of the vertical lines and labels. If the chart becomes too crowded, you can adjust the line style (solid, dotted, etc.) to reduce visual clutter.
Short-Term vs. Long-Term Cycles:
Short-term cycles (e.g., 9-day cycles) are useful for predicting short-term volatility, while long-term cycles (e.g., 200-day cycles) help predict larger trend changes. You can combine short and long cycles for deeper analysis.
4. Recommended Combination: With Moving Average Wave Indicator
This time cycle indicator works well in combination with the Moving Average Wave Indicator. While the time cycle indicator identifies timing for trend changes, the Moving Average Wave Indicator visually shows the direction of the trend. When used together, they offer precise entry and exit points for trades.
Time Cycles indicate when a trend change might occur, and Moving Average Waves show the direction of that trend at those specific points. Combining both helps you identify strong buy/sell signals.
5. Conclusion
This indicator uses time cycles to help you predict past and future market volatility. The reference date plays a critical role, and when multiple cycles overlap, you can expect strong trend reversals. Focusing on future cycles and combining this with the Moving Average Wave Indicator allows you to grasp both the timing and direction of trend changes, making this a powerful tool for market analysis.
"It is recommended to combine it with the Ichimoku Wave Oscillator with Custom MA indicator."
이 스크립트는 **시간 주기(Time Cycle)**에 기반한 지표로, 과거 및 미래의 주기적 변동을 시각적으로 보여주어 추세 변화의 시점과 시장 변곡점을 예측하는 데 도움을 줍니다. 이 지표의 주요 기능과 해석 방법을 중심으로 자세히 설명드리겠습니다.
1. 지표의 주요 기능
시간 주기 설정:
각기 다른 시간 주기(9일, 17일, 26일 등)를 사용자가 설정할 수 있으며, 각 주기는 색상과 레이블로 시각적으로 구분됩니다.
특정 날짜를 **기준 날짜(reference date)**로 설정하여 그 날짜부터 주기들이 계산됩니다. 기준 날짜를 기반으로 과거와 미래의 주기가 차트에 수직선과 함께 나타나며, 이를 통해 추세의 변곡점을 확인할 수 있습니다.
미래 주기 및 과거 주기:
미래 주기는 미래의 추세 변화 시점을 예측하는 데 도움이 됩니다. 각 주기가 설정된 기준에 따라 추세 변곡점이 언제 도래할지 미리 알 수 있습니다.
과거 주기는 과거 시장에서의 주기적 변동을 확인하여, 앞으로의 시장 움직임을 예측하는 데 참고할 수 있습니다. 이를 통해 과거와 유사한 패턴을 포착할 수 있습니다.
2. 지표 사용 및 해석 방법
기준 날짜 설정:
이 지표의 기준 날짜는 매우 중요한 요소입니다. 예를 들어, 시장에서 중요한 변동이 있었던 날짜를 기준으로 설정하면 더 정확한 분석이 가능합니다.
기준 날짜가 너무 최근일 경우, 여러 주기들이 차트 상에서 겹칠 수 있는데 이는 정상적인 현상입니다. 이 경우, 기준 날짜를 더 과거로 설정하면 차트가 좀 더 깔끔하게 보일 수 있습니다.
주기 분석:
각 주기는 시장 변동성의 주기적 패턴을 나타냅니다. 9일, 17일, 26일 등의 주기는 각기 다른 시간대의 변동성을 나타내며, 주기가 겹칠 때 추세 전환 시점이 강하게 나타날 수 있습니다.
주기가 겹치는 시점에서 변동이 강해질 가능성이 있으며, 이때는 추세 변화에 주목할 필요가 있습니다.
미래 주기의 중요성:
특히 미래 주기를 확인하는 것이 중요한데, 미래에 어떤 시점에서 변곡점이 나타날지 예측하는 데 사용할 수 있기 때문입니다. 미래 주기는 추세 전환 가능성이 높은 시점을 알려줄 수 있으므로, 미리 준비하고 대응할 수 있게 도와줍니다.
3. 추가적으로 고려할 사항
수직선과 레이블 간격:
여러 주기들이 한꺼번에 차트에 표시되기 때문에, 수직선이나 레이블 간의 간격을 커스터마이징할 수 있습니다. 특히, 차트가 혼잡할 경우 선 스타일(실선, 점선 등)을 조정하여 시각적으로 덜 복잡하게 설정할 수 있습니다.
단기 vs. 장기 주기:
**단기 주기(예: 9일)**는 빠른 변동성을 예측하는 데 유리하며, **장기 주기(예: 200일)**는 더 큰 추세 변화를 예측하는 데 도움이 됩니다. 두 주기 간의 상호작용을 고려하여 분석의 깊이를 더할 수 있습니다.
4. 결합 사용 추천: 이평선 파동 지표와 함께
이 시간 주기 지표는 이평선 파동 지표와 결합하여 사용할 때 추세의 방향성과 변곡점을 동시에 분석하는 데 매우 유용합니다.
시간 주기는 추세 변곡점의 시점을 알려주고, 이평선 파동은 그 시점에서의 추세 방향성을 시각적으로 나타내므로, 두 지표를 함께 사용하면 정확한 매매 타이밍을 잡는 데 큰 도움이 됩니다.
5. 결론
이 지표는 **시간 주기(Time Cycle)**를 활용하여 과거 및 미래의 시장 변동성을 예측할 수 있도록 도와줍니다. 특히, 기준 날짜 설정이 매우 중요하며, 여러 주기가 겹치는 시점에서는 강한 추세 전환을 예상할 수 있습니다. 미래 주기를 중점적으로 분석하고, 이평선 파동 지표와 결합하여 사용하면 추세 변화의 방향성과 시점을 동시에 잡아낼 수 있어 매우 유용합니다. "Ichimoku Wave Oscillator with Custom MA 지표와 결합해서 사용하면 좋습니다."

S&R Precision Cloud by Dr. Abiram Sivprasad -4 directional biasDescription of the Script
**Script Name:** S&R Precision Cloud by Dr. Abhiram Sivprasad
**Overview:**
This script is designed to identify key support and resistance levels using the Central Pivot Range (CPR) methodology along with daily, weekly, and monthly pivots. It incorporates the Lagging Span from the Ichimoku Cloud to enhance decision-making in trading strategies for intraday, swing, and long-term positions mainly for directional bias.
---
### Key Components:
1. **Central Pivot Range (CPR):**
- **Central Pivot (CP):** Calculated as the average of the high, low, and close prices. This serves as a reference point for price action.
- **Below Central Pivot (BC) and Top Central Pivot (TC):** Derived to create a range that aids in identifying support and resistance levels.
2. **Support and Resistance Levels:**
- The script computes three support (S1, S2, S3) and resistance (R1, R2, R3) levels based on the Central Pivot.
- These levels are plotted for daily, weekly, and monthly time frames, providing traders with multiple reference points.
3. **Lagging Span:**
- The Lagging Span is plotted as the closing price shifted backward by 26 periods (as per Ichimoku settings).
- This serves as a filter for trade entries, where positions should only be taken in the direction opposite to where the price is relative to this line.
4. **User Inputs:**
- The script allows customization through checkboxes to plot daily, weekly, and monthly support and resistance levels as needed.
- Users can choose whether to display CPR and various support/resistance levels for better visual clarity.
5. **Color Coding:**
- The support and resistance lines are color-coded to distinguish between different levels (green for support, red for resistance, and blue for pivots).
---
### Trading Strategies:
- **Intraday Trading:**
- Utilize price movements around the Lagging Span and support/resistance levels for quick trades.
- **Swing Trading:**
- Identify potential reversal points at S2 and R2 levels, confirmed by divergences in price movement.
- **Long-Term Trading:**
- Monitor price behavior against the Lagging Span and significant pivot levels to capture longer trends.
---
### Summary:
This script equips traders with essential tools for technical analysis by clearly defining critical price levels and incorporating the Lagging Span for directional bias. It is suitable for various trading styles, including intraday, swing, and long-term strategies, making it a versatile addition to any trader’s toolkit.

Swiss Knife [MERT]Introduction
The Swiss Knife indicator is a comprehensive trading tool designed to provide a multi-dimensional analysis of the market. By integrating a wide array of technical indicators across multiple timeframes, it offers traders a holistic view of market sentiment, momentum, and potential reversal points. This indicator is particularly useful for traders looking to combine trend analysis, momentum indicators, volume data, and price action into a single, easy-to-read format.
---
Key Features
Multi-Timeframe Analysis : Evaluates indicators on Daily , 4-Hour , 1-Hour , and 15-Minute timeframes.
Comprehensive Indicator Suite : Incorporates MACD , Awesome Oscillator (AO) , Parabolic SAR , SuperTrend , DPO , RSI , Stochastic Oscillator , Bollinger Bands , Ichimoku Cloud , Chande Momentum Oscillator (CMO) , Donchian Channels , ADX , volume-based momentum indicators, Fractals , and divergence detection.
Market Sentiment Scoring : Aggregates signals from multiple indicators to provide an overall sentiment score.
Visual Aids : Displays EMA lines, trendlines, divergence signals, and a sentiment table directly on the chart.
Super Trend Reversal Signals : Identifies potential market reversal points by assessing the momentum of automated trading bots.
---
Explanation of Each Indicator
Moving Average Convergence Divergence (MACD)
- Purpose : Measures the relationship between two moving averages of price.
- Interpretation : A positive histogram suggests bullish momentum; a negative histogram indicates bearish momentum.
Awesome Oscillator (AO)
- Purpose : Gauges market momentum by comparing recent market movements to historic ones.
- Interpretation : Above zero indicates bullish momentum; below zero indicates bearish momentum.
Parabolic SAR (SAR)
- Purpose : Identifies potential reversal points in price direction.
- Interpretation : Dots below price suggest an uptrend; dots above price suggest a downtrend.
SuperTrend
- Purpose : Determines the prevailing market trend.
- Interpretation : Provides buy or sell signals based on price movements relative to the SuperTrend line.
Detrended Price Oscillator (DPO)
- Purpose : Removes trend from price to identify cycles.
- Interpretation : Values above zero suggest price is above the moving average; values below zero indicate it is below.
Relative Strength Index (RSI)
- Purpose : Measures the speed and change of price movements.
- Interpretation : Values above 50 indicate bullish momentum; values below 50 indicate bearish momentum.
Stochastic Oscillator
- Purpose : Compares a particular closing price to a range of its prices over a certain period.
- Interpretation : Values above 50 indicate bullish conditions; values below 50 indicate bearish conditions.
Bollinger Bands (BB)
- Purpose : Measures market volatility and provides relative price levels.
- Interpretation : Price above the middle band suggests bullishness; below the middle band suggests bearishness.
Ichimoku Cloud
- Purpose : Provides support and resistance levels, trend direction, and momentum.
- Interpretation : Bullish signals when price is above the cloud; bearish signals when price is below the cloud.
Chande Momentum Oscillator (CMO)
- Purpose : Measures momentum on both up and down days.
- Interpretation : Values above 50 indicate strong upward momentum; values below -50 indicate strong downward momentum.
Donchian Channels
- Purpose : Identifies volatility and potential breakouts.
- Interpretation : Price above the upper band suggests bullish breakout; below the lower band suggests bearish breakout.
Average Directional Index (ADX)
- Purpose : Measures the strength of a trend.
- Interpretation : DI+ above DI- indicates bullish trend; DI- above DI+ indicates bearish trend.
Volume Momentum Indicators (VolMom, CumVolMom, POCMom)
- Purpose : Analyze volume to assess buying and selling pressure.
- Interpretation : Positive values suggest bullish volume momentum; negative values indicate bearish volume momentum.
Fractals
- Purpose : Identify potential reversal points in the market.
- Interpretation : Up fractals may indicate a future downtrend; down fractals may indicate a future uptrend.
Divergence Detection
- Purpose : Identifies divergences between price and various indicators (RSI, MACD, Stochastic, OBV, MFI, A/D Line).
- Interpretation : Bullish divergences suggest potential upward reversal; bearish divergences suggest potential downward reversal.
- Note : This functionality utilizes the library from Divergence Indicator .
---
Coloring Scheme
Background Color
- Purpose : Reflects the overall market sentiment by combining sentiment scores from all indicators across different timeframes.
- Interpretation :
- Green Shades : Indicate bullish market sentiment.
- Red Shades : Indicate bearish market sentiment.
- Intensity : The strength of the color corresponds to the strength of the sentiment score.
Sentiment Table
- Purpose : Displays the status of each indicator across different timeframes.
- Interpretation :
- Green Cell : The indicator suggests a bullish signal.
- Red Cell : The indicator suggests a bearish signal.
- Percentage Score : Indicates the overall bullish or bearish sentiment on that timeframe.
Exponential Moving Averages (EMAs)
- Purpose : Provide dynamic support and resistance levels.
- Colors :
- EMA 10 : Lime
- EMA 20 : Yellow
- EMA 50 : Orange
- EMA 100 : Red
- EMA 200 : Purple
Trendlines
- Purpose : Visual representation of support and resistance levels based on pivot points.
- Interpretation :
- Upward Trendlines : Colored green , indicating support levels.
- Downward Trendlines : Colored red , indicating resistance levels.
- Note : Trendlines are drawn using the library from Simple Trendlines .
---
Utility of Market Sentiment
The indicator aggregates signals from multiple technical indicators across various timeframes to compute an overall market sentiment score . This comprehensive approach helps traders understand the prevailing market conditions by:
Confirming Trends : Multiple indicators pointing in the same direction can confirm the strength of a trend.
Identifying Reversals : Divergences and fractals can signal potential turning points.
Timeframe Alignment : Aligning signals across different timeframes can enhance the probability of successful trades.
---
Divergences
Divergence occurs when the price of an asset moves in the opposite direction of a technical indicator, suggesting a potential reversal.
- Bullish Divergence : Price makes a lower low, but the indicator makes a higher low.
- Bearish Divergence : Price makes a higher high, but the indicator makes a lower high.
The indicator detects divergences for:
RSI
MACD
Stochastic Oscillator
On-Balance Volume (OBV)
Money Flow Index (MFI)
Accumulation/Distribution Line (A/D Line)
By identifying these divergences, traders can spot early signs of trend reversals and adjust their strategies accordingly.
---
Trendlines
Trendlines are essential tools for identifying support and resistance levels. The indicator automatically draws trendlines based on pivot points:
- Upward Trendlines (Support) : Connect higher lows, indicating an uptrend.
- Downward Trendlines (Resistance) : Connect lower highs, indicating a downtrend.
These trendlines help traders visualize the trend direction and potential breakout or reversal points.
---
Super Trend Reversals (ST Reversal)
The core idea behind the Super Trend Reversals indicator is to assess the momentum of automated trading bots (often referred to as 'Supertrend bots') that enter the market during critical turning points. Specifically, the indicator is tuned to identify when the market is nearing bottoms or peaks, just before it shifts direction based on the triggered Supertrend signals. This approach helps traders:
Engage Early : Enter the market as reversal momentum builds up.
Optimize Entries and Exits : Enter under favorable conditions and exit before momentum wanes.
By capturing these reversal points, traders can enhance their trading performance.
---
Conclusion
The Swiss Knife indicator serves as a versatile tool that combines multiple technical analysis methods into a single, comprehensive indicator. By assessing various aspects of the market—including trend direction, momentum, volume, and price action—it provides traders with valuable insights to make informed trading decisions.
---
Citations
- Divergence Detection Library : Divergence Indicator by DevLucem
- Trendline Drawing Library : Simple Trendlines by HoanGhetti
---
Note : This indicator is intended for informational purposes and should be used in conjunction with other analysis techniques. Always perform due diligence before making trading decisions.
---

Alpha Cloud Algo 2.0 Bybit SpecialAlpha Cloud Algo 2.0 Bybit Special Version
Sürüm Notları:
I'm excited to introduce 'Alpha Cloud Algo Version 2' to you! This advanced technical analysis indicator helps you evaluate market trends and potential trading signals. Here are the current features of Alpha Cloud Algo:
1️⃣ 📈 Technical Indicators: The Technical Indicators table in version 1.3 of the indicator has been completely rewritten and enhanced. We have integrated several indicators such as Trend indicator with my custom Ichimoku settings, PDPOC (Previous Day's Point Of Control), PWPOC (Previous Week's Point of Control), RSI, Stoch, MACD, VWAP, and Volume Bars. With this update, you can visualize market trends and trading signals more effectively.
2️⃣ ⏰ Multi-Timeframe Support: With Alpha Cloud Algo V.II, we offer the ability to use support and resistance levels of the Clouds across multiple timeframes. This feature allows for more comprehensive analysis and helps you make accurate decisions.
3️⃣ 💭 SR Channels: The SR Channels indicator, used to determine support and resistance levels, has been integrated into Alpha Cloud Algo 2. This special indicator analyzes price movements, identifies important levels, and displays them in the form of channels on the chart. You can view support and resistance levels from any timeframe on the chart and also in tabular form.
4️⃣ ☁️ Trend Cloud Indicator: Alpha Cloud Algo 2 utilizes trend clouds to determine the direction and strength of the trend. It provides multiple layers of trend clouds, each representing a different timeframe. With this customized indicator, you can understand trends more clearly and analyze price movements effectively.
5️⃣ ➿ Auto Fibonacci: The latest feature of Alpha Cloud Algo includes automatic Fibonacci drawing. The indicator automatically plots potential support and resistance levels using specific ratios (such as 0, 0.382, 0.618, 0.886, and 1). You can adjust these ratios as desired.
Alpha Cloud Algo combines the power of technical analysis tools to help you better assess opportunities in the market. You can use Alpha Cloud Algo to enhance your trading strategies and make more informed decisions.
Using Alpha Cloud Algo is also very user-friendly. You can analyze using technical indicators, multi-timeframe support, SR channels, and automatic Fibonacci drawing to identify trends and evaluate trading signals. This provides you with a better trading experience and can increase your profitability.
To use Alpha Cloud Algo, you need to create an account on Tradingview and complete the Alpha Cloud Algo membership process. This way, you have the freedom to trade on any device, anytime, and anywhere.
Alpha Cloud Algo performs analyses using up-to-date and accurate market data, and presents you with the latest trading opportunities. Its user-friendly interface enables you to perform quick and easy analyses as desired.
Take technical analysis to the next level with Alpha Cloud Algo and make more successful trading decisions.
Turkish Translate ;
‘Alpha Cloud Algo Versiyon 2’yi size tanıtmaktan mutluluk duyuyorum! Bu gelişmiş teknik analiz indikatörü, piyasa trendlerini ve olası ticaret sinyallerini değerlendirmenize yardımcı olur. İşte Alpha Cloud Algo'nun güncel özellikleri:
1️⃣ 📈 Teknik Göstergeler: İndikatörün 1.3 versiyonundaki Teknik Göstergeler tablosu tamamen yeniden yazıldı ve geliştirildi. Benim özel Ichimoku ayarlarımda Trend göstergesini, PDPOC (Bir önceki günün Point Of Control bölgesi), PWPOC (Bir önceki haftanın Point of Control Bölgesi), RSI, Stoch, MACD, VWAP ve Volume Barları gibi birçok göstergeyi entegre ettik. Bu güncelleme sayesinde piyasa trendlerini ve ticaret sinyallerini daha iyi görselleştirebilirsiniz.
2️⃣ ⏰ Çoklu Zaman Dilimi Desteği: Alpha Cloud Algo V.II ile birlikte, Bulutların destek ve direnç seviyelerini birden çok zaman diliminde kullanabilme imkanı sunuyoruz. Bu özellik sayesinde daha kapsamlı bir analiz yapabilir ve doğru kararlar alabilirsiniz.
3️⃣ 💭 SR Kanalları: Destek ve direnç seviyelerini belirlemek için kullanılan SR Kanalları indikatörü, Alpha Cloud Algo 2 ile entegre hale getirildi. Bu özel gösterge, fiyat hareketlerini analiz ederek önemli seviyeleri tespit eder ve bunları kanallar halinde gösterir. Çoklu zaman diliminde baktığınız grafiğe istediğiniz zaman dilimindeki destek ve direnç seviyelerini hem grafik üzerinde görüntüleyebilir hem de tablo şeklinde görebilirsiniz.
4️⃣ ☁️ Trend Bulutu Göstergesi: Alpha Cloud Algo 2, trendin yönünü ve gücünü belirlemek için trend bulutlarını kullanır. Birden fazla trend bulutu katmanı sunar ve her katman farklı bir zaman dilimini temsil eder. Bu özelleştirilmiş gösterge sayesinde trendi daha net bir şekilde anlayabilir ve fiyat hareketlerini analiz edebilirsiniz.
5️⃣ ➿ Otomatik Fibonacci: Alpha Cloud Algo'nun en yeni özelliği, otomatik Fibonacci çizimini içerir. İndikatör, belirli oranları (0, 0.382, 0.618, 0.886 ve 1 gibi) kullanarak potansiyel destek ve direnç seviyelerini otomatik olarak çizer. Bu oranları isteğe bağlı olarak ayarlayabilirsiniz.
Alpha Cloud Algo, teknik analiz araçlarının gücünü bir araya getirerek, piyasadaki fırsatları daha iyi değerlendirmenizi sağlar. Ticaret stratejilerinizi geliştirmek ve kararlarınızı daha bilinçli bir şekilde vermek için Alpha Cloud Algo'yu kullanabilirsiniz.
Alpha Cloud Algo'nun kullanımı da oldukça kolaydır. Teknik göstergeleri, çoklu zaman dilimi desteğini, SR kanallarını ve otomatik Fibonacci çizimini kullanarak analiz yapabilir, trendleri belirleyebilir ve ticaret sinyallerini değerlendirebilirsiniz. Bu da size daha iyi bir ticaret deneyimi sunar ve karlılığınızı artırabilir.
Alpha Cloud Algo'yu kullanmak için Tradingview'da bir hesap oluşturmanız ve Alpha Cloud Algo üyelik işlemini tamamlamanız gerekmektedir. Böylece herhangi bir cihazda, istediğiniz zaman ve herhangi bir yerde ticaret yapabilme özgürlüğüne sahip olursunuz.
Alpha Cloud Algo, güncel ve doğru piyasa verilerini kullanarak analizler yapar ve size en güncel ticaret fırsatlarını sunar. Ayrıca, kullanıcı dostu arayüzü sayesinde hızlı ve kolay bir şekilde istediğiniz analizi yapmanızı sağlar.
Alpha Cloud Algo ile teknik analizi bir adım öteye taşıyın ve daha başarılı ticaret kararları alın.

Ichi-Price WaveWelcome to the Ichi-Price Wave. This indicator is designed for day trading options contracts for any ticker, using a number of indicators — Ichimoku Cloud, Volume-Weighted Average Price, Stochastic Relative Strength Index, Exponential Moving Average (13/48) — and calculating how they interact with each other to provide entry and exit signals for both Calls and Puts on normal days. ****Read the Important Information section before opening any positions based on this indicator. (Also *NFA)
The general concept is that you, the trader, are a Surfer 🏄🏾 who rides the best waves in deep water until it gets dangerous.
Emoji storyline: The 🏄🏾 emoji (Call or Put, depending on the color of its Green or Red label, respectively) indicates an upcoming *potential* entry that, for a number of reasons, may be disregarded. (See: Important Information section below). And just as there are no certainties in the stock market itself, the tiered exit signals are ranked by low 🐬, medium 🦈 and high risk 🦑 tolerance. (In other words, it's relatively safe to surf with dolphins around, but there's the off chance they even strike trainers and become aggressive. It's more dangerous to swim with sharks. And on the unlikely, rare occasion you see a literal, giant, mythical, ship destroying Kraken 😬 ... you definitely need to get out of the water.
Surfing for as long as possible reaps the greatest rewards — but risk/reward are to be considered for entries and exits. Exiting every time you see a 🐬 (E1) should secure profits nearly 100% of the time, but they'll be very minimal. Whereas surfing til you reach a Kraken 🦑 (which will not even appear on most Price Wave cycles) would reap the most rewards. (NFA: I recommend considering sharks 🦈 as an exit point for the majority of positions, and perhaps only keeping a few runners open with the hopes of finding that shiny Kraken. (On the non-Emoji chart, the low, medium and high risk exits are named E1, E2 and E3, respectively. Got to the indicator's Settings > Inputs > then toggle EMOJIs ON/OFF)
Boring stuff: The entry 🏄🏾 signals are triggered by multiple conditions that must be all true. For Call entries, one of the necessary conditions is that the RSI's K must be maximum 10 (this can be changed in default). This, along with another condition where current price must be below the VWAP Lower Bound 1, serves as a great reference point showing the stock price is currently uncomfortable where it is and may likely soon snap back closer to the VWAP, perhaps even to the other side due to a pendulum effect.
Important information
Relying on those two factors for setting entry and exit points are great for normal days. (Normal, as in the ticker price bounces within a channel (e.g., ≤3% + or -) that's trending slightly bullish or bearish depending on greater market trend). But there are abnormal days where news catalysts (e.g., CPI data, CEO scandals, unexpected company data release, etc.) trigger FOMO and FUD, ultimately rendering the logic behind most indicators non applicable (e.g., RSI's "buy when oversold"). On the chart, this indicator accounts for this with two measures:
One, you should only "Surf" in the water. That is, there are two bands — Shallow and Deep Water. Any "Surf" emojis where price action is outside of the water should be ignored**. Two, there are additional EMOJIs that show you "Bearish trend" ⛈ and "Bullish trend ☀️. (Story time again: You obviously shouldn't surf in thunder and lightning. But also, surfing in the blistering sun with no clouds in the sky during a heatwave is also dangerous to your health.)
You can use these two measures to disregard the "surfers" suggesting you join them in opening a position in the suggested direction. And surfers followed by Cloud EMOJIs — 🌤️ (Put) or 🌧️ (Call) — can be used as "perfect entry" points. (The clouds represent weather being less extreme and better for surfing).
(**While these should mostly be ignored, these have not been muted because there is the possibility of a very strong turn around if you happen to catch the last one (which is not ideal for risk-averse traders). Use other indicators, such as the MACD and trend lines, to find potential bottoms (or tops) as price action plunges (or soars) due to abnormal news circumstances.)
Entry and exit buffers
At the beginning of each day, most indicators usually are not immediately calibrated correctly due to premarket trading and open market (at least to the degree that the day's sentiment can be best read from them due to the amount of volatility). What I recommend when using this indicator is disregarding signals during the first 15 minutes (or possibly 30 minutes) of market open to get the best results. And also, considering this indicator is meant for day trading (i.e., not holding positions overnight), disregarding ENTRY signals for the last 45 minutes of the trading day could give yourself enough buffer on the back end for exiting comfortably.
RSI entry
Preparing for an entry when you see a surfer is recommended, but actually opening the position when you see a 🌤️ (Put) or 🌧️ (Call) would yield best results and avoid misfires — particularly when those two cloud EMOJIs are signaled when the RSI is overbought and K is at least 95 (Puts), or oversold and K at maximum 5 (Calls). (Story time logic: The cloud eclipsing the Sun means it's cooling off and better for surfing. And the rain cloud no longer having lightning means the "bearish" storm is possibly soon over).
Delta and the Greeks
You should experiment yourself, but keep in mind that this is for capitalizing off of a day's minor price swings (≤3% + or -). Entering a same day expiry contract that's deep OTM is not going to work with this indicator (even if you enter at a surfer 🏄🏾 and exit at a Kraken 🦑) because the price wave from one end to the other won't be enough to compensate for the other Greeks working against you. Use another indicator (or insider knowledge ... Just kidding, that's illegal, don't do that) if you want to buy those kind of contracts.
I personally purchase contracts w/ minimum 80% Implied Volatility and somewhere between 20-40 Delta. Having a nice range for yourself with these factors, depending also on the size of your own portfolio and the risk tolerance you have, will determine how much you're able to capitalize off successful entry and exits.
Tips
• I set stop losses 5-10% depending on the ticker. (e.g., $TSLA's volatility may require SL closer to 10% whereas using it on $SPY, a 5% could suffice). This is in addition to ignoring entry signals that don't meet the aforementioned two requirements (i.e., it's risky to Surf in shallow water, and you shouldn't try to Surf at all outside of the water, ref. Band 2 and outside of Band 2). Remember, this is the stock market — not the casino. We rely on strategy and risk management — not hope.
• It's recommended you use time intervals ≤ 5 min. (I use 1 minute and 5 min)
• Liquidity . Using these signals on a ticker with low liquidity (particularly if you enter on the Ask side), can reduce your profits to 0% or even to a loss even if you have a perfect entry and exit. I always point to SPY as the optimal bid-ask spread, but keep that in mind.
What's with the name "Ichi-Price Wave"?
The "Ichi" gives credit to Japanese journalist Goichi Hosoda, whose indicator I used in conjunction with the 13/48 Exponential Moving Averages to create some of the exit signal conditions (e.g., E2🦈). That E2 condition is: Signal the first time the price intersects the Ichimoku conversion line *after* it has entered the VWAP UB/LB channel on one end and has exited on the opposite end). And it's named "Price Wave" because it's a literal price wave, which is where the fun surf narrative comes in. Also, "Price" doubles as me naming it after myself (in a less pretentious way). It's actually convenient that my last name is literally Price. Almost as if I was born for this. Nonetheless, this indicator is far more accurate in spotting directional changes than the free 13/48 cross, which oddly enough, influencers are charging for access. It's free, but the code is protected, for now at least.
Try it out on any ticker and look at how accurately it catches the tops and bottoms (keeping in mind to ignore misfires according to the two measures and also setting ~5-10% stop losses). And of course, use this in conjunction with other indicators. Ignoring all of my other emojis and simply setting surfer 🏄🏾 alerts could serve as additional confirmations for your personal strategy. Or you could simply enter at a surfer 🏄🏾 and exit when it reaches VWAP (or at least increase your Stop Loss to sell at break even if it doesn't reach). That strategy is the most conservative and would secure consistent gains). AND AGAIN, use your stop losses. Either it makes a move or it doesn't. Simply re-enter at a better point if necessary.

Playing the crossFor this script i used Kijun-sen from Ichimoku Cloud and Moving Average.
Kijun-sen is the base line of the Ichimoku Cloud or the midpoint price of the last 26 period.
Moving Average is a constantly updated average price of a given range.
In this script i used the standard Kijun-sen settings and the Moving Average, 55 length.
You will get an red or green signal when the lines cross each other.
Try the indicator yourself to see, why it could be useful.
A special thanks to @norok and @happyCloud1537 for teaching me!
This will lead to more scripts from my side, since i really like to code and trade.
Momentum CloudThis is a modified Ichimoku Cloud:
-The default Lookback-Length and Displacement settings have been modified to operate optimally on 24/7 markets - which is popular among Crypto analysts.
-The Lagging Span, Base Line, and Conversion Line have been removed - leaving just the bare cloud.
-Additionally, the Cloud's color will shift blue when it is compressed. (More specifically - when Leading Span A retreats to Leading Span B, the color changes.)
This allows the user to easily identify when the Cloud is "thinning", either to the upside, or the downside.
Being that the "spread" or "width" of an Ichimoku Cloud generally gauges it's efficacy as potential Support or Resistance, this tool is particularly useful for highlighting when momentum is weakening.
*This script will be updated in the future to allow the user to view the Momentum Cloud of alternate time-frames! (e.g, Viewing the 1D Momentum Cloud on the 1H timeframe)

1 Indicator to rule them allThe best combination indicator consisting of 4 SMA's, 4 EMA's, Donchian Channels, Parabolic SAR, Bollinger Bands, Ichimoku Cloud, a trend strength highlight for the bollinger bands background according to the ADX, labels on the chart to draw in when the Directional Index plus and minus cross, and a background highlight for low and high volatility according to the Historical Volatility Percentile.
The Indicators and placed and group intentionally, with the SMA and EMA's next to the Donchian Channels to draw in areas of support and resistance, with the parabolic SAR afterwards for confirmation on entries and exits.
Next are the Bollinger Bands and the Ichimoku cloud, which when used in combination by an experienced trader allows one to see the trend and spot any developing opportunities at a glance. These can be used in combination with the ADX background in the bolls to point out when trends start and end.
The Directional Indexes crossing implies a equilibrium point has been reached between the buy and selling pressure. Finally the background highlight according to low and high periods of volatility does well to ensure you're entering into the best trades at the best times.
These indicators used together in combo with momentum oscillators will lead to a full and complete picture of the trend and the most likely places for future price to come, allowing a holistic view and confluence between different, noncollinear indicators to paint occam's razor onto the charts.

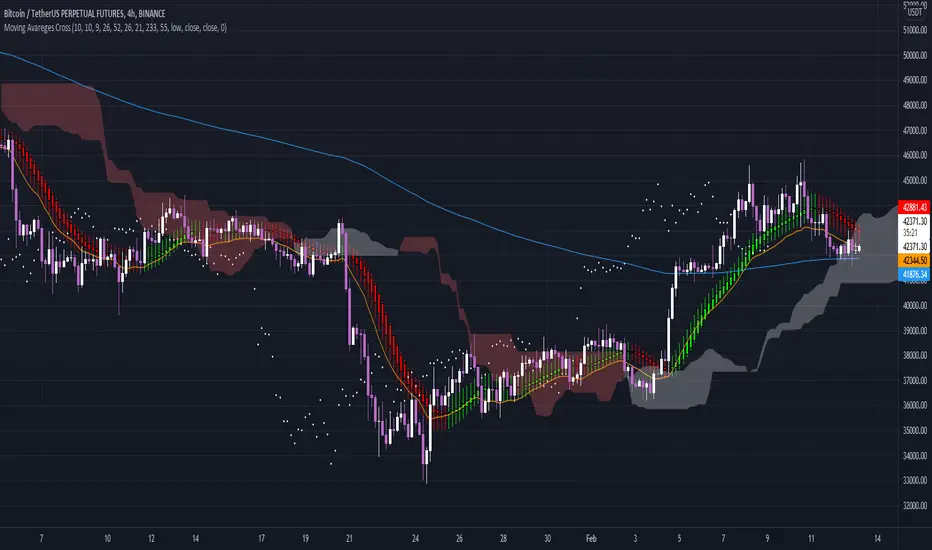
Moving Avareges CrossIn this script I have combined 3 indicators Ichimoku, Heiken Ashi and Moving Average Exponential.
In this strategy, you should first look for the current market trend in low time frames.
Then look at the higher time frames to decide if you are in the right place to enter the trade.
For example, in 1 minute time frame, we first look at whether the two averages 21 and 233 had a cross or not.
If the moving average of 21 crosses the moving average of 233 from the bottom up and the end of the line moves the moving average of 233 upwards, it can be concluded
The market trend in time frame has changed for 1 minute and is up.
Then we refer to the time frames of 3, 5 and 15 minutes and check the same conditions there.
If 3 of the 4 time frames have the same conditions, we use Heiken Ashi to check the strength of the wave that is formed.
And also by looking at Ichimoku we will see where this Kumo cloud formed this wave.
If these conditions are met, a serious decision can be made to enter the position.
Higher time frames such as 30 minutes or 1 hour and 4 hours can also be used to find important resistance and support pivots.
In this way, the average of 233 and 21 and the formation of the current candlestick give us an acceptable range for fluctuation.
Chikou Support and Resistance by TheSocialCryptoClubName: Chikou Supports and Resistances
Category: Indicator
Timeframe: Any Timeframe.
Description: Chikou Support and Resistance is an indicator which allows to represent on the chart the price structures identified by the cusps formed by the Ichimoku Kinko Hyo Chikou, Chikou is the line chart of close price projected in the past as per Kijun periods.
Suggested usage: Use on any timeframe. It is possible to calculate cusp only in a certain period and in a different time frame, and select those calculated by specific lines.
Technical Details: Internally it uses an Array to store the levels of when the Chikou bounces using the Zig-Zag indicator. At the last bar it prints the various lines on the screen.
Credits:
- Techniques has been explained by Corrado Rondelli in "Strategie di trading con l’indicatore Ichimoku Kinko Hyo"
- It is based on the Zig-Zag indicator of TradingView to calculate the Zig-Zag.

Kijun Trend IndicatorName: Kijun Trend Indicator
Category: Trend Analysis
Timeframe: All timeframes
Suggested usage: In a trending market, to understand when it is good to enter short (red line) and when to enter long (blue line).
Technical Analysis: The original idea was taken from Larry Williams: an uptrend is identified when the price is above an 18-period simple moving average (SMA) and when at least two candles do not touch the simple moving average with their lows. The opposite is true for a downtrend.
Corrado Rondelli has therefore reinterpreted with Ichimoku aka "ichimokized" replacing the 18-period Simple Moving Average with the 26-period Kijun - as per the original Ichimoku settings.
In order to make the indicator more flexible an Exponential Moving Average (EMA) has also been added.
The indicator plots the chosen line that becomes red when it is good to enter short and blue when it is good to enter long.
Configuration:
- Length: period to be used to calculate the line.
- Type: the line type that can be the Kijun (26-period) or SMA/EMA (18-period)
