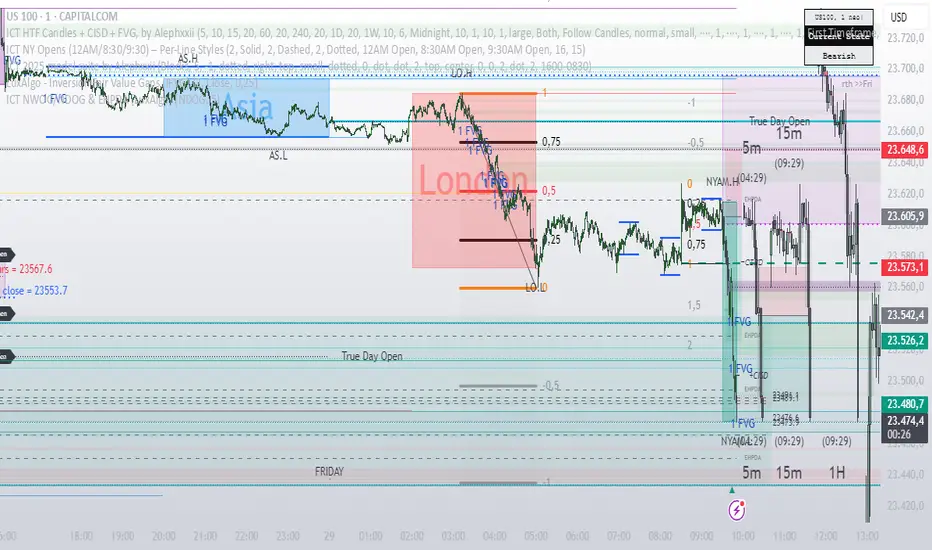
ICT HTF Candles + CISD + FVG, by AlephxxiiICT HTF Candles + CISD + FVG
A practical, friendly overlay for ICT-style trading
This indicator gives you three things at once—right on your chart:
HTF Candles Panel (context):
Compact candles from higher timeframes (e.g., 5m, 15m, 1H, 4H, 1D, 1W) appear to the right of price so you always see the higher-timeframe story without switching charts. It includes labels, remaining time for the current HTF candle, and optional open/high/low/close reference lines.
CISD Levels (bias flips):
Automatically plots +CISD and -CISD lines. When price closes above +CISD, the indicator considers bullish delivery. When price closes below -CISD, it considers bearish delivery. An on-chart table (optional) shows the current bias at a glance.
FVG (Fair Value Gaps):
Highlights inefficiency zones (gaps) on your current timeframe and/or a selected higher timeframe. You can choose to mark a gap “filled” when price hits the midpoint (optional).
Quick start (2 minutes)
Add to chart and keep your normal trading timeframe (e.g., 1–5m).
In settings → HTF 1..6, pick the higher timeframes you want to see (e.g., 5m, 15m, 1H, 4H, 1D, 1W).
Turn on FVG (current, HTF or both).
Watch +CISD / -CISD lines and the Current State table.
Close above +CISD → Bullish bias
Close below -CISD → Bearish bias
Trade with the bias and use FVGs as areas to refine entries or targets.
How to read it (the simple way)
Bias (CISD):
Bullish once price closes above the active +CISD level.
Bearish once price closes below the active -CISD level.
The small table (if enabled) says Bullish or Bearish right now.
HTF panel:
Shows higher-timeframe candles next to your current chart.
Labels show the timeframe (e.g., 1H) and a countdown for the current candle.
Optional traces draw HTF Open/High/Low/Close levels—great “magnets” for price.
FVGs:
Shaded boxes = potential inefficiency areas.
If Midpoint Fill is on, a touch of the midline counts as filled.
You can display current TF, HTF, or both.
Suggested workflow (popular ICT-style intraday)
Define bias with CISD
Only look for longs if Bullish, shorts if Bearish.
Check HTF context
Are you trading into a large HTF FVG or key HTF O/H/L/C level? That can be a target or a headwind.
Refine entries with FVGs
On your entry TF (1–5m), use fresh FVGs in the direction of the bias. Avoid fading straight into big HTF imbalances.
Key settings you’ll actually use
HTF 1..6: toggle each strip, select timeframe, and how many candles to show.
Style & layout: adjust offset, spacing, and width of the right-side panels.
Labels & timers: show/hide HTF name and remaining time; place labels at Top/Bottom/Both.
Custom daily open (NY): set the 1D candle to start at Midnight, 08:30, or 09:30 (America/New_York).
Trace lines: optional HTF O/H/L/C lines (style, width, anchor TF).
FVG module (extra): choose Current TF / HTF / Both, enable Midpoint Fill, auto-delete on fill, and show timeframe labels.
CISD lines: customize color, style (solid/dotted/dashed), thickness, and forward extension.
Table: enable/disable and choose its position.
Alerts
When a CISD completes, the script fires an alert (e.g., “Bullish CISD Formed” or “Bearish CISD Formed”).
Tip: Set your TradingView alert once on the indicator, then choose the alert message you want to receive.
Notes & limitations (read me)
“VI” label: The “Volume Imbalance” option marks price imbalances (body non-overlap). It does not read volume data.
Timezone: Daily logic and timers use America/New_York, which aligns with US indices/equities and common ICT practice.
Performance: This tool draws many boxes/lines/labels. If your chart feels heavy, reduce the number of HTFs or candles shown, or narrow panel width.
Repainting: HTF panels are designed to avoid future leakage; FVG logic follows standard 3-bar checks. As usual, wait for candle closes for confirmations.
Level cleanup: If Keep old CISD levels is OFF (default), the script keeps only the current active CISD to reduce clutter.
Cerca negli script per "ict"
ICT Macro Zone Boxes w/ Individual H/L Tracking v3.1ICT Macro Zones (Grey Box Version
This indicator dynamically highlights key intraday time-based macro sessions using a clean, minimalistic grey box overlay, helping traders align with institutional trading cycles. Inspired by ICT (Inner Circle Trader) concepts, it tracks real-time highs and lows for each session and optionally extends the zone box after the session ends — making it a precision tool for intraday setups, order flow analysis, and macro-level liquidity sweeps.
### 🔍 **What It Does**
- Plots **six predefined macro sessions** used in Smart Money Concepts:
- AM Macro (09:50–10:10)
- London Close (10:50–11:10)
- Lunch Macro (11:30–13:30)
- PM Macro (14:50–15:10)
- London SB (03:00–04:00)
- PM SB (15:00–16:00)
- Each zone:
- **Tracks high and low dynamically** throughout the session.
- **Draws a consistent grey shaded box** to visualize price boundaries.
- **Displays a label** at the first bar of the session (optional).
- **Optionally extends** the box to the right after the session closes.
### 🧠 **How It Works**
- Uses Pine Script arrays to define each session’s time window, label, and color.
- Detects session entry using `time()` within a New York timezone context.
- High/Low values are updated per bar inside the session window.
- Once a session ends, the box is optionally closed and fixed in place.
- All visual zones use a standardized grey tone for clarity and consistency across charts.
### 🛠️ **Settings**
- **Shade Zone High→Low:** Enable/disable the grey macro box.
- **Extend Box After Session:** Keep the zone visible after it ends.
- **Show Entry Label:** Display a label at the start of each session.
### 🎯 **Why This Script is Unique**
Unlike basic session markers or colored backgrounds, this tool:
- Focuses on **macro moments of liquidity and reversal**, not just open/close times.
- Uses **per-session logic** to individually track price behavior inside key time windows.
- Supports **real-time high/low tracking and clean zone drawing**, ideal for Smart Money and ICT-style strategies.
Perfect — based on your list, here's a **bundle-style description** that not only explains the function of each script but also shows how they **work together** in a Smart Money/ICT workflow. This kind of cross-script explanation is exactly what TradingView wants to see to justify closed-source mashups or interdependent tools.
---
📚 ICT SMC Toolkit — Script Integration Guide
This set of advanced Smart Money Concept (SMC) tools is designed for traders who follow ICT-based methodologies, combining liquidity theory, time-based precision, and engineered confluences for high-probability trades. Each indicator is optimized to work both independently and synergistically, forming a comprehensive trading framework.
---
First FVG Custom Time Range
**Purpose:**
Plots the **first Fair Value Gap (FVG)** that appears within a defined session (e.g., NY Kill Zone, Custom range). Includes optional retest alerts.
**Best Used With:**
- Use with **ICT Macro Zones (Grey Box Version)** to isolate FVGs during high-probability times like AM Macro or PM SB.
- Combine with **Liquidity Levels** to assess whether FVGs form near swing points or liquidity voids.
---
ICT SMC Liquidity Grabs and OB s
**Purpose:**
Detects **liquidity grabs** (stop hunts above/below swing highs/lows) and **bullish/bearish order blocks**. Includes optional Fibonacci OTE levels for sniper entries.
**Best Used With:**
- Use with **ICT Turtle Soup (Reversal)** for confirmation after a liquidity grab.
- Combine with **Macro Zones** to catch order blocks forming inside timed macro windows.
- Match with **Smart Swing Levels** to confirm structure breaks before entry.
ICT SMC Liquidity Levels (Smart Swing Lows)
**Purpose:**
Automatically marks swing highs/lows based on user-defined lookbacks. Tracks whether those levels have been breached or respected.
**Best Used With:**
- Combine with **Turtle Soup** to detect if a swing level was swept, then reversed.
- Use with **Liquidity Grabs** to confirm a grab occurred at a meaningful structural point.
- Align with **Macro Zones** to understand when liquidity events occur within macro session timing.
ICT Turtle Soup (Liquidity Reversal)
**Purpose:**
Implements the classic ICT Turtle Soup model. Looks for swing failure and quick reversals after a liquidity sweep — ideal for catching traps.
Best Used With:
- Confirm with **Liquidity Grabs + OBs** to identify institutional activity at the reversal point.
- Use **Liquidity Levels** to ensure the reversal is happening at valid previous swing highs/lows.
- Amplify probability when pattern appears during **Macro Zones** or near the **First FVG**.
ICT Turtle Soup Ultimate V2
**Purpose:**
An enhanced, multi-layer version of the Turtle Soup setup that includes built-in liquidity checks, OTE levels, structure validation, and customizable visual output.
**Best Used With:**
- Use as an **entry signal generator** when other indicators (e.g., OBs, liquidity grabs) are aligned.
- Pair with **Macro Zones** for high-precision timing.
- Combine with **First FVG** to anticipate price rebalancing before explosive moves.
---
## 🧠 Workflow Example:
1. **Start with Macro Zones** to focus only on institutional trading windows.
2. Look for **Liquidity Grabs or Swing Sweeps** around key highs/lows.
3. Check for a **Turtle Soup Reversal** or **Order Block Reaction** near that level.
4. Confirm confluence with a **Fair Value Gap**.
5. Execute using the **OTE level** from the Liquidity Grabs + OB script.
---
Let me know which script you want to publish first — I’ll tailor its **individual TradingView description** and flag its ideal **“Best Used With” partners** to help users see the value in your ecosystem.

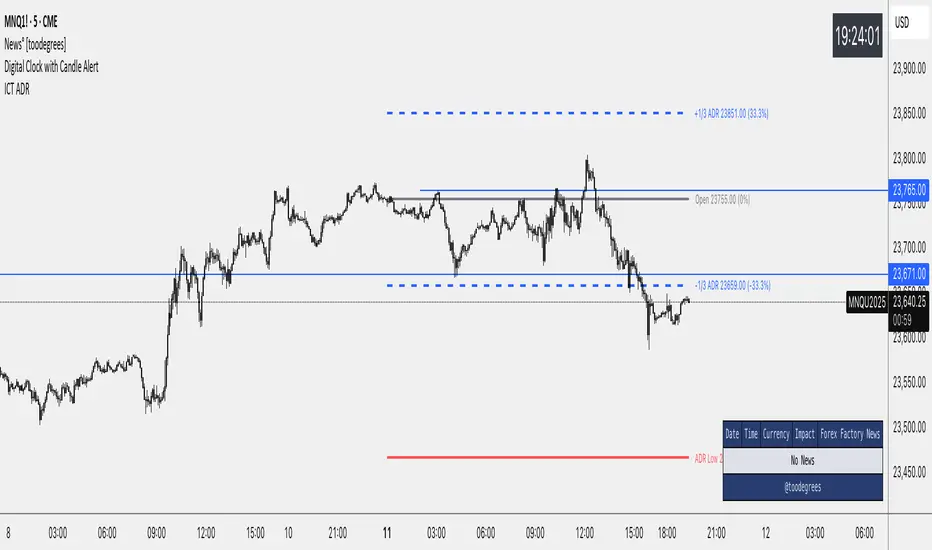
ICT Average Daily Range (ADR)📊 ICT Average Daily Range (ADR) Indicator
This indicator implements the Average Daily Range (ADR) concept taught by ICT (Inner Circle Trader). It calculates the average range of previous trading days and projects key levels for the current session, helping traders identify high-probability targets and reversal zones.
━━━━━━━━━━━━━━━━━━━━━━━━━━━━━━━━━━━━━━━━
✨ KEY FEATURES
- Accurate ADR Calculation - Uses only completed trading sessions (excludes current incomplete day)
- ICT Judas Swing Levels - Highlights the critical 1/3 ADR levels where institutional manipulation often occurs
- Two Calculation Modes - New York Midnight (ICT recommended) or Classic Daily
- Customizable Fractional Levels - 1/3, 2/3, 25%, 50%, 75% of ADR
- Smart Labels - Display price levels and percentage from open
- Flexible Visual Style - Separate line styles for different level groups
- Session Dividers - Optional vertical lines at session start
━━━━━━━━━━━━━━━━━━━━━━━━━━━━━━━━━━━━━━━━
📅 WEEKEND SESSION HANDLING
How Forex Sessions Work:
- Monday-Thursday: Full 24-hour sessions
- Friday: Partial session (00:00 to ~17:00 NY time)
- Sunday: Partial session (~17:00 NY to Monday 00:00)
- Saturday: No trading
Impact on ADR:
Both Friday and Sunday are partial sessions which can lower your ADR average. For example: Mon-Thu average 100 pips, Fri 70 pips, Sun 30 pips = 5-day ADR of 80 pips.
Other Markets:
- Crypto: 24/7 trading, no partial days
- Futures/Stocks: No Sunday session
━━━━━━━━━━━━━━━━━━━━━━━━━━━━━━━━━━━━━━━━
🎓 ICT CONCEPTS
Average Daily Range (ADR)
Statistical measure of average price movement per day. Acts as a "magnet" for price - markets tend to fulfill their ADR.
1/3 ADR Levels - "Judas Swing"
ICT's signature concept for identifying manipulation zones. Price often sweeps these levels to trap retail traders before reversing. High-probability reversal areas during London/NY sessions.
━━━━━━━━━━━━━━━━━━━━━━━━━━━━━━━━━━━━━━━━
⚙️ SETTINGS GUIDE
ADR Period: Number of days for calculation (default 5)
- Lower values = More responsive
- Higher values = Smoother levels
Calculation Mode:
- New York Midnight - ICT standard, best for Forex
- Classic Daily - Exchange timezone
Level Display:
- ADR High/Low - Primary targets
- 1/3 Levels - Judas Swing zones
- 2/3 Levels - Trending day targets
- Quarter Levels - 25% and 75%
- 50% Level - Mid-range
Visual Options:
- Separate line styles for each level group
- Customizable colors and width
- Optional labels with price/percentage
━━━━━━━━━━━━━━━━━━━━━━━━━━━━━━━━━━━━━━━━
💡 TRADING TIPS
1. Early Session: If price moves to 1/3 ADR quickly, watch for Judas Swing reversal
2. Mid Session: Use 2/3 levels as continuation targets in trending markets
3. Late Session: ADR completion often marks session extremes
4. Risk Management: Use fractional levels for scaling positions
5. Confluence: Combine with Fair Value Gaps, Order Blocks, and Liquidity Pools
Best Timeframes: 15m, 30m, 1H, 4H for intraday trading
━━━━━━━━━━━━━━━━━━━━━━━━━━━━━━━━━━━━━━━━
📝 NOTES
- Based on concepts taught by ICT (Inner Circle Trader)
- Requires at least 5 completed sessions for full accuracy
- ICT suggested using "New York Midnight" mode
- Weekend sessions handled based on actual market hours
- Be aware that Friday/Sunday partial sessions may lower ADR average
Created with focus on clean implementation and ICT's core teachings.
ICT Kill Zones [dR-Algo]ICT Kill Zones Indicator by dR-Algo
Introducing the dR-Algo's ICT Kill Zones Indicator – a tool meticulously crafted to blend with the elegance of the ICT Concept of Kill Zones. Built for traders who seek clarity and focus, this unique indicator is tailored to highlight the essential time frames while ensuring minimal distraction from the core price action.
Key Features:
Three Kill Zones:
London Kill Zone: Kickstart your trading day with the London Kill Zone, highlighting the critical period between 03:00 to 04:00 (UTC-4). The London session, known for its volatility due to the overlapping of the Asian session, is captured precisely for your benefit.
NY AM Session: As the European markets gear towards close and the US markets come alive, our indicator emphasizes the activity from 10:00 to 11:00 (UTC-4). It’s a window where significant market moves often originate.
NY PM Session: Capture the late-day trading action between 14:00 to 15:00 (UTC-4). As markets prepare to close, this time frame can offer last-minute opportunities.
Subtle Yet Effective Visualization: Unlike many other indicators that bombard traders with an array of colors, our ICT Kill Zones Indicator is intentionally designed to be subtle. It provides just the right amount of visual emphasis without overwhelming the chart. The primary goal is to let traders focus on what truly matters: the price action.
User-Friendly Customization: The indicator's settings can be easily tailored to align with individual trading styles, allowing traders to adjust and tweak as per their preference.
Seamless Integration with Trading View: Smoothly integrates with your TradingView charts ensuring optimal performance and real-time responsiveness.
Why Choose Our ICT Kill Zones Indicator?
The market is flooded with indicators, each promising to be the 'next big thing.' What sets dR-Algo's ICT Kill Zones Indicator apart is its dedication to simplicity and effectiveness. It's not just about adding an indicator to your chart; it's about adding value to your trading experience. By seamlessly merging vital time frames without overshadowing the price action, we ensure traders get the best of both worlds.
Join the trading revolution with dR-Algo and embrace a focused approach to the markets.

ICT Turtle Soup (Liquidity Reversal)ICT Turtle Soup — Liquidity Reversal Detection
Classic Liquidity Trap Reversal Strategy for Smart Money Traders
This indicator implements the ICT Turtle Soup concept — a classic liquidity-based reversal pattern — which occurs when price runs above or below a recent swing level to grab liquidity, then sharply reverses. This pattern is commonly used in Smart Money Concepts (SMC) and Inner Circle Trader (ICT) strategies to anticipate false breakouts and high-probability reversals.
🔍 What This Script Does:
Identifies Swing Highs & Lows
Detects recent swing highs and lows using a customizable lookback period.
Tracks Liquidity Grabs
A bearish Turtle Soup setup is triggered when price breaks above a recent swing high but closes back below it.
A bullish Turtle Soup setup is triggered when price breaks below a recent swing low but closes back above it.
These conditions often signal liquidity traps, where price sweeps resting orders before reversing.
Plots Signals Directly on the Chart
Turtle Soup setups are marked with 🐢🔻 (bearish) and 🐢🔺 (bullish) labels.
Optional full-text labels can also be displayed for clarity and journaling.
Includes Alert Conditions
Alerts can be enabled to notify you of bullish or bearish Turtle Soup reversals in real-time.
⚙️ Customization Features:
Adjustable swing lookback period
Enable/disable Turtle Soup labels
Set label font size
Choose your preferred bullish/bearish signal colors
💡 How to Use:
Add this script to your chart (ideally on intraday timeframes such as 5m–15m).
Wait for a Turtle Soup signal near a key swing high/low or liquidity zone.
Combine with other confirmation tools (e.g., FVGs, Order Blocks, OTE) for stronger setups.
Use alerts to stay ahead of fast-moving reversals.
🧠 Why It Works:
Turtle Soup setups are rooted in liquidity theory — they exploit the market’s tendency to sweep obvious swing levels before reversing. These moves often trap retail traders and mark the beginning of Smart Money entries.
🔗 Best Used With:
Maximize the edge by combining this with other SMC tools:
✅ First FVG — Opening Range Fair Value Gap Detector
✅ ICT SMC Liquidity Grabs + OB + Fibonacci OTE Levels
✅ Liquidity Levels — Smart Swing Lows
Together, they create a complete ecosystem for identifying, confirming, and executing liquidity-driven trade setups with precision.

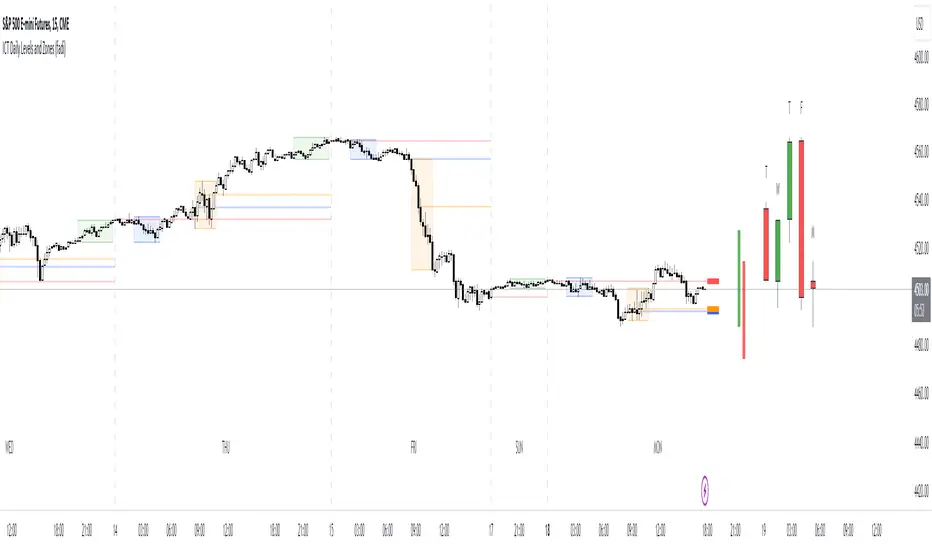
ICT Daily Levels and Zones (fadi)ICT Daily Levels and Zones indicator provides some of the relevant zones and levels for ICT type analysis. The purpose of this indicator is to provide consolidated way of automatically highlighting and identifying relevant levels for ICT type traders.
Daily Separator and Day of Week
Display a separator based on NY Midnight and day of week.
Killzones
Highlight ICT Asia, London, and NY killzones. Please note that the default times are based on Index Futures. Update the times of day if you plan on using it for other instruments such as Forex.
Open Range
The 9:30am to 10:00am open range
(Shown with Extend setting on)
Open Range Gap
The open range Gap is the difference between the 4:15pm close and the 9:30am open.
(Shown with Extend setting on)
Time of Day Levels
The Midnight, 8:30am, and 9:30am open levels.
Daily Midnight Candle
ICT style Daily candle formation based on Midnight open
ICT Confirmed FVG Indicator ICT FVG Indicator (Confirmed by Swings)
Summary
This indicator is designed to identify high-probability Fair Value Gaps (FVGs) by confirming them with market structure. It filters out random imbalances and only highlights the FVGs that are created at the same time as a confirmed ICT Swing High or Swing Low.
The core principle is to connect price imbalances directly to significant shifts in market structure, providing a cleaner and more powerful signal.
What It Does
Identifies Swing Points: Automatically detects and draws confirmed swing highs (resistance) and swing lows (support) on your chart based on the settings you choose.
Finds Fair Value Gaps: It scans the chart for the classic 3-candle FVG pattern (also known as a BISI or SIBI).
Confirms FVGs with Swings: This is the most important feature. The indicator will only draw an FVG box if one of the three candles that created the FVG is also a confirmed swing point. This ensures you are only seeing imbalances that are directly related to a break in market structure.
Invalidates Old FVGs: To keep the chart clean, the indicator will automatically remove an FVG box after the price has fully passed through it a certain number of times (customizable in the settings).
Settings Explained
ICT Swings Settings
Left/Right Strength: Controls the sensitivity of the swing detection. Higher numbers require a more significant, obvious swing point to be confirmed. Lower numbers will identify more minor swings.
Max Swing Lines: Sets the maximum number of swing high and swing low lines to display on the chart at one time.
Swing High/Low Color: Customize the color of the swing point lines.
FVG Settings
Show Bullish/Bearish FVG: Use these checkboxes to turn the bullish (green) or bearish (red) FVG boxes on or off.
Bullish/Bearish FVG Color: Customize the color of the FVG boxes.
FVG Invalidation Threshold: This sets how many times the price can fully close on the other side of an FVG before the box is automatically removed.
Max Active FVGs to Show: Sets the maximum number of FVG boxes to keep on the chart to prevent clutter.
Key Features
High-Probability Signals: Filters out noise by focusing only on FVGs that are confirmed by a shift in market structure.
Clean Visuals: Automatically draws and removes swing lines and FVG boxes to keep your chart uncluttered.
Fully Customizable: Adjust the sensitivity of the swing detection and the appearance of the FVGs to fit your trading style.
Pure ICT Concepts: Built strictly on the principles of Inner Circle Trader for a method-consistent analysis.

ICT Professional Accumulation DistributionICT Professional Accumulation Distribution (ICT AD) provides a x-ray view into market accumulation and distribution. You can literally see the institutions at work.
The indicator consists of two cumulative lines derived from:
Cumulative change from open to close
Cumulative change from previous close to new open
By overlaying these two cumulative lines, you can detect real meaningful divergence that is narrative based not mathematically derived. You're seeing the real works of algorithms in play working in this area.
These divergences are only useful at extremes (topping or bottoming formations), not while trending. It will probably confirm your suspicion about making a important high or low.
This works on all timeframes but is most impactful on the daily.
How to use:
Method 1:
Enable the option for "Show Open vs Close."
Calculate the shift by subtracting the "Open vs Close" line value from the ICT Accumulation/Distribution (AD) line value.
Look for divergences between the two cumulative lines.
Method 2:
Switch the chart's display mode to "Line View" (representing the Open vs Close).
look for divergences between the line chart and the ICT AD line.

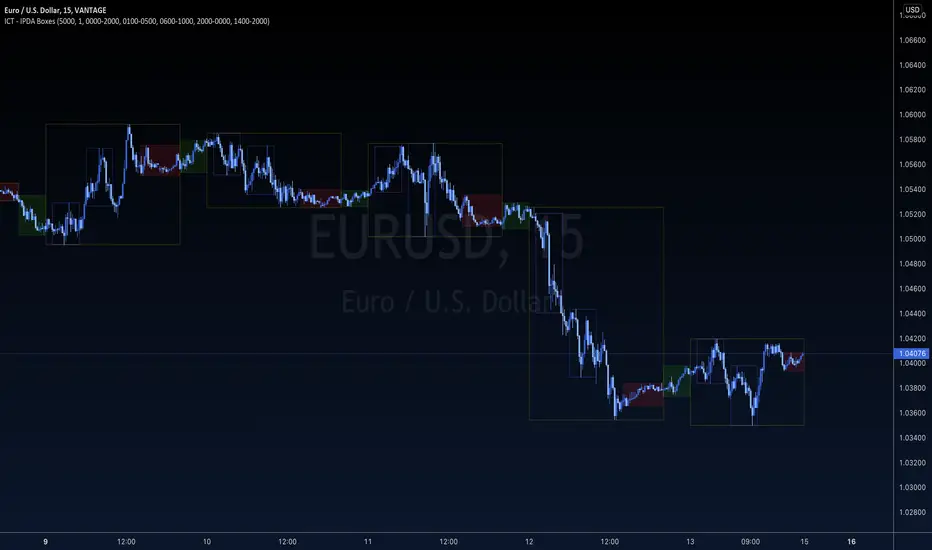
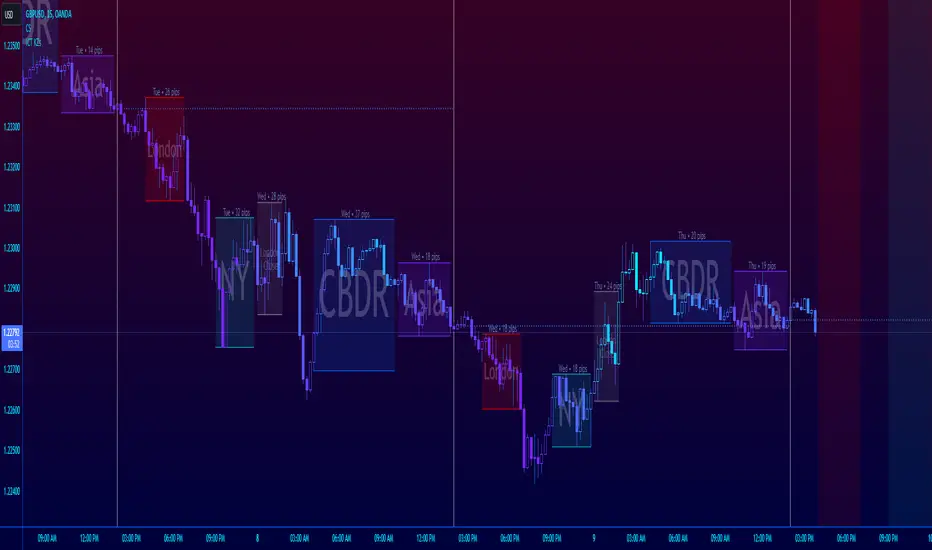
ICT - IPDA BoxesICT - IPDA Boxes indicator encapsulate important (TRUE DAY) time zones based on ICT concepts.
Standard settings will plot True Day, CBDR, Asian Range, London and NY Open Kill-Zones. It is designed to keep a minimalistic and clean look for your charts using TradingView's Dark theme, but you can adjust any specific line or background color transparency of your choice. If you want to add other session (like NY close for example), just paste again the indicator to your chart and set the correct session duration and colors of your preference. You can log, study, backtest and use it for your analysis if you are familiar with ICT concepts.
Check indicator time lines and adjust session times for your own TradingView's personal settings it before using.
ANY fault, bug or mismatch in this script is only mine and I will be glad to correct it if you let me know.
The ownership of all this concepts belongs to ICT - Michael Huddleston and it is published with his permission.
ICT Concept MTF Scanner [Elykia]ICT Concept MTF Scanner
Overview
The ICT Concept MTF Scanner is the ultimate productivity dashboard for traders using SMC (Smart Money Concepts) and ICT methodologies.
Stop switching tabs constantly. This indicator allows you to monitor the market structure (Trend, BOS, CHoCH) of 20 different assets simultaneously, each with its own custom timeframe.
It also overlays the structural points and Premium/Discount zones directly on your current chart.
Key Features:
📊 Multi-Asset Dashboard: Monitor up to 20 symbols (Indices, Forex, Crypto, Metals) in a single, fully customizable table.
clock: Individual Timeframes: Unlike standard screeners, you can set a different timeframe for each ticker (e.g., NQ on 15m, ES on 1h, DXY on 4h).
🧠 Auto-Structure Detection:
BOS (Break of Structure): Trend continuation.
CHoCH (Change of Character): Trend reversal signal.
SMS (Shift in Market Structure): Failure swing.
⚖️ Premium & Discount Zones: Automatically calculates buying (Discount) and selling (Premium) zones based on the Active or Previous range.
🔔 Smart Alerts: Get notified on structural changes or when price enters a Premium/Discount zone.
How to use:
1. Ticker Setup: In the settings, select your favorite assets and assign the specific timeframe you want to monitor for each.
2. Sensitivity (Structure): Adjust the "Period" (Pivot Length). A lower value (e.g., 3-5) detects minor structure, while a higher value (e.g., 10-20) reveals the macro trend.
3. Reading the Table:
Teal: Bullish Structure.
Red: Bearish Structure.
Signal: Shows the most recent structural event (BOS or CHoCH).
Disclaimer :
This indicator is for educational and informational purposes only. Past performance does not guarantee future results. Trade at your own risk.

ICT Structure Levels (ST/IT/LT) - v7 (by Jonas E)ICT Structure Levels (ST/IT/LT) – Neighbor-Wick Pivots
This indicator is designed for traders following ICT-style market structure analysis. It identifies Short-Term (ST), Intermediary (IT), and Long-Term (LT) swing highs and lows, but with a stricter filter that reduces false signals.
Unlike standard pivot indicators, this script requires not only that a bar makes a structural high/low, but also that the neighboring bars’ extremes are formed by wicks rather than flat-bodied candles. This wick condition helps confirm that the level is a true liquidity sweep and not just random price action.
How it works (conceptual):
Detects pivots based on user-defined left/right bars.
Validates that extremes on both sides of the pivot are wick-driven (high > body for highs, low < body for lows).
Marks valid STH/STL, ITH/ITL, and LTH/LTL directly on the chart with optional price labels.
Uses ATR offset for better label readability.
Alerts can be enabled to notify when a new structural level is confirmed.
How to use it:
Map market structure across multiple layers (ST/IT/LT).
Identify true liquidity grabs and avoid false highs/lows.
Integrate with Break of Structure (BOS) and Change of Character (CHoCH) strategies.
Combine with other ICT concepts (Order Blocks, Fair Value Gaps, Liquidity Pools).
What makes it unique:
Most pivot indicators mark every high/low indiscriminately. This script filters pivots using wick validation, which significantly reduces noise and focuses only on the levels most relevant to liquidity-based trading strategies.

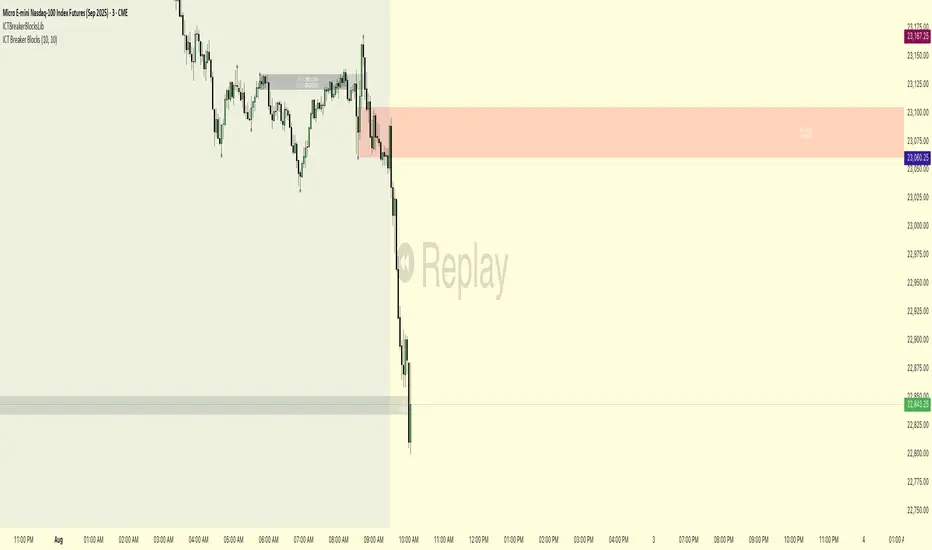
ICT Breaker BlocksICT Breaker Block Detector
This indicator automatically identifies and displays high-probability ICT (Inner Circle Trader) Breaker Blocks on your chart. It is designed to help traders spot key shifts in market structure where price is likely to react.
What It Does
The indicator's primary function is to find and draw both Bullish and Bearish Breaker Blocks. These are specific price action patterns that signal a potential reversal after a liquidity sweep.
Bullish Breaker Block (Green): Forms after a low is swept (creating a lower low) and the market structure shifts by breaking above the intermediate swing high. This broken swing high becomes the Bullish Breaker.
Bearish Breaker Block (Red): Forms after a high is swept (creating a higher high) and the market structure shifts by breaking below the intermediate swing low. This broken swing low becomes the Bearish Breaker.
Invalidation: The indicator also tracks these zones in real-time. If price trades completely through a breaker block, the zone is considered invalidated. It will stop extending, its color will change to gray, and an exclamation mark ! will be added to its label.
How It Functions
The script's logic is designed to precisely identify the ICT breaker pattern:
Liquidity Sweep: It first identifies a sequence where a recent swing high is taken out by a higher high (for a bearish setup) or a swing low is taken out by a lower low (for a bullish setup).
Market Structure Shift (MSS): After the sweep, it waits for a clear break in market structure. This occurs when price closes below the intermediate swing low (for a bearish breaker) or above the intermediate swing high (for a bullish breaker).
Drawing the Zone: Once the MSS is confirmed, the indicator draws a box around the range of the swing point that was broken. This box is the Breaker Block, which is then extended into the future to serve as a potential area of interest.
How to Use This Indicator
Settings
Pivot Lookback: This setting determines the sensitivity of the swing point detection. A higher number will identify larger, more significant market structure and result in fewer, but potentially stronger, breaker blocks. A lower number will identify smaller, more immediate patterns.
Color & Display Options: You can customize the colors for the bullish, bearish, and invalidated zones, as well as toggle the visibility of each type of breaker.
Trading Application
Traders can use these automatically drawn zones as high-probability Points of Interest (POI). The common application is to wait for price to return to the breaker block after it has formed. This retest can offer a potential entry opportunity in the direction of the market structure shift.
For a Bullish Breaker, a trader might look for a long entry when the price dips back into the green zone.
For a Bearish Breaker, a trader might look for a short entry when the price rallies back up into the red zone.
Disclaimer: This indicator is a tool to assist in technical analysis. It is not a standalone trading system and does not provide financial advice. Always use proper risk management and combine this tool with your own analysis and trading strategy.
ICT Turtle Soup (Liquidity Reversal)ICT Turtle Soup — Liquidity Reversal Detection
Trap the Trap: A Precision Reversal Strategy from the Inner Circle Trader Playbook
This indicator implements the Turtle Soup liquidity reversal setup — a widely used ICT (Inner Circle Trader) concept that targets false breakouts beyond recent swing highs or lows. These patterns typically occur when price grabs liquidity above or below a known level, then snaps back, trapping retail traders and creating a high-probability reversal scenario.
🔍 What This Script Does:
Detects Liquidity Sweeps Above/Below Key Swing Levels
Uses a customizable swing lookback to identify recent swing highs and lows.
Triggers a Bearish Turtle Soup when price runs above a previous swing high and closes back below.
Triggers a Bullish Turtle Soup when price sweeps below a prior swing low and closes back above.
Plots Clear Visual Signals
Reversal signals appear as 🐢🔻 (Bearish) or 🐢🔺 (Bullish) markers directly on your chart.
Optional labels can be enabled for enhanced journaling and review.
Real-Time Alerts
Receive alert notifications when a Turtle Soup setup is detected — ideal for scalpers or intraday traders watching for reversals around liquidity pools.
⚙️ Customization Options:
Set the swing lookback sensitivity (default: 5)
Enable or disable labels
Choose label font size
Customize colors for bullish and bearish signals
💡 How to Use:
Deploy on intraday timeframes (e.g. 5m–15m) for high-resolution liquidity analysis.
Watch for signals at key highs/lows, session extremes, or zones where liquidity is likely resting.
Combine with tools like FVGs, Order Blocks, and OTE zones for layered confirmation.
🔗 Combine With These Tools for a Complete SMC Edge:
✅ First FVG — Opening Range Fair Value Gap Detector
✅ ICT SMC Liquidity Grabs + OB + Fibonacci OTE Levels
✅ Liquidity Levels — Smart Swing Lows
Together, these tools form a high-precision Smart Money toolkit — helping traders map, anticipate, and act on institutional-level liquidity events with clarity and confidence.

ICT SMC Liquidity Grabs and OBsICT SMC Liquidity Grabs + OB + Fibonacci OTE Levels
Smart Money Concepts Trading Assistant
This script is built for traders who follow ICT (Inner Circle Trader) and Smart Money Concepts. It intelligently combines three critical components of SMC trading: Liquidity Grabs, Order Blocks, and Fibonacci-based Optimal Trade Entry (OTE) zones — giving traders visual cues for potential high-probability reversals and entry points.
🔍 What This Script Does:
Detects Liquidity Grabs
Identifies swing highs/lows where price sweeps liquidity, then immediately reverses.
Labels them with orange markers when price takes out previous highs/lows but closes back inside.
Draws Order Blocks
After a liquidity grab, the script looks for strong bullish or bearish candles and automatically highlights the OB zone.
These OB zones are visualized with transparent colored boxes extending several bars forward.
Plots Fibonacci OTE Levels
Uses recent swing high/low pivots to dynamically draw customizable OTE retracement levels (e.g., 62% and 75%) for both long and short setups.
Highlights Optimal Entry Zones
Marks valid OTE-based buy/sell opportunities only when:
Liquidity has been taken,
Price enters the OTE zone,
And a strong confirming candle appears.
Adds visual zones, trade labels, and optional alerts for each qualified entry.
Includes Take Profit Targets
Automatically calculates take-profit levels based on previous structure and risk-reward ratios.
TP1 is the previous swing, and TP2 is an extended R-multiple (customizable by user).
⚙️ Customization Options:
Toggle each feature (Liquidity Grabs, OBs, Fibonacci Levels)
Adjust Fibonacci levels (default: 62% and 75%)
Set lookback period for liquidity checks
Customize the R-multiple for TP2 levels
💡 How to Use:
Enable desired features from the input panel.
Watch for Buy/Sell OTE zones highlighted in green/red.
Confirm with liquidity sweep and OB support for stronger signals.
Use the automatically generated TP levels to manage risk.
🚀 What Makes It Unique:
Unlike other open-source mashups, this script synchronizes multiple SMC concepts into a single tool that:
Waits for high-confidence conditions (not just blind fib or OB detection)
Validates entries using multiple confluences
Visually marks actionable setups
Automates trade management zones
Whether you're trend-trading, scalping, or swing trading ICT-style, this tool offers a streamlined, smart-money-aligned workflow directly on your chart.

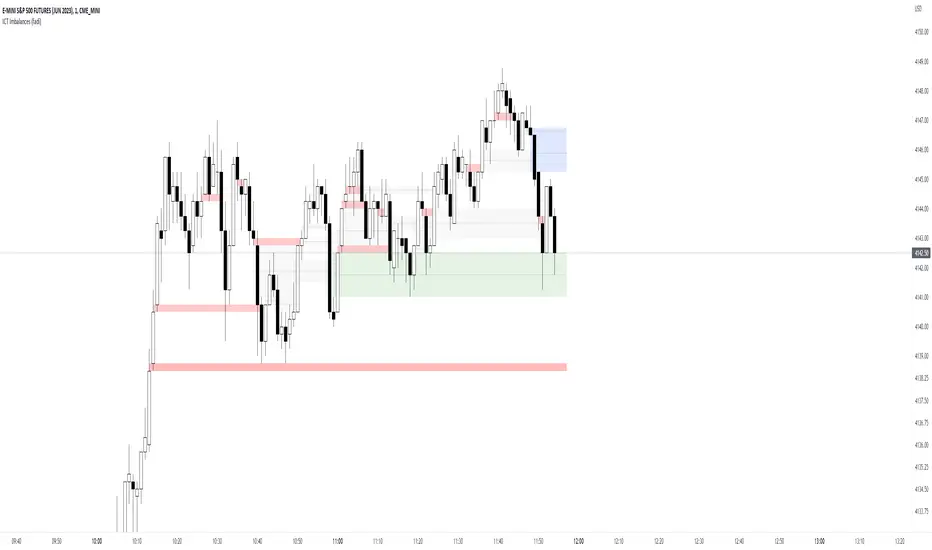
ICT Imbalances (fadi)ICT Imbalances focuses on highlighting the imbalances described by ICT Se imbalances usually act as a price magnet where price tend to revisit to mitigate the imbalance and can act as support and resistance.
It is important to understand that, while they do act as price magnet, they are not all places for entries. What they do provide, is a price understanding and possible areas of reversal based on the bigger picture and trading strategy.
There are four types of imbalances covered by this indicator:
Fair Value Gap (FVG)
Fair value is when, at any given price, both buy and sell sides are offered. For every up move, there is a down move. Fair value Gap is an imbalance where price moved too quickly before offering both buy side and sell side at a given price.
Implied Fair Value Gap (IFVG)
Implied Fair Value Gap is when the first and third candle have overlapping large wicks. The IFVG is the area between the half point of first and third candles.
Volume Imbalance (V.I.)
Volume imbalance is when the price creates a gap between the close of one candle and the open of the following candle with overlapping wicks.
Gap
An area where price gaps up or down leaving a void where price did not trade in. This is most common on higher timeframes and when one day ends and the next day begins.
Settings
ICT Imbalances provides the following options
- Show or hide specific imbalance to keep the chart clean
- Background color of the box highlighting the imbalance
- Box width in the form of how many candles the box extends to
- Show or Hide the Half Mark of the box, only applies to FVG and IFVG
- Show or hide a Legend that explains which colors represents which imbalance
ICT Session Killzone Boxes & DeviationsICT Killzone Sessions Boxes & Deviations is a convenience indicator that marks out past and future ICT killzones for Asia, London, and New York, London Close and CBDR.
The boxes highlights the highest and lowest candle opens of that session/killzone, which is what the deviations are based on. Two lines mark out the highest high and lowest low of that session.
This indicator also includes New York midnight opening price and a vertical divider showing you that time.
Future killzones are also marked out.
All times are set to GMT-4 so these boxes should work across most exchanges. Times and code can be changed if a few don't match up.
Included are week of day labels for your convenience.
For those who are unfamiliar, ICT Killzones are optimal times to look for trades during or before a session, often providing entry for trades with orderblock tests, FVG fills or stophunts.
Please note: This indicator only works well on 1HR timeframe and below. The default max timeframe setting is set to 15min, which can be changed in the menu.
There may be some bugs so please highlight anything you find in the comments below :)
Shout out to @Ryazn for all the ideas!
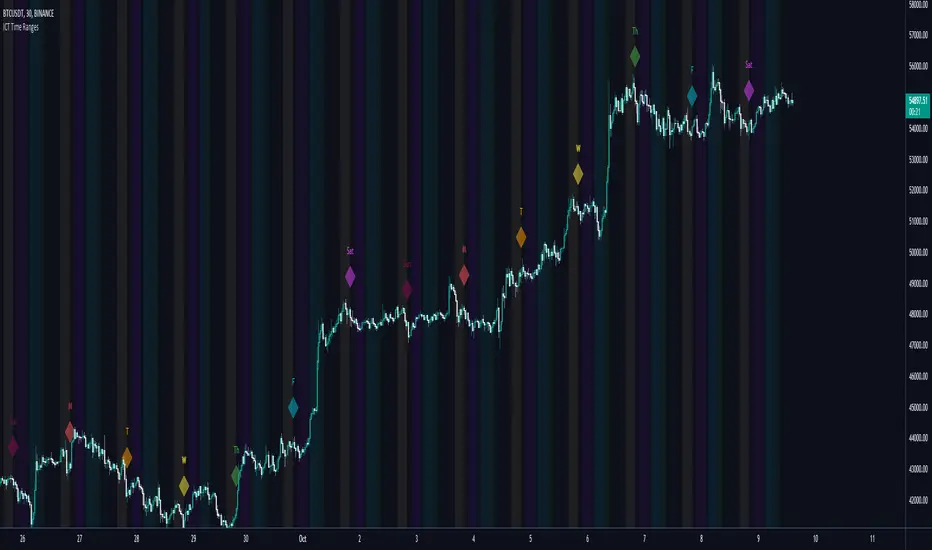
ICT Time RangesICT Time Ranges is a concept around the fact that price likes to show volatility spikes in certain times of the day.
Although there are many other scripts such as that revolve around this concept, the difference between this one and some of the others out there is the fact that this code specifically focuses on the ranges like New York, London, Asia, and ICTs concept behind having a "True Day Range". Also, prior scripts draw horizontal lines to delineate the High and Low of the Day. Although this is useful in some cases, I find it to clutter up the chart too much for my liking, so this script negates any of that and simply prints a box in the parameters given within the settings pop-up. This also allows you the fact of having a shape and letter(s) marker for when a new day starts at 0:00.
With this script, you can enable / disable times of the day for:
- London Session
- New York Session
- London Close Session
- Asia Session
- "IPDA" True Day
You can also change the times that these sessions will update to, along with the opacity and color that they print to mark out these times / ranges. The same can be said with the "Day of Week" markers, which can be color coded and show different shapes / formats to your liking.
I find that putting the Session boxes opacity to 7-8% and the day of week markers to 20% is best as this makes them visible enough to see while also keeping it easy on your eyes to analyze your charts.
Overall, this script was based around specific concepts I liked from other individuals' scripts such as @BryceWH and @AvniPiro , but that are tweaked to what I personally find as most beneficial. To see others scripts like this one, you can search for "ICT Killzones" in the public script library!
ICT Daily Levels & Liquidity Zones [HatefBW]ICT Daily Levels & Liquidity Zones
This indicator automatically detects and plots the daily high and low levels for the current day and the two previous days.
Each level dynamically tracks the exact candle that created it, allowing traders to identify where short-term liquidity pools form across multiple timeframes.
What makes this tool unique:
• Three-day structure: Displays current, previous, and 2-day-old highs/lows for contextual price action.
• Dynamic mapping: On lower timeframes, each level aligns precisely with the candle that created the daily high or low.
• Full customization: Traders can toggle each day’s levels, colors, label size, and extension behavior independently.
• Adaptive logic: Lines automatically extend or stay fixed depending on the chosen setting, avoiding chart clutter.
This tool helps ICT traders and smart money practitioners visualize daily liquidity zones — potential areas of stop hunts or institutional targeting.
The script is originally coded by @HatefBW from scratch, with no reused or modified open-source code

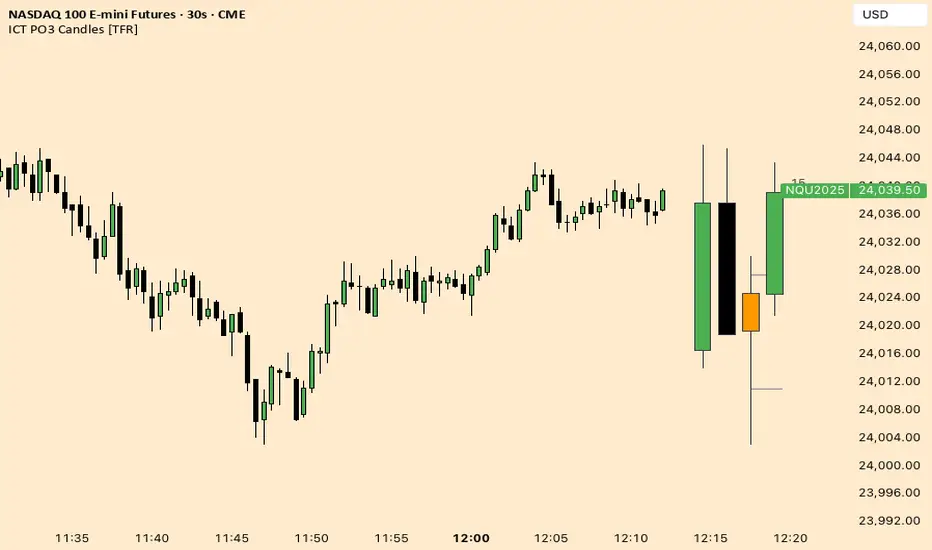
ICT Fractal HTF Candles [TFR]ICT HTF Fractal Candles
This indicator overlays higher timeframe (HTF) candles directly on your current chart for better multi-timeframe analysis. It plots up to the last 4 candles from a user-selected timeframe (5m, 15m, 1h, 4h, or 1D) with customizable body and border colors.
Features:
Displays the last 4 higher timeframe candles (open, high, low, close) on your current chart.
Customizable bullish, bearish, and inside close candle colors.
Optional midpoint wick lines (top and bottom) for precision reference, with extendable length for clarity.
Optional candle midpoint line for additional confluence.
Overlay mode allows you to see HTF structure without switching chart timeframes.
Timeframe label display so you always know which HTF is being plotted.
Offset control for shifting candle position.
Use Case:
This tool helps traders apply ICT concepts like PO3, midpoint reference levels, and multi-timeframe confirmation without constantly switching between charts. It’s particularly useful for identifying liquidity zones, midpoint reactions, and higher timeframe market structure while executing on a lower timeframe.
ICT NY Opening Price Lines (12AM/8:30AM/9:30AM) ICT NY Opens (12AM / 8:30AM / 9:30AM)
This indicator plots three key New York session reference levels used by ICT traders and intraday scalpers: the Midnight Open (12:00 AM EST), the 8:30 AM EST level , and the 9:30 AM EST RTH open. Each line is drawn at that day’s opening price for the specified time and extends horizontally to 4:15 PM true daily close so you always have clean, fixed anchors for the entire trading day.
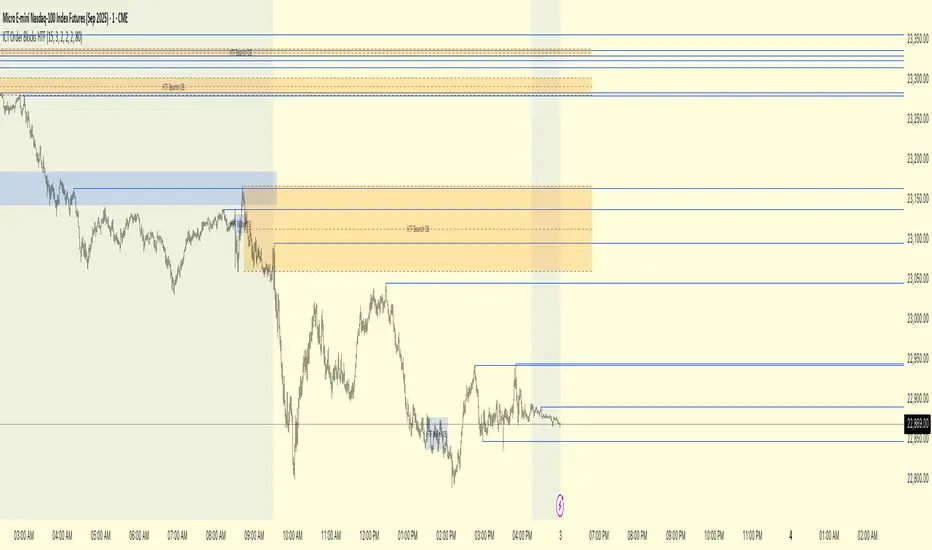
ICT Order Blocks HTFICT Order Blocks HTF (with Parent Swing Confirmation)
This indicator is a powerful tool designed to identify high-probability Higher-Timeframe (HTF) Order Blocks by confirming them with significant liquidity sweeps on your trading chart. It combines two core ICT (Inner Circle Trader) concepts to filter out noise and highlight only the most sensitive areas.
The Core Concept: A High-Probability Model
The most powerful trading setups often occur when a significant event on a lower timeframe happens at a key area on a higher timeframe. This indicator automates that analysis by looking for a specific confluence:
A Liquidity Sweep (LTF): First, it identifies a "Parent Swing" on your current chart. This is a significant swing high (BSL - Buy Side Liquidity) or swing low (SSL - Sell Side Liquidity) that has been validated by a market structure shift. These are the key liquidity pools the market targets.
An Order Block (HTF): Separately, it looks at a higher timeframe of your choice (e.g., 15m, 1H) to find institutional order blocks—the last up or down candle before a strong move.
The Confluence: The magic happens here. The indicator will only draw an HTF order block on your chart if it forms at the exact moment the price is interacting with one of the BSL or SSL liquidity pools from your current chart.
This dual confirmation provides a refined, high-probability signal, indicating that a major liquidity event is fueling a reaction from a significant HTF level.
What the Indicator Does
Identifies Parent Swings: In the background, it constantly tracks and identifies BSL (red lines) and SSL (green lines) on your chart.
Finds HTF Order Blocks: It looks for bullish (last down-candle) and bearish (last up-candle) order blocks on the higher timeframe you select.
Draws Confirmed Zones: It draws a Bullish OB (Blue Box) only when an HTF bullish order block forms at an SSL level. It draws a Bearish OB (Orange Box) only when an HTF bearish order block forms at a BSL level.
Marks Key Levels: Each order block is automatically drawn with dashed lines marking its high, low, and midpoint (50% level) for precise entry and risk management.
Real-Time Invalidation: The order blocks extend into the future and are tracked in real-time. If price closes through a block a specified number of times, the zone is considered invalid and will be dimmed, keeping your chart clean.
How to Use This Indicator
The primary use for this indicator is to identify high-probability entry zones.
When a Bullish Order Block (Blue) appears, it signals a potential area of demand where you might look for long entries.
When a Bearish Order Block (Orange) appears, it signals a potential area of supply where you might look for short entries.
The internal lines (high, low, midpoint) can be used for more precise entries or for setting stop-loss levels.
Settings
Higher Timeframe for Order Blocks: Choose the HTF you want the indicator to analyze for order blocks (e.g., 15m, 1H, 4H).
OB Invalidation Threshold: Set how many times price must close fully through an order block before it is considered invalid.
Parent Swing Settings: You can adjust the lookback periods and invalidation threshold for the BSL/SSL detection to match your trading style. A larger lookback will find more significant liquidity pools.
Disclaimer: This indicator is a tool to assist in technical analysis. It is not a standalone trading system and does not provide financial advice. Always use proper risk management and combine this tool with your own analysis and trading strategy.
ICT SMC Liquidity Grabs and OBsICT SMC Liquidity Grabs + Order Blocks + Fibonacci OTE Levels
A High-Probability Entry Engine for Smart Money Concept Traders
This script combines three powerful Smart Money Concepts (SMC) into a single tool: Liquidity Grabs, Order Block Zones, and Fibonacci OTE Levels, allowing traders to identify institutional entry models with clean, rule-based visual signals.
It’s designed to simplify SMC trading by highlighting confluence zones where price is likely to reverse or continue — with clear visual zones, entry arrows, and take profit projections.
🔍 What This Script Does:
Detects Liquidity Grabs
Identifies when price sweeps above/below the highest high or lowest low within a user-defined lookback period and closes back inside.
Plots orange labels on the chart to signal potential liquidity events (LG-H / LG-L).
Plots Order Blocks After Liquidity Grabs
After a liquidity grab, the script looks for displacement candles (strong bullish or bearish moves) and draws highlighted OB zones extending several bars to the right.
These zones represent potential institutional footprints for price reversals.
Draws Fibonacci OTE Levels (Optimal Trade Entry)
Uses recent swing high and low pivots to automatically calculate OTE zones (default: 62% and 75% retracement levels).
Draws these retracement zones for both bullish and bearish setups.
Marks Valid OTE Entry Zones
Buy/Sell zones only trigger when:
A liquidity grab occurs,
Price enters the OTE zone,
And a strong confirming candle is present.
Plots green/red arrows for valid buy/sell OTE entries.
Auto-Draws Take Profit Zones
TP1 = Previous swing high/low
TP2 = Risk-based R-multiplied extension (e.g., 1.5R — customizable)
Alerts
Triggers alerts when valid buy or sell OTE setups are detected.
⚙️ Customization Features:
Toggle each feature: Liquidity Grabs, Order Blocks, Fibonacci OTE levels
Set Fibonacci retracement percentages (e.g., 0.62 / 0.75)
Adjust lookback window for liquidity detection
Customize the take-profit multiplier (R-based)
Full control over visuals: colors, labels, and lines
💡 How to Use:
Use this script to scan for high-confluence trade setups based on Smart Money principles.
Combine with session timing (e.g., New York open), major swing structure, or Kill Zone windows for maximum edge.
Look for arrows inside OB zones or OTE levels following liquidity sweeps for cleaner entries.
🔗 Works Best With:
✅ First FVG — Opening Range Fair Value Gap Detector: Identify early inefficiencies to set the narrative for the day.
✅ Liquidity Levels — Smart Swing Lows: Spot key structural lows that can fuel stop hunts and reversals.
✅ ICT Turtle Soup — Liquidity Reversal: Add a classic reversal pattern to your toolkit to catch fakeouts cleanly.
Together, these tools build a complete Smart Money ecosystem for entry precision, risk management, and price behavior forecasting.
