Time Matrix TableICT stresses time and liquidity levels in his teachings. This table helps to easily locate these key Time-based price levels. You can use these levels to determine your directional bias and to help generate your narrative for where the market is going.
This indicator creates a table that gives you the price for the following liquidity levels:
PDO - Previous Day Open
PDH - Previous Day High
PDL - Previous Day Low
PDC - Previous Day Close
PDEQ - Equilibrium of the previous day's range. (Calculated by math.abs(((pdh-pdl)/2)+pdl))
PWH - Previous Week High
PWL - Previous Week Low
PDH2 - Two Days Back High
PDL2 - Two Days Back Low
PDH3 - Three Days Back High
PDL3 - Three Days Back Low
And gives you the opening price for the following times:
Daily Open - 6:00pm open for current session
1:30 AM
3:00 AM
4:00 AM
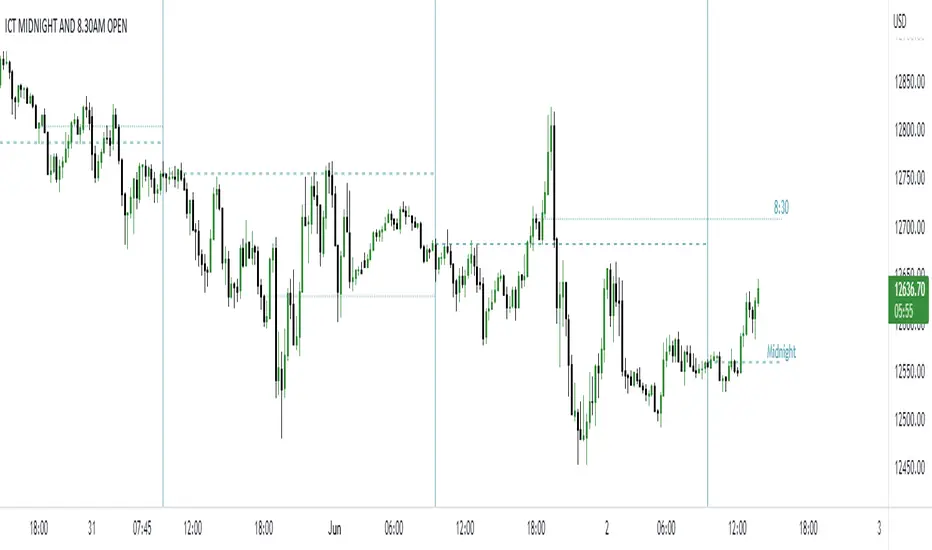
Midnight Open
6:00 AM
7:30 AM
8:30 AM
NY Open
10:00 AM
12:00 PM
NY PM - 1:30pm
2:00 PM
The levels are sorted descending in price in the table, with the background colored based on their relation to price. The prices are also plotted on the chart based on the range you specify in relation to the current price. These lines are also colored based on their relation to price.
This indicator does not give you anything but the price at a specific time, you must determine your own bias and narrative based on the levels that are given.
Indicatore Pine Script®