ICT Unicorn Breaker + FVG Alert📌 How to Use the ICT Breaker Block Indicator
The ICT Breaker Block Indicator helps you spot potential trade opportunities by setting up alerts. Here’s how to get started:
1️⃣ Draw Your Breaker Block
First, find a Bullish or Bearish Breaker Block on your chart.
Bullish Breaker Block: This forms when a bearish order block doesn't hold, and price breaks through to the upside. This indicates a shift from a bearish to a bullish market, with the previous bearish order block now acting as support.
Bearish Breaker Block: This forms when a bullish order block fails to hold, and price breaks through to the downside. This indicates a shift from a bullish to a bearish market, with the previous bullish order block now acting as resistance.
Use the drawing tool to mark the Breaker Block on your chart.
2️⃣ Set Your Entry & Stop Levels
Entry: For a bullish trade, enter at the top of the Breaker Block; for a bearish trade, enter at the bottom.
Stop Loss: Place this on the opposite side of the Breaker Block.
3️⃣ Choose Your Trade Direction
Bullish setup: Choose Buy for a bullish Breaker Block (upward break).
Bearish setup: Choose Sell for a bearish Breaker Block (downward break).
4️⃣ Create Two Alerts
You’ll need to set up the following two alerts in order:
✅ Unicorn Alert (Once Per Bar Close): Set this alert first for your selected Breaker Block (Bullish or Bearish). It triggers when price closes above the entry level (for a bullish setup) or below the entry level (for a bearish setup), and checks for bullish or bearish unmitigated Fair Value Gaps (FVGs) that overlap within the Breaker Block.
✅ Terminus Alert (Triggered Once): Once the Unicorn alert has been triggered, change the alert to a Terminus Alert. This alert is activated once the TP (terminus) is hit before the limit order fills from the Unicorn alert signal.
5️⃣ Automate with Webhook (Optional)
Want to automate your trades? Simply enter your Trader Post Webhook URL in the alert settings to send signals directly to your trading bot! 🤖
Cerca negli script per "ict"

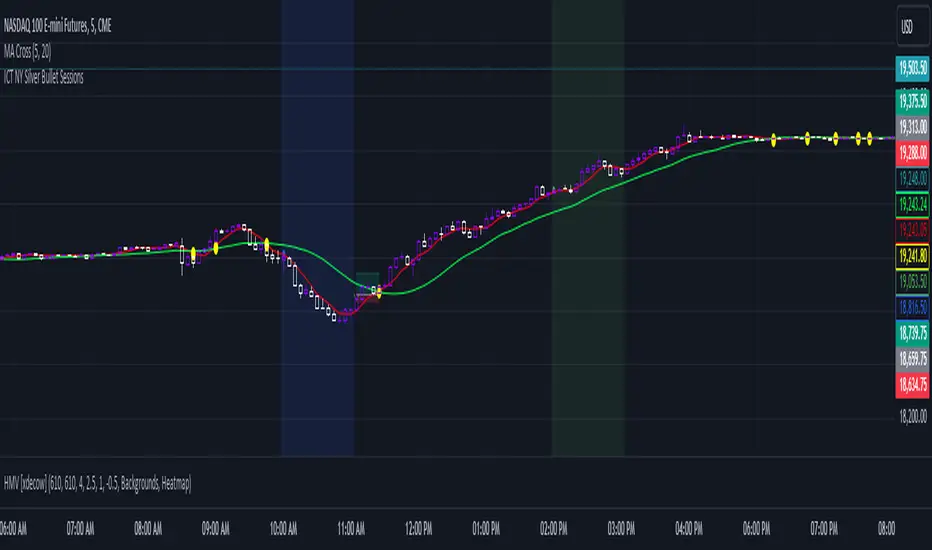
ICT NY Silver Bullet SessionsThe ICT NY Silver Bullet Sessions refer to two specific time windows within the New York trading session, during which traders aim to exploit short-term, high-probability price movements, particularly using price-action techniques inspired by the Inner Circle Trader (ICT) methodology. These sessions are typically associated with a higher likelihood of volatility and liquidity due to their proximity to key market hours, making them ideal for scalping or intraday trading strategies.
The Silver Bullet concept emphasizes precise entries and exits, taking advantage of institutional trading behaviors and order flow within these two specific time windows:
(I) The AM Silver Bullet Session (10:00 AM – 11:00 AM EST)
Time Frame: This session runs from 10:00 AM to 11:00 AM Eastern Standard Time (EST).
Significance: During this hour, the New York Stock Exchange (NYSE) has been open for about 30 minutes, which typically generates volatility as the market reacts to overnight price movements, economic news, or early U.S. session developments. Traders look for institutional price action setups like stop runs, liquidity grabs, or reversals.
Key Considerations: Traders often focus on major indices (such as the S&P 500 or NASDAQ), forex pairs, or commodities like gold and silver. The AM session is especially important for catching trends or retracements established in the London session or the early New York market hours.
(II) The PM Silver Bullet Session (02:00 PM – 03:00 PM EST)
Time Frame: This session occurs from 2:00 PM to 3:00 PM Eastern Standard Time (EST).
Significance: Known as the afternoon session, this time period aligns with institutional rebalancing and pre-close positioning, where significant liquidity enters the market as traders anticipate the upcoming New York close and London close (which happens at 11:00 AM EST). It is also a common time for institutional traders to initiate price moves that carry through into the end of the trading day.
Key Considerations: Traders monitor for key reversals, liquidity sweeps, or continuations of earlier trends. This is a prime time for trading major currencies and indices, as well as commodities like crude oil and metals, with a focus on exploiting liquidity imbalances.
ICT HTF FVGs v2 (fadi)NOTICE: Instead of updating the existing ICT HTF FVGs indicator, this indicator is being published separately due to the requests to keep the original by some traders and because of the drastic change in behavior/configurations. If the original v1 version is more appropriate for your style of trading, feel free to continue to use it.
ICT HTF FVGs v2
In trading, Fair Value Gaps (FVGs) refer to market inefficiencies or imbalances that occur when buying and selling activities are not equal. These gaps can be identified on various timeframes and are used in different trading strategies.
FVGs are crucial in price action trading as they highlight the difference between the current market price of an asset and its fair value. Traders use these gaps to identify potential trading opportunities, as they often indicate areas where the market may correct itself
This indicator will overlap the higher timeframe (HTF) FVGS over the current timeframe to help traders anticipate and plan their trades.
Features
Up to 6 higher timeframes (HTF) can be overlayed on a chart
Traders can limit the number of HTF FVGs to preset number of HTFs
Lower and current timeframes can be included
Configurable spacing of HTF FVGs to prevent overlapping
Configurable Smart Expansion of FVGs based on proximity to current price
Traders can decide what constitutes a Mitigated FVG
Show or hide mitigated FVGs to declutter the chart
Flexible display settings that controls how the FVGs are displayed
Flexible labeling of the FVG levels and content
Higher Timeframes Display Settings
This indicator provides the ability to select up to 6 HTF intervals. These intervals are based on the trader's timeframes including any custom timeframes.
Timeframe Configurations
Enable or Disable a Timeframe
The Timeframe to Display
Bullish / BISI FVG Color
Bearish / SIBI FVG Color
The number of FVGs For The Selected Timeframe
Limit to the next HTFs only can be used to display the selected number of HTF FVGs. For example, if the trader selects 3 then only 3 HTF FVGs will be displayed.
Note: If either of the next two options is selected, they will take up spots from this count.
Hide lower Timeframes restricts the FVGs to higher timeframes only. If this option is disabled, it will show lower timeframes FVGs as well.
Hide Current Timeframe removes current timeframe from the selected list of HTF FVGs. If this option is disabled, it will show current timeframe FVGs as well.
Background Transparency Enable or disable the background color (shaded area) of the FVG. If it is enabled, it will set the transparency amount. The higher the value, the more transparent the background.
Extend lines controls when and how to extend the FVG levels. There are three options:
Extension Only extends the FVGs by the specified number provided below only.
Current Candle Plus Extension extends all the FVGs beyond the current candle by the number provided below.
When in Range will only extend the FVGs near current price based on the advanced settings below. This setting will use Average True Range multiplier to calculate the range (shows FVGs that are higher or lower by the average candle size multiplied by the number in Advanced section).
Mitigated shows or hides the mitigated HTF FVGs. A FVG is considered mitigated based on one of the following options:
None will ignore mitigation and show all FVGs.
Touched when a HTF FVG is touched regardless of how deep the price get inside the FVG.
Wick filled the FVG is closed by a wick or body of a candle.
Body filled the FVG is closed by the body of a candle
Wick filled half a candle's wick or body has reached the C.E. of the FVG
Body filled half a candle body has reached the C.E. of the FVG
Extend mitigated lines sets the number of candles to extend the mitigated FVG levels by for better visibility.
Important Note: Mitigation is calculated based on the timeframe of the FVG, not current timeframe.
Display
Display settings focus on how the FVGs will be displayed. The trader is in total control and there are multiple ways to overlay FVGs on the chart.
Open / Close / C.E. / Link controls the borders. Traders can enable or disable any of them as well as set the thickness and style. Link is the right border.
C.E. also offers the option of setting the bullish (BISI) and bearish (SIBI) colors of the C.E. level
Labeling controls if the labels should be displayed next to the FVG, their color, background, and font size.
Label levels to display controls which levels to show. Open, High. or the C.E.
Label display content controls what to show in the labels, the timeframe of the label, is it a BISI or a SIBI, and a label to indicate if it is the Open or the Close.
Note: if the distance between the open and close has the potential of overlapping the labels, then the indicator will only show the C.E. label for visual clarity.
Advanced Settings
Advanced settings controls some internal calculations:
Proximity factor based on daily range used to calculate possible range of FVGs within a day's range to keep the chart clean. The higher the value, the more FVGs will be shown.
Combine labels factor for visibility used to calculate the distance between the open and close and if all the labels or only the C.E. should be displayed. The higher the value, the bigger the distance for combination (smaller numbers will show more labels).
Range should be within X candles used when "When in Range" option is selected. This is the ATR multiplier used to extend the FVGs. The higher the number, the more FVGs will be extended.
Once desired settings have been achieved, the settings can be saved as default from the bottom left of the indicator settings page for future use.

ICT Custom OPENSA basic Indicator, meant to delineate Specific ICT reference open times To be used with any ICT model that accounts for such, Time zone is set to the default UTC-4, New York Eastern Time, and all open times can be adjusted manually to the user's liking. Also displays labels for days of the week that can be positioned at the top or bottom of the chart

ICT IPDAGuided by ICT tutoring, I create this versatile indicator "IPDA".
This indicator shows a different way of viewing the “IPDA” by calculating from START
(-20 / -40 / -60) to (+20 /+40 /+60) Days, showing the Highs and Lows of the IPDA of the Previous days and both of the subsequent ones, the levels of (-20 / -40 / -60) Days can be taken into consideration as objectives to be achieved in the range of days (+20 /+40 /+60)
The user has the possibility to:
- Choose whether to display IPDAs before and after START
- Choose to show High and Low levels
- Choose to show Prices
The indicator should be used as ICT shows in its concepts.
Example on how to evaluate a possible Start IPDA:
Example for Entry targeting IPDAs :
If something is not clear, comment below and I will reply as soon as possible.

ICT Premium/DiscountGuided by ICT mentorship and help from TraderTim and its community, I created this versatile indicator to mark a "Premium/Discount" price range.
This indicator shows the Premium and Discount Zones in an alternative way, manually setting the start of the band and automatically shows the HTF and LTF FVG present only in the set band, having a cleaning of the graph from possible other distractions, so as to be able to have a clear vision clear of the set trading range
The user has the possibility to:
- Choose the start of the interval from the graph by moving the start line
- Choose to show levels 50% - 75% - 25% of the range
- Choose the color, style and size of the lines
- Choose to display FVG LTF or HTF in range
- Choose the FVG mitigation mode
The indicator must be used as shown by the ICT in its concepts, the Premium and Discount zones are nothing more than zones where the price risks retracing, and consequently we can evaluate making entries in the Premium Zone, Sell is evaluated, in the Discoutn Zone they are evaluated as Buy, taking the opposite area as Take Profit
As in the example below:
If anything is unclear, comment below and I will get back to you as soon as possible.
How to change range:

ICT index correlated market indicatorThis is not a real indicator, but is what ICT use as indicator for trading futures indexes.
it can only display SP500, Dow Jon Industrial Average and Nasdaq, if someone want other market can copy the code and change some parameters (is more easy than it can appear)
A good idea is using this other market on backtest to confirm the divergence idea of Linda Raske, than use it to spot quickly in real market.
Another idea published by ICT is the "hidden entry pattern", the entry signal appear in ES or YM but I trade NQ for volatility, so I use the trigger of SP500 or Dow to enter in Nasdaq.
Rember always don't trust anybody, do your own backtest and research!
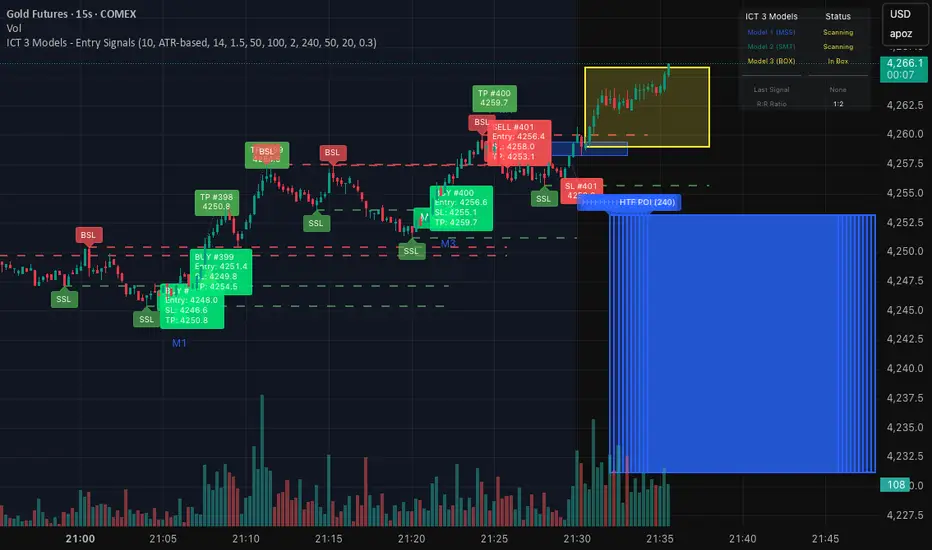
ICT 3 Models - Entry Signals 1.2This script combines 3 powerful ICT (Smart Money Concepts) Entry Models into one comprehensive strategy setup. It is designed to identify high-probability setups based on Higher Timeframe POIs and includes a fully functional Strategy Tester engine.
🔥 The 3 Entry Models:
Model 1 (MSS + FVG): Classic reversal setup using HTF Order Blocks, Liquidity Sweep, Market Structure Shift (MSS), and entry at FVG.
Model 2 (SMT / Sweep): Catches "Turtle Soup" or Failure Swing setups where price grabs liquidity and quickly reverses using FVG confirmation.
Model 3 (AMD / Box): Accumulation, Manipulation, Distribution setup. Identifies consolidation boxes and trades the manipulation leg.
✨ Highlights:
Full Backtesting Engine: Test the strategy with customizable Initial Capital and Order Sizing.
Auto HTF POI: Automatically plots Higher Timeframe Order Blocks on your chart.
Flexible Risk Management: Set SL/TP via Fixed Points or ATR Multiplier.
Alerts Included: Ready for automation.
Disclaimer: This tool is for educational purposes only. Trading involves risk.

ICT FVG & Swing Detector Basic by Trader Riaz//@version=6
indicator("ICT FVG & Swing Detector Basic by Trader Riaz", overlay=true)
// Display toggles for Bullish FVGs
show_bull_fvg = input.bool(true, "Show Bullish FVGs?")
// Input settings for Bullish FVGs
fvg_bull_count = input.int(1, "Number of Bullish FVGs to show", minval=1)
// Color settings for Bullish FVGs
bullish_fvg_color = input.color(color.green, "Bullish FVG Color")
// Bullish FVG Extend Options
bull_fvg_extendGroup = "Bullish FVG Extend Options"
bull_fvg_extendOption = input.string("Default", "Bullish FVG Extend Option", options= , group=bull_fvg_extendGroup)
bull_fvg_extendCandles = input.int(8, "Bullish FVG Extend Candles (Limited Only)", minval=1, maxval=100, step=1, group=bull_fvg_extendGroup)
// Display toggles for Bearish FVGs
show_bear_fvg = input.bool(true, "Show Bearish FVGs?")
// Input settings for Bearish FVGs
fvg_bear_count = input.int(1, "Number of Bearish FVGs to show", minval=1)
// Color settings for Bearish FVGs
bearish_fvg_color = input.color(color.red, "Bearish FVG Color")
// Bearish FVG Extend Options
bear_fvg_extendGroup = "Bearish FVG Extend Options"
bear_fvg_extendOption = input.string("Default", "Bearish FVG Extend Option", options= , group=bear_fvg_extendGroup)
bear_fvg_extendCandles = input.int(8, "Bearish FVG Extend Candles (Limited Only)", minval=1, maxval=100, step=1, group=bear_fvg_extendGroup)
// Display toggles for Swing Highs
show_swing_high = input.bool(true, "Show Swing Highs?")
// Input settings for Swing Highs
swing_high_count = input.int(2, "Number of Swing Highs to show", minval=1)
// Color settings for Swing Highs
swing_high_color = input.color(color.green, "Swing High Line & Label Color")
// Swing High Extend Options
swing_high_extendGroup = "Swing High Extend Options"
swing_high_extendOption = input.string("Default", "Swing High Extend Option", options= , group=swing_high_extendGroup)
swing_high_extendCandles = input.int(8, "Swing High Extend Candles (Limited Only)", minval=1, maxval=100, step=1, group=swing_high_extendGroup)
// Display toggles for Swing Lows
show_swing_low = input.bool(true, "Show Swing Lows?")
// Input settings for Swing Lows
swing_low_count = input.int(2, "Number of Swing Lows to show", minval=1)
// Color settings for Swing Lows
swing_low_color = input.color(color.red, "Swing Low Line & Label Color")
// Swing Low Extend Options
swing_low_extendGroup = "Swing Low Extend Options"
swing_low_extendOption = input.string("Default", "Swing Low Extend Option", options= , group=swing_low_extendGroup)
swing_low_extendCandles = input.int(8, "Swing Low Extend Candles (Limited Only)", minval=1, maxval=100, step=1, group=swing_low_extendGroup)
// Target Settings
showNextTarget = input.bool(true, "Show Next Target")
nextTargetHighColor = input.color(color.red, "Next Target High Color")
nextTargetLowColor = input.color(color.red, "Next Target Low Color")
// === Time Calculation ===
// Calculate one bar duration in milliseconds
barDuration = time - time
// Define reasonable extension period (4 bars into future)
extensionPeriod = barDuration * 4
// Arrays to store values with timestamps
var bull_fvg_data = array.new(0)
var bear_fvg_data = array.new(0)
var swing_high_data = array.new(0)
var swing_low_data = array.new(0)
var bull_fvg_labels = array.new(0)
var bear_fvg_labels = array.new(0)
var swing_high_labels = array.new(0)
var swing_low_labels = array.new(0)
var bull_fvg_midlines = array.new(0)
var bear_fvg_midlines = array.new(0)
var bull_fvg_tops = array.new(0)
var bull_fvg_bottoms = array.new(0)
var bear_fvg_tops = array.new(0)
var bear_fvg_bottoms = array.new(0)
// Get the last bar index
last_bar = last_bar_index + 3
// Function to determine right boundary based on extend option
get_right_boundary(option, extend_candles, default_right) =>
if option == "None"
bar_index - 2
else if option == "Limited"
bar_index - 2 + extend_candles
else
default_right
// Bullish FVG Detection
if high < low and show_bull_fvg
right_bar = get_right_boundary(bull_fvg_extendOption, bull_fvg_extendCandles, last_bar)
new_box = box.new(left=bar_index-2,
top=low,
right=right_bar,
bottom=high ,
bgcolor=color.new(bullish_fvg_color, 90),
border_color=bullish_fvg_color)
bull_mid = (low + high ) / 2
new_midline = line.new(bar_index-2, bull_mid, right_bar, bull_mid,
color=color.new(bullish_fvg_color, 50),
style=line.style_dashed)
new_label = label.new(right_bar-1, bull_mid, "Bullish FVG",
color=color.new(bullish_fvg_color, 100),
textcolor=bullish_fvg_color,
style=label.style_none,
textalign=text.align_right,
size=size.small)
array.unshift(bull_fvg_data, new_box)
array.unshift(bull_fvg_midlines, new_midline)
array.unshift(bull_fvg_labels, new_label)
array.unshift(bull_fvg_tops, low)
array.unshift(bull_fvg_bottoms, high )
if array.size(bull_fvg_data) > fvg_bull_count
box.delete(array.pop(bull_fvg_data))
line.delete(array.pop(bull_fvg_midlines))
label.delete(array.pop(bull_fvg_labels))
array.pop(bull_fvg_tops)
array.pop(bull_fvg_bottoms)
// Bearish FVG Detection
if low > high and show_bear_fvg
right_bar = get_right_boundary(bear_fvg_extendOption, bear_fvg_extendCandles, last_bar)
new_box = box.new(left=bar_index-2,
top=low ,
right=right_bar,
bottom=high,
bgcolor=color.new(bearish_fvg_color, 90),
border_color=bearish_fvg_color)
bear_mid = (low + high) / 2
new_midline = line.new(bar_index-2, bear_mid, right_bar, bear_mid,
color=color.new(bearish_fvg_color, 50),
style=line.style_dashed)
new_label = label.new(right_bar-1, bear_mid, "Bearish FVG",
color=color.new(bearish_fvg_color, 100),
textcolor=bearish_fvg_color,
style=label.style_none,
textalign=text.align_right,
size=size.small)
array.unshift(bear_fvg_data, new_box)
array.unshift(bear_fvg_midlines, new_midline)
array.unshift(bear_fvg_labels, new_label)
array.unshift(bear_fvg_tops, low )
array.unshift(bear_fvg_bottoms, high)
if array.size(bear_fvg_data) > fvg_bear_count
box.delete(array.pop(bear_fvg_data))
line.delete(array.pop(bear_fvg_midlines))
label.delete(array.pop(bear_fvg_labels))
array.pop(bear_fvg_tops)
array.pop(bear_fvg_bottoms)
// Swing High Detection
is_swing_high = high < high and high > high
if is_swing_high and show_swing_high
right_bar = get_right_boundary(swing_high_extendOption, swing_high_extendCandles, last_bar + 3)
new_line = line.new(bar_index - 1, high , right_bar, high ,
color=swing_high_color)
new_label = label.new(right_bar, high , "Swing High",
color=color.new(color.white, 30),
style=label.style_label_left,
textcolor=swing_high_color,
size=size.tiny)
array.unshift(swing_high_data, new_line)
array.unshift(swing_high_labels, new_label)
if array.size(swing_high_data) > swing_high_count
line.delete(array.pop(swing_high_data))
label.delete(array.pop(swing_high_labels))
// Swing Low Detection
is_swing_low = low > low and low < low
if is_swing_low and show_swing_low
right_bar = get_right_boundary(swing_low_extendOption, swing_low_extendCandles, last_bar + 3)
new_line = line.new(bar_index -1, low , right_bar, low ,
color=swing_low_color)
new_label = label.new(right_bar, low , "Swing Low",
color=color.new(color.white, 30),
style=label.style_label_left,
textcolor=swing_low_color,
size=size.tiny)
array.unshift(swing_low_data, new_line)
array.unshift(swing_low_labels, new_label)
if array.size(swing_low_data) > swing_low_count
line.delete(array.pop(swing_low_data))
label.delete(array.pop(swing_low_labels))
// Clean up if toggles are turned off
if not show_bull_fvg and array.size(bull_fvg_data) > 0
for i = 0 to array.size(bull_fvg_data) - 1
box.delete(array.get(bull_fvg_data, i))
line.delete(array.get(bull_fvg_midlines, i))
label.delete(array.get(bull_fvg_labels, i))
array.clear(bull_fvg_data)
array.clear(bull_fvg_midlines)
array.clear(bull_fvg_labels)
array.clear(bull_fvg_tops)
array.clear(bull_fvg_bottoms)
if not show_bear_fvg and array.size(bear_fvg_data) > 0
for i = 0 to array.size(bear_fvg_data) - 1
box.delete(array.get(bear_fvg_data, i))
line.delete(array.get(bear_fvg_midlines, i))
label.delete(array.get(bear_fvg_labels, i))
array.clear(bear_fvg_data)
array.clear(bear_fvg_midlines)
array.clear(bear_fvg_labels)
array.clear(bear_fvg_tops)
array.clear(bear_fvg_bottoms)
// === Swing High/Low Detection ===
var float swingHighs = array.new()
var int swingHighTimes = array.new()
var float swingLows = array.new()
var int swingLowTimes = array.new()
var line swingHighLines = array.new()
var label swingHighLabels = array.new()
var line swingLowLines = array.new()
var label swingLowLabels = array.new()
isSwingHigh = high > high and high > high
isSwingLow = low < low and low < low
if isSwingHigh
array.unshift(swingHighs, high )
array.unshift(swingHighTimes, time )
if isSwingLow
array.unshift(swingLows, low )
array.unshift(swingLowTimes, time )
// === Next Target Detection ===
var line currentTargetLine = na
var label currentTargetLabel = na
if showNextTarget
if not na(currentTargetLine)
line.delete(currentTargetLine)
if not na(currentTargetLabel)
label.delete(currentTargetLabel)
priceRising = close > open
priceFalling = close < open
// Use slightly longer extension for targets
targetExtension = barDuration * 8
if priceRising and array.size(swingHighs) > 0
for i = 0 to array.size(swingHighs) - 1
target = array.get(swingHighs, i)
targetTime = array.get(swingHighTimes, i)
if target > close
currentTargetLine := line.new(
x1=targetTime, y1=target,
x2=time + targetExtension, y2=target,
color=nextTargetHighColor, width=2,
style=line.style_dashed,
xloc=xloc.bar_time)
currentTargetLabel := label.new(
x=time + targetExtension, y=target,
text="Potential Target", size=size.tiny,
style=label.style_label_left,
color=nextTargetHighColor,
textcolor=color.white,
xloc=xloc.bar_time)
break
else if priceFalling and array.size(swingLows) > 0
for i = 0 to array.size(swingLows) - 1
target = array.get(swingLows, i)
targetTime = array.get(swingLowTimes, i)
if target < close
currentTargetLine := line.new(
x1=targetTime, y1=target,
x2=time + targetExtension, y2=target,
color=nextTargetLowColor, width=2,
style=line.style_dashed,
xloc=xloc.bar_time)
currentTargetLabel := label.new(
x=time + targetExtension, y=target,
text="Potential Target", size=size.tiny,
style=label.style_label_left,
color=nextTargetLowColor,
textcolor=color.white,
xloc=xloc.bar_time)
break


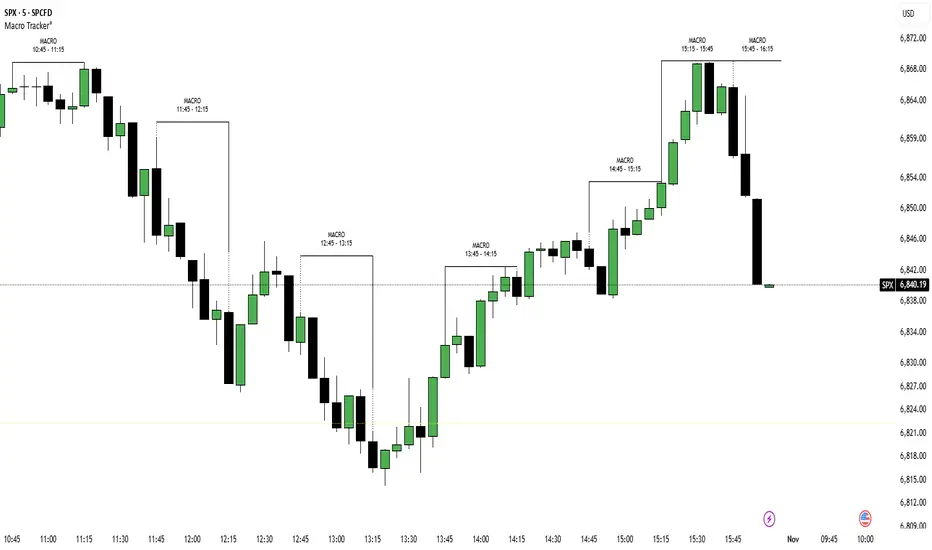
ICT Macro Tracker (xx:45-xx:15) (MTMGBS)Adjusted pinescript to reflect xx:45-xx:15 instead of the traditional xx:50-xx:15
ICT ADR/AWR/AMR Levels | Trade Symmetry🌟 ICT ADR/AWR/AMR Levels
📋 Overview
This advanced technical analysis tool calculates and displays Average Daily Range (ADR), Average Weekly Range (AWR), and Average Monthly Range (AMR) levels. The indicator incorporates smart detection technology that automatically maintains monthly level visibility when historical data becomes unavailable.
✨ Key Features
🕒 Precise Time Alignment
True Daily Opens (TDO) aligned with 00:00 UTC
True Weekly Opens (TWO) at 00:00 UTC (configurable Monday/Sunday start)
True Monthly Opens (TMO) at 00:00 UTC on month start
Customizable period start times and parameters
📊 Comprehensive Multi-Timeframe Analysis
Daily Levels (ADR): Base level with multiple extensions including Fibonacci ratios
Weekly Levels (AWR): Weekly range projections and key levels
Monthly Levels (AMR): Monthly range calculations with automatic fallback system
🔄 Intelligent Level Management
Smart Detection: Automatically switches between historical and current monthly levels
Continuous Visibility: Ensures reference levels remain visible regardless of data availability
Seamless Operation: No manual adjustment needed for level transitions
⚙️ Extensive Customization
Adjustable lookback periods for all timeframes
Independent control over each level type and extension
Complete visual customization (colors, styles, widths)
Flexible labeling and display options
Configurable vertical separation lines
🏷️ Advanced Display Options
Clean, organized label placement
Optional price display in labels
Historical period tracking
Overlapping label merging capability
Adjustable label sizing and positioning
🚀 How to Use
Initial Setup: Enable desired timeframes (Daily/Weekly/Monthly)
Range Configuration: Set appropriate averaging periods for each timeframe
Level Selection: Choose which extension levels to display
Visual Settings: Customize colors and styles to match your trading workspace
Automatic Operation: The indicator intelligently manages level transitions
💡 Practical Applications
Identify potential support and resistance areas across multiple timeframes
Establish realistic profit targets based on historical volatility
Plan trade entries and exits around significant time-based levels
Analyze market volatility patterns across different time horizons
Incorporate institutional trading concepts into your analysis
ICT First Presented FVG with Volume Imbalance [1st P. FVG + VI]The indicator identifies and highlights the first presented Fair Value Gap (FVG) occurringthe morning (09:30–10:00) and afternoon (13:30–14:00) session's first 30 minutes. It includes an optional feature to extend FVG zones when a volume imbalance (V.I.) is detected, providing additional context for areas of potential price inefficiency. This powerful combination helps traders identify significant market structure gaps that often act as support/resistance zones and potential price targets.
What is an FVG?
A Fair Value Gap, often abbreviated as FVG, is a price range on a chart where there is an inefficiency or imbalance in trading. This typically happens when price moves rapidly in one direction, leaving a gap between the wicks or bodies of three consecutive candles. For example, in a bullish move, if the low of the third candle is higher than the high of the first candle, the space between them is the FVG.
What is a Volume Imbalance?
A volume imbalance is a smaller, more precise inefficiency within price action, often visible as a "crack" or thin area in the price delivery. It represents a spot where the volume traded was not balanced between buyers and sellers, often seen as a thin wick or a gap between candle bodies.
FVG + Volume Imbalance:
When you have a fair value gap that contains a volume imbalance, it becomes a more significant area of interest. ICT teaches that you should not ignore a volume imbalance if it’s part of an FVG. In fact, you should use the volume imbalance in conjunction with the FVG to define your trading range more accurately
📊 Volume Imbalance Integration
Toggle Option: Enable/disable volume imbalance detection based on preference
Extended Boundaries: When enabled, FVG boundaries expand to include volume imbalance zones
Accurate Gap Sizing: Total gap calculation includes volume imbalance extensions
Multi-Scenario Support: Handles volume imbalances at start, end, or both sides of FVG formations
📈 Multiple Display Modes
Current Day: Shows only today's FVGs for clean chart analysis
Current Week: Displays all weekly FVGs for broader context
Forward Extension: Extends FVG boxes and CE, Upper/Lower Quadrant lines into the future
📊 Visualization
Bullish FVGs appear in semi-transparent blue or purple zones (depending on session).
Bearish FVGs appear in red or orange zones.
Optional dotted lines mark the CE (midpoint) of each FVG for additional reference.
Quadrant Division: Additional 25%/75% lines for large FVGs (configurable minimum gap size)
🎯 Smart Filtering
First Presentation Only: Only displays the initial FVG in each session, avoiding clutter
Minimum Gap Size: Configurable tick-based thresholds for AM and PM sessions
Core FVG Validation: Ensures only valid Fair Value Gaps are displayed
⚙️ Configuration Options
Display Settings
Show Mode: Current Day or Current Week view
Forward Extension: 1-500 bars projection
Day Labels: Toggle weekday labels in weekly mode
Text Color: Customizable label colors
Volume Imbalance Settings
Include Volume Imbalance: Master toggle for enhanced boundary calculation
Automatic Detection: Identifies imbalance scenarios without additional input
Session-Specific Settings
AM Session (09:30-10:00):
Enable/disable AM FVG detection
Customizable bullish/bearish colors
CE line visibility and coloring
Minimum gap size in ticks
PM Session (13:30-14:00):
Enable/disable PM FVG detection
Customizable bullish/bearish colors
CE line visibility and coloring
Minimum gap size in ticks
Quadrant Settings
Enable/Disable: Toggle quadrant line display
Minimum Gap: Tick threshold for quadrant activation
Line Style: Dotted, dashed, or solid
Color: Customizable quadrant line color
How It Works
FVG Boundary Calculation
Traditional FVG: High to Low (bullish) or Low to High (bearish)
Enhanced FVG: Extended boundaries to include volume imbalance zones when enabled
Total Gap Size: Calculated including any volume imbalance extensions
Volume Imbalance Detection
The indicator identifies volume imbalances by detecting bars where:
Bullish Imbalance: Current bar's body is completely above previous bar's body
Bearish Imbalance: Current bar's body is completely below previous bar's body
⚠️ Disclaimer
This script is a technical visualization tool only.
It does not provide financial advice, signals, or predictions. Always perform independent analysis and manage risk appropriately before making trading decisions.

ICT PDA - Gold & BTC (QuickScalp Bias/FVG/OB/OTE + Alerts)What this script does
This indicator implements a complete ICT Price Delivery Algorithm (PDA) workflow tailored for XAUUSD and BTCUSD. It combines HTF bias, OTE zones, Fair Value Gaps, Order Blocks, micro-BOS confirmation, and liquidity references into a single, cohesive tool with early and final alerts. The script is not a mashup for cosmetic plotting; each component feeds the next decision step.
Why this is original/useful
Symbol-aware impulse filter: A dynamic displacement threshold kTune adapts to Gold/BTC volatility (body/ATR vs. per-symbol factor), reducing noise on fast markets without hiding signals.
Scalping preset: “Quick Clean” mode limits drawings to the most recent bars and keeps only the latest FVG/OB zones for a clear chart.
Three display modes: Full, Clean, and Signals-Only to match analysis vs. execution.
Actionable alerts: Early heads-up when price enters OTE in the HTF bias direction, and Final alerts once mitigation + micro-break confirm the setup.
How it works (high-level logic)
HTF Bias: Uses request.security() on a user-selected timeframe (e.g., 240m) and EMA filter. Bias = close above/below HTF EMA.
Dealing Range & OTE: Recent swing high/low (pivot length configurable) define the range; OTE (62–79%) boxes are drawn contextually for up/down ranges.
Displacement: A candle’s body/ATR must exceed kTune and break short-term structure (displacement up/down).
FVG: 3-bar imbalance (bull: low > high ; bear: high < low ). Latest gaps are tracked and extended.
Order Blocks: Last opposite candle prior to a qualifying displacement that breaks recent highs/lows; zones are drawn and extended.
Entry & Alerts:
Long: Bullish bias + price inside buy-OTE + mitigation of a bullish FVG or OB + micro BOS up → “PDA Long (Final)”.
Short: Bearish bias + price inside sell-OTE + mitigation of a bearish FVG or OB + micro BOS down → “PDA Short (Final)”.
Early Alerts: Trigger as soon as price enters OTE in the direction of the active bias.
Inputs & controls (key ones)
Bias (HTF): timeframe minutes, EMA length.
Structure: ATR length, Impulse Threshold (Body/ATR), swing pivot length, OB look-back.
OTE/FVG/OB/LP toggles: show/hide components.
Auto-Tune: per-symbol factors for Gold/BTC + manual tweak.
Display/Performance: View Mode, keep-N latest FVG/OB, limit drawings to last N bars.
Recommended usage (scalping)
Timeframes: Execute on M1–M5 with HTF bias from 120–240m.
Defaults (starting point): ATR=14, Impulse Threshold≈1.6; Gold factor≈1.05, BTC factor≈0.90; Keep FVG/OB=2; last 200–300 bars; View Mode=Clean.
Workflow: Wait for OTE in bias direction → see mitigation (FVG/OB) → confirm with micro BOS → manage risk to nearest liquidity (prev-day H/L or recent swing).
Alerts available
“PDA Early Long/Short”
“PDA Long (Final)” / “PDA Short (Final)”
Attach alerts on “Any alert() function call” or the listed conditions.
Chart & screenshots
Please include symbol and timeframe on screenshots. The on-chart HUD shows the script name and state to help reviewers understand context.
Limitations / notes
This is a discretionary framework. Signals can cluster during news or extreme volatility; use your own risk management. No guarantee of profitability.
Changelog (brief)
v1.2 QuickScalp: added Quick Clean preset, safer array handling, symbol-aware impulse tuning, display modes.
------------------------------
ملخص عربي:
المؤشر يطبق تسلسل PDA عملي للذهب والبتكوين: تحيز من فريم أعلى، مناطق OTE، فجوات FVG، بلوكات أوامر OB، وتأكيد micro-BOS، مع تنبيهات مبكرة ونهائية. تمت إضافة وضع “Quick Clean” لتقليل العناصر على الشارت وحساسية إزاحة تتكيّف مع الأصل. للاستخدام كسكالب: نفّذ على M1–M5 مع تحيز 120–240 دقيقة، وابدأ من الإعدادات المقترحة بالأعلى. هذا إطار سلوكي وليس توصية مالية.

ICT Daily Bias - Liquidity SweepDaily Bias Script using ICT concepts
Apparently I need to write more here.

ICT + SMT Liquidity & FVG Template v6 MNQ1/MES1Marking out ict concepts on mnq and marking smt divergences with mes

ICT Fair Value Gap (FVG) DetectorFair Value Gap (FVG) Indicator
Purpose: Highlights price gaps between three consecutive candles, which signal areas of imbalance that may later act as support or resistance.
How It Works: The script looks for a gap between the high of two bars ago and the low of the current bar (bullish FVG) or the low of two bars ago and the high of the current bar (bearish FVG).
Visuals: These gaps are marked as transparent boxes on the chart, extended to the right until they are "filled" or mitigated by price returning into the gap.
Customization: You can adjust which gaps show, their colors, thresholds, and other display options.

All in oneict trading session, silver bullet. perfect session of trading. help with timing to enter for max profit. also with high and low of previous day, week, month

ICT SMC Custom — BOS/MSS + OB + FVGWant me to fill that box? Here’s a ready‑to‑paste description for your publish screen:
⸻
ICT SMC Custom — BOS/MSS + OB + FVG (Crypto‑friendly)
A clean Smart Money Concepts tool that marks Break of Structure (BOS), Market Structure Shift (MSS), Order Blocks (OB), and Fair Value Gaps (FVG) with bold, easy‑to‑see visuals. Built for crypto but works on any market and timeframe.
What it does
• BOS & MSS detection with optional body/wick logic
• Order Blocks: auto‑draws the last opposite candle before a BOS, keeps only the most recent N, and fades when mitigated
• FVGs: 3‑candle gaps with a minimum size filter and a cap on how many to keep
• HTF Swings (optional): plots higher‑timeframe pivot highs/lows for top‑down context
• Alerts for BOS/MSS and FVG formation
Inputs
• Swing pivot length (default 3): sensitivity for structure pivots
• Use candle bodies for breaks: close vs level (on) or wicks (off)
• Show BOS/MSS labels, Show FVG, Show Order Blocks
• Min FVG size (ticks) and Max boxes to keep for FVG/OB
• OB uses candle body: body range vs full wick range
• Show higher timeframe swings + HTF timeframe
• Bullish/Bearish colors
How it works
• BOS triggers when price breaks the last opposite swing.
• MSS flags when the break flips the prior bias.
• OB is the most recent opposite candle prior to BOS; it’s marked and later greyed out once price closes through it (mitigation).
• FVG is detected when candle 1’s high < candle 3’s low (bear) or candle 1’s low > candle 3’s high (bull).
Alerts included
• BOS Up / BOS Down
• MSS Up / MSS Down
• FVG Up / FVG Down
Tips
• Start on 15m/1h for crypto, pivot length 3–5.
• Turn Use candle bodies ON for stricter confirmations, OFF for more signals.
• If boxes look cluttered, lower “Max boxes to keep.”
Note: This is a visual/educational tool, not financial advice. Always confirm with your own plan and risk management.

ICT/SMC Liquidity Map V3 KyroowThe indicator is designed to map liquidity on the chart following the ICT/SMC logic, with the added feature of precise tracking of the Asian session.
It shows you:
PDH / PDL → Previous Day High & Low, automatically removed once taken out.
EQH / EQL → Equal Highs & Equal Lows (double tops/bottoms), with pip tolerance and a check to ensure no candle has already "cleared" the range.
ASH / ASL → Asian Session High & Low (the highs/lows of each closed Asian session).
Asian Session → Displayed as a box or shaded area, with visual history.
Dynamic tolerance management → EQH/EQL can have different tolerances depending on the timeframe.
Automatic removal → Levels are removed once the market takes them (via wick or body, configurable).
💡 In practice:
It helps you quickly identify likely liquidity grab zones, whether they come from the previous day, the Asian session, or equal highs/lows. This allows you to anticipate market reactions around these levels.
