Trade ChecklistICT trading checklist. This checklist helps you mark out confluences so you can rate the trade you're about to take and be able to decide if its a good trade or you should skip it. EnjoyIndicatore Pine Script®di lcardona117
ICT Opening Gap Strategy [Momentum1]Momentum strategy taken off the close of the first candle after the NDOG/NWOG. Built with Gemini. Strategia Pine Script®di Toddwaters7247
ICT Gap Retest Strategy [Custom Exits]Gap Retest Strategy with customizable exit conditions and two adjustable trade windows. Enters on the candle following a retest and exit of the NDOG/NWOG. Written with Gemini. Strategia Pine Script®di Toddwaters7215
ICT Gap Strategy [Swing SL + Sessions]Retest opening gap strategy with London and New York SessionsStrategia Pine Script®di Toddwaters7212
ICT Opening Gap Strategy [Midpoint Entry]As described in the title. With trailing stoploss. Strategia Pine Script®di Toddwaters7213
ICT Sessionsbasen on KillZones Hunt + Sessions Alert & Volume on RangesIndicatore Pine Script®di M87_CRYPTOAggiornato 21
ICT Power of 3 identify the high-probability Power of 3 pattern by analyzing price behavior rather than just specific times of day. It focuses on how the market builds, traps, and then expands. 1. Accumulation (The Setup) Logic: The script monitors volatility using the Average True Range (ATR). When volatility drops below its recent average, the script recognizes that orders are being "accumulated." Visual: A Blue Dotted Box appears. This marks the equilibrium zone where buy and sell side liquidity is being engineered above and below the high/low of the range. 2. Manipulation (The Trap) Logic: The script looks for a "Sweep." This is defined as price moving outside the blue accumulation box but failing to sustain that move. In the video, this is the "Judas Swing" or false breakout. Visual: A Red Diamond appears above or below the bar. This signals that the script has detected a liquidity grab—essentially, the market has "tricked" breakout traders into the wrong side of the market. 3. Distribution (The Expansion) Logic: This is identified through Displacement. The script calculates the average candle body size. When a candle appears that is significantly larger (based on your Displacement Multiplier), it confirms that "Smart Money" has entered the market. Visual: A Green Triangle appears. This marks the start of the distribution phase, which is the "meat" of the move where you want to be positioned.Indicatore Pine Script®di day_trade_mind39
ICT Venom Trading Model [TradingFinder] SMC NY Session 2025SetupIt is a new interesting indicator. It might be a little bit difficult to implement but i like it a lot Indicatore Pine Script®di helenanagnost32
ICT Macros FuturesAll Macros Detected: Early / Pre Market - 02:33 – 03:10 (NY) - 04:03 – 04:30 - 05:20 – 05:40 - 05:50 – 06:10 - 07:50 – 08:10 - 08:20 – 08:40 Cash Open / Morning - 08:50 – 09:10 - 09:20 – 09:40 - 09:50 – 10:10 Midday / Lunch - 10:50 – 11:10 - 11:50 – 12:10 - 12:00 – 13:30 (Lunch Hour) Afternoon - 13:10 – 13:40 - 14:20 – 14:40 - 15:15 – 15:45 - 15:50 – 16:10 Indicatore Pine Script®di Alvaro_Castellano7
ICT-SMC ProMarket Structure** (Swing Highs/Lows, HH, HL, LH, LL) - ✅ **Break of Structure (BOS)** — Trend continuation signals - ✅ **Change of Character (CHoCH)** — Early reversal warnings - ✅ **Order Blocks (OB)** — Institutional supply/demand zones - ✅ **Fair Value Gaps (FVG)** — Price imbalances & magnets - ✅ **Inverse Fair Value Gaps (iFVG)** — Validated support/resistance - ✅ **Liquidity Pools (BSL/SSL)** — Stop hunt targets - ✅ **Liquidity Sweeps** — Reversal confirmation signalsIndicatore Pine Script®di Making_Trades_Matter129
ICT IRON-CLAD: Fixed Sessionsall sessions and killzones marked out with colours and lables as used by all tradersIndicatore Pine Script®di garethsteadman47Aggiornato 15
ICT Sessions & Kill Zones (UTC-5)Simple and easy to use killzones and sessions indicatorIndicatore Pine Script®di garethsteadman4752
ICT Precision Turtle Soup NuNi1. Identify the CRT Range (The Context) Before looking for a trade, the indicator defines the Candle Range Theory (CRT) boundaries based on your lookback period. CRT High (Red Line): Represents old buy-side liquidity. CRT Low (Green Line): Represents old sell-side liquidity. HTF Filter: The code ensures the higher timeframe trend (e.g., 4H) aligns with your direction. Only look for Buys if the HTF trend is bullish. 2. The Manipulation (Turtle Soup 🐢) Wait for price to move outside the CRT boundaries. The Trap: Price must sweep below the CRT Low or above the CRT High. The Reclaim: A Turtle Body Soup (TBS) occurs when the candle body closes back inside the range, or a wick rejection happens. Symbol: A 🐢 icon will appear on the chart. Do not entry yet. This is just a warning that a setup is forming. 3. The Shift & Momentum (The Trigger) To ensure a high-probability entry, the indicator waits for two technical confirmations: MSS (Market Structure Shift): Price must break the most recent swing high (for Buys) or swing low (for Sells). Displacement: The breaking candle must be "displaced"—meaning it has a large, energetic body compared to previous candles. This proves that big banks/institutions are moving the price. 4. The Entry Execution Once all conditions are met, the "⭐ PRECISION ENTRY" label will appear. Execution: You can enter at the market price when the label appears. Retest Entry: Alternatively, look for the price to return to the IFVG or Breaker Zone (the shaded box) drawn by the indicator for a more refined entry.Indicatore Pine Script®di naw_lumm437
ICT Premium/Discount Zones [Exponential-X]Premium/Discount Zones - Visual Market Structure Tool Overview This indicator helps traders visualize premium and discount price zones based on recent market structure. It automatically identifies swing highs and lows within a specified lookback period and divides the price range into three key areas: Premium Zone, Equilibrium, and Discount Zone. What This Indicator Does The script continuously monitors price action and calculates: Highest High and Lowest Low within the lookback period Equilibrium Level - the midpoint between the swing high and low Premium Zone - the area from equilibrium to the swing high (typically viewed as relatively expensive price levels) Discount Zone - the area from the swing low to equilibrium (typically viewed as relatively cheap price levels) Core Calculation Method The indicator uses pivot point logic to identify significant swing highs and lows based on the pivot strength parameter. It then calculates the highest high and lowest low over the specified lookback period. The equilibrium is computed as the arithmetic mean of these two extremes, creating a fair value reference point. The zones are dynamically updated as new price data becomes available, ensuring the visualization remains relevant to current market conditions. Key Features Dynamic Zone Detection Automatically adjusts zones based on recent price action Uses customizable lookback period for flexibility across different timeframes Employs pivot strength parameter to filter out minor price fluctuations Visual Clarity Color-coded zones for easy identification (red for premium, green for discount) Optional equilibrium line display Adjustable zone label placement Customizable color schemes to match your charting preferences Alert Capabilities Alerts when price enters the premium zone Alerts when price enters the discount zone Alerts when price returns to equilibrium Helps traders monitor key zone interactions without constant chart watching Customization Options Adjustable lookback period (5-500 bars) Configurable pivot strength for swing detection (1-20 bars) Control over box extension into the future Toggle labels and equilibrium line on/off Full color customization for all visual elements How to Use This Indicator Setup Add the indicator to your chart Adjust the lookback period to match your trading timeframe (shorter for intraday, longer for swing trading) Set pivot strength to filter out noise (higher values for major swings, lower for more frequent updates) Customize colors and labels to your preference Interpretation Premium Zone: Price trading here may indicate potential resistance or selling opportunities when aligned with other technical factors Discount Zone: Price trading here may indicate potential support or buying opportunities when aligned with other technical factors Equilibrium: Acts as a fair value reference point where price often consolidates or reacts Trading Applications This tool works well when combined with other forms of analysis such as: Trend identification indicators Volume analysis Support and resistance levels Price action patterns Market structure analysis Important Considerations This indicator identifies zones based purely on historical price data Premium and discount zones are relative to the recent lookback period The effectiveness varies across different market conditions and timeframes Should be used as part of a comprehensive trading strategy, not in isolation Past price structure does not guarantee future price behavior Technical Details Calculation Method Uses Pine Script's ta.pivothigh() and ta.pivotlow() functions for swing detection Employs ta.highest() and ta.lowest() for range calculation Updates dynamically with each new bar Draws zones using box objects for clear visual representation Performance Optimization Efficiently manages box and line objects to minimize resource usage Uses conditional plotting to reduce unnecessary calculations Limited to essential visual elements for chart clarity Timeframe Compatibility This indicator works on all timeframes but the recommended settings vary: 1-5 minute charts: Lookback period 10-20, Pivot strength 3-5 15-60 minute charts: Lookback period 20-50, Pivot strength 5-10 Daily charts: Lookback period 50-100, Pivot strength 10-15 Weekly charts: Lookback period 20-50, Pivot strength 5-10 Adjust these values based on the volatility of your specific instrument. Limitations and Considerations What This Indicator Does NOT Do Does not provide buy or sell signals on its own Does not predict future price movements Does not account for fundamental factors or market events Does not guarantee profitability or accuracy Market Condition Awareness In strong trending markets, price may remain in premium or discount zones for extended periods During ranging conditions, price typically oscillates between zones more predictably High volatility can cause frequent zone recalculations Low volatility may result in narrow zones with limited practical use Risk Considerations Premium and discount are relative concepts, not absolute values What appears as a discount zone may continue lower in a downtrend What appears as a premium zone may continue higher in an uptrend Always use proper risk management and position sizing Consider multiple timeframe analysis for context Version Information This indicator is written in Pine Script v6, ensuring compatibility with the latest TradingView features and optimal performance. Final Notes This tool is designed to enhance your market analysis by providing a clear visual representation of premium and discount price zones. It should be used as one component of a well-rounded trading approach that includes proper risk management, multiple forms of analysis, and realistic expectations about market behavior. The concept of premium and discount zones is rooted in auction market theory and the idea that price oscillates around fair value. However, traders should understand that these zones are interpretive tools based on historical data and do not constitute trading advice or predictions about future price action. Remember to backtest any strategy using this indicator on historical data before applying it to live trading, and always trade responsibly within your risk tolerance. Disclaimer: The information provided by this indicator is for educational and informational purposes only. It does not constitute financial advice, investment advice, trading advice, or any other sort of advice. Always conduct your own research and consult with qualified financial professionals before making trading decisions.Indicatore Pine Script®di Exponential-X84
ICT Quant-Core: Liquidity Intelligence [Dual-Engine]🔥 THE ULTIMATE LIQUIDITY FILTERING ENGINE Most SMC traders lose money because they "catch falling knives" on every local wick. This algorithm solves this problem by using DUAL-CORE logic and a signal quality scoring system. This is no ordinary pivot indicator. ⚙️ HOW DOES IT WORK? (DUAL-CORE LOGIC) The algorithm analyzes the market on two levels simultaneously: 1️⃣ MACRO CORE (Lookback 50 - "WHALE 🐋") Tracks key levels from recent weeks/months. This is where institutions build their positions. Signals from this core have the highest priority (Score 10/10). 2️⃣ LOCAL CORE (Lookback 20 - "ROACH 🐟") Tracks internal market structure and noise. Signals are filtered by the Main Trend. If the trend is down, Local Longs are marked as "TRAP." 🧠 SMART FILTERS (QUANT LAYERS) Instead of entering on every line touch, the script requires confirmation: ✅ RECLAIM LOGIC: Price must close back above/below the liquidity level (Swing Failure Pattern). ✅ RVOL FILTER: Requires relative volume > 1.2x the average (institutional track). ✅ SCORING SYSTEM (0-10): Each signal receives a score. - 10/10: Macro Grab in line with the trend + high volume. - 3/10: Local Grab against the trend (risky). 📊 ANALYTICAL DASHBOARD In the lower right corner, you'll find the "Command Center": - Trend Status (Distribution/Accumulation) - Whale's Last Move (Price and Direction) - Current Tactics (e.g., "Ignore Longs, Search for Shorts") - Filter Status (RSI, Volume, Reclaim) 🚀 HOW TO USE IT? 1. Set the H4 timeframe. 2. Wait for a signal with a rating > 7/10. 3. Ignore "Fish/Local" signals (small icons) if they contradict the Dashboard color. 4. Entry occurs only after the candle closes (Reclaim).Indicatore Pine Script®di TheMrD56
ICT/SMC Holy GrailThe Holy Grail, with its backtesting feature to check win rates, is all you need to do when placing orders!Indicatore Pine Script®di evanslee12311132
ICT Macro Slot Algo Event📊 Overview A powerful multi-timeframe trading indicator that combines Institutional Macro Session Tracking identify optimal trading windows throughout the day. This tool helps traders align with institutional flow patterns and algorithmic activity across major sessions. 🎯 Key Features 1. Macro Algo Event Sessions Tracks 6 key institutional time windows during NY Session: NY Sweep (08:50-09:10) - Opening balance flows Silver Bullet #1 (09:50-10:10) - First major macro move Silver Bullet #2 (10:50-11:10) - Second chance/retest opportunity Lunch Macro (11:50-12:10) - Mid-day repositioning Post-Lunch Rebalance (13:10-13:40) - Post-lunch adjustments NY Closing Macros (15:15-15:45) - End-of-day flowsIndicatore Pine Script®di viveksadokj1uli7
ICT Macro Slot Algo Event📊 Overview A powerful multi-timeframe trading indicator that combines Institutional Macro Session Tracking to identify optimal trading windows throughout the day. This tool helps traders align with institutional flow patterns and algorithmic activity across major sessions. 🎯 Key Features 1. Macro Algo Event Sessions Tracks 6 key institutional time windows during NY Session: NY Sweep (08:50-09:10) - Opening balance flows Silver Bullet #1 (09:50-10:10) - First major macro move Silver Bullet #2 (10:50-11:10) - Second chance/retest opportunity Lunch Macro (11:50-12:10) - Mid-day repositioning Post-Lunch Rebalance (13:10-13:40) - Post-lunch adjustments NY Closing Macros (15:15-15:45) - End-of-day flowsIndicatore Pine Script®di viveksadokj1uli1180
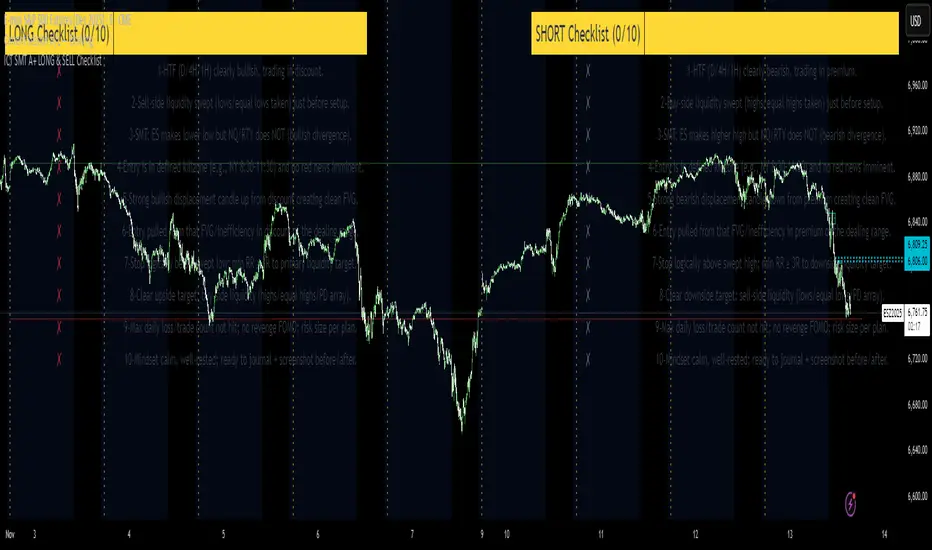
ICT SMT A+ LONG & SELL ChecklistTrade Checklist. Once all items checked color changes from yellow to green. Indicatore Pine Script®di DaLondonBoy8811
ICT Largest Midnight–00:30 FVG (NY, 1 per day) — FIXEDmarks out the first and largest fvg on the 1 min chart from midnight open until 12:30 am estIndicatore Pine Script®di mattyd42117
ICT Killzones_SAIFKill Zones Shading with High and Low levels highlight for required market sessionsIndicatore Pine Script®di syedsaifalicpa11
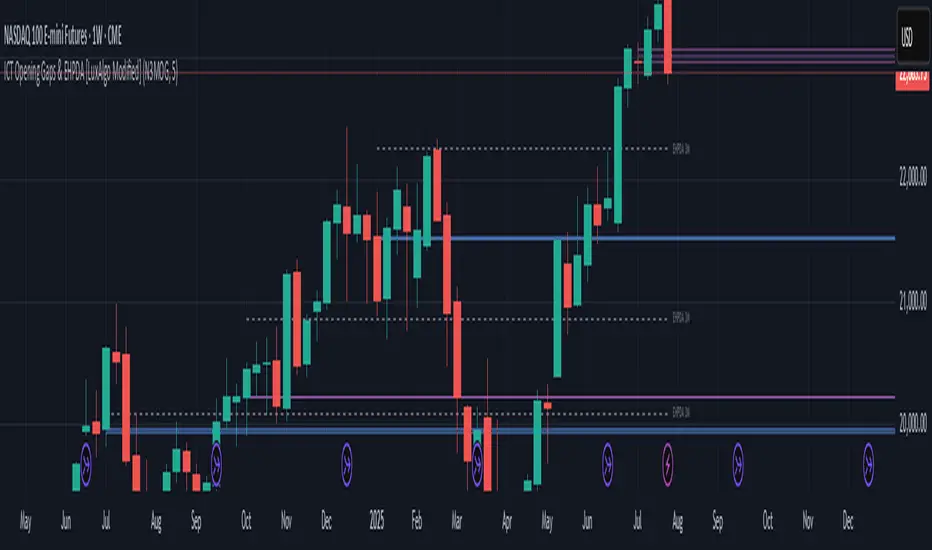
ICT Opening Gaps & EHPDA [LuxAlgo Modified]Modified version of LuxAlgo's original opening gap indicator to include NMOGs and NYOGsIndicatore Pine Script®di JakeTradesIt44
ICT Killzones & Sessions - SA EnhancedAdapts to chart time and adds a "pre-London" indicationIndicatore Pine Script®di ronaldjvanvoorstAggiornato 122