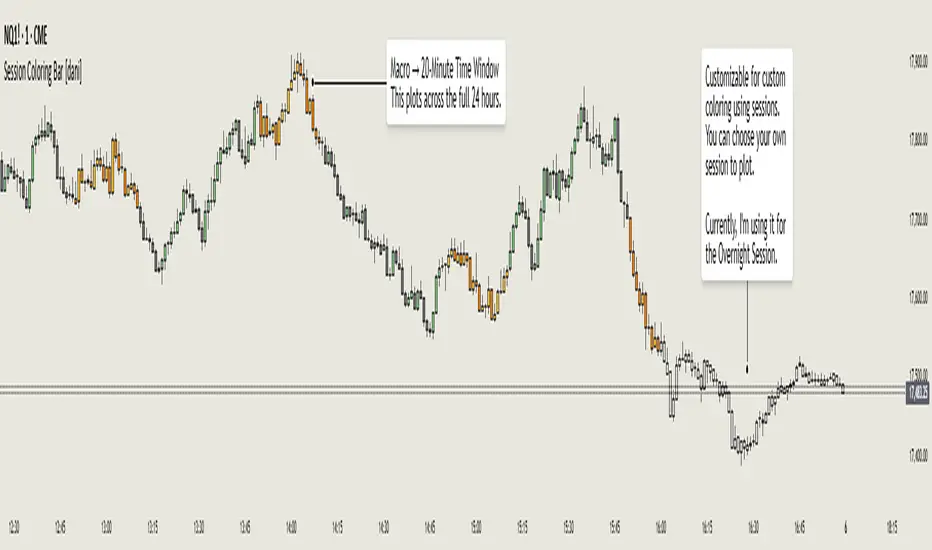
Session Coloring Bar with ICT Macro [dani]The Session Coloring Bar is customizable Pine Script indicator designed to visually enhance your charts by applying unique colors to specific trading sessions or timeframes. This tool allows traders to easily identify and differentiate between macro sessions (e.g., 24-hour cycles) and custom-defined sessions (e.g., Session A, Session B), making it ideal for analyzing market activity during specific periods.
In the context of trading, the term "ICT Macro" , as discussed by Michael J. Huddleston (ICT), refers to specific timeframes or "windows" where market behavior often follows predictable patterns. Traders typically focus on the last 10 minutes of an hour and the first 10 minutes of the next hour (e.g., 0150-0210 , 0050-0110 , or 0950-1010 ) to identify key price movements, liquidity shifts, or market inefficiencies.
This script highlights these macro timeframes, enabling traders to visually analyze price action during these critical periods. Use this tool to support your strategy, but always combine it with your own analysis and risk management.
With this indicator, you can:
Highlight Macro Sessions : Automatically color bars based on predefined 24-hour macro sessions.
Customize Session Settings : Define up to three custom sessions (A & B) with individual start/end times, visibility toggles, and unique bar colors.
Timeframe Filtering : Hide session coloring above a specified timeframe to avoid clutter on higher timeframes.
Personal Notes : Add comments to each session for better organization and quick reference.
Dynamic Color Logic : Bars are colored based on their direction (up, down, or neutral) within the active session.
How to Use:
Enable/Disable Sessions :
Use the Show Coloring toggle to enable or disable session coloring for Macro, Session A, Session B, or Session C.
Set Session Times :
Define the start and end times for each session in the format HHMM-HHMM (e.g., 1600-0930 for an overnight session).
Choose Colors :
Assign unique colors for upward (Bar Up) and downward (Bar Down) bars within each session.
Adjust Timeframe Visibility :
Use the Hide above this TF input to specify the maximum timeframe where session coloring will be visible.
Add Notes :
Use the Comment field to add personal notes or labels for each session.
Example Use Cases:
Overnight Sessions :
Highlight overnight trading hours (e.g., 1600-0930) to analyze price action during low liquidity periods.
Asian/European/US Sessions : Define separate sessions for major trading regions to track regional market behavior.
Macro Analysis : Use the predefined 24-hour macro sessions to study hourly price movements across a full trading day.
Disclaimer:
The Session Coloring Bar is not a trading signal generator and does not predict market direction or provide buy/sell signals. Instead, it is a visualization tool designed to help you identify and analyze specific trading sessions or timeframes on your chart. By highlighting key sessions and their corresponding price movements, this indicator enables you to focus on periods of interest and make more informed trading decisions.
Thank you for choosing this indicator! I hope it becomes a valuable part of your trading toolkit. Remember, trading is a journey, and having the right tools can make all the difference. Whether you're a seasoned trader or just starting out, this indicator is designed to help you stay organized and focused on what matters most—price action. Happy trading, and may your charts be ever in your favor! 😊
Cerca negli script per "ict"
CandelaCharts - Fib Retracement (OTE) 📝 Overview
The CandelaCharts Fib Retracement (OTE) indicator is a precision tool designed to help traders identify Optimal Trade Entry (OTE) levels based on Fibonacci retracement principles, as taught in ICT (Inner Circle Trader) methodology.
This indicator automatically plots Fibonacci retracement levels between a selected swing high and swing low, highlighting the key OTE zone between the 61.8% and 78.6% retracement levels—a prime area for potential reversals in trending markets.
📦 Features
Automatic & Custom lookback modes
Customizable fib levels
Dynamic coloring
Reverse & extend
⚙️ Settings
Lookback: Controls the number of bars to look back. You can choose between **Automatic** or **Custom** mode.
Line Style: Sets the line style for the Fibonacci levels.
Levels: 0, 0.236, 0.0.382, 0.500, 0.620, 0.705, 0.790, 0.886, 1.000. Allows you to toggle the visibility of Fibonacci levels.
Dynamic Coloring: Colors Fibonacci levels according to trend direction.
Show Labels: Shows the price value at each Fibonacci level.
Reverse: Flips the Fibonacci levels in the opposite direction.
Extend Left: Extends the Fibonacci levels to the left.
⚡️ Showcase
Dynamic Coloring
Manual Coloring
Fib Retracement
Extended
Custom Length
📒 Usage
Using the CandelaCharts Fib Retracement (OTE) is pretty straightforward—just follow these steps to spot high-probability trade setups and refine your entries.
Identify the Trend – Determine whether the market is in an uptrend or downtrend.
Select Swing Points – The indicator automatically plots from the most recent swing high to swing low (or vice versa).
Wait for Price to Enter OTE Zone – Look for price action confirmation within the optimal entry zone (61.8%-78.6%).
Enter the Trade – Consider longs in an uptrend at the OTE zone, and shorts in a downtrend.
Set Stop & Target – Place stops below/above the swing low/high and target extension levels (127.2%, 161.8%).
🎯 Key takeways
The CandelaCharts Fib Retracement (OTE) is a must-have tool for traders looking to refine their entries and maximize risk-reward potential with precision-based ICT trading strategies. 🚀
🚨 Alerts
The indicator does not provide any alerts!
⚠️ Disclaimer
Trading involves significant risk, and many participants may incur losses. The content on this site is not intended as financial advice and should not be interpreted as such. Decisions to buy, sell, hold, or trade securities, commodities, or other financial instruments carry inherent risks and are best made with guidance from qualified financial professionals. Past performance is not indicative of future results.

CandelaCharts - OHLC Macro Range Map 📝 Overview
Elevate your candlestick analysis with the OHLC Macro Range Map!
Unlike conventional OHLC charts, this advanced indicator weaves Inner Circle Trader (ICT) principles into its design, helping you decode accumulation, manipulation, and distribution patterns—candle by candle.
ICT traders recognize manipulation through wicks that extend against the candle’s closing direction—a deliberate move to mislead participants into unfavorable positions. These deceptive movements often hint at market manipulation phases. By decoding these subtle signals, traders can anticipate the distribution phase of a candle, where price action reveals potential liquidity targets, retracement zones, and key reversal points.
These levels offer valuable insights into order flow, revealing how price interacts with them and the sequence of movements within the market.
To enhance price analysis, the tool also monitors the average duration of manipulation and distribution phases. By blending historical timing patterns with key price levels associated with these phases, traders can conduct deeper analyses and fine-tune their strategies for better decision-making.
Although grounded in historical data, this indicator does not promise that past patterns will replicate in future market conditions. Instead, it provides a data-driven framework to identify moments when candles are likely to reverse after manipulation phases or retrace following completed distributions. This empowers traders to pinpoint potential market turning points with greater accuracy.
📦 Features
This tool offers a range of powerful features to enhance your trading analysis:
Average Range Accuracy : Simplify candlestick analysis with advanced lines and labels to pinpoint manipulation, distribution, and time pivots. Graph average ranges for your chosen timeframe to navigate market volatility and uncover key support and resistance zones.
Custom Timeframe Selection : Align your analysis with your trading strategy by choosing a timeframe that highlights the candle’s manipulation, distribution, and key timing.
Real-time Data Feed : Stay updated with live candlestick stats, with each new candle updating OHLC data and performing ongoing historical calculations, even on sub-minute timeframes.
Historical Mapping : Backtest past market scenarios with ease using the historical mapping feature. Traders can revisit and analyze previous data, refine strategies, and customize label displays for journaling flexibility.
User-Friendly Interface : Designed for advanced traders, the intuitive interface allows easy navigation and customization of display settings, offering a personalized experience for data-driven analysis.
⚙️ Settings
Macros: Sets the timeframe to which will be drawn.
Lookback: Controls period length in days.
Method: Sets the desired calculation algorithm.
History: Display Macro Range Map drawings for previous sessions.
Timezone: Dsiplay the data based on the selected timezone.
Opn: Style for Open line.
Man: Style for Manipulation line.
Dis: Style for Distribution line.
Time: Style for Timeline.
Labels: Controls the size and abbreviations.
Table Position: Manage the Macro Range Map table position
⚡️ Showcase
Here’s a visual showcase of the tool in action, highlighting its key features and capabilities:
Manipilation & Distribution
Time
📒 Usage
Here’s how you can use the OHLC Macro Range Map to enhance your analysis:
Add OHLC Macro Range Map to your Tradingview chart.
Select a timeframe and customize the styles to fit your preferences.
Watch as calculated manipulation, distribution, and delivery times align with your analysis.
Combine this data with other models and insights to strengthen your trading strategy.
Example 1
By following these steps, you'll unlock powerful insights to refine and elevate your trading strategies.
🔹 Notes
On Bullish candles:
Manipulation: Open - Low
Distribution: Open - High
On Bearish candles:
Manipulation: Open - High
Distribution: Open - Low
Available calculation methods:
Mean
Median
Price patterns on OHLC Macro Range Map:
Open - -Man - +Dis
Open - -Man - Open - +Dis
Open - -Man - +Man - +Dis
Open - -Man - +Man - -Dis
Open - +Man - -Dis
Open - +Man - Open - -Dis
Open - +Man - -Man - -Dis
Open - +Man - -Man - +Dis
🚨 Alerts
The indicator does not provide any alerts!
⚠️ Disclaimer
These tools are exclusively available on the TradingView platform.
Our charting tools are intended solely for informational and educational purposes and should not be regarded as financial, investment, or trading advice. They are not designed to predict market movements or offer specific recommendations. Users should be aware that past performance is not indicative of future results and should not rely on these tools for financial decisions. By using these charting tools, the purchaser agrees that the seller and creator hold no responsibility for any decisions made based on information provided by the tools. The purchaser assumes full responsibility and liability for any actions taken and their consequences, including potential financial losses or investment outcomes that may result from the use of these products.
By purchasing, the customer acknowledges and accepts that neither the seller nor the creator is liable for any undesired outcomes stemming from the development, sale, or use of these products. Additionally, the purchaser agrees to indemnify the seller from any liability. If invited through the Friends and Family Program, the purchaser understands that any provided discount code applies only to the initial purchase of Candela's subscription. The purchaser is responsible for canceling or requesting cancellation of their subscription if they choose not to continue at the full retail price. In the event the purchaser no longer wishes to use the products, they must unsubscribe from the membership service, if applicable.
We do not offer reimbursements, refunds, or chargebacks. Once these Terms are accepted at the time of purchase, no reimbursements, refunds, or chargebacks will be issued under any circumstances.
By continuing to use these charting tools, the user confirms their understanding and acceptance of these Terms as outlined in this disclaimer.

CandelaCharts - OHLC Session Range Map 📝 Overview
Master the art of candlestick analysis with the OHLC Session Range Map!
Enhance your TradingView strategies by incorporating this advanced tool for actionable insights. Far beyond standard OHLC visuals, this innovative indicator integrates Inner Circle Trader (ICT) concepts to analyze accumulation, manipulation, and distribution, one candle at a time.
ICT traders identify manipulation through wicks that extend opposite the candle’s close—a tactic designed to mislead market participants into taking positions in the "wrong" direction. These movements often signify potential manipulation phases. By interpreting these signals, traders can anticipate a candle’s distribution phase, where the price expands to higher or lower levels. This provides valuable insights into liquidity targets, retracement zones, and potential reversals.
These levels provide critical insights into order flow, illustrating how price interacts with them and the sequence in which it unfolds.
To refine price analysis further, the tool also tracks the average timing for the completion of manipulation and distribution phases. By combining historical timing patterns with price levels tied to these phases, traders can perform more in-depth analyses and enhance their market strategies.
While rooted in historical data, this indicator does not guarantee that past patterns will repeat in future market conditions. Instead, it offers a data-driven approach to identifying moments when candles are likely to reverse after manipulation phases or retrace following completed distributions, enabling traders to spot potential turning points with greater precision.
📦 Features
This tool offers a range of powerful features to enhance your trading analysis:
Average Range Accuracy : Simplify candlestick analysis with advanced lines and labels to pinpoint manipulation, distribution, and time pivots. Graph average ranges for your chosen timeframe to navigate market volatility and uncover key support and resistance zones.
Custom Timeframe Selection : Align your analysis with your trading strategy by choosing a timeframe that highlights the candle’s manipulation, distribution, and key timing.
Real-time Data Feed : Stay updated with live candlestick stats, with each new candle updating OHLC data and performing ongoing historical calculations, even on sub-minute timeframes.
Historical Mapping : Backtest past market scenarios with ease using the historical mapping feature. Traders can revisit and analyze previous data, refine strategies, and customize label displays for journaling flexibility.
User-Friendly Interface : Designed for advanced traders, the intuitive interface allows easy navigation and customization of display settings, offering a personalized experience for data-driven analysis.
⚙️ Settings
Sessions: Sets the timeframe to which will be drawn.
Lookback: Controls period length in days.
Method: Sets the desired calculation algorithm.
History: Display Session Range Map drawings for previous sessions.
Timezone: Dsiplay the data based on the selected timezone.
Opn: Style for Open line.
Man: Style for Manipulation line.
Dis: Style for Distribution line.
Time: Style for Timeline.
Labels: Controls the size and abbreviations.
Table Position: Manage the Session Range Map table position
⚡️ Showcase
Here’s a visual showcase of the tool in action, highlighting its key features and capabilities:
Manipilation & Distribution
Time
📒 Usage
Here’s how you can use the OHLC Session Range Map to enhance your analysis:
Add OHLC Session Range Map to your Tradingview chart.
Select a timeframe and customize the styles to fit your preferences.
Watch as calculated manipulation, distribution, and delivery times align with your analysis.
Combine this data with other models and insights to strengthen your trading strategy.
Example 1
Example 2
By following these steps, you'll unlock powerful insights to refine and elevate your trading strategies.
🔹 Notes
On Bullish candles:
Manipulation: Open - Low
Distribution: Open - High
On Bearish candles:
Manipulation: Open - High
Distribution: Open - Low
Available calculation methods:
Mean
Median
Price patterns on OHLC Session Range Map:
Open - -Man - +Dis
Open - -Man - Open - +Dis
Open - -Man - +Man - +Dis
Open - -Man - +Man - -Dis
Open - +Man - -Dis
Open - +Man - Open - -Dis
Open - +Man - -Man - -Dis
Open - +Man - -Man - +Dis
🚨 Alerts
The indicator does not provide any alerts!
⚠️ Disclaimer
These tools are exclusively available on the TradingView platform.
Our charting tools are intended solely for informational and educational purposes and should not be regarded as financial, investment, or trading advice. They are not designed to predict market movements or offer specific recommendations. Users should be aware that past performance is not indicative of future results and should not rely on these tools for financial decisions. By using these charting tools, the purchaser agrees that the seller and creator hold no responsibility for any decisions made based on information provided by the tools. The purchaser assumes full responsibility and liability for any actions taken and their consequences, including potential financial losses or investment outcomes that may result from the use of these products.
By purchasing, the customer acknowledges and accepts that neither the seller nor the creator is liable for any undesired outcomes stemming from the development, sale, or use of these products. Additionally, the purchaser agrees to indemnify the seller from any liability. If invited through the Friends and Family Program, the purchaser understands that any provided discount code applies only to the initial purchase of Candela's subscription. The purchaser is responsible for canceling or requesting cancellation of their subscription if they choose not to continue at the full retail price. In the event the purchaser no longer wishes to use the products, they must unsubscribe from the membership service, if applicable.
We do not offer reimbursements, refunds, or chargebacks. Once these Terms are accepted at the time of purchase, no reimbursements, refunds, or chargebacks will be issued under any circumstances.
By continuing to use these charting tools, the user confirms their understanding and acceptance of these Terms as outlined in this disclaimer.

CandelaCharts - OHLC Range Map 📝 Overview
Explore the intricate art of candlestick analysis with the OHLC Range Map!
Elevate your TradingView experience by integrating this dynamic tool into your trading strategies with actionable insights. This cutting-edge indicator transcends standard OHLC visuals, leveraging Inner Circle Trader (ICT) concepts to dissect accumulation, manipulation, and distribution on a candle-by-candle basis.
ICT traders recognize manipulation through the wick extending opposite the candle’s close. This movement often serves to mislead market participants into taking positions in the "wrong" direction, signaling potential manipulation legs. Analysts can use these insights to anticipate a candle’s distribution phase. During distribution, price extends to higher or lower levels, offering key clues for identifying liquidity draws, potential retracements, or reversals.
These levels offer valuable insights into order flow, highlighting how price interacts with them and the sequence of its delivery.
To enhance price mapping, the tool also charts the average timing for the completion of manipulation and distribution phases. This feature empowers traders to combine historical timing patterns with the price levels associated with manipulation and distribution for a deeper analysis.
Like all tools based on historical data, this indicator does not guarantee that past patterns will replicate in future market conditions. Designed with a data-driven edge, it highlights moments when candles are likely to reverse following manipulation phases or retrace after completing defined distributions, helping analysts spot potential turning points.
📦 Features
This tool offers a range of powerful features to enhance your trading analysis:
Average Range Accuracy : Simplify candlestick analysis with advanced lines and labels to pinpoint manipulation, distribution, and time pivots. Graph average ranges for your chosen timeframe to navigate market volatility and uncover key support and resistance zones.
Custom Timeframe Selection : Align your analysis with your trading strategy by choosing a timeframe that highlights the candle’s manipulation, distribution, and key timing.
Real-time Data Feed : Stay updated with live candlestick stats, with each new candle updating OHLC data and performing ongoing historical calculations, even on sub-minute timeframes.
Historical Mapping : Backtest past market scenarios with ease using the historical mapping feature. Traders can revisit and analyze previous data, refine strategies, and customize label displays for journaling flexibility.
User-Friendly Interface : Designed for advanced traders, the intuitive interface allows easy navigation and customization of display settings, offering a personalized experience for data-driven analysis.
⚙️ Settings
Timeframe: Sets the timeframe to which will be drawn.
Period: Controls period length in days.
Algorithm: Sets the desired calculation algorithm.
History: Display Range Map drawings for previous sessions.
Timezone: Dsiplay the data based on the selected timezone.
Use NY Midnight Open: Controls from where a Range Map will start detection.
Opn: Style for Open line.
Man: Style for Manipulation line.
Dis: Style for Distribution line.
Time: Style for Timeline.
Labels: Controls the size and abbreviations.
Line Position: Manage the Range Map line position
Table Position: Manage the Range Map table position
⚡️ Showcase
Here’s a visual showcase of the tool in action, highlighting its key features and capabilities:
Manipilation & Distribution
Time
📒 Usage
Here’s how you can use the OHLC Range Map to enhance your analysis:
Add OHLC Range Map to your Tradingview chart.
Select a timeframe and customize the styles to fit your preferences.
Watch as calculated manipulation, distribution, and delivery times align with your analysis.
Combine this data with other models and insights to strengthen your trading strategy.
Example 1
Example 2
By following these steps, you'll unlock powerful insights to refine and elevate your trading strategies.
🔹 Notes
On Bullish candles:
Manipulation: Open - Low
Distribution: Open - High
On Bearish candles:
Manipulation: Open - High
Distribution: Open - Low
Available calculation methods:
Mean
Median
Price patterns on OHLC Range Map:
Open - -Man - +Dis
Open - -Man - Open - +Dis
Open - -Man - +Man - +Dis
Open - -Man - +Man - -Dis
Open - +Man - -Dis
Open - +Man - Open - -Dis
Open - +Man - -Man - -Dis
Open - +Man - -Man - +Dis
🚨 Alerts
The indicator does not provide any alerts!
⚠️ Disclaimer
These tools are exclusively available on the TradingView platform.
Our charting tools are intended solely for informational and educational purposes and should not be regarded as financial, investment, or trading advice. They are not designed to predict market movements or offer specific recommendations. Users should be aware that past performance is not indicative of future results and should not rely on these tools for financial decisions. By using these charting tools, the purchaser agrees that the seller and creator hold no responsibility for any decisions made based on information provided by the tools. The purchaser assumes full responsibility and liability for any actions taken and their consequences, including potential financial losses or investment outcomes that may result from the use of these products.
By purchasing, the customer acknowledges and accepts that neither the seller nor the creator is liable for any undesired outcomes stemming from the development, sale, or use of these products. Additionally, the purchaser agrees to indemnify the seller from any liability. If invited through the Friends and Family Program, the purchaser understands that any provided discount code applies only to the initial purchase of Candela's subscription. The purchaser is responsible for canceling or requesting cancellation of their subscription if they choose not to continue at the full retail price. In the event the purchaser no longer wishes to use the products, they must unsubscribe from the membership service, if applicable.
We do not offer reimbursements, refunds, or chargebacks. Once these Terms are accepted at the time of purchase, no reimbursements, refunds, or chargebacks will be issued under any circumstances.
By continuing to use these charting tools, the user confirms their understanding and acceptance of these Terms as outlined in this disclaimer.

ADR Table BY @ICT_YEROADR Table BY @ICT_YERO
Created by: @ICT_YERO
This custom indicator is designed to provide the Average Daily Range (ADR) for multiple timeframes, including Daily, 4-Hour, and 1-Hour. The indicator is tailored to assist traders in understanding price volatility and making informed trading decisions.
Key Features
Multi-Timeframe ADR Calculation:
Automatically calculates and displays the ADR for Daily, 4-Hour, and 1-Hour timeframes.
Helps traders identify potential price movement ranges for different trading sessions.
Dynamic Range Visualization:
Clear visual representation of the ADR on the chart, making it easy to spot price extremes.
Real-time updates to reflect changes in price movement.
Custom Alerts:
Option to set alerts when the price approaches the ADR high or low.
Useful for identifying potential reversal zones or breakout opportunities.
User-Friendly Interface:
Simple and intuitive settings to customize colors, levels, and display preferences.
Seamlessly integrates with your existing TradingView setup.
ICT-Inspired Methodology:
Designed for traders who follow ICT concepts, focusing on precision and high-probability setups.
Applications
Range Trading: Helps determine the high and low boundaries for scalping or intraday setups.
Volatility Analysis: Understand market behavior during different times of the day or week.
Reversal Zones: Identify areas where price is likely to reverse, based on ADR extremes.
Whether you're a scalper, day trader, or swing trader, this indicator provides a comprehensive overview of price volatility across multiple timeframes, making it an essential tool for your trading arsenal.

Enigma Unlocked 2.0Description for "Enigma Unlocked 2.0" Pine Script Indicator
Overview
Enigma Unlocked 2.0 is an advanced and highly customizable indicator designed to deliver actionable buy and sell signals by leveraging precise candlestick logic during specific market transitions. This indicator is built for flexibility, helping traders identify high-probability trade setups during key trading periods, specifically the transitions between the Asian Kill Zone and London Kill Zone as well as the London Kill Zone and New York Kill Zone on the 30-minute timeframe.
By combining Enigma Unlocked 2.0 with the ICT Killzones & Pivots indicator, traders can gain a deeper understanding of the timing and location of these transitions. Waiting for signals during these defined kill zones increases the likelihood of finding high-probability trade setups.
How to Use
Follow the Kill Zone Transitions:
Use the ICT Killzones & Pivots indicator to clearly visualize the boundaries of the Asian, London, and New York kill zones.
Focus on the signals generated by Enigma Unlocked 2.0 that align with these kill zone transitions.
Plotting Entries and Targets with Gann Box:
For Buy Signals:
Use the Gann Box tool to mark the high and low of the signal candle.
Ensure your Gann Box settings include only the 50%, 0%, and 100% levels.
Your entry zone lies between the 50% and 100% levels (discount zone). This is where buy trades are expected to offer an optimal risk-reward ratio.
For Sell Signals:
Similarly, plot the Gann Box on the high and low of the signal candle.
The 50% to 100% zone acts as the premium area for sell trades.
Setting Stop Loss and Targets:
To identify a safe stop loss, split the 50% zone of the Gann Box using another Gann Box.
Draw the secondary Gann Box from 50% to 100% of the initial box, then extend it to double the height.
For sell trades, place the stop loss above the extended 100% level.
For buy trades, place the stop loss below the extended 100% level.
Aim for a minimum of 1:1 risk-to-reward to ensure optimal trade management.
How It Works
Buy Logic:
Buy Logic 1: Detects a bullish candle (close > open) that:
Closes above its midpoint (50% of the candle body).
Has a low lower than the previous candle's low.
Buy Logic 2: Identifies a bearish candle (close < open) that:
Closes above its midpoint (50% of the candle body).
Has a low lower than the previous candle's low.
Sell Logic:
Sell Logic 1: Detects a bearish candle (close < open) that:
Closes below its midpoint (50% of the candle body).
Has a high higher than the previous candle's high.
Sell Logic 2: Identifies a bullish candle (close > open) that:
Closes below its midpoint (50% of the candle body).
Has a high higher than the previous candle's high.
Real-Time Alerts and Visual Cues:
Green triangles below candles indicate buy opportunities.
Red triangles above candles indicate sell opportunities.
Built-in alert conditions notify you of signals in real-time, so you never miss a trading opportunity.
Why Use Enigma Unlocked 2.0?
Precision: Advanced candlestick logic ensures that signals are generated only under optimal conditions.
Session-Based Filtering: Signals occur exclusively during the most active market sessions (kill zones), improving trade quality.
Visualization: Simple yet effective tools like Gann Box integration and clear visual signals make this indicator easy to use and highly effective.
Real-Time Alerts: Stay informed of potential trades even when you're away from your screen.
Enigma Unlocked 2.0 empowers traders to harness the power of candlestick analysis and session-based strategies for disciplined and effective trading. Pair this with a solid understanding of risk management and kill zones to achieve consistent results in your trading journey.

Premium & Discount Delta Volume [BigBeluga]Premium & Discount Delta Volume is an advanced volume-based tool that helps traders identify zones of market imbalances by using the concepts of premium and discount pricing, commonly taught by ICT trader. It calculates and highlights periods where the market is trading at a premium (selling pressure is stronger) or a discount (buying pressure is stronger) and dynamically plots these zones over time. The indicator also calculates delta volume between buying and selling within these zones, showing shifts in market sentiment and potential areas for reversals or continuations.
🔵 IDEA
The Premium & Discount Delta Volume indicator is rooted in the ICT (Inner Circle Trader) concept of premium and discount zones. This concept divides the price action into two key zones:
Premium Zone : This area is where the market is trading at a level where sellers dominate, leading to more selling pressure. The idea is that the price is overvalued, and a potential drop could occur as the market reverts to a balanced state.
Discount Zone : This area is where the market is undervalued, with buyers dominating and applying upward pressure. Prices in this area often indicate opportunities to buy into strength as the market moves back to equilibrium.
At the core of the indicator is the delta volume, which measures the difference between buying and selling pressure within the premium and discount zones. When the delta volume is negative, it signals a downtrend with more selling pressure, while a positive delta volume signals an uptrend with more buying pressure. These zones and their associated delta values update dynamically, providing traders with real-time insights into market strength and potential price reversals.
The equilibrium in the middle of the premium and discount zones represents the balance point between buyers and sellers. When price moves away from equilibrium, it either enters the premium zone (potentially overbought) or the discount zone (potentially oversold), helping traders make more informed decisions based on volume and price structure.
🔵 KEY FEATURES & USAGE
Premium & Discount Zones:
The indicator automatically identifies and plots premium and discount zones on the chart. Premium zones count only negative (selling) volume, while discount zones count only positive (buying) volume. These zones are key areas of interest for identifying potential price reversals or continuations based on volume pressure.
Dynamic Delta Volume Calculation:
The indicator calculates delta volume between the premium and discount zones, showing the imbalance between buyers and sellers. A positive delta volume inside the discount zone suggests strong buying pressure, while a negative delta inside the premium zone suggests strong selling pressure. This helps traders quickly identify trends or market exhaustion.
Up Trend:
Down Trend:
Real-time Updates & Equilibrium Line:
The zones update dynamically every 100 bars or after price crosses them, ensuring that traders always have the most relevant market data. The equilibrium line in the middle of the zones helps traders gauge whether the market is balanced or moving into overbought (premium) or oversold (discount) territory.
Macro and Local Period Calculations:
The indicator allows traders to customize two different periods for analysis: a smaller lookback period (e.g., 50 bars) for short-term price action and a macro period (e.g., 200 bars) for larger trends. Each period has its own premium and discount zones, allowing for a multi-timeframe view of market strength.
Macro:
Both:
Color-coded background for Volume Pressure:
The background color of the smaller period premium and discount box changes based on delta volume. A positive delta turns the background blue, indicating higher buy pressure, while a negative delta turns the background red, signaling higher sell pressure.
🔵 CUSTOMIZATION
Toggle Premium & Discount: Traders can choose to display support and resistance levels based on the high and low points of the premium and discount zones.
Premium & Discount Lookback Period: Traders can adjust the lookback period to define the length of price action to be analyzed for premium and discount zones. A shorter period focuses on more recent market activity, while a longer period provides a broader view of trends.
Macro Highs/Lows Period: The indicator also offers a macro lookback period for identifying larger market trends and key levels of buying or selling volume.
Toggle Macro Levels: Macro levels help identify long-term price extremes, and traders can toggle this feature on or off as needed.

Breaker Blocks + Order Blocks confirm [TradingFinder] BBOB Alert🔵 Introduction
In the realm of technical analysis, various tools and concepts are employed to identify key levels on price charts. These tools assist traders in analyzing market trends with greater precision, enabling them to optimize their trading decisions. Among these tools, the Order Block and Breaker Block hold a significant place, serving as effective instruments for analyzing market structure.
🟣 Order Block
An Order Block refers to zones on a chart where large financial institutions and high-volume traders place their orders. Due to the substantial volume of buy or sell orders in these areas, they are often regarded as pivotal points for potential price reversals or temporary pauses in a trend. Order Blocks are particularly crucial when prices react to these zones after a strong market move, acting as strong support or resistance levels.
🟣 Breaker Block
On the other hand, a Breaker Block refers to areas on a chart that previously functioned as Order Blocks but where the price has managed to break through and continue in the opposite direction. These zones are typically recognized as key points where market trends might shift, helping traders identify potential reversal points in the market.
🟣 Overlapping Block (BBOB)
Now, imagine a scenario where these two essential concepts in technical analysis—Order Blocks and Breaker Blocks—overlap on a chart. Although this overlap is not specifically discussed within the ICT (Inner Circle Trader) trading framework, exploring and utilizing this overlap can provide traders with powerful insights into strong support and resistance zones. The combination of these two robust concepts can highlight critical areas in trading, potentially offering significant advantages in making informed trading decisions.
In this article, we will delve into the concept of this overlap, explaining how to utilize it in trading strategies. Additionally, we will analyze the potential outcomes and benefits of incorporating this concept into your trading decisions.
Bullish Overlapping Block (BBOB) :
Bearish Overlapping Block (BBOB) :
🔵 How to Use
The overlap between Order Blocks and Breaker Blocks is a compelling and powerful concept that can help traders identify key levels on the chart with a high probability of success. This overlap is particularly valuable because it combines two well-regarded concepts in technical analysis—zones of high order volume and critical market shifts.
🟣 Here’s how to effectively use this overlap in your trading
1. Dentifying the Overlapping Block : To make the most of the overlap between Order Blocks and Breaker Blocks, begin by identifying these zones separately. Order Blocks are areas where price typically reacts and reverses after a strong market move.
Breaker Blocks are areas where a previous Order Block has been breached, and the price continues in the opposite direction. When these two zones overlap on a chart, it’s crucial to pay close attention to this area, as it represents a high-probability reaction zone.
2. Analyzing the Overlapping Block : After identifying the overlap zone, carefully analyze price action within this region. Candlestick patterns and price behavior can provide essential clues.
If the price reaches this overlap zone and strong reversal patterns such as Pin Bars or Engulfing patterns are observed, it’s likely that this zone will act as a pivotal reversal point. In such cases, entering a trade with confidence becomes more feasible.
3. Entering the Trade : When sufficient signs of price reaction are present in the overlap zone, you can proceed to enter the trade. If the overlap zone is within an uptrend and bullish reversal signals are evident, a long position might be appropriate.
Conversely, if the overlap zone is in a downtrend and bearish reversal signals are observed, a short position would be more suitable.
4. Risk Management : One of the most critical aspects of trading in overlap zones is managing risk. To protect your capital, place your stop loss near the lowest point of the Order Block (for buy trades) or the highest point (for sell trades). This approach minimizes potential losses if the overlap zone fails to hold.
5. Price Targets : After entering the trade, set your price targets based on other key levels on the chart. These targets could include other support and resistance zones, Fibonacci levels, or pivot points.
Bullish Overlapping Block :
Bearish Overlapping Block :
🟣 Benefits of the Overlapping Block Between Order Block and Breaker Block
1. Enhanced Precision in Identifying Key Levels : The overlap between these two zones usually acts as a highly reliable area for price reactions, increasing the accuracy of identifying entry and exit points.
2. Reduced Trading Risk : Given the high importance of the overlap zone, the likelihood of making incorrect decisions is reduced, contributing to overall lower trading risk.
3. Increased Probability of Success : The overlap between Order Blocks and Breaker Blocks combines two powerful concepts, enhancing the likelihood of success in trades, as multiple indicators confirm the importance of the area.
4. Creation of Better Trading Opportunities : Overlap zones often provide traders with more robust trading opportunities, as these areas typically represent strong reversal points in the market.
5. Compatibility with Other Technical Tools : This concept seamlessly integrates with other technical analysis tools such as Fibonacci retracements, trend lines, and chart patterns, offering a more comprehensive market analysis.
🔵 Setting
🟣 Global Setting
Pivot Period of Order Blocks Detector : Enter the desired pivot period to identify the Order Block.
Order Block Validity Period (Bar) : You can specify the maximum time the Order Block remains valid based on the number of candles from the origin.
Mitigation Level Order Block : Determining the basic level of a Order Block. When the price hits the basic level, the Order Block due to mitigation.
Mitigation Level Breaker Block : Determining the basic level of a Breaker Block. When the price hits the basic level, the Breaker Block due to mitigation.
Mitigation Level Overlapping Block : Determining the basic level of a Overlapping Block. When the price hits the basic level, the Overlapping Block due to mitigation.
🟣 Overlapping Block Display
Show All Overlapping Block : If it is turned off, only the last Order Block will be displayed.
Demand Overlapping Block : Show or not show and specify color.
Supply Overlapping Block : Show or not show and specify color.
🟣 Order Block Display
Show All Order Block : If it is turned off, only the last Order Block will be displayed.
Demand Main Order Block : Show or not show and specify color.
Demand Sub (Propulsion & BoS Origin) Order Block : Show or not show and specify color.
Supply Main Order Block : Show or not show and specify color.
Supply Sub (Propulsion & BoS Origin) Order Block : Show or not show and specify color.
🟣 Breaker Block Display
Show All Breaker Block : If it is turned off, only the last Breaker Block will be displayed.
Demand Main Breaker Block : Show or not show and specify color.
Demand Sub (Propulsion & BoS Origin) Breaker Block : Show or not show and specify color.
Supply Main Breaker Block : Show or not show and specify color.
Supply Sub (Propulsion & BoS Origin) Breaker Block : Show or not show and specify color.
🟣 Order Block Refinement
Refine Order Blocks : Enable or disable the refinement feature. Mode selection.
🟣 Alert
Alert Name : The name of the alert you receive.
Alert Overlapping Block Mitigation :
On / Off
Message Frequency :
This string parameter defines the announcement frequency. Choices include: "All" (activates the alert every time the function is called), "Once Per Bar" (activates the alert only on the first call within the bar), and "Once Per Bar Close" (the alert is activated only by a call at the last script execution of the real-time bar upon closing). The default setting is "Once per Bar".
Show Alert Time by Time Zone :
The date, hour, and minute you receive in alert messages can be based on any time zone you choose. For example, if you want New York time, you should enter "UTC-4". This input is set to the time zone "UTC" by default.
🔵 Conclusion
The overlap between Order Blocks and Breaker Blocks represents a critical and powerful area in technical analysis that can serve as an effective tool for determining entry and exit points in trading.
These zones, due to the combination of two key concepts in technical analysis, hold significant importance and can help traders make more confident trading decisions.
Although this concept is not specifically discussed in the ICT framework and is introduced as a new idea, traders can achieve better results in their trades through practice and testing.
Utilizing the overlap between Order Blocks and Breaker Blocks, in conjunction with other technical analysis tools, can significantly improve the chances of success in trading.

Volume Gaps and ImbalancesThis Pine script indicator is designed to visually depict price inefficiencies, as identified by Volume Imbalances (VI) or Gaps. A Volume Gap is a scenario where the wicks of two successive candles don’t intersect, while an Imbalance occurs when only the wicks overlap, leaving the bodies apart. These zones of inefficiency frequently act as magnets for price, with the market striving rebalance in accordance with ICT principles.
Relevance:
Volume Gaps/Imbalances are zones of highly inefficient price delivery as per ICT concepts and represent a very strong draw to price. Price will often seek to rebalance those zones to ensure efficient price delivery. Consequently, these zones can provide good targets for entries in the opposite direction or take profit targets for previous entries in the direction of the Gap/Imbalance.
How It Works:
The indicator keeps track of all Gaps/Imbalances from the beginning of the available history. It automatically removes all mitigated Gaps/Imbalances, which are situations where the price has at least reached the bottom of a bullish gap or the top of a bearish gap.
On the last bar, the most recent valid gaps are highlighted with a box drawn from the start to the end of the gap. The start of a bullish gap is determined by the highest price of the previous candle’s open or close, while for bearish gaps, it’s the lowest price of the previous candle’s open or close. Conversely, the end of a bullish gap is the lowest price of the current candle’s open or close, and for bearish gaps, it’s the highest price of the current candle’s open or close.
To enhance the indicator’s speed and minimize chart noise, only the most recent gaps will be displayed, up to the limit set in the indicator settings.
Each displayed VI/GAP will indicate the size of the imbalance in ticks. For imbalances greater than 3 ticks, which represent stronger draws of liquidity, the color transparency will be reduced, and the text will be made more prominent. Volume Gaps are also marked with a 🧲 emoji for easy visual identification.
The indicator will automatically extend the boxes representing valid imbalances to the current bar for as long as the imbalance is not mitigated.
If an imbalance has been tapped, but not mitigated, the indicator will append 🚩emoji to denote that the imbalance has been partially mitigated and may no longer have as strong of a draw for price.
Configurability:
A user may configure the number of imbalances to show, the setting applies to bullish/bearish imbalances individually. This setting can be set to any value from 1 – 50.
Appearance wise, color, style and color transparency of each box representing an imbalance can be configured. The imbalance box label can be configured by setting the text size, along with the vertical & horizontal alignment.
What makes this indicator different:
Designed with high performance in mind, to reduce impact on chart render time.
Only keeps valid imbalances on the chart, with a limit on the # drawn
Indicates the size of the gap and provides visual markets to denote stronger, weaker and partially mitigated gaps

Propulsion Blocks | Flux Charts💎 GENERAL OVERVIEW
Introducing our new Propulsion Blocks indicator! This new indicator can find & render ICT's propulsion blocks in the current ticker. It's highly customizable with detection, invalidation and style settings. For more information, please visit the "HOW DOES IT WORK ?" section.
Features of the new Propulsion Blocks indicator :
Render Bullish & Bearish Propulsion Blocks
Customizable Algorithm
Enable / Disable Historic Zones
Visual Customizability
📌 HOW DOES IT WORK ?
Order blocks occur when there is a high amount of market orders exist on a price range. It is possible to find order blocks using specific formations on the chart. One of which this indicator uses requires a large engulfing candlestick right after another one of the opposite direction. Then if the price comes back to retest the area that two candlesticks create, then it's an order block pattern.
Propulsion blocks are a specific type of order block used in the trading methodology. They build on the concept of order blocks and aim to identify potential areas for strong price movements. They are detected when a candlestick wicks to any existing order block, retesting it. Then a strong momentum in the direction of the order block is needed for the propulsion block to get created. Check this example :
You can use them as entry / exit points, or for confirmations for your trades. For example, a successful retest attempt to a bullish propulsion block might hint a strong bullish momentum. This indicator works best when used together with other ICT concepts.
🚩UNIQUENESS
Propulsion blocks can help traders identify key levels in a chart, and can be used mainly for confirmation. This indicator can identify and show them automatically in your chart, and provides customization settings for order & propulsion block detection and invalidation. Another capability of the indicator is that it combines overlapping order & propulsion blocks so you will have a clean look at the chart without any overlapping zones.
⚙️SETTINGS
1. General Configuration
Show Historic Zones -> This setting will hide invalidated propulsion blocks if enabled.
Max Distance To Last Bar -> This setting defines the maximum range that the indicator will find propulsion blocks to the past. Higher options will make older zones visible.
Zone Invalidation -> Select between Wick & Close price for Order Block & Propulsion Block Invalidation.
Swing Length -> Swing length is used when finding order block formations. Smaller values will result in finding smaller order blocks.

Hourly Opening PriceThe Inner Circle Trader has noted that the Opening Price of every Hourly candle can be used in a Power Of 3 (PO3) context.
If Bullish, buy BELOW the hourly open.
If Bearish, sell ABOVE the hourly open.
The Power of 3 ICT model also know as "AMD" is a transformative trading strategy, ingeniously designed to streamline your time analyzing charts by focusing on three pivotal phases in market behavior: accumulation, manipulation, and distribution.
The ICT Power of Three Model dissects the market maker’s algorithm for price delivery into three pivotal actions: Accumulation, Manipulation, and Distribution. Accumulation involves smart money gathering positions before a price surge, while manipulation sees the market creating deceptive movements to trigger stops. Finally, distribution occurs as smart money offloads positions, often catching less informed traders off-guard. This strategy is a critical tool for traders to understand market makers’ maneuvers and to strategically position themselves in the market.
This indicator plots a line at the opening price of each hour and extends it on the chart for the duration of the hour. Each hour starts a new line.
You also have the option of extending the midnight opening price line across the entire trading day.

Investify360 ICT IndicatorThe Investify360 ICT Indicator is designed to follow the ICT (Inner Circle Trader) strategy. It provides essential buy and sell signals based on price movements relative to a simple moving average (SMA). The indicator is built to be beginner-friendly with clear labels and color-coded signals.
Key Features
Simple Moving Average (SMA):
The script calculates a simple moving average based on a user-defined period (length), defaulting to 14 periods. This moving average helps smooth out price data and identify trends.
Buy and Sell Signals:
Buy Signal: A buy signal is generated when the current price (src, defaulting to the close price) crosses above the SMA. This event is typically interpreted as a potential upward trend.
Sell Signal: A sell signal is generated when the current price crosses below the SMA. This event is often interpreted as a potential downward trend.
These signals are visually represented on the chart with up and down labels respectively.
Labels and Colors:
Buy Signal: Displayed with an up label (BUY) in green color.
Sell Signal: Displayed with a down label (SELL) in red color.
The colors for these signals can be customized through the script inputs (buyColor and sellColor).
Beginner-Friendly Labels:
To assist beginners, the script includes a label at the start of the chart indicating the position of the moving average line (MA Line). This label is shown on the first bar to clarify the purpose of the plotted line.
Plotting the Moving Average:
The SMA is plotted on the chart with a yellow line, making it easily distinguishable. The moving average line helps traders visualize the trend direction.

Market Structure (Intrabar) [LuxAlgo]The Market Structure (Intrabar) indicator is designed to automatically detect and highlight real-time intrabar market structures, a core component of the Smart Money Concepts methodology.
🔶 USAGE
The proposed indicator gives a detailed picture of the most recent candle lower timeframe trends, highlighting market structures within them.
This can be particularly useful to assess the price dynamic within the most recent candle. For example, we can see how pronounced a trend is by the number of opposite bullish/bearish market structures formed within the candle.
Users can select the intrabar timeframe of interest from the "Intrabar Timeframe" setting, using a timeframe significantly lower than the chart timeframe will return more intrabar candles and potentially more market structures.
🔹 Dashboard
Users have access to a dashboard returning useful statistics such as the number of formed CHoCH's and BOS's from the intrabar prices. These can be indicative of how predominant a trend is within the intrabar data or if there exist multiple trends.
🔶 DETAILS
Market structures allow determining trend continuations as well as trend reversals in the market through two distinct structures:
🔹 Change of Character (CHoCH)
A change of character (CHoCH) refers to a shift in the market behavior of a security that is driven by changes in the underlying supply and demand dynamics. CHoCH's are indicative of confirmed reversals.
🔹 Break of Structure (BoS)
The break of structure (BoS) refers to the point at which a key level of support or resistance is broken. BOS's are indicative of confirmed trend continuations.
🔶 SETTINGS
🔹Inside the Bar Market Structure
Intrabar Timeframe: Lower timeframe setting option, if set to 'Auto' the script will determine the lower timeframe based on the chart timeframe.
Intrabar Market Structure, Length: Toggles the visibility of the break of structures and change of characters. Length defines the detection length of the swing levels.
Intrabar Swing Levels: Toggles the visibility of the swing levels, including a color customization option for highs and lows.
Intrabar Statistics: Toggles the visibility of the dashboard. Some further statistical details are presented in the tooltips of the table cells
🔹 General
Market Structure Colors: Color customization option for the break of structure and change of character lines and labels.
Intrabar Candle Colors: Color customization option for intrabar candles.
Intrabar Candles Horizontal Offset: Adjusting the intrabar candles horizontal position
Dashboard: Dashboard position and size customization option
🔶 LIMITATIONS
Please note that seconds-based intervals are available for premium and professional plan holders, which implies that the seconds-based intervals usage of the indicator may not be available for all users depending on their subscription plan.
🔶 RELATED SCRIPTS
Smart-Money-Concepts
ICT-Concepts

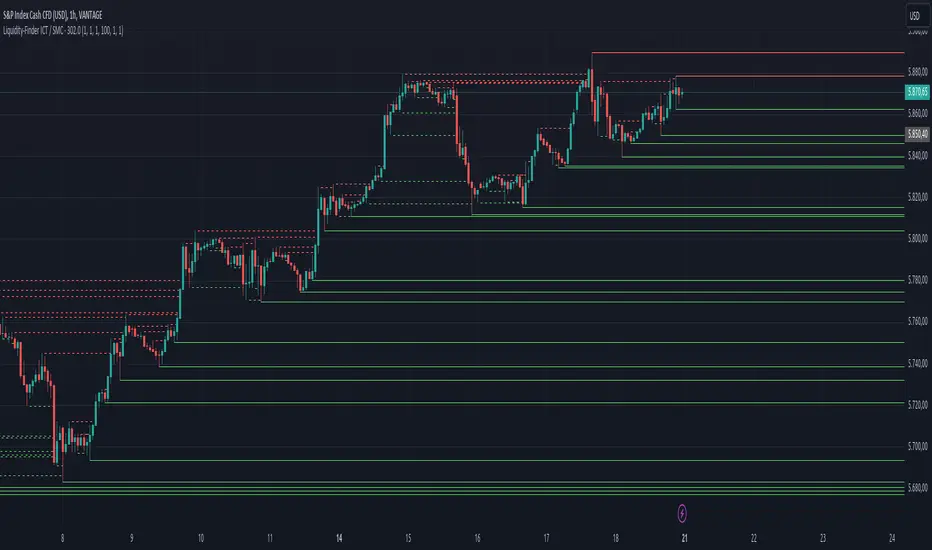
Liquidity-Finder ICT / SMCIn the context of ICT and the Smart Money Concept, liquidity is likely viewed as a crucial factor for determining the strength and sustainability of a market move. Smart Money is often associated with large institutional traders who have the ability to influence liquidity.
Liquidity Sweep:
A liquidity sweep in this context might involve Smart Money intentionally executing trades across various price levels to assess market depth and liquidity. This information can be used to identify potential areas of interest for Smart Money to initiate or exit positions without causing significant price disruptions.
Stop Hunt:
Stop hunting is a concept that Smart Money traders may employ to deliberately trigger stop orders in the market. By doing so, they can create temporary price movements that allow them to accumulate or liquidate positions at more favorable prices before the market reacts.
Smart Money Concept (SMC):
The Smart Money Concept revolves around the idea that large institutional traders (Smart Money) have superior information and resources compared to retail traders. Understanding the behavior of Smart Money, as taught in ICT and SMC, involves analyzing market dynamics, order flow, and liquidity to make more informed trading decisions.
Liquidating:
Liquidating refers to the process of selling or closing out existing positions. In the context of Smart Money, the term could imply that institutional traders are actively managing their positions, either taking profits or cutting losses strategically based on their analysis of market conditions.
The Indicator
The Indicator show open liquidity as solid lines and liquidates liquidity as dashed lines
Is able to send alerts for liquidity level was liquidated, liquidity level was dipped or the next close is on the other side
Session Sweeps [LuxAlgo]The Session Sweeps indicator combines ICT-based features for a complete trading methodology involving market sessions, market structure, and fair value gaps to find optimal entry conditions for trading price action.
Traders frequently tend to place stop/limit orders at the high and low points of major trading sessions such as Asian (Tokyo), European (London), and North American (New York), resulting in the establishment of liquidity pools at those particular levels. The Session Sweeps indicator is crafted to recognize and underscore occurrences of session sweeps or liquidity sweeps during these major trading sessions.
🔶 USAGE
Default settings utilize major forex trading sessions, yet users can select their preferred opening and closing times, rename the sessions, or adjust the colors. It's important to note that the specified times for each session align with the respective local timezones: Asian (Tokyo) UTC+9, European (London) UTC, and North American (New York) UTC-5.
If the price briefly crosses either the highest or lowest point of a market session. These movements, aiming at triggering stop losses, suggest potential shifts in the market direction. Detecting such movements is the fundamental purpose and core functionality of the script.
🔹Market Structure Shifts
A Market Structure Shift refers to a change in market direction, either from an uptrend to a downtrend or vice versa. A part of a common entry model when using session sweeps is waiting for the formation of a CHoCH after a session sweep.
🔹Fair Value Gaps
A Fair Value Gap (FVG) holds particular appeal for price action traders, emerging when there are inefficiencies or imbalances in the market, often a result of uneven buying and selling activity. The underlying concept of FVGs is that the market tends to revisit these inefficiencies before resuming its trajectory in alignment with the initial impulsive move.
After the formation of a CHoCH traders can enter a position when the price enters the area of a Fair Value Gap (FVG).
🔹Setup Examples
This entry setup is commonly used by ICT traders and is shared for informational & educational purposes only.
Long Positions (5-Minute Timeframe):
Wait for the previous session's low to be swept.
Look for a Bullish Choch.
Find a Bullish FVG formed by or before the Choch.
Entry Point: At the FVG.
Take Profit (TP): At the session high or aim for a 1:2 Risk-Reward Ratio.
Stop Loss (SL): At the session low or nearest Swing Low.
Take partial profits at intermediate swings, but don’t shift SL prematurely.
Short Positions (5-Minute Timeframe):
Wait for the previous session's high to be swept.
Look for a Bearish Choch.
Find a FVG formed by or before the Choch.
Entry Point: At the FVG.
Take Profit (TP): At the previous session's low or aim for a 1:2 RR.
Stop Loss (SL): At the session high or nearest Swing High.
Take partial profits at intermediate swings, but don’t shift SL prematurely.
🔶 SETTINGS
🔹Session Sweeps
Buyside Sweep Zones, Color, and Margin: toggles the visibility of bullside sweep zones, customizes the associated color, and sets the margin value defining the range of a bullside sweep zone.
Sellside Sweep Zones, Color, and Margin: toggles the visibility of sell-side sweep zones, customizes the associated color, and sets the margin value defining the range of a sell-side sweep zone.
Sweep Margin Length: specifies the maximum allowed length of a sweep zone invalidation, the length over which the price slightly invalidated the margin range.
Detect Sweeps Once per Session: if enabled will detect only once a sweep zone within a session.
Hide Fake Sweep Zones, and Color: controls the visibility and color of the fake sweep zones.
🔹Sessions
Session (Asia, London, New York AM, and New York PM), Start Time, and End Time: enables or disables the visibility of the named market session range, and customization of the session hours.
Color: color customization option of the named session.
Extend Max/Min: extends the highest and lowest price levels of the named session until the end of the next enabled session. This option is recommended to be enabled when sweep zone detection is activated to observe the relationship between the sweep zone and previous session extreme levels.
Extend Mid: extends the mean price levels of the named session until the end of the next enabled session. The extended line may serve as potential support and resistance levels.
Fill: enables/disables background coloring of the named session.
New York DST | London DST: enabling this option initiates Daylight Saving Time (DST) for New York or London. Note: Daylight Saving Time is not applied to the Asian (Tokyo) session.
Sessions Extreme Lines | Sessions Names: toggles the visibility of the highest and lowest price levels, as well as the names, for all market sessions.
Session Lines Width: sets the width of the lines for all sessions.
Session Fill Transparency: sets the background color transparency of the range for all sessions.
🔹Market Structure Shifts
Market Structure Shifts: toggles the visibility of market structure shifts, also known as change of character (CHoCH).
Detection Length: specifies the detection length.
Market Structure Shifts; Bull & Bear: color customization options.
🔹Fair Value Gaps
Fair Value Gaps: toggles the visibility of the fair value gaps.
Fair Value Gap Width Filter: specifies the filtering multiplier; additional details can be found in the tooltip of the respective input option.
Bullish & Bearish Imbalance: color customization options.
🔹Sessions Tabular View
Sessions Tabular View: toggles the visibility of the tabular view of the sessions, displaying date &time, status, and countdown counter.
Hide if not Forex Market Instrument: checks the market and automatically enables/disables the option based on the market instrument.
Table Text Size & Position: size and placement customization options
🔶 LIMITATIONS
Please be aware that fair value gap filtering cannot be applied to the initial 144 candles (with a fixed-length ATR) as the ATR value necessary for filtering won't be available during this period.
🔶 RELATED SCRIPTS
Buyside-Sellside-Liquidity
Sessions
Liquidity-Voids-FVG
Thank you to our community for the recommendation of this script. To explore additional conceptual scripts and related content, we invite you to visit >>> LuxAlgo-Scripts .

itradesize /\ IPDA Look Back - for any timeframeThe script automatically calculates the 20-40-60 look-back periods and their premium and discount ranges.
The base concept is from ICT’s IPDA which should be applied to the daily timeframe but now you can use that same concept on the lower timeframes .
The higher the timeframes you use the more reliable it will be ( when we are talking about lower timeframes than Daily ).
- With the use of the indicator you can apply it on any timeframe with ease.
- You can customize the coloring of premium & discount, frame lines, and even the look of it.
- Hide or show the EQ levels
Below the IPDA texts the indicator shows the actual percentage of the selected range based on the current price fluctuations.
The script handles the 20-40-60 days look-back as fractals so it can be applied on lower timeframes.
The basics:
- The Interbank Price Delivery Algorithm (IPDA): The algorithm creates a shift on the daily chart every 20, 40, and 60 trading days.
- These are the IPDA look-back periods. Every 20 trading days or so there is a new liquidity pool forming on both sides of the market based on ICT concepts.
- Determine the IPDA Data Range of the land 20 trading days.
- Note the highest high & lowest low in the past 20 trading days. Identify the institutional order flow and mark the relevant PD arrays in the selected IPDA look-back period we deemed useful for our trading style.
- This is your current dealing range.
- If the price consolidates for 20 days, consider switching to a 40-day look back.
Inside this dealing range, we look for the next draw on liquidity. Is it reaching for a liquidity pool or is it looking to rebalance at a particular PD Array. This is going to the Bias.
Which IPDA data range should you use?
IPDA20 can be our Short Term range - fit for intraday traders at most
IPDA40 can be our Swing Trade range - have a clear indication of the market profile
IPDA60 can be our range for position trading - have a clear indication of the market profile

One Setup for Life ICTGuided by ICT tutoring, I create this versatile 'One Trading Set Up For Life' indicator
This indicator shows a different way of viewing the "Highs and Lows" of Previous Sessions, drawing from the current day until 09:30 AM, the time at which the Highs and Lows of the previous day's sessions can be taken into consideration for a Reversal or for a Take profit.
Levels tested after 9.30am will be blocked so you have a good and clear view of the levels affected
Timing Session =
London: 02:00 to 05:00
New York: 9.30am to 12.30pm
Lunch: 12.30pm to 1pm
PM Session: 1.30pm to 4pm
The user has the possibility to:
- Choose to view sessions or not
- Choose to show levels from previous sessions
- Choose to show today's session levels
- Choose between 08:30 and 09:30 the starting time for the Liquidity taken
- Choose to view High and Low only from the previous day
- See both the name of the Sessions and the price of the levels
The indicator must be used as ICT shows in its concepts, the indicator takes into consideration both previous sessions and today's sessions, and the session levels can be used both for a reversal and for a possible Take Profit like the example here under
Reversal =
Possible Take Profit =
If something is not clear, comment below and I will reply as soon as possible.

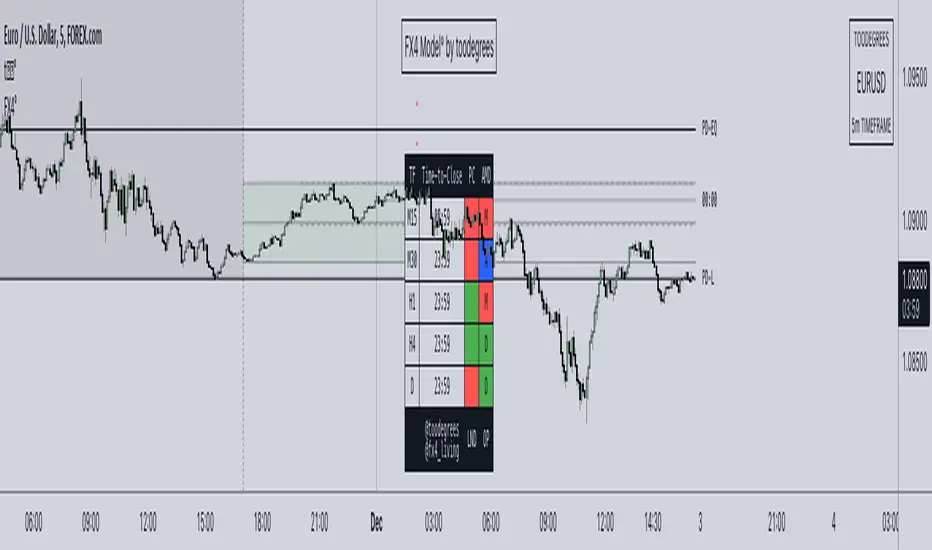
FX4Model° [fx4_living x toodegrees]Introducing the FX4 Model, an advanced automated trading framework designed to optimize your trading positions made by the trader fx4_living. This model integrates the previous day's high and low, and half of that range, to identify premium and discount zones.
The FX4 Model incorporates the ICT Asian range, spanning from 20:00 (New York time) to the midnight open. This period constitutes part of the day's accumulation range, during which a large volume of orders is processed. This implies that the high and low of this range are perceived as crucial liquidity pool zones.
The FX4 Model features a time-based dashboard. This dashboard presents key information such as the close of the previous candle. It also indicates the remaining time before certain significant candle closes (price and time).
With this tool, you gain a robust trading framework that empowers you to capitalize on profitable trading opportunities.
The FX4 accumulation range spans from the previous day's close to 2 AM New York local time. This range is part of the day's accumulation period, during which a lot of orders are triggered. Therefore, the high and the low of this range are seen as vital liquidity pool zones.
The ICT midnight open is marked with a vertical line at 00:00. This refers to the opening price of a financial instrument at midnight New York time. This opening price is significant as it serves as a reference point for trading strategies.
Time-To-Close Dashboard
This outstanding Dashboard displays the Time Frame and its "Time-To-Close".
It shows the Previous Candle Close (Bullish or Bearish).
The Time will appear in Red when there's 5 minutes left before the candle closes.
Previous Day Range (High-Low + 50%)
The previous day's high and low (PD) ranges can be leveraged in your trading strategy for the current day, using them as reference points for potential trading opportunities. The 50% division creates premium and discount zones within the previous day's range. If the price is in the discount zone, you should look for a buy opportunity, whereas if the price is in the premium zone, a sell opportunity should be considered.
FX4 Accumulation Range (High-Low + 50%)
The accumulation range's high and low points provide the most recent liquidity zone for the current day. These points can be used as reference points for potential trading opportunities. The 50% division here also creates premium and discount zones within the accumulation range. If the price is in the discount zone, a buy opportunity should be considered, and if the price is in the premium zone, a sell opportunity should be considered.
Other features:
Automatic Time Zone: As the title suggests, the automatic time zone feature means that you'll never need to adjust any GMT or hour settings. Everything updates automatically, even if you don't live on the East Coast of the United States.
Automatic Dark/Light Mode All graphics will automatically adapt their color based on your background. There's no need to tweak any settings; they're designed to provide consistent visuals.
itradesize /\ Overnight Session & Silver BulletOvernight Session & Silver Bullet indicator
The indicator can be divided into two separate stuff:
ONS ( Overnight Session ) based on TCM’s ( TheCurrencyMerchant ) theory and Silver Bullet based on what ICT ( InnerCircleTrader ) is teaching to us.
Overnight Session
• ONS will be always based on Chicago 4am to 8am time according to TCM’s CME teaching.
The indicator has the option to show TSO ( Today’s session only ) which is good to have the chart not messed up by it. At this time when it comes to backtesting just turn this off to have the past ONS and SB ranges showed up on your chart.
• Mid line at the ONS range is useful to have as you are able to decide wether price is in a premium or a discount under the ONS.
If Im a buyer target is above the range, if Im a seller target is below the range.
• You are also able to have SD ( Standard Deviation ) lines for price projections. In the variety of TCM’s videos you are able to have a deeper knowledge.
• You can also extend Today’s ONS lines to the very end of the chart which could make an easier looking on the levels you eyeing with.
Silver Bullet
It’s based on New York time as ICT ( Inner Circle Trader ) is always teaching to us that we should use New York time, every time when it comes to his concepts.
Silver Bullets are always be there aiming of an opposing liquidity pool. They are working even on choppy days.
Silver Bullet hours:
• 03:00 - 04:00am NY Time
• 10:00 - 11:00am NY Time
• 02:00 - 03:00pm NY Time
SB highlighted areas could be shown as a box or a range according to your taste, with or without Start/End lines.
Both of them ca be used to form trades.
You should dig yourself into Silver Bullet ( InnerCircleTrader ) and Overnight Session ( TheCurrencyMerchant ) teachings before the use of the indicator.
Simple setups
• Silver Bullet
Look 20-30 minutes before any SB where the Buy or Sell program has started.
Where the first 1m FVG ( Fair Value Gap ) appears under the range, enter the trade.
Expect only a 5 handle move as a beginner.
1m chart is a must for these kind of FVG entries. ( 30s , 15s can also be used )
• ONS
Price is trading aggressively out of the range to take liquidity.
Once price grabbed liquidity that candle on the 3-5m could considered as on order block for the further movement.
If you are trading in the range, then the opposite side can be the target, if its out of the range and trading one sided, then use standard deviations as 0.5 is a minimum target.

Seasonal Open Interest° by toodegreesDescription:
The Open Interest (OI) is a valuable metric that gets released at the end of each trading day. This metric represents the number of outstanding futures contracts held by market participants for a given commodity or market
The concept of utilizing the OI data as a strategic trading tool was first introduced by Larry Williams :
Rise in Price + Rise in OI: strong trend – new money is coming into the market, showing aggressive buying activity
Rise in Price + Decline in OI: weakening trend – less money coming into the market, suggesting that the move is likely to reverse lower
Decline in Price + Decline in OI: strong trend – new money is coming into the market, showing aggressive selling activity
Decline in Price + Rise in OI: weakening trend – less money coming into the market, suggesting that the move is likely to reverse higher
The Inner Circle Trader (ICT) expanded on these ideas, by exposing Smart Money's behaviour:
Rise in Price + Rise in OI: shorts are being stopped out, and new sellers take their place – gradually, longs get stronger and shorts get weaker
Rise in Price + Decline in OI: Smart Money longs are taking profit and liquidating their positions, and weak shorts are exiting the market
Decline in Price + Decline in OI: longs are being stopped out, and new buyers take their place – gradually, shorts get stronger and longs get weaker
Decline in Price + Rise in OI: Smart Money shorts are taking profit and liquidating their positions, and weak longs are exiting the market
Further, ICT showed the importance of OI in consolidations at Institutional Support or Resistance levels:
Consolidation + Rise in OI: bearish sign due to Smart Money is playing the short side and accumulating positions
Consolidation + Decline in OI: bullish sign due to Smart Money covering their short positions
Last but not least, the Seasonal Open Interest shows us a historical reference point of how OI usually, but not always, develops over the trading year.
Depending on the narrative, a higher/lower OI than its Seasonal Tendency can provide an incredible edge by pointing traders towards what side Smart Money is taking.
The Open Interest Meter shows you a visual representation of how many Standard Deviations the Open Interest is deviating from its Seasonal Tendency.
You can also display this visually as a shaded area between the two metrics:
Features:
Plot Open Interest Data
Plot the Seasonal Open Interest for a specific year
See the OI vs. Seasonal OI in a tailored meter
Shade the area between the OI and the Seasonal OI based on their difference

neXt Macros - Killzones [cognyto]The MACRO indicator is a valuable tool for traders who want to develop consistency and believe that major macroeconomic events occur at certain times of the day that can affect the market. By showing macro times in advance, allowing alerts to be triggered, and showing previous macros that have occurred, the MACRO indicator provides traders with the information they need to make more informed trading decisions that can be used in conjunction with their own strategies.
What is a MACRO?
A MACRO is a concept introduced by Micheal Huddleston, known as ICT, the -Inner Circle Trader- and he is the one to thank for. It represents some short periods of time during the day that can be used as an advantage for trading due to major economic events, or when the price reaches a certain level of relevance. The indicator is a tool that visually highlights these important periods in advance.
Some of the features of the MACRO indicator are:
The indicator highlights IN ADVANCE the relevant segments of time during the day, known as MACROS. It allows the trader to monitor the price precisely at these times and potentially identify trading opportunities according to his own strategies. All Macro times in the indicator can be modified, enabled or disabled. It is likely that not all MACROS will be relevant to all instruments, so it is recommended that only those relevant to the trader's instrument or market preferences are enabled, disabled or the times adjusted. The News checkbox helps traders to visualise, in a different color, those macros where news are expected to be published and may cause unpredictable high volatility, so it is advisable to have high precautions or as suggested by ICT: "DO NOT TRADE DURING THOSE TIMES OR DAYS !!! " Please note that this feature is optional to be used but certainly has to be updated on a daily basis, since not all days occur the same news events.
In addition to this, it also allows the trader to set the number of minutes that alerts are to be triggered before the start of the next MACRO. This feature allows traders to review, analyse and trade ONLY during MACRO times and prevent them from constantly monitoring the screen. This feature can be of great value to those who need the discipline to gain consistency and only trade when the time is relevant. Please note that the alerts are not triggered by the indicator, this can only be done through TradingView. The checkbox only indicates that the trader wishes to receive alerts of those MACRO times that are enabled. Therefore, it is HIGHLY SUGGESTED to set the alerts in TradingView to the 1 minute timeframe in order to have the required precision for alarming.
Finally, the MACRO indicator also displays previous macros that have occurred in the last few days and with severe settings that allow the trader to precisely implement different strategies. This feature allows traders to back test and analyse the relevance of past macros. By understanding how the market has reacted to similar events in the past, traders can make more informed decisions about how to trade current and future events.
Remember that your cognitive balance is essential and this indicator aims to help you manage your TIME and reduce anxiety by sticking to your rules.
This indicator is for informational purposes only and you should not rely on any information it provides as legal, tax, investment, financial or other advice. Nothing provided by this indicator constitutes a solicitation, recommendation, endorsement or offer by cognyto or any third party service provider to buy or sell any securities or other financial instruments in this or any other jurisdiction in which such solicitation or offer would be unlawful under the securities laws of such jurisdiction.
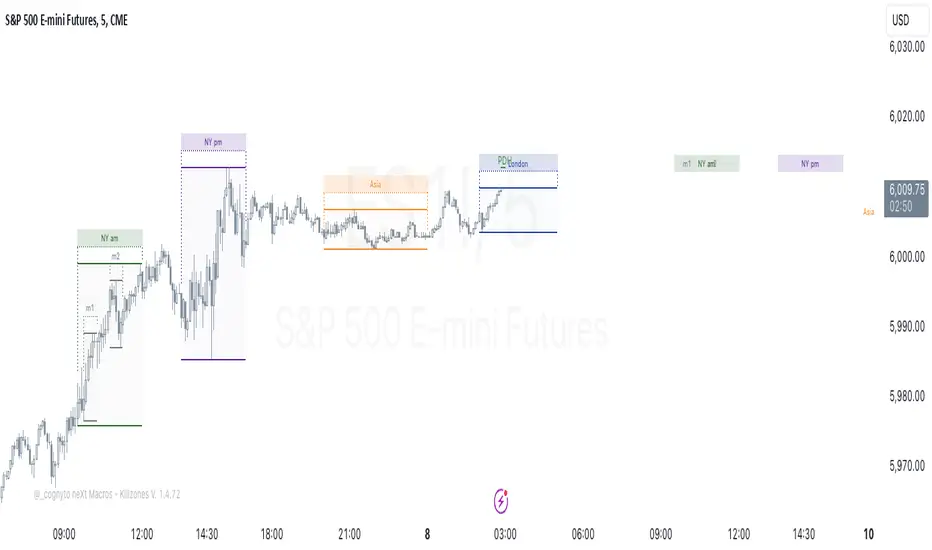
Market Structure & Liquidity: CHoCHs+Nested Pivots+FVGs+Sweeps//Purpose:
This indicator combines several tools to help traders track and interpret price action/market structure; It can be divided into 4 parts;
1. CHoCHs, 2. Nested Pivot highs & lows, 3. Grade sweeps, 4. FVGs.
This gives the trader a toolkit for determining market structure and shifts in market structure to help determine a bull or bear bias, whether it be short-term, med-term or long-term.
This indicator also helps traders in determining liquidity targets: wether they be voids/gaps (FVGS) or old highs/lows+ typical sweep distances.
Finally, the incorporation of HTF CHoCH levels printing on your LTF chart helps keep the bigger picture in mind and tells traders at a glance if they're above of below Custom HTF CHoCH up or CHoCH down (these HTF CHoCHs can be anything from Hourly up to Monthly).
//Nomenclature:
CHoCH = Change of Character
STH/STL = short-term high or low
MTH/MTL = medium-term high or low
LTH/LTL = long-term high or low
FVG = Fair value gap
CE = consequent encroachement (the midline of a FVG)
~~~ The Four components of this indicator ~~~
1. CHoCHs:
•Best demonstrated in the below charts. This was a method taught to me by @Icecold_crypto. Once a 3 bar fractal pivot gets broken, we count backwards the consecutive higher lows or lower highs, then identify the CHoCH as the opposite end of the candle which ended the consecutive backwards count. This CHoCH (UP or DOWN) then becomes a level to watch, if price passes through it in earnest a trader would consider shifting their bias as market structure is deemed to have shifted.
•HTF CHoCHs: Option to print Higher time frame chochs (default on) of user input HTF. This prints only the last UP choch and only the last DOWN choch from the input HTF. Solid line by default so as to distinguish from local/chart-time CHoCHs. Can be any Higher timeframe you like.
•Show on table: toggle on show table(above/below) option to show in table cells (top right): is price above the latest HTF UP choch, or is price below HTF DOWN choch (or is it sat between the two, in a state of 'uncertainty').
•Most recent CHoCHs which have not been met by price will extend 10 bars into the future.
• USER INPUTS: overall setting: SHOW CHOCHS | Set bars lookback number to limit historical Chochs. Set Live CHoCHs number to control the number of active recent chochs unmet by price. Toggle shrink chochs once hit to declutter chart and minimize old chochs to their origin bars. Set Multi-timeframe color override : to make Color choices auto-set to your preference color for each of 1m, 5m, 15m, H, 4H, D, W, M (where up and down are same color, but 'up' icon for up chochs and down icon for down chochs remain printing as normal)
2. Nested Pivot Highs & Lows; aka 'Pivot Highs & Lows (ST/MT/LT)'
•Based on a seperate, longer lookback/lookforward pivot calculation. Identifies Pivot highs and lows with a 'spikeyness' filter (filtering out weak/rounded/unimpressive Pivot highs/lows)
•by 'nested' I mean that the pivot highs are graded based on whether a pivot high sits between two lower pivot highs or vice versa.
--for example: STH = normal pivot. MTH is pivot high with a lower STH on either side. LTH is a pivot high with a lower MTH on either side. Same applies to pivot lows (STL/MTL/LTL)
•This is a useful way to measure the significance of a high or low. Both in terms of how much it might be typically swept by (see later) and what it would imply for HTF bias were we to break through it in earnest (more than just a sweep).
• USER INPUTS: overall setting: show pivot highs & lows | Bars lookback (historical pivots to show) | Pivots: lookback/lookforward length (determines the scale of your pivot highs/lows) | toggle on/off Apply 'Spikeyness' filter (filters out smooth/unimpressive pivot highs/lows). Set Spikeyness index (determines the strength of this filter if turned on) | Individually toggle on each of STH, MTH, LTH, STL, MTL, LTL along with their label text type , and size . Toggle on/off line for each of these Pivot highs/lows. | Set label spacer (atr multiples above / below) | set line style and line width
3. Grade Sweeps:
•These are directly related to the nested pivots described above. Most assets will have a typical sweep distance. I've added some of my expected sweeps for various assets in the indicator tooltips.
--i.e. Eur/Usd 10-20-30 pips is a typical 'grade' sweep. S&P HKEX:5 - HKEX:10 is a typical grade sweep.
•Each of the ST/MT/LT pivot highs and lows have optional user defined grade sweep boxes which paint above until filled (or user option for historical filled boxes to remain).
•Numbers entered into sweep input boxes are auto converted into appropriate units (i.e. pips for FX, $ or 'handles' for indices, $ for Crypto. Very low $ units can be input for low unit value crypto altcoins.
• USER INPUTS: overall setting: Show sweep boxes | individually select colors of each of STH, MTH, LTH, STL, MTL, LTL sweep boxes. | Set Grade sweep ($/pips) number for each of ST, MT, LT. This auto converts between pips and $ (i.e. FX vs Indices/Crypto). Can be a float as small or large as you like ($0.000001 to HKEX:1000 ). | Set box text position (horizontal & vertical) and size , and color . | Set Box width (bars) (for non extended/ non-auto-terminating at price boxes). | toggle on/off Extend boxes/lines right . | Toggle on/off Shrink Grade sweeps on fill (they will disappear in realtime when filled/passed through)
4. FVGs:
•Fair Value gaps. Represent 'naked' candle bodies where the wicks to either side do not meet, forming a 'gap' of sorts which has a tendency to fill, or at least to fill to midline (CE).
•These are ICT concepts. 'UP' FVGS are known as BISIs (Buyside imbalance, sellside inefficiency); 'DOWN' FVGs are known as SIBIs (Sellside imbalance, buyside inefficiency).
• USER INPUTS: overall setting: show FVGs | Bars lookback (history). | Choose to display: 'UP' FVGs (BISI) and/or 'DOWN FVGs (SIBI) . Choose to display the midline: CE , the color and the line style . Choose threshold: use CE (as opposed to Full Fill) |toggle on/off Shrink FVG on fill (CE hit or Full fill) (declutter chart/see backtesting history)
////••Alerts (general notes & cautionary notes)::
•Alerts are optional for most of the levels printed by this indicator. Set them via the three dots on indicator status line.
•Due to dynamic repainting of levels, alerts should be used with caution. Best use these alerts either for Higher time frame levels, or when closely monitoring price.
--E.g. You may set an alert for down-fill of the latest FVG below; but price will keep marching up; form a newer/higher FVG, and the alert will trigger on THAT FVG being down-filled (not the original)
•Available Alerts:
-FVG(BISI) cross above threshold(CE or full-fill; user choice). Same with FVG(SIBI).
-HTF last CHoCH down, cross below | HTF last CHoCH up, cross above.
-last CHoCH down, cross below | last CHoCH up, cross above.
-LTH cross above, MTH cross above, STH cross above | LTL cross below, MTL cross below, STL cross below.
////••Formatting (general)::
•all table text color is set from the 'Pivot highs & Lows (ST, MT, LT)' section (for those of you who prefer black backgrounds).
•User choice of Line-style, line color, line width. Same with Boxes. Icon choice for chochs. Char or label text choices for ST/MT/LT pivot highs & lows.
////••User Inputs (general):
•Each of the 4 components of this indicator can be easily toggled on/off independently.
•Quite a lot of options and toggle boxes, as described in full above. Please take your time and read through all the tooltips (hover over '!' icon) to get an idea of formatting options.
•Several Lookback periods defined in bars to control how much history is shown for each of the 4 components of this indicator.
•'Shrink on fill' settings on FVGs and CHoCHs: Basically a way to declutter chart; toggle on/off depending on if you're backtesting or reading live price action.
•Table Display: applies to ST/MT/LT pivot highs and to HTF CHoCHs; Toggle table on or off (in part or in full)
////••Credits:
•Credit to ICT (Inner Circle Trader) for some of the concepts used in this indicator (FVGS & CEs; Grade sweeps).
•Credit to @Icecold_crypto for the specific and novel concept of identifying CHoCHs in a simple, objective and effective manner (as demonstrated in the 1st chart below).
CHoCH demo page 1: shifting tweak; arrow diagrams to demonstrate how CHoCHs are defined:
CHoCH demo page 2: Simplified view; short lookback history; few CHoCHs, demo of 'latest' choch being extended into the future by 10 bars:
USAGE: Bitcoin Hourly using HTF daily CHoCHs:
USAGE-2: Cotton Futures (CT1!) 2hr. Painting a rather bullish picture. Above HTF UP CHoCH, Local CHoCHs show bullish order flow, Nice targets above (MTH/LTH + grade sweeps):
Full Demo; 5min chart; CHoCHs, Short term pivot highs/lows, grade sweeps, FVGs:
Full Demo, Eur/Usd 15m: STH, MTH, LTH grade sweeps, CHoCHs, Usage for finding bias (part A):
Full Demo, Eur/Usd 15m: STH, MTH, LTH grade sweeps, CHoCHs, Usage for finding bias, 3hrs later (part B):
Realtime Vs Backtesting(A): btc/usd 15m; FVGs and CHoCHs: shrink on fill, once filled they repaint discreetly on their origin bar only. Realtime (Shrink on fill, declutter chart):
Realtime Vs Backtesting(B): btc/usd 15m; FVGs and CHoCHs: DON'T shrink on fill; they extend to the point where price crosses them, and fix/paint there. Backtesting (seeing historical behaviour):
