FVG – (auto close + age) GR V1.0FVG – Fair Value Gaps (auto close + age counter)
Short Description
Automatically detects Fair Value Gaps (FVGs) on the current timeframe, keeps them open until price fully fills the gap or a maximum bar age is reached, and shows how many candles have passed since each FVG was created.
Full Description
This indicator automatically finds and visualizes Fair Value Gaps (FVGs) using the classic 3-candle ICT logic on any timeframe.
It works on whatever timeframe you apply it to (M1, M5, H1, H4, etc.) and adapts to the current chart.
FVG detection logic
The script uses a 3-candle pattern:
Bullish FVG
Condition:
low > high
Gap zone:
Lower boundary: high
Upper boundary: low
Bearish FVG
Condition:
high < low
Gap zone:
Lower boundary: high
Upper boundary: low
Each detected FVG is drawn as a colored box (green for bullish, red for bearish in this version, but you can adjust colors in the inputs).
Auto-close rules
An FVG remains on the chart until one of the following happens:
Full fill / mitigation
A bullish FVG closes when any candle’s low goes down to or below the lower boundary of the gap.
A bearish FVG closes when any candle’s high goes up to or above the upper boundary of the gap.
Maximum bar age reached
Each FVG has a maximum lifetime measured in candles.
When the number of candles since its creation reaches the configured maximum (default: 200 bars), the FVG is automatically removed even if it has not been fully filled.
This keeps the chart cleaner and prevents very old gaps from cluttering the view.
Age counter (labels inside the boxes)
Inside every FVG box there is a small label that:
Shows how many bars have passed since the FVG was created.
Moves together with the right edge of the box and stays vertically centered in the gap.
This makes it easy to distinguish fresh gaps from older ones and prioritize which zones you want to pay attention to.
Inputs
FVG color – Main fill color for all FVG boxes.
Show bullish FVGs – Turn bullish gaps on/off.
Show bearish FVGs – Turn bearish gaps on/off.
Max bar age – Maximum number of candles an FVG is allowed to stay on the chart before it is removed.
Usage
Works on any symbol and any timeframe.
Can be combined with your own ICT / SMC concepts, order blocks, session ranges, market structure, etc.
You can also choose to only display bullish or only bearish FVGs depending on your directional bias.
Disclaimer
This script is for educational and informational purposes only and is not financial advice. Always do your own research and use proper risk management when trading.
Cerca negli script per "ict"

MaxToro 1H Pivots HL + Sessions + Wick Detector + EMAs [v2.4]MaxToro 1H Pivots + Sessions + Wick Detector + EMAs — Indicator Description
The MaxToro 1H Pivots + Sessions + Wick Detector + EMAs indicator is a multi-tool market-structure system designed to highlight liquidity, wick imbalances, intraday session behavior, and dynamic trend direction. It combines several professional-grade tools into a single clean overlay.
Core Features
1. Automatic Pivot High/Low Mapping (1H-Style Labels)
Plots swing highs and lows using customizable left/right lengths.
Labels each pivot with the exact price for easy reference.
Helps identify structural shifts, liquidity zones, and trending environments.
2. Session Visualization (Tokyo, London, New York)
Highlights the three major trading sessions directly on the chart.
Custom session times (America/Chicago timezone).
Each session has a separate color for fast volatility recognition.
Ideal for traders using:
Time-of-day models
ICT Killzones
Session-based liquidity shifts
3. Wick Rejection Detector
This system identifies candles with abnormally large wicks, helping you detect:
Liquidity sweeps
Rejection zones
Stop hunts
Market inefficiencies
Features include:
Upper wick detections
Lower wick detections
Bar highlighting
Optional wick-range lines
Alerts for both upper and lower wick events
Perfect for spotting algorithmic manipulation and reversal zones.
4. EMA Trend Filters (20 / 50 / 100 / 200)
This version includes a full moving average suite:
EMA 20 → short-term momentum
EMA 50 → mid-term trend
EMA 100 → structure bias
EMA 200 → higher-timeframe trend anchor
Features:
Toggle on/off
Adjustable opacity
Clean color-coded lines
Works as dynamic support/resistance
Confluence with pivots & wick sweeps
5. Information Table
A corner-based info box shows wick conditions in real time:
Wick multiplier
Upper wick signal (true/false)
Lower wick signal (true/false)
Helps traders interpret candle behavior without scanning every bar.
What This Indicator Helps You Do
✔ Identify liquidity sweeps
Wick detector + pivot labels show where algorithms take out highs/lows.
✔ Improve directional bias
EMA 100/200 and pivot structure help confirm trend direction.
✔ Read session-driven volatility
You instantly see when price is entering or exiting high-volume killzones.
✔ Catch reversals early
Wick rejections highlight exhaustion, displacement setups, and trap candles.
✔ Trade with confidence
You always know:
Where pivots are
What session you’re in
Where major EMAs sit
Whether candles show aggressive wick pressure
Ideal For
ICT/SMC traders
Liquidity & sweep-based strategies
Session-based traders
Trend-followers or scalpers
Anyone using 1H pivots for intraday directional bias
Summary
This all-in-one indicator blends institutional concepts—liquidity mapping, wick manipulation, time-of-day behavior, and trend structure—to give you a complete picture of the market in one clean visual tool.
Perfect for mechanical execution and top-down confluence.

Smart Swing & Order Block Pro v1📌 Smart Swing & Order Block Pro v1
The Smart Swing & Order Block Pro v1 indicator is an advanced tool designed for traders who use Smart Money Concepts, institutional analysis, and deep market-structure reading. It combines precise Order Block detection, intelligent classification, reliable swing identification, and professional volume/delta filtering to deliver a clean, structured, and actionable view of price behavior.
🎯 Indicator Purpose
Provide a consistent, clean, and verifiable identification of institutional zones (OBs), their evolution over time, their break and mitigation events, and a complete structural reading of swings and trend direction.
This indicator replaces the typical noise found in standard OB tools with a robust system based on:
OBs validated by volume and delta
Dynamic OB classification (Extreme, Mitigated, Breaker, Intermediate)
Clean visual separation between intact and broken OBs
Accurate Swing High / Swing Low detection using dynamic pivots
Visual panels with quantitative swing and OB statistics
🧠 Key Features
1. Precision Order Block Detection
The indicator identifies bullish and bearish Order Blocks using a combination of:
Market structure
Validated breakouts
Optional filtering via relative volume (RVOL)
Normalized delta filtering to measure directional intent
This prevents low-quality or non-institutional OBs from being drawn.
2. Intelligent OB Classification
Each detected OB is automatically assigned a structural role:
🔹 Extreme OB
The origin point of a movement (up leg or down leg).
Crucial for spotting institutional footprints and major displacement zones.
🔹 Mitigated OB
An OB already tapped or partially consumed by price.
Useful for identifying weakened zones or controlled pullbacks.
🔹 Breaker OB
An OB broken by price in the opposite direction.
The box is visually split into two parts:
Left section → original OB color
Right section → breaker color
🔹 Intermediate OB
Active OBs that do not meet the criteria above.
3. Professional OB Visualization
OBs automatically extend to the right.
Broken OBs show a clear color split (intact vs. breaker).
Mitigated OBs update color automatically.
Extreme OBs are highlighted with a special color.
Automatic cleanup of boxes and lines for performance and clarity.
4. Ultra-Precise Swing Detection
Unlike standard swing indicators:
Uses configurable pivot strengths
Marks the exact candle that created the swing
Avoids excessive false signals
Draws clean swing-high and swing-low lines
Places crosses exactly when price breaks a swing
This results in a perfectly readable structure (HH, HL, LH, LL).
5. Dynamic Panels
The script includes two optional informational panels:
📊 Swing Panel
Displays:
Average bars between swing highs
Average bars between swing lows
Current trend based on structure (UP / DOWN / RANGE)
📉 OB Panel
Displays counts of:
Bullish Extreme
Bullish Mitigated
Bearish Extreme
Bearish Mitigated
Perfect for evaluating institutional strength and directional bias.
⚙️ Configurable Options
Swing strength (independent lookback for high/low)
Use of candle body vs. wicks
Volume/delta filter modes (Strict, Normal, Loose)
Toggle visibility of OBs, swings, and panels
Color themes per OB classification
Panel positioning (Top Left / Top Right)
🎨 Clean and Professional Visualization
The indicator focuses on:
Clarity
Structural accuracy
Immediate interpretability
Institutional-grade behavior
Real reaction zones
Nothing unnecessary, nothing noisy — just clean structure.
🚀 Who Is This Indicator For?
Ideal for traders using:
Smart Money Concepts (SMC)
ICT-style analysis
Wyckoff methodology
Order Flow
Swing trading based on structure
Algorithmic OB logic
Strategies based on breakers, traps, and displacement
Paneles gráficos informativos sobre swings y OB.
🧠 Funcionalidades Principales
1. Detección Precisa de Order Blocks (OB)
El indicador identifica OB alcistas y bajistas usando una combinación de:
Estructura de precio
Rupturas validadas
Filtro opcional por volumen relativo (RVOL)
Filtro por delta normalizado (direccionalidad del cuerpo de la vela)
Esto evita identificar OB sin relevancia institucional.
2. Clasificación Inteligente de OB
Cada OB detectado recibe una etiqueta automática según su importancia estructural:
🔹 Extreme
Es el OB origen del movimiento (up leg o down leg).
Fundamental para identificar desplazamientos fuertes y zonas institucionales críticas.
🔹 Mitigated
OB ya tocado, parcialmente consumido o con interacción del precio.
Ideal para detectar zonas debilitadas o retrocesos controlados.
🔹 Breaker
OB que fue roto por el precio en sentido contrario.
La caja se divide visualmente en dos colores:
Parte izquierda = color del OB original
Parte derecha = color de breaker
🔹 Intermediate
OB activos que aún no pertenecen a las categorías anteriores.
3. Visualización Profesional de Order Blocks
Los OB se extienden hacia la derecha.
Los breakers se dividen en color original y color de ruptura.
Los OB mit igados cambian automáticamente de color.
Los OB extremos destacan con un color especial.
Limpieza automática de cajas y líneas.
4. Swings Ultra Precisos
A diferencia del detector estándar de swings:
Usa pivotes configurables
Marca correctamente la vela que originó el swing
Evita el exceso de falsos positivos
Genera líneas limpias de swing high y low
Coloca cruces exactamente donde el precio rompe el swing
Esto permite medir estructura (HH, HL, LH, LL) de forma clara.
5. Paneles Dinámicos
El script incorpora dos paneles opcionales:
📊 Panel de Swings
Incluye:
Promedio de barras entre swings high
Promedio de barras entre swings low
Tendencia actual basada en estructura (UP / DOWN / RANGE)
📉 Panel de OB
Muestra conteos de:
Bullish Extreme
Bullish Mitigated
Bearish Extreme
Bearish Mitigated
Ideal para medir fuerza institucional y bias del mercado.
⚙️ Opciones Ajustables
Fuerza del swing (lookback independiente para high/low)
Uso del cuerpo/candlestick o mechas en la lógica
Filtro de volumen/delta (Strict, Normal, Loose)
Visualización de OB, Swings y Paneles
Estilos de color por cada tipo de OB
Posición de paneles (Top Left / Top Right)
🎨 Visualización Limpia y Profesional
El indicador prioriza:
Claridad
Estructura
Lectura inmediata
Comportamiento “institucional”
Zonas de reacción reales
No pinta elementos innecesarios y mantiene un diseño elegante y minimalista.
🚀 ¿Para quién está diseñado?
Ideal para traders que utilizan:
Smart Money Concepts
Wyckoff
Order Flow
ICT / SMC
Swing trading basado en estructura
Trading algorítmico basado en OB
Estrategias basadas en trampas y breakers

NQ vs ES SMT DivergencesAn algorithm for spotting SMT Divergences this is an ICT concept serving fellow ICT traders.

Extended Macros (NW)Extended Macros (NW)
Visual timing tool for ICT-style 33-minute macro periods
Designed to be used on intraday time frames (1min to 5min)
What It Does
Highlights ten 33-minute institutional timing windows throughout the trading day.
Each macro appears as a horizontal line in the lower pane during its active period.
The Concept
Based on ICT's numerological timing theory where markets deliver on 3-6-9 harmonics:
Start: :42 minutes (4+2 = 6)
End: :15 minutes (1+5 = 6)
Duration: 33 minutes (3+3 = 6)
The number 6 represents delivery and entry timing. Traders watch for 9 patterns (reversals) within these windows.
Macro Periods
2:42-3:15 AM | 3:42-4:15 AM
7:42-8:15 AM | 8:42-9:15 AM | 9:42-10:15 AM
10:42-11:15 AM | 11:42-12:15 PM
12:42-1:15 PM | 1:42-2:15 PM | 2:42-3:15 PM
How To Use
Monitor for setups as macros begin (:42)
Watch for momentum shifts as macros end (:15)
Combine with market structure and liquidity analysis
Designed to be used on intraday time frames (1min to 5min)
Features
Toggle individual periods on/off
Customizable color and line thickness
Non-repainting fixed-time display
Shows all periods ahead of price
Note: This is a timing reference tool. Use with proper analysis and risk management.

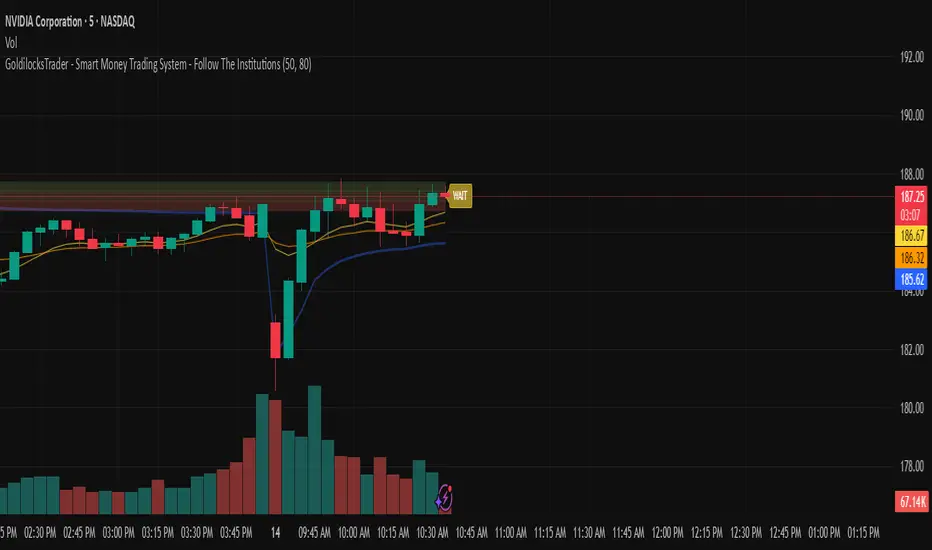
GoldilocksTrader – Institutional Zones + Smart Money Market ModeThe GoldilocksTrader – Smart Money Trading System is a powerful institutional-grade tool designed for traders who want to follow real liquidity, identify institutional zones, and accurately read Smart Money market structure.
This indicator automatically detects Supply & Demand Zones, plots Institutional Pivot Levels, builds dynamic fade-strength heatmaps, and labels the current Market Mode (ACCUMULATE, DISTRIBUTE, WAIT)—all powered by a clean, real-time algorithm that updates with every candle.
This system helps you understand where banks, hedge funds, and institutions are likely to defend price, accumulate positions, or engineer liquidity sweeps. It makes complex Smart Money concepts simple, visual, and trader-friendly.
🧠 Core Features
✔ Institutional Supply & Demand Zones (auto-detected from swing pivots)
✔ Smart Money fade-strength heatmap using multi-layered boxes
✔ Market Mode Detection:
• ACCUMULATE – Smart Money loading long positions
• DISTRIBUTE – Smart Money unloading into premium levels
• WAIT – Neutral / imbalance zones
✔ EMA 9/21 Trend Filters
✔ VWAP Institutional Bias Filter
✔ Nearest Above/Below Liquidity Zones with clean readability
✔ Adjustable Transparency & Zone Thickness
✔ Compact On-Chart Legend (optional)
✔ Extremely lightweight, low-lag, optimized for all markets/timeframes
✔ Works for Forex, Crypto, Stocks, Indices, Futures, Commodities
📈 Trading Concepts Covered
This indicator is built around world-class concepts used by top proprietary desks and Smart Money traders, including:
ICT (Inner Circle Trader) Supply/Demand
Liquidity Zones & Institutional Order Blocks
Wyckoff Accumulation / Distribution
Imbalance & Fair Value Behavior (FVG-style fades)
Market Maker Models (MMXM + Premium/Discount Zones)
Pivot-based liquidity mapping
VWAP Institutional Bias
Trend Continuation vs. Reversal Zones
If you trade SMC, ICT, Wyckoff, Smart Money, Algo-based models, or institutional liquidity, this indicator is a perfect companion.
🚀 How It Helps You Trade
🔹 Identify hidden institutional levels where real accumulation or distribution occurs
🔹 Avoid bad trades by staying out of “WAIT” zones where most of the retail market enters.
🔹 Time entries during premium vs. discount pricing
🔹 Understand where price is expected to react, reverse, or continue
🔹 Visualize institutional pressure with fade-strength heatmaps
🔹 Combine with your own strategy to increase precision and confidence
🎨 Clean, Professional Visualization
Zones auto-extend to the left for historical context
Fade opacity increases or decreases depending on zone strength
Market Mode label plotted dynamically near relevant price zones
Optional compact legend for fast reading
All elements can be toggled and customized to your style.
⭐ Created by GoldilocksTrader™
For more institutional-level tools—including the new and soon to be popular "GoldilocksTrader Buy-Sell Signals with Built-In Optimizer"—search:
👉 “GoldilocksTrader” on TradingView
👉 Visit GoldilocksTrader.com for premium systems & education
Follow the institutions.
Trade Smart.
Trade Goldilocks™..."it's just right"
High Volume Zones with Signals – HVZ█ OVERVIEW
"High Volume Zones with Signals – HVZ" is a technical analysis indicator that identifies High Volume Zones (HVZ) on the chart and draws them as fully customizable boxes. Perfect for traders using price action, ICT, and Smart Money Concepts. The indicator highlights key volume-based support/resistance levels, detects potential consolidation zones (very large candles), and generates precise breakout and exit signals. Flexible volume filters, ATR filter, and visual styling options ensure a clean and highly effective chart.
█ CONCEPTS
The indicator detects candles with volume significantly above the average (default ≥ 2× SMA of volume over 20 periods). Such candles often signal institutional activity and create strong supply/demand zones.
The ATR filter additionally identifies very large candles – frequently a sign of market capitulation (panic buying/selling). Within the range of such a candle, prolonged consolidation often occurs, especially on higher timeframes (e.g., 4H and above).
Why are HVZ important? High-volume zones are areas where the market has left a large number of orders – institutions return there to “refresh” liquidity before the next move. A breakout against the zone’s character triggers a Break signal:
- Bullish HVZ broken downward (close below the lower boundary) → Break Down (sell),
- Bearish HVZ broken upward (close above the upper boundary) → Break Up (buy).
Note: The indicator requires real exchange volume – it will not work correctly on instruments without reported volume (e.g., certain CFDs or forex).
█ FEATURES
- HVZ Detection: Automatic identification of high-volume zones with Volume SMA Length and Volume Multiplier filters; historical initialization up to 500 candles back.
- ATR Filter: Optional detection of very large candles (potential consolidation/capitulation) using - ATR Length and ATR Multiplier; three action modes:
Skip Zone – large candle creates no zone,
Separate Color – zone is drawn in a distinct style (gray by default),
Normal Zone – treated like a regular HVZ.
- Gray zones (large candles, Separate Color): generate exactly the same Break signals as regular zones – based solely on the original candle direction (bullish → Break Down on lower break, bearish → Break Up on upper break). Gray color is only a visual marker for potential consolidation/capitulation zones.
- Customizable Boxes: Separate styles for bullish and bearish zones (border color, background gradient, line thickness and style); adjustable background and 50 % midline transparency.
- Break & Exit Signals:
Break Up/Down – green/red triangle after a candle closes outside the zone (zone disappears, triangle remains as a trace).
Exit Up/Down – green/red circle when price leaves the zone without a full breakout.
Signal Type option: Break, Exit, or Both.
- Midline: Automatic dashed line at the 50 % zone level with independent transparency control.
- Chart Cleanup: Automatic removal of inactive zones older than 500 candles (max_boxes_count=500).
- Alerts: Built-in alerts for Break Up and Break Down with clear messages.
█ HOW TO USE
Add to Chart: Paste the script in Pine Editor or find it in TradingView’s indicator library.
Configure Settings:
- Volume Filter: Volume SMA Length (default 20) and Volume Multiplier (default 2.0) – higher multiplier = fewer but stronger zones.
- ATR Filter: Enable/disable, set ATR Length (14) and ATR Multiplier (3.5); choose action for very large candles (Skip Zone / Separate Color / Normal Zone).
- Box Style: Background transparency (90) and midline transparency (70).
- Bull/Bear Box Style: Border and gradient colors, line thickness (1-5).
- ATR Style: Separate colors for large-candle zones (gray by default).
- Signal Settings: Choose Signal Type (Break/Exit/Both) and signal colors.
Signal Interpretation:
- Break Up (green triangle below bar): Bearish HVZ broken upward → buy signal, continuation of uptrend.
- Break Down (red triangle above bar): Bullish HVZ broken downward → sell signal, continuation of downtrend.
- Exit Up/Down (circles): Price leaves zone without breakout – may signal end of correction or reversal setup.
- HVZ Zones: Price often returns to high-volume zones to clear orders. An unfilled zone remains a price magnet.
- 50 % Level (midline): Ideal target for partial take-profit or reaction point inside the zone.
Combine signals with other tools (e.g., RSI, MACD, higher timeframes) for higher confidence.
█ APPLICATIONS
- Price Action & ICT: HVZ act as dynamic S/R; in an uptrend look for buys after breaking a bearish HVZ, in a downtrend look for sells after breaking a bullish HVZ. If you trade retests instead of breakouts, increase Volume Multiplier to 2.5-3.0 – fewer zones but much stronger. Note that after breaking a very strong zone, price often pulls back deeply before continuing.
- Breakout Strategies: For maximum Break signals, lower Volume Multiplier to 1.5-1.8 – gives many high-quality entries in trending markets. Always trade in the direction of the prevailing trend (e.g., only longs in uptrends). Enter after a Break signal with confirmation from volume or momentum (MACD above zero, RSI >50 for longs, <50 for shorts).
█ NOTES
- The indicator requires real exchange volume – it will not function properly on instruments without reported volume (e.g., certain CFDs, forex).
- Always confirm signals with additional context (market structure, higher timeframe).

Smart VWAP FVG SystemSmart VWAP FVG System - Professional Multi-Filter Trading Indicator
📊 OVERVIEW
The Smart VWAP FVG System is an advanced multi-layered trading indicator that combines institutional volume analysis, multi-timeframe VWAP trend confirmation, and Fair Value Gap detection to identify high-probability trade entries. This indicator uses a sophisticated filtering mechanism where signals appear only when multiple independent confirmation criteria align simultaneously.
Recommended Timeframe: 5-minute (M5) or higher. The indicator works best on M5, M15, and M30 charts for intraday trading.
🎯 ORIGINALITY & PURPOSE
This indicator is original because it combines three distinct analytical methods into a unified decision-making system:
Market Profile Volume Analysis - Identifies institutional accumulation/distribution zones
Dual VWAP Filtering - Confirms trend direction using two independent VWAP calculations
Fair Value Gap Detection - Validates institutional interest through price inefficiency zones
The key innovation is the directional filter system: the primary Market Profile generates BUY-ONLY or SELL-ONLY states based on higher timeframe value area reversals, which then controls which signals from the main system are displayed. This creates a multi-timeframe confluence that significantly reduces false signals.
Unlike simple indicator mashups, each component serves a specific purpose:
Market Profile → Direction bias (trend filter)
Primary VWAP (Session) → Short-term trend confirmation
Secondary VWAP (Week) → Medium-term trend confirmation
FVG Detection → Institutional activity validation
🔧 HOW IT WORKS
1. Primary Market Profile Filter (Higher Timeframe)
The indicator calculates Market Profile on a higher timeframe (default: 1 hour) to determine the overall market structure:
Value Area High (VAH): Top 70% of volume distribution
Value Area Low (VAL): Bottom 70% of volume distribution
Point of Control (POC): Price level with highest volume
When price reaches VAH and reverses down → SELL-ONLY mode activated
When price reaches VAL and reverses up → BUY-ONLY mode activated
This higher timeframe filter ensures you're trading in the direction of institutional flow.
2. Dual VWAP System
Two independent VWAP calculations provide multi-timeframe trend confirmation:
Primary VWAP (Session-based): Resets daily, tracks intraday momentum
Secondary VWAP (Week-based): Resets weekly, confirms longer-term trend
Filter Logic:
BUY signals require: Price > Primary VWAP AND Price > Secondary VWAP
SELL signals require: Price < Primary VWAP AND Price < Secondary VWAP
This dual confirmation prevents counter-trend trades during ranging conditions.
3. Fair Value Gap (FVG) Detection
FVG zones identify price inefficiencies where institutional orders were executed rapidly:
Bullish FVG: Gap between candle .high and candle .low (upward imbalance)
Bearish FVG: Gap between candle .high and candle .low (downward imbalance)
The indicator monitors recent FVG formation (lookback: 50 bars) and requires:
Bullish FVG present for BUY signals
Bearish FVG present for SELL signals
FVG zones are displayed as colored boxes and automatically marked as "mitigated" when price fills the gap.
4. Main Trading Signal Logic
The secondary Market Profile (default: 1 hour) generates the actual trading signals:
BUY Signal Conditions:
Price reaches Value Area Low
Reversal pattern confirmed (minimum 1 bar)
Price > Primary VWAP
Price > Secondary VWAP (if filter enabled)
Recent Bullish FVG detected (if filter enabled)
Primary MP Filter = BUY-ONLY or NEUTRAL
SELL Signal Conditions:
Price reaches Value Area High
Reversal pattern confirmed (minimum 1 bar)
Price < Primary VWAP
Price < Secondary VWAP (if filter enabled)
Recent Bearish FVG detected (if filter enabled)
Primary MP Filter = SELL-ONLY or NEUTRAL
All conditions must be TRUE simultaneously for a signal to appear.
📈 VISUAL ELEMENTS
On Chart:
🟢 Green Triangle (▲) = BUY Signal
🔴 Red Triangle (▼) = SELL Signal
🟦 Blue horizontal lines = Value Area zones
🟡 Yellow line = Point of Control (POC)
🟩 Green boxes = Bullish FVG zones
🟥 Red boxes = Bearish FVG zones
🔵 Blue line = Primary VWAP (Session)
⚪ White line = Secondary VWAP (Week)
Info Panel (Top Right):
Real-time status display showing:
Filter Direction (BUY ONLY / SELL ONLY / NEUTRAL)
Active timeframes for both MP filters
FVG filter status and count
VWAP positions (ABOVE/BELOW)
Signal enablement status
Alert status
⚙️ KEY SETTINGS
MP/TPO Filter Settings (Primary Indicator)
MP Filter Time Frame: 60 minutes (controls directional bias)
Filter Value Area %: 70% (standard Market Profile calculation)
Filter Alert Distance: 1 bar
Filter Min Bars for Reversal: 1 bar
Filter Alert Zone Margin: 0.01 (1%)
FVG Filter Settings
Use FVG Filter: Enabled (toggle on/off)
FVG Timeframe: 60 minutes (1 hour)
FVG Filter Mode: Both (require bullish FVG for BUY, bearish for SELL)
FVG Lookback Period: 50 bars (how far back to search)
Show FVG Formation Signals: Optional visual markers
Max FVG on Chart: 50 zones
Show Mitigated FVG: Display filled gaps
Market Profile Settings
Higher Time Frame: 60 minutes (for main signals)
Percent for Value Area: 70%
Show POC Line: Enabled
Keep Old MPs: Enabled (maintain historical profiles)
Primary VWAP Filter
Use Primary VWAP Filter: Enabled
Primary VWAP Anchor Period: Session (resets daily)
Primary VWAP Source: HLC3 (typical price)
Secondary VWAP Filter
Use Secondary VWAP Filter: Enabled
Secondary VWAP Anchor Period: Week (resets weekly)
Secondary VWAP Filter Mode: Both
Secondary VWAP Line Color: White
Trading Signals
Show Trading Signals on Chart: Enabled
Show SELL Signals: Enabled
Show BUY Signals: Enabled
Alert Distance: 1 bar
Min Bars for Reversal: 1 bar
Alert Zone Margin: 0.01 (1%)
Retest Search Period: 20 bars
Min Bars Between Retests: 5 bars
Show Only Retests: Disabled
Alert Settings
Enable Trading Notifications: Enabled
VAH Reversal Alert: Enabled (SELL signals)
VAL Reversal Alert: Enabled (BUY signals)
Time Filter Settings
Filter Alerts By Time: Optional (exclude specific hours)
⚠️ IMPORTANT WARNINGS & LIMITATIONS
1. Repainting Behavior
CRITICAL: This indicator uses lookahead=barmerge.lookahead_on to access higher timeframe data immediately for FVG detection. This is necessary to provide real-time FVG zone visualization but has the following implications:
FVG zones may shift slightly until the higher timeframe candle closes
FVG detection signals are preliminary until HTF bar confirmation
The main trading signals (triangles) appear on confirmed bars and do not repaint
Best Practice: Always wait for the current timeframe bar to close before acting on signals. The filter status and FVG zones are informational but may adjust as new data arrives.
2. Minimum Timeframe
Do NOT use on timeframes below 5 minutes (M5)
Recommended: M5, M15, M30 for intraday trading
Higher timeframes (H1, H4) can also be used but will generate fewer signals
3. Multiple Filters Can Block Signals
By design, this indicator is conservative. When all filters are enabled:
Signals appear ONLY when all conditions align
You may see extended periods with no signals
This is intentional to reduce false positives
If you see no signals:
Check the Info Panel to see which filters are failing
Consider adjusting FVG lookback period
Temporarily disable FVG filter to test
Verify VWAP filters match current market trend
4. Market Profile Limitations
Market Profile requires sufficient volume data
Low-volume instruments may produce unreliable profiles
Value Areas update only on higher timeframe bar close
Works best on liquid markets (major forex pairs, indices, crypto)
📖 HOW TO USE
Step 1: Add to Chart
Apply indicator to M5 or higher timeframe chart
Ensure chart shows volume data
Use standard candles (NOT Heikin Ashi, Renko, etc.)
Step 2: Configure Settings
Primary MP Filter TF: Set to 60 (1 hour) minimum, or 240 (4 hour) for swing trading
Main MP TF: Set to 60 (1 hour) for intraday signals
FVG Timeframe: Match or exceed main MP timeframe
Leave other settings at default initially
Step 3: Understand the Info Panel
Monitor the top-right panel:
FILTER STATUS: Shows current directional bias
NEUTRAL = Both signals allowed
BUY ONLY = Only green triangles will appear
SELL ONLY = Only red triangles will appear
FVG Filter: Shows if bullish/bearish gaps detected recently
VWAP positions: Confirms trend alignment
Step 4: Take Signals
For BUY Signal (Green Triangle ▲):
Wait for green triangle to appear
Check Info Panel shows ✓ for BUY signals
Confirm current bar has closed
Enter long position
Stop loss: Below recent VAL or swing low
Target: Previous Value Area High or 1.5-2× risk
For SELL Signal (Red Triangle ▼):
Wait for red triangle to appear
Check Info Panel shows ✓ for SELL signals
Confirm current bar has closed
Enter short position
Stop loss: Above recent VAH or swing high
Target: Previous Value Area Low or 1.5-2× risk
Step 5: Risk Management
Risk per trade: Maximum 1-2% of account equity
Position sizing: Adjust based on stop loss distance
Avoid trading: During major news events or time filter periods
Multiple confirmations: Look for confluence with price action (support/resistance, trendlines)
🎓 UNDERLYING CONCEPTS
Market Profile Theory
Developed by J. Peter Steidlmayer in the 1980s, Market Profile organizes price and volume data to identify:
Value Areas: Where 70% of trading activity occurred
POC: Price level with highest acceptance (most volume)
Imbalances: When price moves away from value quickly
This indicator uses TPO (Time Price Opportunity) calculation method to build the volume profile distribution.
VWAP (Volume Weighted Average Price)
VWAP represents the average price weighted by volume, showing where institutional traders are positioned:
Price above VWAP = Bullish (institutions accumulated lower)
Price below VWAP = Bearish (institutions distributed higher)
Using dual VWAP (Session + Week) creates multi-timeframe trend alignment.
Fair Value Gaps (FVG)
Also known as "imbalance" or "inefficiency," FVG occurs when:
Price moves so rapidly that a gap forms in the candlestick structure
Indicates institutional order flow (large market orders)
Price often returns to "fill" these gaps (rebalance)
The 3-candle FVG pattern (gap between candle and candle ) is widely used in ICT (Inner Circle Trader) methodology and Smart Money Concepts.
🔍 CREDITS & CODE ATTRIBUTION
This indicator builds upon established technical analysis concepts and combines multiple methodologies:
1. Market Profile / TPO Calculation
Concept Origin: J. Peter Steidlmayer (Chicago Board of Trade, 1980s)
Code Inspiration: TradingView's public domain Market Profile examples
Modifications: Custom filtering logic for directional bias, dual timeframe implementation
2. VWAP Calculation
Concept Origin: Standard financial instrument (widely used since 1980s)
Code Base: TradingView built-in ta.vwap() function (public domain)
Modifications: Dual VWAP system with independent anchor periods, custom filtering modes
3. Fair Value Gap Detection
Concept Origin: Inner Circle Trader (ICT) / Smart Money Concepts methodology
Code Implementation: Original implementation based on 3-candle gap pattern
Features: Multi-timeframe detection, automatic mitigation tracking, visual zone display
4. Pine Script Framework
Language: Pine Script v6 (TradingView)
Built-in Functions Used:
ta.vwap() - Volume weighted average price
request.security() - Higher timeframe data access
ta.change() - Period detection
ta.cum() - Cumulative volume
time() - Timestamp functions
Note: All code is original implementation. While concepts are based on established trading methodologies, the combination, filtering logic, and execution are unique to this indicator.
📊 RECOMMENDED INSTRUMENTS
Best Performance:
Major Forex Pairs (EURUSD, GBPUSD, USDJPY)
Stock Indices (ES, NQ, SPX, DAX)
Major Cryptocurrencies (BTCUSD, ETHUSD)
Liquid Stocks (high daily volume)
Avoid:
Low-volume altcoins
Illiquid stocks
Exotic forex pairs with wide spreads
⚡ PERFORMANCE TIPS
Start Conservative: Enable all filters initially
Reduce Filters Gradually: If too few signals, disable Secondary VWAP filter first
Match Timeframes: Keep MP Filter TF and FVG TF at same value
Backtest First: Review historical performance on your preferred instrument/timeframe
Combine with Price Action: Look for support/resistance confluence
Use Time Filter: Avoid low-liquidity hours (optional setting)
🚫 WHAT THIS INDICATOR DOES NOT DO
Does not guarantee profits - No trading system is 100% accurate
Does not predict the future - Based on historical patterns
Does not replace risk management - Always use stop losses
Does not work on all instruments - Requires volume data and liquidity
Does not provide exact entry/exit prices - Signals are zones, not precise levels
Does not account for fundamentals - Purely technical analysis
📜 DISCLAIMER
This indicator is provided for educational and informational purposes only. It is not financial advice, and past performance does not guarantee future results.
Trading Risk Warning:
All trading involves risk of loss
You can lose more than your initial investment (leverage products)
Only trade with capital you can afford to lose
Always use appropriate position sizing and risk management
Consider seeking advice from a licensed financial advisor
Technical Limitations:
Indicator may repaint FVG zones until HTF bar closes
Signals are based on historical patterns that may not repeat
Market conditions change and no system works in all environments
Volume data quality varies by exchange/broker
By using this indicator, you acknowledge these risks and agree that the author bears no responsibility for trading losses.
📞 SUPPORT & UPDATES
Questions? Comment on this publication
Issues? Describe the problem with chart screenshot
Feature Requests? Suggest improvements in comments
Updates: Will be published as new versions using TradingView's update feature
📝 VERSION HISTORY
Version 1.0 (Current)
Initial public release
Multi-filter system: MP + Dual VWAP + FVG
Directional bias filter
Real-time info panel
Comprehensive alert system
Time-based filtering
Thank you for using Smart VWAP FVG System!
Happy Trading! 📈

Session Dominator — Asia • London • New York Precision ZonesRule the global market sessions.
Session Dominator is a precision-engineered indicator built for traders who want total clarity across Asia, London, and New York sessions.
It automatically plots:
🔷 Dynamic Session Boxes — visually map institutional killzones in real time
⚙️ Session Mean Line — track equilibrium and liquidity shifts
📊 EMA-50 Confluence — align directional bias and intraday trend
🎯 BSL / SSL Levels — reveal active liquidity sweeps and reversals
💡 Bias Engine — evaluates structure and locks the session bias automatically
Toggle between Asia / London / New York / Overlap / Custom modes to dominate any timezone.
Designed with minimalist visuals, high precision, and ICT-based logic — this tool helps you anticipate where liquidity will be taken before it happens.
✳️ For XAUUSD traders, scalpers, and ICT-style analysts seeking sniper-level clarity.

Lord Mathew ATSThe Smart Money Structure & Pattern Analyzer is a complete, all-in-one visual trading system that brings together every essential element of Smart Money Concepts (SMC), ICT methodology, and candlestick psychology into one powerful indicator.
It is designed to help traders instantly understand the market’s structure, liquidity flow, and potential turning points without switching tools or manually marking charts. Whether you trade forex, indices, crypto, or commodities, this indicator automatically identifies where institutional activity, imbalances, and price inefficiencies occur in real time.
With its advanced algorithm, it plots market structure shifts, equal highs and lows, liquidity zones, order blocks, fair value gaps (FVGs), and previous week and day levels (PWO, PWH, PWL, PWC, PDO, PDH, PDL, PDO). It also integrates a deep candlestick recognition engine that detects over ten classic and advanced candle formations including engulfing patterns, dojis, hammers, shooting stars, morning/evening stars, and spinning tops to provide precise confirmation at critical points of interest.
This indicator isn’t just a tool it’s a complete market map that helps traders visualize how institutional order flow and candlestick sentiment interact.
Core Features
📊 Market Structure Detection:
Automatically marks swing highs/lows, Break of Structure (BOS), and Change of Character (CHOCH) in real time.
💧 Liquidity Mapping:
Highlights equal highs/lows and liquidity grabs, showing where price is likely to target before a reversal or continuation.
🧱 Order Block Visualization:
Displays the last bullish or bearish candle before an impulsive displacement, acting as a potential institutional entry zone.
⚡ Fair Value Gap (FVG) Scanner:
Detects and highlights imbalances where price moved too fast, helping you identify high-probability retracement areas.
🕯️ Candlestick Pattern Recognition:
Recognizes key reversal and continuation patterns (engulfing, hammer, shooting star, doji, morning/evening star, etc.) in real time.
📅 Institutional Reference Points:
Plots previous week & day open (PWO, PDO), previous week & day high (PWH, PWH), previous week & day low (PWL, PDL), previous week & day close (PWC, PDC) and optionally previous day levels to help frame bias.
🎨 Customizable Design:
Toggle any feature, change colors, and set alerts when multiple Smart Money signals align for cleaner, faster decision-making.
How It Works
Add the indicator to your chart on any timeframe or market.
The algorithm automatically detects structure, liquidity, and imbalance zones.
Candlestick patterns are highlighted when they form near high-probability areas (like OBs or FVGs).
When confluence occurs such as a liquidity grab, FVG fill, and bullish engulfing candle—the indicator provides a visual signal zone for your confirmation-based entries.
You can refine your trades using higher-timeframe bias (HTF order flow) and lower-timeframe execution (LTF confirmation).
Best For
Traders using ICT, Smart Money Concepts, or price-action systems.
Intraday and swing traders looking for clear, data-driven chart structure.
Traders who want to simplify confluence analysis and focus on precision execution.
Why It Stands Out
Unlike standard candlestick or pattern scanners, this indicator merges institutional market logic with technical candle behavior, allowing traders to see where smart money might be entering or exiting positions.
It’s not about random signals it’s about context, structure, and confirmation.
Every feature in this indicator is built around the principle of liquidity engineering:
price creates liquidity, grabs it, and moves toward imbalance or order flow efficiency.
By merging that institutional logic with candlestick patterns, this tool gives traders an edge in recognizing not only where to trade but why price is reacting in that exact area.
Disclaimer
This indicator is intended for educational and analytical use. It does not provide financial advice or guaranteed trading results. Always backtest and manage your risk responsibly.

Killzone Session High/Low Levels [SmartFoxy]Killzone Session High/Low Levels
The Killzone Session High/Low Levels indicator by SmartFoxy provides a complete intraday framework for understanding session-based liquidity, market structure rotation, and breakout behavior across global trading sessions.
It automatically plots the High/Low ranges for each selected session, highlights session killzones, and tracks breakout events with optional alerts.
This tool is designed for traders who rely on session dynamics (Asia, Frankfurt, London, New York) to identify liquidity targets, sweep zones, key ranges, and continuation/reversal opportunities.
________________________________________
How It Works
The indicator detects the active trading sessions for each day and builds structural High/Low ranges for them:
• Asia Session Range (High/Low);
• Frankfurt Session Range;
• London Session Range;
• New York Session Range;
• Optional custom session (NY Open, or any killzone).
For each session, the script can display:
• Session box or column;
• High/Low levels;
• Labels for every range (H/L);
• True session boundaries using user-defined timezone;
• Auto-extended levels up to the latest candle;
• Break levels after a breakout;
• Conditional removal or recoloring after a level is breached.
This gives traders a clean visual map of session liquidity and how price interacts with it throughout the day.
________________________________________
Key Features
1. Multiple Global Sessions •➤ Asia, Frankfurt, London, New York, plus one custom session for advanced killzone mapping.
2. Session High/Low Liquidity Levels •➤ Automatic plotting of every session’s High and Low, with optional labels and price markers.
3. Session Boxes or Columns •➤ Two display modes allow traders to visualize the session either as a filled box or a clear vertical column.
4. Breakout Logic & Temporary Levels .
When price breaks a session High/Low:
• Levels can be extended for a selected number of bars
• Or removed instantly after a breakout
• Or recolored to highlight the sweep event
This enables clean identification of liquidity grabs, breakouts, and continuation setups.
5. Alerts for Session Breakouts .
Set alerts when price breaks:
• Any session level
• Only levels formed on the current day
Perfect for traders who want real-time notifications of sweeps or key structure breaks.
6. Full Customization
You can configure:
• Session times;
• Timezone;
• Colors;
• Labels;
• Line styles and widths;
• Breakout behavior;
• Killzone range handling.
Everything is adjustable to match any trading style.
________________________________________
How to Use
1. Enable the sessions you want to track •➤ Asia, Frankfurt, London, New York, or custom.
2. Choose display mode
Box mode for visual range blocks;
Column mode for clean vertical alignment.
3. Enable High/Low Levels .
These act as liquidity magnets and key rejection zones.
4. Turn on Breakout Levels (optional)
Useful for spotting sweeps and continuation setups.
5. Turn on Alerts if you want notifications when price breaks levels.
6. Use session levels as liquidity reference points .
They work exceptionally well with smart money concepts (SMC), ICT, and intraday structure analysis.
________________________________________
Why This Indicator Is Useful
Shows exactly where liquidity is placed each session;
Highlights market structure transitions as sessions hand over control;
Helps identify stop hunts, sweeps, reversals, and continuation patterns;
Provides real-time alerts for structural breaks;
Organizes the chart and reduces noise;
Works with any intraday timeframe and any market.
This makes it valuable for scalpers, day traders, and SMC/ICT-style analysts.
________________________________________
Summary
Killzone Session High/Low Levels delivers a complete, highly customizable intraday mapping system based on global trading sessions.
It clarifies the session structure, reveals liquidity targets, and empowers traders to make confident trading decisions using clean, objective market data.

Premium/Discount Zones with Confirmation Signals📌 Indicator Description: Premium/Discount Zones with Confirmed Signals
This indicator identifies dynamic Premium, Discount, and Equilibrium zones based on recent swing highs and lows, helping traders visualize where price is considered expensive, cheap, or fair value. It’s designed for Smart Money Concepts (SMC), ICT-style trading, and anyone who values precision in zone-based analysis.
🔍 Key Features
Swing-Based Zones: Automatically detects swing highs/lows over a customizable lookback period (default: 48 bars — equivalent to 2 days on a 1-hour chart).
Premium & Discount Levels: Define overbought and oversold zones using percentage inputs (default: 25%).
Equilibrium Band (middle): Highlights the no-trade value zone with adjustable width (default: 5%).
Signal Engine: Generates trade signals based on two styles:
Bounce: Reversal signals when price reacts to a zone and confirms direction.
Breakout: Continuation signals when price breaks through a zone with momentum.
Trade Type Selector: Choose between Bounce, Breakout, or Both from the input menu.
Signal Filtering: Limits signals to one per direction at a time to reduce noise.
Visual Styling: Toggle between colored or monochrome themes for clean charting.
🧠 How It Works
Buy signals appear when price confirms strength from the discount zone or breaks above the premium zone.
Sell signals appear when price confirms weakness from the premium zone or breaks below the discount zone.
All signals include a built-in 3-bar confirmation delay to reduce false triggers.
🎯 Ideal For
Traders using SMC, ICT, or price action strategies
Zone-based scalping, swing trading, or intraday setups
Visualizing market structure and value areas with clarity
I hope you find this useful — and wish you Happy Trades!

量价策略信号+K线pinbar+波动率出场+市场结构【梦喂马】v3Part 1: Indicator Module Explained (Code Analysis and Function Description)
Module 1: Master Switches
This is your "dashboard master control." Due to the numerous indicator functions, charts can appear cluttered. Here, you can easily turn each major function module on or off, allowing you to focus on the information you need most.
- Suggested Usage: When using it for the first time, you can start by only turning on the Vegas Channel and Core Entry Signals to familiarize yourself with the system's main trend judgment and entry logic. Then gradually turn on other modules to experience how they work together.
Module 2: Core Entry Signals (Long/Short Signals)
This is the "engine" of the entire system, responsible for generating the highest quality trend-following trading signals. The appearance of a "long" or "short" signal represents the resonance of multiple indicators, satisfying extremely stringent filtering conditions:
- 1. Vegas Channel Filtering:
- When going long, the price must be above the slow channel (576/676 EMA) and the fast channel (21/55 EMA).
- When shorting, the price must break below both the slow and fast channels.
- Interpretation: This ensures your trading direction is perfectly aligned with the medium- to long-term macro trend.
- 2. Alligator Line Confirmation:
- When going long, the price must be above the alligator lines (lips, teeth, jaws), and the alligator lines must be in a bullish alignment (opening upwards).
- When shorting, the opposite applies.
- Interpretation: This confirms that short-term momentum aligns with the long-term trend, avoiding hasty entry at the start or end of a trend.
- 3. OBV (On-Balance Volume) Filter:
- When going long, the OBV value must be above its own moving average (default 34 periods).
- When shorting, the OBV value must be below its moving average.
- Interpretation: OBV is a key indicator measuring fund inflows and outflows. This condition ensures that trading volume (funds) is supporting your trading direction.
- 4. ADX Trend Strength Filter:
- Whether going long or short, the ADX value must be greater than the set threshold (default 20).
- Interpretation: This is a crucial "insurance" layer. It helps filter out volatile market conditions with no clear direction, prone to repeated "misjudgments." We only act in markets with clear and strong trends.
Core Usage: Once a "long"/"short" signal appears, it represents a high-certainty trend-following trading opportunity. Due to the very strict nature of the signals, they appear infrequently, but each one deserves your close attention.
Module Three: Vegas Channel & Alligator Line (Trend Judgment Tool)
- Vegas Channel: Composed of two sets of EMAs.
- Slow Channel (576/676): Your "bull/bear dividing line." Above this line, only consider going long; below this line, only consider going short. It is your strategic compass.
- Fast Channel (21/55): Your "short-term momentum line." In an uptrend, price pullbacks to the vicinity of the fast channel are potential areas for adding to positions or entering.
- Alligator Line:
- Widening divergence: Indicates that a trend is underway.
- Convergence/Entanglement: Indicates the market is dormant or consolidating.
- Interpretation: Alligator lines allow you to visually see whether the market is in a "trending" or "consolidating" state. We primarily trade when the alligator lines widen.
Module Four: R/C Volume-Price Signals (Refined Entry/Warning Signals)
This is the system's "special forces," specifically designed to identify abnormal volume and price movements on key candlesticks. It is divided into the R series (Reversal) and the C series (Continuation).
- Prerequisites: All signals are based on trading volume. A signal's appearance must be accompanied by a significantly higher-than-average trading volume (increased volume). This indicates large capital participation at that price level, making the signal more reliable.
- R Series - Trend Reversal Signals (Warning/Opportunity):
- R1 (Core Reversal): In a downtrend, a sudden increase in volume on a bullish candlestick; or in an uptrend, an increase in volume on a bearish candlestick.
- Interpretation: This is the most basic reversal warning signal. It tells you that counter-trend forces are emerging, but it doesn't mean the trend will immediately reverse. Confirmation needs to be combined with other signals.
- R2 (Pattern Confirmation): In addition to R1, this candlestick must also be a well-defined Pin Bar (a bullish Pin Bar with a long lower shadow, or a bearish Pin Bar with a long upper shadow).
- Interpretation: This is a more reliable reversal signal. The Pin Bar pattern represents a strong rejection of the price after an attempt to break through; combined with increased volume, this indicates strong reversal momentum.
- R3 (Top Momentum): In addition to R2, the trading volume reaches a "massive" level (default is more than 4 times the average volume).
- Interpretation: This is the highest level reversal signal. It usually appears at the end of a trend, representing the extreme struggle and conversion of bullish and bearish forces, and is a potential sign of a "V-shaped reversal" or a deep V-bottom/top.
- C Series - Trend Continuation/Termination Signals:
- C0 (Trend Continuation): In a clear uptrend, a bearish Pin Bar (long upper shadow) with increased volume appears during a price pullback; or in a downtrend, a bullish Pin Bar (long lower shadow) with increased volume appears during a rebound.
- Interpretation: This is a classic "buy on pullback/sell on rebound" signal. It indicates that the pullback/rebound attempt to counterattack is quickly suppressed by the strong main trend, making it an excellent entry point for adding to positions or following the trend.
- CX (Exhaustion Signal): A C-series signal that appears when the price has moved far away from the slow Vegas Channel (default more than 5 times the ATR distance).
- Interpretation: This is an advanced use of the C-series. After a trend has run for a long time, market sentiment may be overly enthusiastic. The high-volume PinBar appearing at this time, while trend-following in form, is more likely to represent the exhaustion or "final frenzy" of the trend. This is an alert that the trend may be running out of momentum, and you should consider taking profits in batches rather than adding to your position.
Signal Priority: This indicator has been internally optimized: CX/R3 > R2 > C0 > R1. Higher-level signals will override lower-level signals, ensuring you see the most important information at the moment.
Module 5: Chandelier Exit - Dynamic Risk Management
This is a dynamic stop-loss system based on ATR (Average True Range).
- How it works:
- In an uptrend, it subtracts N times the ATR from the recent high, forming a stepped upward stop-loss line.
- In a downtrend, it adds N times the ATR from the recent low, forming a stepped downward stop-loss line.
- Core advantages: It automatically adjusts the stop-loss distance based on market volatility. During periods of high market volatility, the stop-loss widens, giving you more room; during periods of market stability, the stop-loss tightens, locking in profits more quickly.
- Usage:
- As an initial stop-loss: After entering a position, the stop-loss can be set outside the Chandelier line.
- As a trailing stop: The position is held as long as the price does not fall below (uptrend) or rise above (downtrend) the Chandelier line. This is a powerful tool for "letting profits run."
- As an auxiliary trend indicator: The direction of the chandelier line (upward/downward) also provides a concise short-term trend perspective.
Module Six: Candlestick Coloring
This feature is very intuitive; it colors candlesticks based on volume:
- High Volume (Orange): Volume exceeds twice the average volume.
- Huge Volume (Red): Volume exceeds four times the average volume.
- Usage: Helps you identify key candlesticks indicating significant market events at a glance, typically the start, acceleration, reversal, or exhaustion points of a trend.
Module Seven: ICT Market Structure
This is an advanced price behavior analysis tool based on ICT (Inner Circle Trader) theory, helping you understand the market's "skeleton."
- Core Concepts:
- Swing High/Low: Local tops and bottoms in market prices.
- BOS (Break of Structure): In an uptrend, the price creates a higher high than the previous swing high; in a downtrend, it creates a lower low.
- Interpretation: BOS (Bullish Oscillator) is a confirmation signal of trend continuation. Consecutive upward BOS indicate a healthy bullish trend, and vice versa.
- MSS (Market Structure Shift, also often called CHOCH): In an uptrend, the price fails to make a new high and instead falls below the previous valid swing low.
- Interpretation: MSS is the first and most important signal of a potential trend reversal. It indicates that market forces are shifting from bullish to bearish (or vice versa).
- Period Settings (Short/Intermediate/Long Term):
- Short Term: Based on the most minute 3-bar swing points, very sensitive, suitable for short-term traders to observe subtle changes.
- Intermediate Term (Recommended): Based on higher-level swing points formed from short-term swing points, filtering out some noise, suitable for day and swing traders.
- Long Term: Based on swing points formed from intermediate-term swing points, reflecting a longer-term structure, suitable for swing and long-term traders.
- Usage: Combine market structure with your trading signals. For example, in an uptrend (price above the Vegas Channel), each upward BOS confirms the health of the trend. If a C0 pullback signal appears at this point, it would be an excellent entry point. Conversely, if an MSS appears, even with a strong buy signal, caution is advised, as the trend may be reversing.
Module Eight: Information Panel
This is your "cockpit dashboard," consolidating all key information in one place, giving you a clear overview of the current market state:
- Main Trend Direction: The final trend judgment given by multiple indicators.
- Alligator Line Pattern: Shows whether the current trend is trending or consolidating.
- OBV Status: Whether funds are flowing in or out.
- ADX Status: Whether the trend is strong or weak.
- Chandelier Stop-Loss Direction: Short-term trend direction.

FVG MagicFVG Magic — Fair Value Gaps with Smart Mitigation, Inversion & Auto-Clean-up
FVG Magic finds every tradable Fair Value Gap (FVG), shows who powered it, and then manages each gap intelligently as price interacts with it—so your chart stays actionable and clean.
Attribution
This tool is inspired by the idea popularized in “Volumatic Fair Value Gaps ” by BigBeluga (licensed CC BY-NC-SA 4.0). Credit to BigBeluga for advancing FVG visualization in the community.
Important: This is a from-scratch implementation—no code was copied from the original. I expanded the concept substantially with a different detection stack, a gap state machine (ACTIVE → 50% SQ → MITIGATED → INVERSED), auto-clean up rules, lookback/nearest-per-side pruning, zoom-proof volume meters, and timeframe auto-tuning for 15m/H1/H4.
What makes this version more accurate
Full-coverage detection (no “missed” gaps)
Default ICT-minimal rule (Bullish: low > high , Bearish: high < low ) catches all valid 3-candle FVGs.
Optional Strict filter (stricter structure checks) for traders who prefer only “clean” gaps.
Optional size percentile filter—off by default so nothing is hidden unless you choose to filter.
Correct handling of confirmations (wick vs close)
Mitigation Source is user-selectable: high/low (wick-based) or close (strict).
This avoids false “misses” when you expect wick confirmations (50% or full fill) but your logic required closes.
State-aware labelling to prevent misleading data
The Bull%/Bear% meter is shown only while a gap is ACTIVE.
As soon as a gap is 50% SQ, MITIGATED, or INVERSED, the meter is hidden and replaced with a clear tag—so you never read stale participation stats.
Robust zoom behaviour
The meter uses a fixed bar-width (not pixels), so it stays proportional and readable at any zoom level.
Deterministic lifecycle (no stale boxes)
Remove on 50% SQ (instant or delayed).
Inversion window after first entry: if price enters but doesn’t invert within N bars, the box auto-removes once fully filled.
Inversion clean up: after a confirmed flip, keep for N bars (context) then delete (or 0 = immediate).
Result: charts auto-maintain themselves and never “lie” about relevance.
Clarity near current price
Nearest-per-side (keep N closest bullish & bearish gaps by distance to the midpoint) focuses attention where it matters without altering detection accuracy.
Lookback (bars) ensures reproducible behaviour across accounts with different data history.
Timeframe-aware defaults
Sensible auto-tuning for 15m / H1 / H4 (right-extension length, meter width, inversion windows, clean up bars) to reduce setup friction and improve consistency.
What it does (under the hood)
Detects FVGs using ICT-minimal (default) or a stricter rule.
Samples volume from a 10× lower timeframe to split participation into Bull % / Bear % (sum = 100%).
Manages each gap through a state machine:
ACTIVE → 50% SQ (midline) → MITIGATED (full) → INVERSED (SR flip after fill).
Auto-clean up keeps only relevant levels, per your rules.
Dashboard (top-right) displays counts by side and the active state tags.
How to use it
First run (show everything)
Use Strict FVG Filter: OFF
Enable Size Filter (percentile): OFF
Mitigation Source: high/low (wick-based) or close (stricter), as you prefer.
Remove on 50% SQ: ON, Delay: 0
Read the context
While ACTIVE, use the Bull%/Bear% meter to gauge demand/supply behind the impulse that created the gap.
Confluence with your HTF structure, sessions, VWAP, OB/FVG, RSI/MACD, etc.
Trade interactions
50% SQ: often the highest-quality interaction; if removal is ON, the box clears = “job done.”
Full mitigation then rejection through the other side → tag changes to INVERSED (acts like SR). Keep for N bars, then auto-remove.
Keep the chart tidy (optional)
If too busy, enable Size Filter or set Nearest per side to 2–4.
Use Lookback (bars) to make behaviour consistent across symbols and histories.
Inputs (key ones)
Use Strict FVG Filter: OFF(default)/ON
Enable Size Filter (percentile): OFF(default)/ON + threshold
Mitigation Source: high/low or close
Remove on 50% SQ + Delay
Inversion window after entry (bars)
Remove inversed after (bars)
Lookback (bars), Nearest per side (N)
Right Extension Bars, Max FVGs, Meter width (bars)
Colours: Bullish, Bearish, Inversed fill
Suggested defaults (per TF)
15m: Extension 50, Max 12, Inversion window 8, Clean up 8, Meter width 20
H1: Extension 25, Max 10, Inversion window 6, Clean up 6, Meter width 15
H4: Extension 15, Max 8, Inversion window 5, Clean up 5, Meter width 10
Notes & edge cases
If a wick hits 50% or the far edge but state doesn’t change, you’re likely on close mode—switch to high/low for wick-based behaviour.
If a gap disappears, it likely met a clean up condition (50% removal, inversion window, inversion clean up, nearest-per-side, lookback, or max-cap).
Meters are hidden after ACTIVE to avoid stale percentages.

CPT - CRT Sessions🧭 CPT - CRT Sessions V3
Automated Killzones, CRT Ranges, FVGs, and Market Structure Anchors — built for precision intraday analysis.
🔹 Overview
CPT - CRT Sessions V3 is an advanced all-in-one price action indicator designed to simplify your intraday charting and speed up trade preparation.
It automatically plots key session killzones, Central Range Times (CRT), Fair Value Gaps (FVGs), and market structure anchors such as NDOG, NWOG, and PDH/PDL, allowing traders to identify premium and discount zones at a glance.
⚙️ Core Features
🕒 CRT Ranges (Central Range Time)
Automatically plots 1HR CRT (for futures) and 4HR CRT (for forex) sessions.
Includes color-coded high/low lines for instant visual reference.
Configurable hours (UTC-4 default) and adjustable forward projection.
📦 Killzones
Automatically draws Asian, London, and New York (AM, Lunch, PM) session boxes.
Each killzone features:
Adjustable start/end times
Independent color and transparency controls
Session labeling inside boxes
Uses the classic ICT-style session structure (Asia: 20:00–23:59 UTC-4 by default).
⚡ Fair Value Gaps (FVGs)
Detects both bullish and bearish FVGs automatically.
Displays each gap with:
Midpoint line
Label inside the box (e.g., “1HR FVG”, “4HR FVG”)
Auto-remove logic once price mitigates the gap.
Works on all timeframes.
🔰 Market Anchors
PDH / PDL — Previous Day High & Low
NDOG / NWOG — New Day & New Week Opening Gaps
Automatically drawn and color-coded for visual clarity.
🎨 Customization
Adjustable line styles, widths, and label sizes
Individual transparency sliders for each session box
Optional 24-hour display filtering
Fully timezone-aware (default: UTC-4, matching Exchange time)
💡 Ideal For
Traders following ICT, Smart Money Concepts, or Session Liquidity Models
Scalpers and intraday traders looking to automate manual markups
Multi-timeframe confluence mapping (FVGs + Killzones + CRTs)
🧠 Notes
This tool is for chart analysis only — not an entry or exit signal.
Always perform your own confluence checks before trading.

NWOG/NDOG + EHPDA🌐 ENGLISH DESCRIPTION
Hybrid NWOG/NDOG + EHPDA – Advanced Gaps & Event Horizon Indicator
(Enhanced with Real-Time Alerts and Info Table)
📊 Overview
This advanced indicator combines automatic detection of weekly gaps (NWOG) and daily gaps (NDOG) with the Event Horizon (EHPDA) concept, now featuring customizable alerts and a real-time info table for a more efficient trading experience. Designed for traders who operate based on institutional price structures, liquidity zones, and SMC/ICT confluences.
✨ Key Features
1. Gap Detection & Visualization
NWOG (New Week Opening Gap): Identifies and visualizes the gap between Friday’s close and Monday’s open.
NDOG (New Day Opening Gap): Detects daily gaps on intraday timeframes.
Enhanced visualization: Semi-transparent boxes, price levels (top, middle, bottom), and lines extended to the current bar.
Customizable labels: Display gap formation date and price levels (optional).
2. Event Horizon (EHPDA)
Automatically calculates the Event Horizon level between two non-overlapping gaps.
Dashed line marking the equilibrium zone between bullish and bearish gaps.
3. Advanced 5pm-6pm Mode
Special option to detect the Sunday-Monday gap using 4H bars.
4. Real-Time Alerts
New gaps (NWOG/NDOG): Immediate notification when a new gap forms.
Gap fill: Alert when price completely fills a gap.
Event Horizon active: Notification when the Event Horizon level is triggered.
5. Info Table
Real-time display: number of active gaps, Event Horizon status, time remaining until weekly/daily close.
Customizable: position, size, and style.
🎨 Customization
Configurable colors for bullish gaps, bearish gaps, and Event Horizon line.
Customizable price labels and date format.
📈 Use Cases
Reversal trading, price targets, liquidity zones, SMC/ICT confluences.
⚙️ Recommended Settings
Timeframes: Daily and intraday (15m, 1H, 4H, etc.).
NWOG: Enable on all timeframes.
NDOG: Enable only on intraday.
Max Gaps: 3-5 for clean charts, 10-15 for historical analysis.
📝 Important Notes
Works best on 24/5 markets (Forex, Crypto).
Gaps automatically close when filled.
Event Horizon only appears with at least 2 non-overlapping gaps.

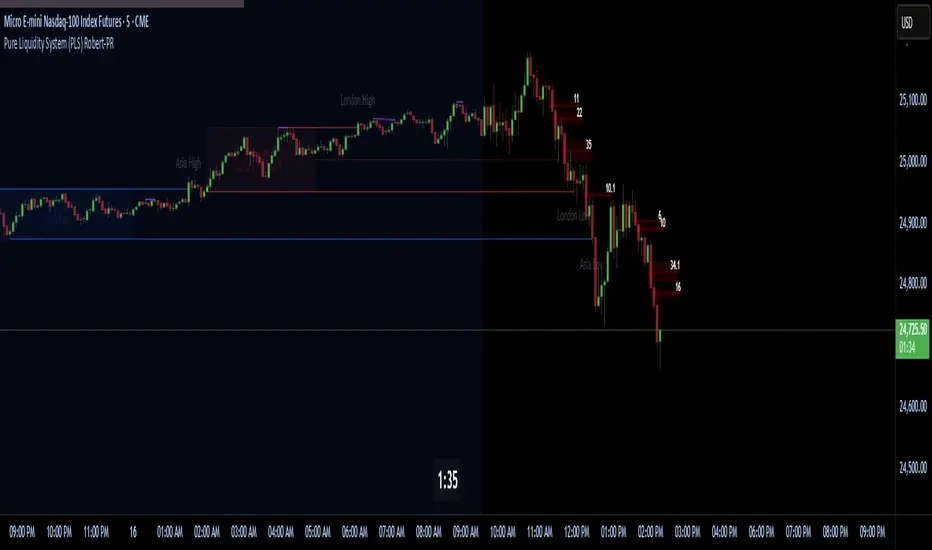
Pure Liquidity System (PLS) Robert-PRPure Liquidity System (PLS) Robert-PR
The PLS indicator is a comprehensive, advanced tool for tracking institutional liquidity across financial markets. It features:
Custom Day Ranges (6pm-6pm): Visualize daily ranges, midlines, and previous high/low levels with customizable tags and horizontal rays, helping you identify key price zones efficiently.
ICT Killzones: Automatically plots Asia, London, and New York (AM, Lunch, PM) sessions, highlighting peak volatility hours. Session pivots, labels, and middle lines offer fast context for intraday strategies.
Equal Highs/Lows Detection: Instantly marks significant equal highs and lows (double tops/bottoms) on any timeframe, making it easy to track liquidity pools and potential reversal points.
Fair Value Gaps (FVGs): Accurately detects and labels bullish/bearish fair value gaps, including gap size, mitigation status, and an optional consequent encroachment line for further analysis.
New York Session Markers: Quickly adds vertical lines for two critical NY session times (9:30 and 11:00 ET), perfect for time-based setups and correlation analysis.
Interactive Checklist & Timer: An intuitive panel for creating and marking off trading routines, complemented by a candle-close countdown timer to keep you focused and disciplined.
All core features are fully adjustable via the quick-access panel—enable or disable boxes, lines, labels, and levels with one click to match your workflow and visual preferences.
Perfect for traders who want to:
Trade alongside institutional “smart money” by focusing on liquidity zones, ICT concepts, and supply & demand mechanics.
Automatically streamline chart analysis while maintaining maximum flexibility, precision, and control over their trading environment.
BRIMSTONE SESSION INDICATOR🧭 Brimstone Session Indicator
Brimstone Session Indicator highlights global trading sessions (Asia, London/Frankfurt, New York) and key Kill Zones, showing when real liquidity and volatility enter the market.
⸻
🔍 Why It’s Useful
Markets move in time cycles, not just price.
This tool makes institutional timing visible — so you instantly see:
• Session ranges & volatility shifts
• Liquidity grabs and reversals in Kill Zones
• Perfect timing for precision entries (ICT / SMC style)
⸻
⚔️ Kill Zones
Fully customizable timing windows for liquidity hunts, stop raids, and engineered moves — where the market is most likely to attack highs/lows.
⸻
🎯 Built For
• ICT / Smart Money Traders
• Intraday scalpers & bias traders
• Anyone who trades price + time, not price alone

iFVG Ultimate+ | DodgysDDOVERVIEW
iFVG Ultimate+ | DodgysDD is a professional-grade visualization framework that automates the identification and management of Inversion Fair Value Gaps (IFVGs)
It is designed for analysts and educators studying institutional price behavior, liquidity dynamics, and displacement-based imbalances.
This indicator does not provide trading signals or forecasts.
All logic serves educational and analytical purposes only.
A Fair Value Gap (FVG) appears when strong directional displacement prevents candle bodies from overlapping.When a liquidity sweep occurs and price later closes through that gap, the imbalance is considered inverted. This often marks a shift in order-flow.
iFVG Ultimate+ tracks these transitions using a rule-based sequence:
Liquidity Sweep – Price sweeps a previous swing high or low.
Displacement – Body-to-body gap forms as price accelerates away.
Inversion – Full candle body closes through the gap after raid.
Validation and Tracking – Confirmed inversions are stored and managed until completion or invalidation.
-----------------------------------------------------------------------------------------------
PURPOSE AND SCOPE
-----------------------------------------------------------------------------------------------
The framework serves as a research tool to document and analyze IFVG behavior within liquidity and session contexts.
It is commonly used to:
-Record and journal IFVG formations for back-testing and model study.
-Assess how often gaps complete or invalidate after sweeps.
-Evaluate session-based patterns (London, Asia, New York).
-Overlay HTF PD Arrays to observe inter-timeframe delivery.
-Receive custom alerts to your phone
-----------------------------------------------------------------------------------------------
LOGIC STRUCTURE
-----------------------------------------------------------------------------------------------
iFVG Ultimate+ runs a five-stage validation process to ensure sequential, non-repainting behavior.
Liquidity Framework:
• Detects swing highs and lows on aligned timeframes (automatic or manual selection).
• Logs session highs/lows for Asia (20:00–00:00 NY) and London (02:00–05:00 NY).
• Includes data wicks around 08:30 NY for event reference.
FVG Detection and Displacement Filter:
• Identifies body-based imbalances using ATR-scaled sensitivity modes (Sensitive / Normal / Strict).
• Supports “Single” or “Series” modes to merge adjacent gaps.
• Excludes weak displacements using minimum ATR thresholds.
Inversion Validation:
• Confirms only when a complete candle body closes through a qualifying FVG within a user-defined window (6 or 15 bars).
• Duplicate detections are ignored; mitigation states are recorded.
HTF Context Integration:
• Maps higher-time-frame PD Arrays and tracks their delivery status.
• Labels active zones (e.g. “H4 PDA”) and updates on HTF close.
Model Lifecycle and Limits:
• Plots the inversion line and derives educational limit levels: Break-Even and Stop-Loss.
• Tracks until opposing liquidity is swept (model complete) or an invalidation event occurs.
-----------------------------------------------------------------------------------------------
COMPONENTS AND VISUALS
-----------------------------------------------------------------------------------------------
-IFVG Line — Marks confirmed inversion at close.
-Break-Even / Stop-Loss Lines — Calculated retrospectively for journal grading.
-Session High/Low Markers — London and Asia reference levels.
-Data Wicks — 8:30 NY “DATA.H/L” labels for event volatility.
-SMTs — Compares current symbol to correlated instrument for divergence confirmation.
-Checklist Panel — Tracks liquidity, momentum, HTF delivery, and SMT conditions.
-Setup Grade Display — Computes qualitative score (A+ to C) based on met conditions.
-----------------------------------------------------------------------------------------------
INPUT CATEGORIES
-----------------------------------------------------------------------------------------------
General — Detection mode, ATR strictness, bias filter, long/short window.
Liquidity — Automatic or manual timeframe alignment, session visuals.
FVG — Color themes, label sizes, inversion color change, HTF inclusion.
Entry / Limits — Enable or hide Entry, Break-Even, and Stop-Loss levels.
Alerts — Individual toggles for IFVG formation, session sweeps, multi-TF inversions, and invalidations.
Display — Info Box, relationship table, and grade styling.
All alerts output plain text messages only and do not execute orders.
-----------------------------------------------------------------------------------------------
ALERT FRAMEWORK
-----------------------------------------------------------------------------------------------
When enabled, alerts may notify for:
-Potential inversion detected.
-Confirmed IFVG formation.
-Liquidity sweeps (high/low or session).
-Multi-time-frame inversion.
-Invalidation or close warning.
-Alerts serve as educational markers only, not trade triggers.
The user will have the ability to create custom messages for each of these alert events.
-----------------------------------------------------------------------------------------------
USAGE GUIDELINES
-----------------------------------------------------------------------------------------------
iFVG Ultimate+ is suited for review and documentation of displacement-based price behavior.
Recommended educational workflows:
-Annotate IFVG events and review delivery into PD Arrays.
-Analyze frequency by session or timeframe.
-Assess how often IFVGs complete versus invalidate.
-Teach ICT-style liquidity mechanics in mentorship or training contexts.
-The indicator works across forex, futures, and crypto markets.
-----------------------------------------------------------------------------------------------
OPERATIONAL NOTES AND LIMITATIONS
-----------------------------------------------------------------------------------------------
-HTF calculations finalize on bar close (no look-ahead).
-ATR filter strength affects small-gap visibility.
-Session windows use New York time.
-Break-Even and Stop-Loss lines are visual aids only.
-Performance depends on chart density and bar count.
-No strategy module or backtest engine is included.
-----------------------------------------------------------------------------------------------
ORIGINALITY AND PROTECTION
-----------------------------------------------------------------------------------------------
iFVG Ultimate+ | DodgysDD integrates multiple independent systems into a single engine:
-PD Array context alignment with liquidity tracking.
-Dynamic session detection and macro data integration.
-Sequential IFVG validation pipeline with grade assignment.
-Multi-time-frame SMT confirmation module.
-Structured alerts and mitigation tracking.
The logic is entirely original, written in Pine v6, and protected as invite-only to preserve methodology integrity.
-----------------------------------------------------------------------------------------------
ATTRIBUTION
-----------------------------------------------------------------------------------------------
Core concepts such as Fair Value Gaps, Liquidity Sweeps, PD Arrays, and SMT Divergence are publicly taught within ICT-style market education. This implementation was designed and engineered by TakingProphets as iFVG Ultimate+ | DodgysDD, authored for TradingView publication by TakingProphets.
-----------------------------------------------------------------------------------------------
TERMS AND DISCLAIMER
-----------------------------------------------------------------------------------------------
This indicator is for educational and informational use only. It does not provide financial advice or predictive output. Historical patterns do not guarantee future results. All users remain responsible for their own decisions.Use of this script implies agreement with TradingView’s Vendor Requirements and Terms of Use.
-----------------------------------------------------------------------------------------------
ACCESS INSTRUCTIONS
-----------------------------------------------------------------------------------------------
Access is managed through TradingView’s invite-only framework. Users request access via private message to TakingProphets or access link
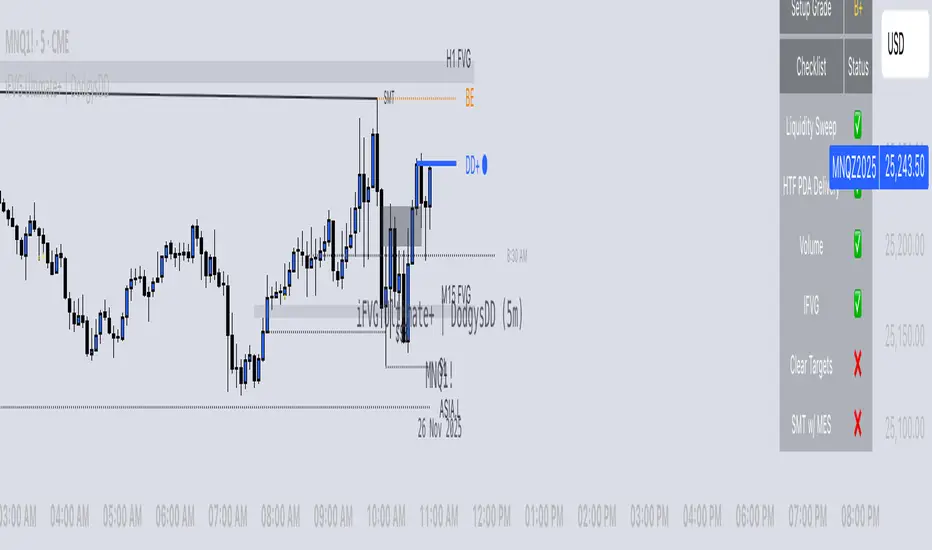
Structure Pro+ 2.4 Structure Pro+ 2.4
Summary
Structure Pro+ 2.4 is a comprehensive, all-in-one indicator designed for traders who utilize Smart Money Concepts (SMC). It automates the detection of key market structure events, identifies high-probability trade signals, and incorporates time-based filters to focus on the most volatile trading sessions, helping you make informed decisions with precision and clarity.
This suite goes beyond simple lines on a chart by integrating Market Structure, Fair Value Gaps (FVGs), and institutional trading sessions into a single, powerful tool.
Core Features
📈 Automatic Market Structure
Break of Structure (BOS) & Change of Character (CHoCH): The indicator automatically identifies and labels significant breaks in market structure, allowing you to instantly recognize trend continuations (BOS) or potential reversals (CHoCH).
Customizable Pivot Detection: Fine-tune the sensitivity of the structure detection by adjusting the Left Bars and Right Bars settings to match your trading style and timeframe, from scalping to swing trading.
🎯 High-Probability Breakout Signals
Receive clear BUY and SELL signals based on a powerful confluence of events. A signal only appears when:
A BOS or CHoCH is confirmed.
The breakout move is validated by the creation of a recent Fair Value Gap (FVG), indicating strong momentum.
The signal occurs within a valid, high-volatility time session.
The breakout is confirmed on a closed candle to prevent fakeouts.
🔍 Key Liquidity & Imbalance Zones
Fair Value Gaps (FVGs): Automatically detects and displays FVG (Imbalance) zones on your chart, highlighting key areas of interest where the price may return.
Order Blocks (OBs): Optionally display the last order block before a structural break. The length of the OB box can be customized to keep your chart clean.
🕒 Time-Based Session Filters (Killzones)
Timing is everything. Structure Pro+ 2.4 provides fully customizable time filters to ensure you are only trading in optimal market conditions.
ICT Macro Sessions: Enable and customize standard ICT Macro "Killzone" sessions, which are displayed visually on your chart.
NASDAQ Open Session: A dedicated, customizable session filter for the high-volatility NASDAQ open.
Timezone Synchronization: Set your preferred timezone (America/New_York by default) to align all sessions perfectly, no matter where you are in the world.
⚙️ Full Customization & Alerts
Visuals: Take complete control over the look and feel of the indicator, including colors, line styles, and label sizes.
Alert System: A comprehensive alert system allows you to get notified for every key event:
Signal (BUY/SELL)
BOS or CHoCH
BOS/CHoCH with FVG Confluence
Start of a Macro Session
How to Use
Identify the Trend: Use the automatically plotted BOS and CHoCH labels to determine the current market bias on your chosen timeframe. An uptrend is defined by a series of bullish BOS, while a downtrend is defined by bearish BOS. A CHoCH signals a potential shift in this bias.
Wait for a Signal in a Valid Session: Be patient and wait for a BUY or SELL signal to appear on your chart. Ensure the signal occurs within one of the active, visually-drawn time sessions (Macros or NASDAQ Open) for the highest probability.
Confirm and Manage Risk: Use the signal as a primary point of confluence in your trading plan. For best results, combine it with your own analysis. Always practice proper risk management by setting a stop loss, typically below the low of the swing that caused a BUY signal or above the high of the swing that caused a SELL signal.
Disclaimer: This indicator is a tool designed to assist in trade analysis and should not be considered as financial advice. Trading involves substantial risk, and past performance is not indicative of future results. Always conduct your own research and risk assessment before entering any trade.

TLM HTF CandlesTLM HTF Candles
Higher timeframe candles displayed on your current chart, optimized for The Lab Model (TLM) trading methodology.
What It Does
Plots up to 6 HTF candles side-by-side on the right of your chart with automatic swing detection, expansion bias coloring, and a quick-reference info table. Watch multiple timeframes at once without switching charts.
Swing Detection - Solid lines for confirmed swings, dashed for potential swings. Detects when HTF levels get swept and rejected.
Expansion Bias - Candles colored green (bullish), red (bearish), or orange (conflicted) based on 3-candle patterns showing expected price expansion.
HTF Info Table - Compact dashboard showing time to close, active swings, and expansion direction for all timeframes. Toggle dark/light mode.
Equilibrium Lines - 50% midpoint from previous candle to current, great for mean reversion targets.
Based on "ICT HTF Candles" by @fadizeidan -
Heavily customized with swing analysis, expansion patterns, and info table for TLM trading concepts.

Smarter Money Concepts Dashboard [PhenLabs]📊Smarter Money Concepts Dashboard
Version: PineScript™v6
📌Description
The Smarter Money Concepts Dashboard is a comprehensive institutional trading analysis tool that combines six of our most powerful smarter money concepts indicators into one unified suite. This advanced system automatically detects and visualizes Fair Value Gaps, Inverted FVGs, Order Blocks, Wyckoff Springs/Upthrusts, Wick Rejection patterns, and ICT Market Structure analysis.
Built for serious traders who need institutional-grade market analysis, this dashboard eliminates subjective interpretation by automatically identifying where smart money is likely positioned. The integrated real-time dashboard provides instant status updates on all active patterns, making it easy to monitor market conditions at a glance.
🚀Points of Innovation
● Multi-Module Integration: Six different SMC concepts unified in one comprehensive system
● Real-Time Dashboard Display: Live tracking of all active patterns with customizable positioning
● Advanced Volume Filtering: Institutional volume confirmation across all pattern types
● Automated Pattern Management: Smart memory system prevents chart clutter while maintaining relevant zones
● Probability-Based Wyckoff Detection: Mathematical probability calculations for spring/upthrust patterns
● Dual FVG System: Both standard and inverted Fair Value Gap detection with equilibrium analysis
🔧Core Components
● Fair Value Gap Engine: Detects standard FVGs with volume confirmation and equilibrium line analysis
● Inverted FVG Module: Advanced IFVG detection using RVI momentum filtering for inversion confirmation
● Order Block System: Institutional order block identification with customizable mitigation methods
● Wyckoff Pattern Recognition: Automated spring and upthrust detection with probability scoring
● Wick Rejection Analysis: High-probability reversal patterns based on wick-to-body ratios
● ICT Market Structure: Simplified institutional concepts with commitment tracking
🔥Key Features
● Comprehensive Pattern Detection: All major SMC concepts in one indicator with automatic identification
● Volume-Confirmed Signals: Multiple volume filters ensure only institutional-grade patterns are highlighted
● Interactive Dashboard: Real-time status display with active pattern counts and module status
● Smart Memory Management: Automatic cleanup of old patterns while preserving relevant market zones
● Full Alert System: Complete notification coverage for all pattern types and signal generations
● Customizable Display Options: Adjustable colors, transparency, and positioning for all visual elements
🎨Visualization
● Color-Coded Zones: Distinct color schemes for bullish/bearish patterns across all modules
● Dynamic Box Extensions: Automatically extending zones until mitigation or invalidation
● Equilibrium Lines: Fair Value Gap midpoint analysis with dotted line visualization
● Signal Markers: Clear spring/upthrust signals with directional arrows and probability indicators
● Dashboard Table: Professional-grade status panel with module activation and pattern counts
● Candle Coloring: Wick rejection highlighting with transparency-based visual emphasis
📖Usage Guidelines
Fair Value Gap Settings
● Days to Analyze: Default 15, Range 1-100 - Controls historical FVG detection period
● Volume Filter: Enables institutional volume confirmation for gap validity
● Min Volume Ratio: Default 1.5 - Minimum volume spike required for gap recognition
● Show Equilibrium Lines: Displays FVG midpoint analysis for precise entry targeting
Order Block Configuration
● Scan Range: Default 25 bars - Lookback period for structure break identification
● Volume Filter: Institutional volume confirmation for order block validation
● Mitigation Method: Wick or Close-based invalidation for different trading styles
● Min Volume Ratio: Default 1.5 - Volume threshold for significant order block formation
Wyckoff Analysis Parameters
● S/R Lookback: Default 20 - Support/resistance calculation period for spring/upthrust detection
● Volume Spike Multiplier: Default 1.5 - Required volume increase for pattern confirmation
● Probability Threshold: Default 0.7 - Minimum probability score for signal generation
● ATR Recovery Period: Default 5 - Price recovery calculation for pattern strength assessment
Market Structure Settings
● Auto-Detect Zones: Automatic identification of high-volume thin zones
● Proximity Threshold: Default 0.20% - Price proximity requirements for zone interaction
● Test Window: Default 20 bars - Time period for zone commitment calculation
Display Customization
● Dashboard Position: Four corner options for optimal chart layout
● Text Size: Scalable from Tiny to Large for different screen configurations
● Pattern Colors: Full customization of all bullish and bearish zone colors
✅Best Use Cases
● Swing Trading: Identify major institutional zones for multi-day position entries
● Day Trading: Precise intraday entries at Fair Value Gaps and Order Block boundaries
● Trend Analysis: Market structure confirmation for directional bias establishment
● Risk Management: Clear invalidation levels provided by all pattern boundaries
● Multi-Timeframe Analysis: Works across all timeframes from 1-minute to monthly charts
⚠️Limitations
● Market Condition Dependency: Performance varies between trending and ranging market environments
● Volume Data Requirements: Requires accurate volume data for optimal pattern confirmation
● Lagging Nature: Some patterns confirmed after initial price movement has begun
● Pattern Density: High-volatility markets may generate excessive pattern signals
● Educational Tool: Requires understanding of smart money concepts for effective application
💡What Makes This Unique
● Complete SMC Integration: First indicator to combine all major smart money concepts comprehensively
● Real-Time Dashboard: Instant visual feedback on all active institutional patterns
● Advanced Volume Analysis: Multi-layered volume confirmation across all detection modules
● Probability-Based Signals: Mathematical approach to Wyckoff pattern recognition accuracy
● Professional Memory Management: Sophisticated pattern cleanup without losing market relevance
🔬How It Works
1. Pattern Detection Phase:
● Multi-timeframe scanning for institutional footprints across all enabled modules
● Volume analysis integration confirms patterns meet institutional trading criteria
● Real-time pattern validation ensures only high-probability setups are displayed
2. Signal Generation Process:
● Automated zone creation with precise boundary definitions for each pattern type
● Dynamic extension system maintains relevance until mitigation or invalidation occurs
● Alert system activation provides immediate notification of new pattern formations
3. Dashboard Update Cycle:
● Live status monitoring tracks all active patterns and module states continuously
● Pattern count updates provide instant feedback on current market condition density
● Commitment tracking for market structure analysis shows institutional engagement levels
💡Note:
This indicator represents institutional trading concepts and should be used as part of a comprehensive trading strategy. Pattern recognition accuracy improves with understanding of smart money principles. Combine with proper risk management and multiple confirmation methods for optimal results.
