TLM HTF CandlesTLM HTF Candles
Higher timeframe candles displayed on your current chart, optimized for The Lab Model (TLM) trading methodology.
What It Does
Plots up to 6 HTF candles side-by-side on the right of your chart with automatic swing detection, expansion bias coloring, and a quick-reference info table. Watch multiple timeframes at once without switching charts.
Swing Detection - Solid lines for confirmed swings, dashed for potential swings. Detects when HTF levels get swept and rejected.
Expansion Bias - Candles colored green (bullish), red (bearish), or orange (conflicted) based on 3-candle patterns showing expected price expansion.
HTF Info Table - Compact dashboard showing time to close, active swings, and expansion direction for all timeframes. Toggle dark/light mode.
Equilibrium Lines - 50% midpoint from previous candle to current, great for mean reversion targets.
Based on "ICT HTF Candles" by @fadizeidan -
Heavily customized with swing analysis, expansion patterns, and info table for TLM trading concepts.
Cerca negli script per "ict"

Smarter Money Concepts Dashboard [PhenLabs]📊Smarter Money Concepts Dashboard
Version: PineScript™v6
📌Description
The Smarter Money Concepts Dashboard is a comprehensive institutional trading analysis tool that combines six of our most powerful smarter money concepts indicators into one unified suite. This advanced system automatically detects and visualizes Fair Value Gaps, Inverted FVGs, Order Blocks, Wyckoff Springs/Upthrusts, Wick Rejection patterns, and ICT Market Structure analysis.
Built for serious traders who need institutional-grade market analysis, this dashboard eliminates subjective interpretation by automatically identifying where smart money is likely positioned. The integrated real-time dashboard provides instant status updates on all active patterns, making it easy to monitor market conditions at a glance.
🚀Points of Innovation
● Multi-Module Integration: Six different SMC concepts unified in one comprehensive system
● Real-Time Dashboard Display: Live tracking of all active patterns with customizable positioning
● Advanced Volume Filtering: Institutional volume confirmation across all pattern types
● Automated Pattern Management: Smart memory system prevents chart clutter while maintaining relevant zones
● Probability-Based Wyckoff Detection: Mathematical probability calculations for spring/upthrust patterns
● Dual FVG System: Both standard and inverted Fair Value Gap detection with equilibrium analysis
🔧Core Components
● Fair Value Gap Engine: Detects standard FVGs with volume confirmation and equilibrium line analysis
● Inverted FVG Module: Advanced IFVG detection using RVI momentum filtering for inversion confirmation
● Order Block System: Institutional order block identification with customizable mitigation methods
● Wyckoff Pattern Recognition: Automated spring and upthrust detection with probability scoring
● Wick Rejection Analysis: High-probability reversal patterns based on wick-to-body ratios
● ICT Market Structure: Simplified institutional concepts with commitment tracking
🔥Key Features
● Comprehensive Pattern Detection: All major SMC concepts in one indicator with automatic identification
● Volume-Confirmed Signals: Multiple volume filters ensure only institutional-grade patterns are highlighted
● Interactive Dashboard: Real-time status display with active pattern counts and module status
● Smart Memory Management: Automatic cleanup of old patterns while preserving relevant market zones
● Full Alert System: Complete notification coverage for all pattern types and signal generations
● Customizable Display Options: Adjustable colors, transparency, and positioning for all visual elements
🎨Visualization
● Color-Coded Zones: Distinct color schemes for bullish/bearish patterns across all modules
● Dynamic Box Extensions: Automatically extending zones until mitigation or invalidation
● Equilibrium Lines: Fair Value Gap midpoint analysis with dotted line visualization
● Signal Markers: Clear spring/upthrust signals with directional arrows and probability indicators
● Dashboard Table: Professional-grade status panel with module activation and pattern counts
● Candle Coloring: Wick rejection highlighting with transparency-based visual emphasis
📖Usage Guidelines
Fair Value Gap Settings
● Days to Analyze: Default 15, Range 1-100 - Controls historical FVG detection period
● Volume Filter: Enables institutional volume confirmation for gap validity
● Min Volume Ratio: Default 1.5 - Minimum volume spike required for gap recognition
● Show Equilibrium Lines: Displays FVG midpoint analysis for precise entry targeting
Order Block Configuration
● Scan Range: Default 25 bars - Lookback period for structure break identification
● Volume Filter: Institutional volume confirmation for order block validation
● Mitigation Method: Wick or Close-based invalidation for different trading styles
● Min Volume Ratio: Default 1.5 - Volume threshold for significant order block formation
Wyckoff Analysis Parameters
● S/R Lookback: Default 20 - Support/resistance calculation period for spring/upthrust detection
● Volume Spike Multiplier: Default 1.5 - Required volume increase for pattern confirmation
● Probability Threshold: Default 0.7 - Minimum probability score for signal generation
● ATR Recovery Period: Default 5 - Price recovery calculation for pattern strength assessment
Market Structure Settings
● Auto-Detect Zones: Automatic identification of high-volume thin zones
● Proximity Threshold: Default 0.20% - Price proximity requirements for zone interaction
● Test Window: Default 20 bars - Time period for zone commitment calculation
Display Customization
● Dashboard Position: Four corner options for optimal chart layout
● Text Size: Scalable from Tiny to Large for different screen configurations
● Pattern Colors: Full customization of all bullish and bearish zone colors
✅Best Use Cases
● Swing Trading: Identify major institutional zones for multi-day position entries
● Day Trading: Precise intraday entries at Fair Value Gaps and Order Block boundaries
● Trend Analysis: Market structure confirmation for directional bias establishment
● Risk Management: Clear invalidation levels provided by all pattern boundaries
● Multi-Timeframe Analysis: Works across all timeframes from 1-minute to monthly charts
⚠️Limitations
● Market Condition Dependency: Performance varies between trending and ranging market environments
● Volume Data Requirements: Requires accurate volume data for optimal pattern confirmation
● Lagging Nature: Some patterns confirmed after initial price movement has begun
● Pattern Density: High-volatility markets may generate excessive pattern signals
● Educational Tool: Requires understanding of smart money concepts for effective application
💡What Makes This Unique
● Complete SMC Integration: First indicator to combine all major smart money concepts comprehensively
● Real-Time Dashboard: Instant visual feedback on all active institutional patterns
● Advanced Volume Analysis: Multi-layered volume confirmation across all detection modules
● Probability-Based Signals: Mathematical approach to Wyckoff pattern recognition accuracy
● Professional Memory Management: Sophisticated pattern cleanup without losing market relevance
🔬How It Works
1. Pattern Detection Phase:
● Multi-timeframe scanning for institutional footprints across all enabled modules
● Volume analysis integration confirms patterns meet institutional trading criteria
● Real-time pattern validation ensures only high-probability setups are displayed
2. Signal Generation Process:
● Automated zone creation with precise boundary definitions for each pattern type
● Dynamic extension system maintains relevance until mitigation or invalidation occurs
● Alert system activation provides immediate notification of new pattern formations
3. Dashboard Update Cycle:
● Live status monitoring tracks all active patterns and module states continuously
● Pattern count updates provide instant feedback on current market condition density
● Commitment tracking for market structure analysis shows institutional engagement levels
💡Note:
This indicator represents institutional trading concepts and should be used as part of a comprehensive trading strategy. Pattern recognition accuracy improves with understanding of smart money principles. Combine with proper risk management and multiple confirmation methods for optimal results.

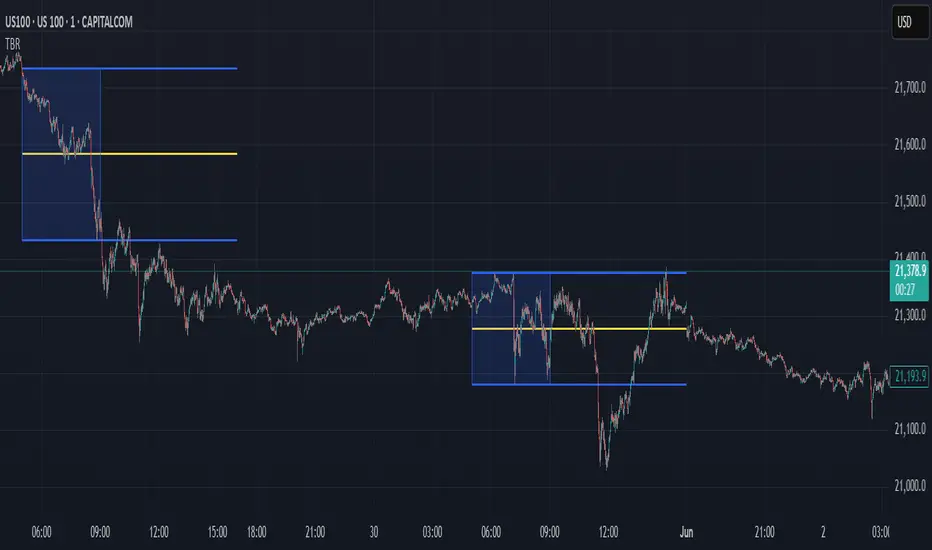
NQ Bias — Fixed Session (6PM & Midnight Opens)📰 Script Summary — NQ Bias (Fixed Session)
📌 Purpose:
This Pine Script helps traders track bias shifts on Nasdaq futures (NQ) using ICT-style reference points like the 6PM open, Midnight open, and 4PM close.
⚙️ How It Works:
Plots session opens (6PM, Midnight) as bias reference lines.
Highlights when price is trading above or below the 4PM New York Close → tells you if the market is leaning bullish or bearish.
Uses background coloring (green/red) to visually show bias.
Lets you filter by specific trading dates for focused backtesting.
Designed with ICT principles → focus on daily opens, session shifts, and premium/discount logic.
📈 Trader Benefit:
Quickly see if NQ is in bullish or bearish context relative to key opens.
Simplifies daily bias framework into an easy chart overlay.
Helps align trades with the higher-probability side of the market.

TF ZONES VIPTF Zones is a session and higher-timeframe reference tool for intraday and swing traders (ICT / SMC concepts).
🔹 Features
Killzones (Sessions):
Automatically draws Asia, London, New York AM, New York Lunch, and New York PM ranges.
• Customizable box colors, transparency, and labels
• High/Low pivot lines with optional midpoints
• Alerts when pivots are broken
Day / Week / Month Levels:
• Daily / Weekly / Monthly Opens
• Daily / Weekly / Monthly Highs & Lows
• Alerts on High/Low breaks
Day-of-Week Zones:
Color-coded boxes for each weekday (Mon–Sun) to track daily ranges.
Previous Year High/Low:
Plots prior year’s H/L with labels (PY.H / PY.L).
🔧 Customization
Session drawing limits (max days stored)
Timezone selection (GMT offsets or New York)
Label size, text color, and line style
Box transparency and text display options
Optional alerts on key level breaks
📌 Use Case
Perfect for traders who want to:
Track session ranges (ICT Killzones)
Visualize intraday structure clearly
Use Daily / Weekly / Monthly opens and ranges as confluence
Monitor higher-timeframe and yearly reference levels

TF ZonesTF Zones is a session and higher-timeframe reference tool for intraday and swing traders (ICT / SMC concepts).
🔹 Features
Killzones (Sessions):
Automatically draws Asia, London, New York AM, New York Lunch, and New York PM ranges.
• Customizable box colors, transparency, and labels
• High/Low pivot lines with optional midpoints
• Alerts when pivots are broken
Day / Week / Month Levels:
• Daily / Weekly / Monthly Opens
• Daily / Weekly / Monthly Highs & Lows
• Alerts on High/Low breaks
Day-of-Week Zones:
Color-coded boxes for each weekday (Mon–Sun) to track daily ranges.
Previous Year High/Low:
Plots prior year’s H/L with labels (PY.H / PY.L).
🔧 Customization
Session drawing limits (max days stored)
Timezone selection (GMT offsets or New York)
Label size, text color, and line style
Box transparency and text display options
Optional alerts on key level breaks
📌 Use Case
Perfect for traders who want to:
Track session ranges (ICT Killzones)
Visualize intraday structure clearly
Use Daily / Weekly / Monthly opens and ranges as confluence
Monitor higher-timeframe and yearly reference levels

Trading Sessions (L3J) Trading Sessions Indicator (L3J)
Overview
This Pine Script indicator displays precise trading session boxes for the three major global trading sessions: Asia, London, and US (Cash). Unlike traditional session indicators that show continuous background colors, this script creates rectangular boxes that precisely delimit each session from start to finish.
Features
🌍 Global Timezone Support
- 39 timezone options covering all major financial centers
- Automatic daylight saving time adjustments for named timezones
- Universal compatibility with all TradingView charts
📦 Session Boxes
- Precise delimitation: Each session is contained within a rectangular box
- Dynamic sizing: Boxes automatically adjust to session high/low prices
- Visual distinction: Completed sessions (solid borders) vs ongoing sessions (dashed borders)
- Customizable borders: Toggle on/off with adjustable thickness (0-5px)
🎨 Visual Customization
- Individual session colors: Fully customizable for Asia, London, and US sessions
- Border matching: Border colors automatically match session box colors
- Transparency control: Built-in opacity settings for each session
- Clean interface: Minimal visual clutter with maximum information
⚙️ Management Options
- Box limit control: Set maximum number of historical boxes per session (1-50)
- Automatic cleanup: Old boxes are automatically removed to maintain performance
- Memory efficient: Optimized for long-term chart analysis
Default Session Times (EDT - Etc/GMT+4)
| Session | Default Hours | Markets Covered |
|---------|---------------|-----------------|
| Asia | 18:00 - 02:00 | Tokyo, Sydney, Hong Kong |
| London | 02:00 - 11:00 | London, Frankfurt, European markets |
| US Cash | 09:30 - 16:00 | NYSE, NASDAQ |
> Note: Default times are in EDT (Eastern Daylight Time). Adjust session hours according to your selected timezone.
Timezone Conversion Examples
For UTC Users:
- Asia: 22:00 - 06:00
- London: 06:00 - 15:00
- US: 13:30 - 20:00
For Europe/London Users:
- Asia: 23:00 - 07:00
- London: 07:00 - 16:00
- US: 14:30 - 21:00
Usage Instructions
1. Add to chart: Apply the indicator to any timeframe
2. Select timezone: Choose your local timezone from the dropdown
3. Adjust session hours: Modify session times if needed for your timezone
4. Customize appearance: Set colors, borders, and box limits
5. Enable/disable sessions: Toggle individual sessions on/off as needed
Technical Specifications
- Pine Script Version: v6
- Chart Type: Overlay indicator
- Maximum Objects: 150 boxes, 500 lines, 200 labels
- Performance: Optimized for real-time updates
- Compatibility: All TradingView chart types and timeframes
Integration with Other Scripts
This indicator is designed to work seamlessly with other L3J trading scripts:
- ICT Levels Indicators: Provides session context for key levels
- Market Structure Scripts: Session boxes help identify structural breaks
- Volume Profile Tools: Session delimitation for volume analysis
- Support/Resistance Scripts: Session-based level identification
> Recommended: Use this as a base layer with other L3J indicators for comprehensive market analysis.
Key Benefits
🎯 Precision Trading
- Exact session boundaries: No guesswork about session start/end times
- Clean visual reference: Clear session delimitation for strategy execution
- Multi-timeframe compatibility: Works on all chart timeframes
📊 Professional Analysis
- Institution-grade accuracy: Matches professional trading platforms
- Customizable for any strategy: Adaptable to various trading approaches
- Performance optimized: Minimal impact on chart loading times
🔄 Real-time Updates
- Live session tracking: Ongoing sessions update in real-time
- Automatic management: Old sessions are cleaned up automatically
- Memory efficient: Optimized for extended trading sessions
Author Information
Created by: L3J
Version: 1.0
Category: Session Analysis / Market Hours
License: For use with L3J trading script ecosystem
---
Support & Integration
This indicator is part of the L3J Trading Script Collection. For optimal results, combine with other L3J indicators:
- ICT Key Levels
- Market Structure Analysis
- Volume Profile Tools
- Support/Resistance Scripts
Note: This script is specifically designed to complement and enhance other L3J trading tools. Individual use is supported, but maximum effectiveness is achieved when used as part of the complete L3J trading system.
---
For technical support or integration questions, refer to the L3J script documentation or community resources.

HSM KILLZONE Basic v2This Killzones indicator was designed to simplify ICT-based execution by focusing only on the three main windows (Asia, London, and New York), removing clutter and unnecessary sessions from other versions, and providing full customization of times, colors, and visibility by timeframe.
The ICT Killzones indicator allows you to track the main trading windows: London, Asia, and New York.
You can use these windows as time-based liquidity zones, or wait for them as operational ranges to look for false breakouts and then apply your trading triggers.
Once added to your chart, the three zones will be automatically plotted for you.
Give priority to USD pairs during the New York Killzone.
Focus on EUR and GBP pairs during the London Killzone.
For the Asian Killzone, use pairs such as JPY, NZD, or AUD.
The indicator is fully customizable: you can modify the start and end times of each window, change colors according to your preference, and adjust visibility by timeframe.

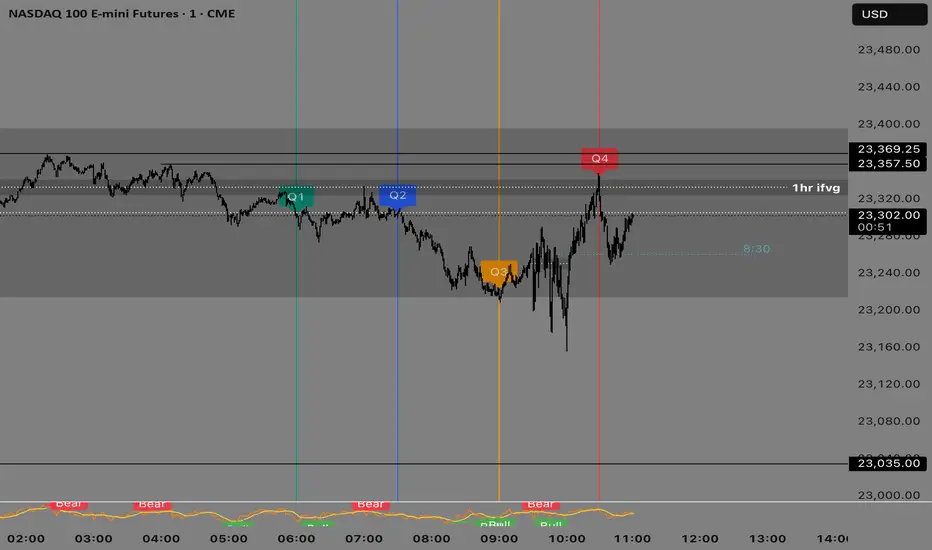
Quarterly Theory —Q1,Q2,Q3,Q4The Quarterly Theory Indicator is a trading tool designed to visualize the natural time-based cycles of the market, based on the principles of Quarterly Theory, popularized by the Inner Circle Trader (ICT). The indicator divides market sessions into four equal “quarters” to help traders identify potential accumulation, manipulation, and distribution phases (AMD model) and improve the timing of entries and exits.
Key Features:
Quarter Divisions (Q1–Q4):
Each market session (e.g., NY AM, London, Asia) is divided into four quarters.
Vertical lines mark the beginning of each quarter, making it easy to track session structure.
Optional labels show Q1, Q2, Q3, and Q4 directly on the chart.
True Open (Q2 Open):
The True Open is the opening price of Q2, considered a key reference point in Quarterly Theory.
A horizontal red line is drawn at the True Open price with a label showing the exact value.
This line helps traders filter bullish and bearish setups:
Buy below the True Open if the market is bullish.
Sell above the True Open if the market is bearish.
Session Awareness:
The indicator can automatically detect market sessions and reset lines and labels for each new session.
Ensures that only the current session’s True Open and quarter lines are displayed, reducing chart clutter.
Timeframe Flexibility:
Works on any chart timeframe (1-minute to daily).
Maintains accurate alignment of quarters and True Open regardless of the timeframe used.
Purpose of Quarterly Theory:
Quarterly Theory is based on the idea that market behavior is fractal and time-driven. By dividing sessions into four quarters, traders can anticipate potential market phases:
Q1: Initial price discovery and setup for the session.
Q2: Accumulation or manipulation phase, where the True Open is established.
Q3: Manipulation or Judas Swing phase designed to trap traders.
Q4: Distribution or trend continuation/reversal.
By visualizing these quarters and the True Open, traders can reduce ambiguity, identify high-probability setups, and improve their timing in line with the ICT AMD (Accumulation, Manipulation, Distribution) framework.
ACR(Average Candle Range) With TargetsWhat is ACR?
The Average Candle Range (ACR) is a custom volatility metric that calculates the mean distance between the high and low of a set number of past candles. ACR focuses only on the actual candle range (high - low) of specific past candles on a chosen timeframe.
This script calculates and visualizes the Average Candle Range (ACR) over a user-defined number of candles on a custom timeframe. It displays a table of recent range values, plots dynamic bullish and bearish target levels, and marks the start of each new candle with a vertical line. All calculations update in real time as price action develops. This script was inspired by the “ICT ADR Levels - Judas x Daily Range Meter°” by toodegrees.
Key Features
Custom Timeframe Selection: Choose any timeframe (e.g., 1D, 4H, 15m) for analysis.
User-Defined Lookback: Calculate the average range across 1 to 10 previous candles.
Dynamic Targets:
Bullish Target: Current candle low + ACR.
Bearish Target: Current candle high – ACR.
Live Updates: Targets adjust intrabar as highs or lows change during the current candle.
Candle Start Markers: Vertical lines denote the open of each new candle on the selected timeframe.
Floating Range Table:
Displays the current ACR value.
Lists individual ranges for the previous five candles.
Extend Target Lines: Choose to extend bullish and bearish target levels fully across the screen.
Global Visibility Controls: Toggle on/off all visual elements (targets, vertical lines, and table) for a cleaner view.
How It Works
At each new candle on the user-selected timeframe, the script:
Draws a vertical line at the candle’s open.
Recalculates the ACR based on the inputted previous number of candles.
Plots target levels using the current candle's developing high and low values.
Limitation
Once the price has already moved a full ACR in the opposite direction from your intended trade, the associated target loses its practical value. For example, if you intended to trade long but the bearish ACR target is hit first, the bullish target is no longer a reliable reference for that session.
Use Case
This tool is designed for traders who:
Want to visualize the average movement range of candles over time.
Use higher or lower timeframe candles as structural anchors.
Require real-time range-based price levels for intraday or swing decision-making.
This script does not generate entry or exit signals. Instead, it supports range awareness and target projection based on historical candle behavior.
Key Difference from Similar Tools
While this script was inspired by “ICT ADR Levels - Judas x Daily Range Meter°” by toodegrees, it introduces a major enhancement: the ability to customize the timeframe used for calculating the range. Most ADR or candle-range tools are locked to a single timeframe (e.g., daily), but this version gives traders full control over the analysis window. This makes it adaptable to a wide range of strategies, including intraday and swing trading, across any market or asset.

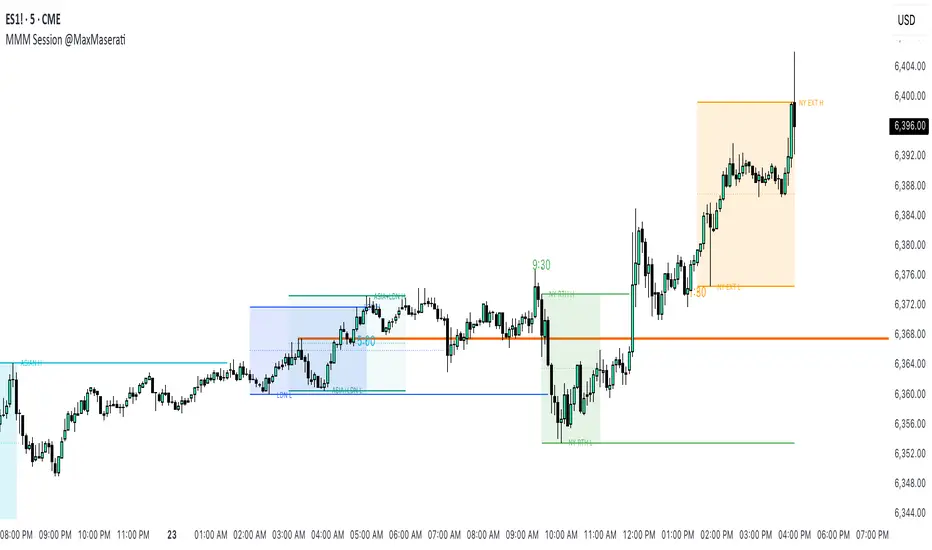
Session Overlaps & KZ's @MaxMaseratiSession Overlap & KZ's @MaxMaserati - Indicator Explanation
This comprehensive trading session indicator specializes in identifying critical market overlap periods and key session levels with two main operating modes: Normal Sessions and ICT KZ's
Dual Session Modes:
- Normal Sessions: Extended timeframes (Asia 9PM-6AM, London 3AM-12PM, NY AM 8AM-5PM, NY PM 1-7PM)
- ICT Killzones: Focused timeframes (Asia 6-8PM, London 2-5AM, NY AM 9:30-11AM, NY PM 1:30-4PM)
Primary Focus - Market Overlap Sessions:
- Asian + London Overlap (3-6AM ET): The most volatile early morning period when Asian and London markets intersect, creating significant liquidity and price movement opportunities.
- London + NY Overlap (8AM-12PM ET): The highest volume trading window of the day when London and New York markets are simultaneously active, offering maximum institutional activity and trend continuation.
- London Solo (6-8AM ET): Pure London trading period after Asian close but before NY open, often used for trend establishment and key level testing.
- NY Solo (12-5PM ET): Isolated New York session after London close, typically showing strong directional moves and institutional positioning.
- NY AM + PM Overlap (1:30-4PM ET): Critical afternoon overlap period when morning and afternoon NY sessions intersect, often marking significant reversal or continuation points.
Session Level Analysis:
Tracks High, Low, and Midpoint levels for each active session and overlap period
Smart line extension that continues levels until price interaction
Visual session boxes with customizable transparency
Show Only Overlaps mode to focus purely on market intersection periods
Critical Time Markers:
9:30 AM: NY AM Open (green dot)
5:00 AM: MMM Foundational time for MMM trading strategies (blue dot)
1:30 PM: NY PM Open (orange dot)
Additional Features:
Previous Day High/Low (PDH/PDL) levels
Multi-timezone support
Session limit control (last 3 sets by default)
Optimized for 15-minute and lower timeframes
Full customization of colors, labels, and styles
This indicator is essential for overlap-based trading strategies, providing clear visual identification of high-probability windows when multiple markets create enhanced liquidity and institutional activity.
Order-Flow Market StructureOrder-Flow Market Structure by The_Forex_Steward
A precision tool for visualizing internal shifts, swing structure, BOS events, Fibonacci levels, and multi-timeframe alerts.
What It Does
The Order-Flow Market Structure indicator intelligently tracks and visualizes price structure using higher timeframe candles. It automatically detects:
• Internal bullish and bearish structure shifts
• Swing highs and lows (HH, HL, LH, LL)
• Break of Structure (BoS) confirmations
• Fibonacci retracement levels from recent swing moves
• Real-time alerts across LTF, MTF, and HTF modes
It’s a complete tool for traders who follow Smart Money Concepts, ICT, or institutional price action strategies.
How It Works
• You select a Higher Timeframe (HTF) to set the structural context
• Internal shifts are identified using HTF candle closes
• The indicator scans for swing highs/lows after each internal shift
• Breaks of previous swing points confirm BoS and plot horizontal lines
• Zigzag lines visually connect structural points (swings and BoS)
• Fibonacci levels are drawn between the latest swings
• Alerts can be configured for structure shifts, BoS events, and fib level breaks
How to Use It
Set your preferred HTF (e.g., 1H while trading on 5-minute)
Enable Fibonacci levels to visualize retracement zones
Watch for:
• Bullish internal shifts → HL to HH
• Bearish internal shifts → LH to LL
• BOS → Breakout confirmation
Enable alerts to catch structural events in real-time
Adjust the "Safe History Offset" if working with long lookbacks or volatile assets
Who It's For
• Traders using Smart Money, ICT, or market structure-based systems
• Scalpers, day traders, and swing traders
• Anyone needing precise structural insight across multiple timeframes
Features
• BoS detection with custom line styles and width
• HH, HL, LH, LL label plotting
• Optional Fibonacci retracement zones
• Custom alerts for swing shifts and fib level breaks
• LTF, MTF, and HTF alert modes
Stay aligned with structure, trade with precision, and get alerted to key shifts in real time.

Mohammad - OBs, BOS, S/R, Elliott Waves & Trend LinesProfessional Trading Indicator System - Technical Analysis Suite
Overview
Advanced technical analysis system integrating ICT/SMC methodologies with classical analysis tools. Features seven analytical components for comprehensive market structure analysis.
Components
1. Order Blocks (ICT/SMC)
Identifies institutional accumulation/distribution zones acting as future support/resistance.
Detection: Automatic identification based on price rejection patterns
Management: Dynamic updates and removal of invalidated blocks
Configuration: Sensitivity levels (High/Medium/Low), ATR-based parameters
Visual: Green support, red resistance with transparency
2. Break of Structure (BOS)
Detects significant structural breaks indicating trend changes.
Method: 5-bar swing point formation
Display: White horizontal lines with labels
Range: 50-bar maximum lookback
3. Support & Resistance
Classical horizontal levels from significant price pivots.
Analysis: 300-bar historical scan
Filter: 10-point duplicate tolerance
Display: Maximum 15 levels within 5% of current price
4. Fair Value Gaps (FVG)
Price inefficiencies that often get filled on return.
Types: Bullish gaps (up) and bearish gaps (down)
Size: Minimum 0.1 ATR or 5 points
Management: Auto-removal when filled
5. Elliott Wave Analysis
Advanced pattern recognition for impulse and corrective waves.
Patterns: 5-wave impulse (1-2-3-4-5), 3-wave corrective (A-B-C)
Adaptive: Auto-adjusts to timeframe (3-10 depth range)
Display: Small dots with large numbers, starts from hidden point 0
6. 45-Degree Momentum Lines
Revolutionary projection system based on consecutive candle sequences.
Bearish Lines (Red):
Trigger: 5+ consecutive red candles
Start: HIGH of first red candle
Labels: B1-B5
Bullish Lines (Green):
Trigger: 5+ consecutive green candles
Start: LOW of first green candle
Labels: T1-T5
Specifications:
Angle: 45° using ATR * 0.15
Extension: 30 bars forward
Display: 5 most recent patterns
7. Classical Trend Lines
Multi-touch diagonal support/resistance detection.
Validation: Minimum touch requirements
Tolerance: ATR-based touch detection
Display: Blue lines with optional labels
Configuration Summary
Global Settings:
Show/hide each component individually
Customizable colors and line widths
Label size options
Performance:
50-bar periodic cleanup
Maximum object limits (500 each)
Conditional processing on bar close
Trading Applications
Scalping: Order Blocks + FVGs + 45° Lines
Day Trading: All components with BOS emphasis
Swing Trading: Elliott Waves + Trend Lines
Position Trading: Major levels + Elliott Waves
Key Strategies:
Use 45° line bounces for entries
Combine Order Blocks with 45° lines for confluence
Confirm BOS breaks with 45° line violations
Place stops beyond projection lines
Technical Requirements
Platform: TradingView Pine Script v5
Minimum: 300 historical bars
Optimal: 15m-4H timeframes
Performance: Moderate CPU usage
Color Scheme
Green: Bullish/Support (#26a69a)
Red: Bearish/Resistance (#ef5350)
White: BOS/S&R lines
Blue: Elliott Waves/Trend Lines
Customizable: 45° projection lines
Risk Disclaimer
Educational tool only. Not financial advice. Combine with risk management and personal analysis. Past performance doesn't guarantee future results. Trading involves substantial risk.

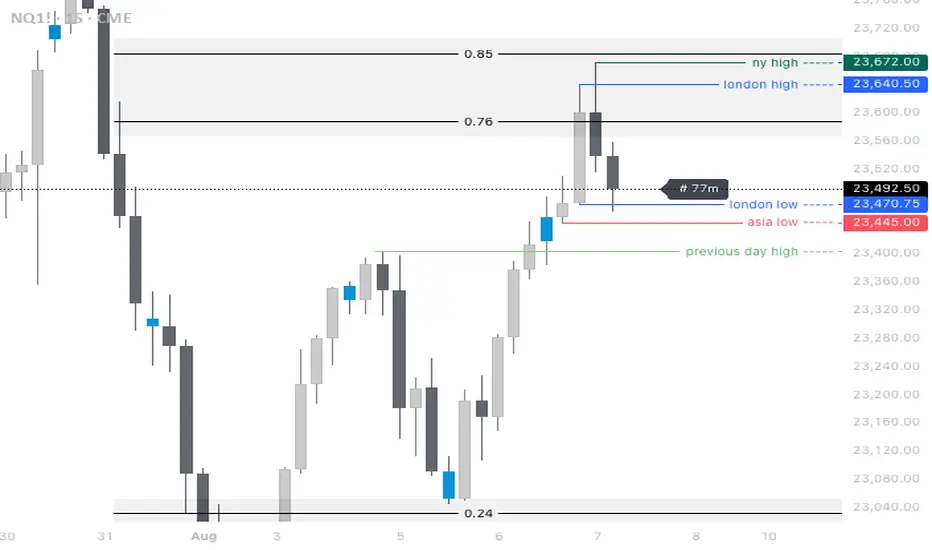
MP MTF LiquidityMP MTF Liquidity
Multi-Timeframe Liquidity Levels – Automatic High/Low Tracking
This indicator automatically tracks and draws liquidity levels (recent highs and lows) from up to 6 custom timeframes directly on your chart. It’s designed for advanced traders who want to visualize important swing points and liquidity pools across multiple timeframes—ideal for Smart Money Concepts (SMC), ICT, and price action trading.
Key Features:
Multi-Timeframe Support:
Select up to 6 different timeframes (ex: 1H, 4H, Daily, Weekly, etc.), each with separate color and visibility controls.
Real Liquidity (No Repaint):
Levels are only drawn from fully closed bars on each timeframe—no lines from currently forming candles, ensuring accuracy and no forward-looking bias.
Automatic Detection:
Highs and lows are detected automatically. Levels that get swept (price breaks through) are converted to dashed lines for easy visual distinction.
Customizable:
Choose line colors for highs/lows and set the maximum number of active levels per timeframe to keep charts clean.
Extended Lines:
All levels are extended to the right, helping you see how current price interacts with past liquidity.
How It Works:
On every new bar of your chosen higher timeframe(s), the indicator records the high and low of the previous (just-closed) candle.
These levels are extended as rays until price sweeps (crosses) them.
When a level is swept, it is redrawn as a dashed line to highlight liquidity grabs or stop hunts.
No lines are drawn for the “live” bar—only confirmed, closed levels are displayed.
Who is this for?
SMC, ICT, and price action traders seeking high-confidence liquidity zones.
Intraday, swing, and multi-timeframe traders who want an automated, visual edge.
Anyone wanting to avoid repainting or “fake” levels from unfinished candles.
Tip:
Combine this indicator with your favorite order block, fair value gap (FVG), or market structure tools for even greater context and confluence.
Disclaimer:
No indicator guarantees profits. Always use with proper risk management and in conjunction with your trading plan.

Contrarian Market Structure BreakMarket Structure Break application was inspired and adapted from Market Structure Oscillator indicator developed by Lux Algo. So much credit to their work.
This indicator pairs nicely with the Contrarian 100 MA and can be located here:
Indicator Description: Contrarian Market Structure BreakOverview
The "Contrarian Market Structure Break" indicator is a versatile tool tailored for traders seeking to identify potential reversal opportunities by analyzing market structure across multiple timeframes. Built on Institutional Concepts of Structure (ICT), this indicator detects Break of Structure (BOS) and Change of Character (CHoCH) patterns across short-term, intermediate-term, and long-term swings, plotting them with customizable lines and labels. It generates contrarian buy and sell signals when price breaks key swing levels, with a unique "Blue Dot Tracker" to monitor consecutive buy signals for trend confirmation. Optimized for the daily timeframe, this indicator is adaptable to other timeframes with proper testing, making it ideal for traders of forex, stocks, or cryptocurrencies.
How It Works
The indicator combines three key components to provide a comprehensive view of market dynamics: Multi-Timeframe Market Structure Analysis: It identifies swing highs and lows across short-term, intermediate-term, and long-term periods, plotting BOS (continuation) and CHoCH (reversal) events with customizable line styles and labels.
Contrarian Signal Generation: Buy and sell signals are triggered when the price crosses below swing lows (buy) or above swing highs (sell), indicating potential reversals in overextended markets.
Blue Dot Tracker: A unique feature that counts consecutive buy signals ("blue dots") and highlights a "Hold Investment" state with a yellow background when three or more buy signals occur, suggesting a potential trend continuation.
Signals are visualized as small circles below (buy) or above (sell) price bars, and a table in the bottom-right corner displays the blue dot count and recommended action (Hold or Flip Investment), enhancing decision-making clarity.
Mathematical Concepts Swing Detection: The indicator identifies swing highs and lows by comparing price patterns over three bars, ensuring robust detection of pivot points. A swing high occurs when the middle bar’s high is higher than the surrounding bars, and a swing low occurs when the middle bar’s low is lower.
Market Structure Logic: BOS is detected when the price breaks a prior swing high (bullish) or low (bearish) in the direction of the current trend, while CHoCH signals a potential reversal when the price breaks a swing level against the trend. These are calculated across three timeframes for a multi-dimensional perspective.
Blue Dot Tracker: This feature counts consecutive buy signals and tracks the entry price. If three or more buy signals occur without a sell signal, the indicator enters a "Hold Investment" state, marked by a yellow background, until the price exceeds the entry price or a sell signal occurs.
Entry and Exit Rules Buy Signal (Blue Dot Below Bar): Triggered when the closing price crosses below a swing low on either the intermediate-term or long-term timeframe, suggesting an oversold condition and potential reversal upward. Short-term signals can be enabled but are disabled by default to reduce noise.
Sell Signal (White Dot Above Bar): Triggered when the closing price crosses above a swing high on either the intermediate-term or long-term timeframe, indicating an overbought condition and potential reversal downward.
Blue Dot Tracker Logic: After a buy signal, the indicator increments a blue dot counter and records the entry price. If three or more consecutive buy signals occur (blueDotCount ≥ 3), the indicator enters a "Hold Investment" state, highlighted with a yellow background, suggesting a potential trend continuation. The "Hold Investment" state ends when the price exceeds the entry price or a sell signal occurs, resetting the counter.
Exit Rules: Traders can exit buy positions when a sell signal appears, the price exceeds the entry price during a "Hold Investment" state, or based on additional confirmation from BOS/CHoCH patterns or other technical analysis tools. Always use proper risk management.
Recommended Usage
The indicator is optimized for the daily timeframe, where it effectively captures significant reversal and continuation patterns in trending or ranging markets. It can be adapted to other timeframes (e.g., 1H, 4H, 15M) with careful testing of settings, particularly enabling/disabling short-term structure analysis to suit market conditions. Backtesting is recommended to optimize performance for your chosen asset and timeframe.
Customization Options Market Structure Display: Toggle short-term, intermediate-term, and long-term structures on or off, with customizable line styles (solid, dashed, dotted) and colors for bullish and bearish breaks.
Labels: Enable or disable BOS/CHoCH labels for each timeframe to reduce chart clutter.
Signal Visibility: Hide buy/sell signals if desired for a cleaner chart.
Blue Dot Tracker: Monitor the blue dot count and action (Hold or Flip Investment) via the table display, which is fully customizable in terms of position and appearance.
Why Use This Indicator?
The "Contrarian Market Structure Break" indicator offers a robust framework for identifying high-probability reversal and continuation setups using ICT principles. Its multi-timeframe analysis, clear signal visualization, and innovative Blue Dot Tracker provide traders with actionable insights into market dynamics. Whether you're a swing trader or a day trader, this indicator’s flexibility and intuitive design make it a valuable addition to your trading arsenal.
Note for TradingView Moderators
This script complies with TradingView's House Rules by providing an educational and transparent description without performance claims or guarantees. It is designed to assist traders in technical analysis and should be used alongside proper risk management and personal research. The code is original, well-documented, and includes customizable inputs and clear visual outputs to enhance the user experience.
Tips for Users:
Backtest thoroughly on your chosen asset and timeframe to validate signal reliability. Combine with other indicators or price action analysis for confirmation of entries and exits. Adjust timeframe settings and enable/disable short-term structures to match market volatility and your trading style.
Hope the "Contrarian Market Structure Break" indicator enhances your trading strategy and helps you navigate the markets with confidence! Happy trading!

Multi-Timeframe PivotDescription:
This script provides an advanced tool for multi-timeframe pivot point
analysis. It identifies swing points based on a candle's relationship to
its neighbors. The default strength settings of 1 align with the Inner
Circle Trader (ICT) concept of market structure.
The ICT concept defines a swing point based on a simple 3-candle pattern:
- A swing high is a candle where the candles to the immediate left and right
both have lower highs.
- A swing low is a candle where the candles to the immediate left and right
both have higher lows.
A key feature is its ability to accurately calculate and translate pivot
points from up to five higher timeframes (HTFs) and display them
precisely on a lower timeframe (LTF) chart.
NOTE: This indicator is designed to show HTF data on an LTF chart.
If you select a timeframe in the settings that is lower than your
current chart's timeframe, it will show pivots for the chart's
timeframe instead.
Core Features:
- Up to five independent higher timeframes.
- Per-timeframe customization for pivot strength (left/right bars) and color.
- Optional "Watchlines" that project the price of each pivot forward,
complete with a text label identifying the timeframe.
- An optional "Alignment Model" that colors the background when price is
aligned across all active timeframes (requires at least 2 TFs to be enabled).
Default State:
For a clean initial application, the Watchlines and Alignment Model features
are disabled by default but can be enabled in the settings.

Order Blocks v2Order Blocks v2 – Smart OB Detection with Time & FVG Filters
Order Blocks v2 is an advanced tool designed to identify potential institutional footprints in the market by dynamically plotting bullish and bearish order blocks.
This indicator refines classic OB logic by combining:
Fractal-based break conditions
Time-level filtering (Power of 3)
Optional Fair Value Gap (FVG) confirmation
Real-time plotting and auto-invalidation
Perfect for traders using ICT, Smart Money, or algorithmic timing models like Hopplipka.
🧠 What the indicator does
Detects order blocks after break of bullish/bearish fractals
Supports 3-bar or 5-bar fractal structures
Allows OB detection based on close breaks or high/low breaks
Optionally confirms OBs only if followed by a Fair Value Gap within N candles
Filters OBs based on specific time levels (3, 7, 11, 14) — core anchors in many algorithmic models
Automatically deletes invalidated OBs once price closes through the zone
⚙️ How it works
The indicator:
Tracks local fractal highs/lows
Once a fractal is broken by price, it backtracks to identify the best OB candle (highest bullish or lowest bearish)
Validates the level by checking:
OB type logic (close or HL break)
Time stamp match with algorithmic time anchors (e.g. 3, 7, 11, 14 – known from the Power of 3 concept)
Optional FVG confirmation after OB
Plots OB zones as lines (body or wick-based) and removes them if invalidated by a candle close
This ensures traders see only valid, active levels — removing noise from broken or out-of-context zones.
🔧 Customization
Choose 3-bar or 5-bar fractals
OB detection type: close break or HL break
Enable/disable OBs only on times 3, 7, 11, 14 (Hopplipka style)
Optional: require nearby FVG for validation
Line style: solid, dashed, or dotted
Adjust OB length, width, color, and use body or wick for OB height
🚀 How to use it
Add the script to your chart
Choose your preferred OB detection mode and filters
Use plotted OB zones to:
Anticipate price rejections and reversals
Validate Smart Money or ICT-based entry zones
Align setups with algorithmic time sequences (3, 7, 11, 14)
Filter out invalid OBs automatically, keeping your chart clean
The tool is useful on any timeframe but performs best when combined with a liquidity-based or time-anchored trading model.
💡 What makes it original
Combines fractal logic with OB confirmation and time anchors
Implements time-based filtering inspired by Hopplipka’s interpretation of the "Power of 3"
Allows OB validation via optional FVG follow-up — rarely available in public indicators
Auto-cleans invalidated OBs to reduce clutter
Designed to reflect market structure logic used by institutions and algorithms
💬 Why it’s worth using
Order Blocks v2 simplifies one of the most nuanced parts of SMC: identifying clean and high-probability OBs.
It removes subjectivity, adds clear timing logic, and integrates optional confluence tools — like FVG.
For traders serious about algorithmic-level structure and clean setups, this tool delivers both logic and clarity.
⚠️ Important
This indicator:
Is not a signal generator or financial advice tool
Is intended for experienced traders using OB/SMC/time-based logic
Does not predict market direction — it provides visual structural levels only

HyperFlowIntroduction
HyperFlow is a premium market structure and liquidity rotation model built around the principles of internal inefficiencies, tested imbalances, and delivery shifts. Drawing inspiration from ICT concepts, it provides a high-level framework for identifying smart money footprints and timing entries with precision.
Rather than forecasting direction, HyperFlow focuses on recognizing repeatable delivery behaviors — helping traders visually track liquidity shifts from internal ranges to external objectives with consistency.
Core Philosophy
Markets are governed by the logic of liquidity engineering — the search and destruction of internal inefficiencies (Fair Value Gaps), followed by continuations toward external liquidity.
Timeframes to use:
HTF -> LTF
5m -> 15s
15m -> 1m
1h -> 5m
4h -> 15m
Daily -> 1h
Weekly -> 4h
Monthly -> 1D
HyperFlow identifies these transitions by:
Detecting High Timeframe Fair Value Gaps (HTF FVGs) — structural imbalances created by displacement
Tracking Valid Tests of those FVGs — signaling willingness to respect internal structure
Filtering for Delivery Confirmations — only acting when price delivers with intent through reclaimed imbalances
Mapping Risk and Objective Zones — using recent swing structures to define stop and target logic rooted in market logic
All components are reactive, visual, and non-repainting — designed to highlight structure after it forms, not anticipate it prematurely.
Key Features
Internal Range Liquidity Zones: Cleanly marked HTF imbalances show where price may seek efficiency
Tested FVG Filtering: Signals only form on valid rebalances — we wait for proof, not potential
Shift in Delivery Conditions: Price must show intent to reclaim imbalance before any rotation is considered
Automatic Objective Mapping: Recent structural highs/lows are used to project stop and target zones automatically
Session Filters + Time Alignment: Restrict signals to high-probability hours or defined killzones
Minimal, High-Impact Visuals: Tested/untested FVGs are differentiated by transparency and tone, keeping your chart clean and focused
HyperFlow is built for:
Traders who understand price delivery theory
Analysts studying displacement → reversion → continuation
Those seeking higher timeframe bias alignment through tested structure
Users of ICT-based concepts who want a visual, rules-based companion
This is not a beginner's tool. It’s for those seeking repeatable execution through structure and refinement, not guesswork.
Terms and Conditions
Our charting tools are products provided for informational and educational purposes only and do not constitute financial, investment, or trading advice. Our charting tools are not designed to predict market movements or provide specific recommendations. Users should be aware that past performance is not indicative of future results and should not be relied upon for making financial decisions. By using our charting tools, the purchaser agrees that the seller and the creator are not responsible for any decisions made based on the information provided by these charting tools. The purchaser assumes full responsibility and liability for any actions taken and the consequences thereof, including any loss of money or investments that may occur as a result of using these products. Hence, by purchasing these charting tools, the customer accepts and acknowledges that the seller and the creator are not liable nor responsible for any unwanted outcome that arises from the development, the sale, or the use of these products. Finally, the purchaser indemnifies the seller from any and all liability. If the purchaser was invited through the Friends and Family Program, they acknowledge that the provided discount code only applies to the first initial purchase of any SMCapital product. The purchaser is therefore responsible for cancelling – or requesting to cancel – their subscription in the event that they do not wish to continue using the product at full retail price. If the purchaser no longer wishes to use the products, they must unsubscribe from the membership service, if applicable. We hold no reimbursement, refund, or chargeback policy. Once these Terms and Conditions are accepted by the Customer, before purchase, no reimbursements, refunds or chargebacks will be provided under any circumstances.
By continuing to use these charting tools, the user acknowledges and agrees to the Terms and Conditions outlined in this legal disclaimer.

ACE FVG & IFVG Trading System1. What the Script Does
The "ACE FVG & IFVG Trading System " is a TradingView Pine Script (version 5) that identifies and trades Fair Value Gaps (FVGs) and Inverse Fair Value Gaps (IFVGs). It offers:
Detection of bullish/bearish FVGs and IFVGs with customizable parameters.
Multiple entry types: regular FVG retracement, Break of Structure (BOS), breakaway gaps, and Immediate/Retrace IFVG entries.
A pending setup system showing potential trades before they trigger.
Risk management with configurable stop loss (SL) and take profit (TP) based on FVG levels, swing points, or risk-reward ratios.
Market structure analysis using swing highs/lows, BOS, and Market Structure Shifts (MSS).
Time filters to restrict trading to specific sessions.
Visualizations including FVG boxes, trade boxes, pivot lines, and labels.
Entry and performance tables displaying trade details and metrics like win rates and P&L by entry type.
2. How It Works
The script is organized into modular sections for efficient execution:
Inputs: Extensive customization options (e.g., FVG size, entry types, SL/TP modes, time filters) grouped for clarity.
Data Structures: Custom types (FVGData, SwingPoint, EntryData) store FVG, pivot, and trade data in arrays.
Utility Functions: Handle calculations like risk-reward ratios, time validation, and trade size filtering.
Swing Point Detection: Uses ta.pivothigh/ta.pivotlow to identify pivots, supporting BOS/MSS and SL/TP calculations.
FVG Detection: Identifies regular FVGs (low > high or high < low ) and IFVGs (mitigated FVGs with immediate or retrace signals).
Entry Logic: Triggers trades based on user-enabled conditions (e.g., retracement, BOS, breakaway gaps) with dynamic SL/TP.
Trade Management: Tracks active/pending trades, updates visualizations (boxes, lines, labels), and handles cancellations/invalidations.
Main Logic: Executes on each bar to detect FVGs, process entries, update trades, and manage visualizations.
Tables: Displays recent trades and performance stats (e.g., win rates by entry type) on the last bar.
Pivot Visualization: Plots swing points with dynamic extensions and mitigation status (solid/dotted lines).
3. How to Use It
Add to TradingView:
Open Pine Editor, paste the script, save it, and add to chart.
Configure Inputs:
Access settings via chart (right-click indicator > Settings).
Adjust:
fvgMinSize for market volatility (e.g., 5 for forex).
Entry types (e.g., enable IFVG, disable breakaway gaps).
SL/TP modes and minimum R:R (e.g., 2.0 for 1:2).
Time filters for active sessions (e.g., 09:30-16:00).
Visual settings (box transparency, table positions).
Interpret Output:
FVG Boxes: Green (bullish), red (bearish), purple (IFVG/mitigated).
Trade Boxes: Gray-green/red-gray (pending), green/red (active), updated for win/loss.
Pivot Lines: Solid (unmitigated), dotted (mitigated).
Tables: Entry table shows trade details; performance table shows win rates/P&L.
Trading:
Monitor pending setups for entry signals.
Enter manually at active trade levels, following SL/TP.
Use performance stats to refine settings.
Test on demo charts and adjust for market/timeframe.
Best Practices:
Use higher timeframes (e.g., 1H, 4H) for less noise.
Combine with other analysis (e.g., support/resistance).
Backtest using TradingView’s replay feature.
Originality
The script is original due to its unique combination of features:
Enhanced IFVG Strategy: Dual Immediate/Retrace IFVG modes with a novel “Immediate Then Retrace” preference.
Pending Setup System: Proactive visualization of potential trades with auto-cancellation.
Granular Performance Tracking: Detailed breakdown of win rates/P&L by entry type (regular FVG, IFVG, breakaway).
Dynamic Pivot Visualization: Real-time mitigation updates (solid to dotted lines).
Modular Design: Custom types and organized logic for extensibility. It builds on general FVG concepts (e.g., from ICT) but implements unique logic and features not found in standard
TradingView FVG scripts, distinguishing it from both open-source and premium indicators.
Credit of Concepts to ICT
Collaborations with JMAC and Timeless

Session Candles NY #ffsjr"The candle bodies tell the story, wicks do the damage" by ICT
Based on ICT words, I created the sessions indicator, to facilitate the visualization of each session in candle format, with the most important points being the confluence of session openings and closings.
Usually I use to create support and resistances lines using candle sessions bodies and to draw sessions liquidities.
Use on 15 minutes chart and hide default TradingView candles.
Enjoy
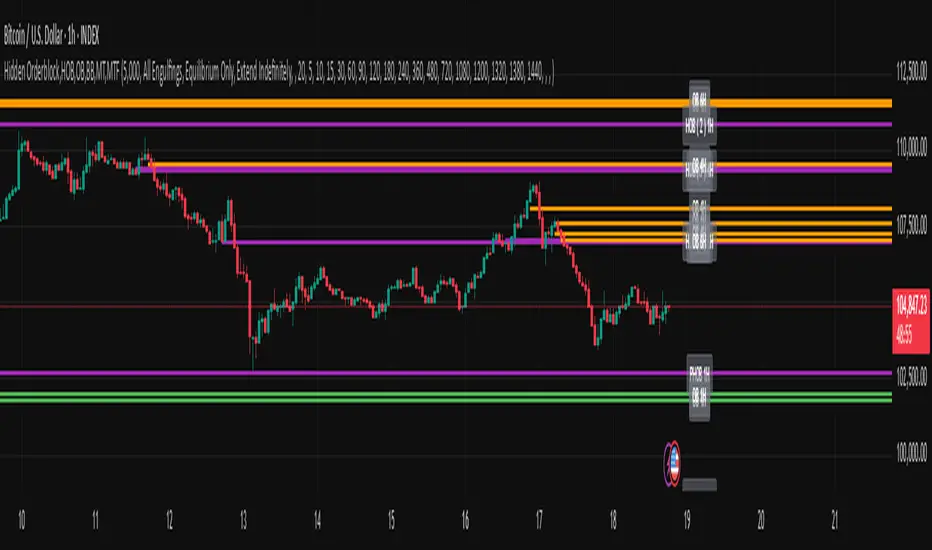
Hidden Orderblock,HOB,OB,BB,MT,MTF Hidden Order Block & Breaker Block (HOB/BB) Multi-Timeframe Analysis
A powerful tool for Smart Money traders and ICT-style practitioners seeking precision, confluence, and clean visual execution. This indicator identifies institutional price zones such as Hidden Order Blocks (HOB), Breaker Blocks (BB), Partial Hidden Order Blocks (PHOB), and traditional Order Blocks (OB)—all across multiple timeframes with minimal chart clutter.
✅ Key Features
1. Hidden Order Block (HOB) Detection
Identifies non-obvious order blocks often hidden within price action.
Requires the EQ (Equilibrium) of the block to pass through at least one Fair Value Gap (FVG).
Invalidation Rule: If price touches the EQ and then closes beyond it (depending on structure), the HOB is invalidated.
2. Breaker Block (BB) Detection
Highlights zones where price made a liquidity grab followed by a strong reversal.
Useful for anticipating support/resistance flips and high-probability reaction areas.
3. Partial Hidden Order Block (PHOB) Detection
A variation of HOBs where price only partially touches the EQ.
Often acts as an early warning zone for reversals or continuation.
Less strict than HOBs, but still institutionally relevant.
4. Traditional Order Block (OB) Detection
Identifies bullish/bearish OBs based on engulfing patterns and displacement.
Marks only the body of the engulfing candle, with the EQ line acting as a key validation/invalidation level.
Once the EQ is touched, the OB is considered invalidated.
5. Engulfing Filter Engine
Customizable logic for OB qualification.
“Easy Engulfing Mode” simplifies detection for newer traders or faster workflow.
Fine-tune aggressiveness and visual clarity with user-defined settings.
6. Multi-Timeframe (MTF) Visualization
Overlay OBs, HOBs, BBs, and PHOBs from higher timeframes (e.g., 4H, 1D) on lower timeframes (15m, 1H).
Enhances top-down confluence without switching charts.
Keeps the visual experience clean and intuitive.
7. Minimalist Visual Design
Only the zone boundaries and EQ lines are displayed.
No extra noise—perfect for both scalpers and swing traders.
Dynamic label positioning and styling for improved chart aesthetics.
8. Performance-Optimized Code
Lightweight, real-time rendering.
Designed for responsiveness—even on lower timeframes with dense historical data.
⚙️ How It Works (Simplified Logic)
Order Block Detection:
Scans for engulfing candles that show displacement.
Defines the OB as the body of the engulfing candle.
EQ line is marked and projected forward until invalidated.
Hidden Order Block Logic:
Starts from a traditional OB, but requires the EQ to pass through at least one FVG.
Upon a close beyond the EQ in the opposite direction, the HOB is invalidated.
PHOB Logic:
Similar to HOBs, but allows partial touches of the EQ before reacting.
Breaker Block Logic:
Identifies liquidity sweeps followed by impulsive moves.
Marks these zones as BBs for potential reaction areas.
📈 Use Cases
Detect institutional price zones with high precision.
Simplify decision-making with visual EQs and MTF overlays.
Integrate seamlessly into:
Smart Money Concepts (SMC)
ICT-style trading
Wyckoff methodology
Discretionary zone-to-zone strategies
🧠 Definitions Summary
OB (Order Block):
Engulfed candle body; EQ is the midpoint of the body. Invalid once EQ is touched.
HOB (Hidden Order Block):
Like OB, but EQ must pass through at least one FVG.
Invalidated when a candle touches EQ and closes beyond it.
PHOB (Partial Hidden Order Block):
Like HOB, but allows partial touch of the EQ to remain valid.
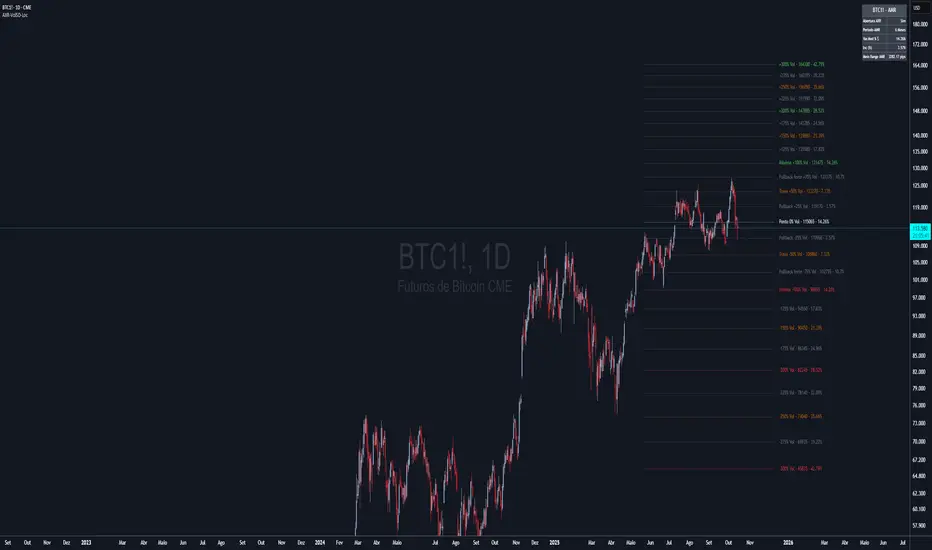
AXR-VolSD-Loc📈 AXR-VolSD-Loc — Volatility & Range Mapping Tool for Smart Traders
The AXR-VolSD-Loc indicator is a professional-grade tool designed for traders who rely on precise volatility analysis and structured range-based levels. It combines dynamic volatility bands with configurable price ranges such as ADR, AWR, AMR, and AQR — offering strategic clarity across all timeframes.
🔍 Key Features
Multi-Timeframe Range Calculation
Supports Daily (ADR), Weekly (AWR), Monthly (AMR), and Quarterly (AQR) ranges — each with independent period controls.
Standard Deviation Volatility Bands
Automatically or manually calculate standard deviation (%) to plot multiple upper/lower levels from a base price reference.
Fully Customizable Lines & Labels
Choose the number of bands, enable half-volatility levels, apply color gradients, customize line styles, widths, label positions, font sizes and offsets.
Flexible Anchor Logic
Set the base line for volatility from Hi/Lo/50%/0% of AXR, or input your own manual price — ideal for ICT model alignment.
Smart Visuals & Optimized Drawing
Clean line and label management using line.new() and label.new() with efficient updates only when required.
Data Table & Summary Panel
Floating table displays key metrics like high/low range, midpoint, volatility settings, and source references.
Built-In Alerts
Receive alerts when price approaches key volatility levels or AXR range extremes — ideal for anticipating institutional behavior.
🛠️ How to Use & Configure
1. Choose the Range Mode
In "AXR Mode & Period Settings", select your preferred range type:
Daily (ADR) – Short-term or intraday.
Weekly (AWR) – Medium swing positions.
Monthly (AMR) – Optimal for higher-timeframe structure.
Quarterly (AQR) – Best for macro-level zones.
Then define the number of days/weeks/months/quarters used to calculate each.
2. Define the Volatility Base Line
Under "Volatility Base Line Settings", configure the anchor:
Use 0% AXR for midpoint, or Hi/Lo/50% for edges.
Manual mode allows custom price input.
Adjust the line color, style, and thickness.
3. Configure Standard Deviation
In "Standard Deviation - Calculation & Levels", select the source:
Automatic AXR — calculates % based on AXR range.
Manual — allows custom % input.
Define how many levels above/below the base line.
Use the scale factor to adjust relative strength (e.g., 0.5 = 50% of AXR).
4. Adjust Visual Display
In "Display & Labels":
Enable or disable volatility lines.
Use color progression for intensity from blue to red.
Show or hide intermediate lines (half deviation).
Choose label alignment: right, center, or left.
Fine-tune label position with candle offset and text size.
5. Extend Lines and Define Visibility
You can choose to extend the lines left, right or both directions — or use a fixed number of bars when not extended.
This applies to both volatility lines and AXR levels.
6. Show AXR Hi/Lo/50%/0% Lines
In "AXR Levels":
Enable display of Hi, Lo, midpoint, and 50% levels.
Toggle display of AXR open levels (MO-based).
Customize style, color and width of each line.
7. Enable the Table (Optional)
Turn on the floating data table to see a quick summary:
Range high/low/midpoint.
Volatility multiplier.
Source (manual vs automatic).
Period length.
Useful for fast review during market sessions.
8. Alerts
Receive automated alerts when price approaches:
AXR Hi/Lo
0% midpoint level
Custom-defined deviation bands
✅ Use Cases
Define and monitor volatility zones around structured ranges.
Combine AMR or AQR with deviation bands for swing setups.
React to price imbalances at 50% or 0% AXR zones.
Integrate with order blocks, liquidity zones or ICT-based confluences.
Questions or suggestions? Contact us via TradingView message or in the comments.
Happy trading!
Time LevelsTime Levels is a customizable TradingView indicator designed to mark critical intraday price levels based on specific time inputs. This tool helps traders identify significant Open/High/Low/Close (OHLC) levels, support & resistance (S&R) zones, and potential Judas Swing manipulation points—aligned with selected timeframes and adjusted to any time zone via UTC offset.
🔧 Key Features:
OHLC/OLHC Levels: Automatically draws horizontal lines at the candle’s open price for up to four specified time points. Ideal for marking session opens, closes, or key intraday levels.
Support & Resistance Zones: Highlights two time-based S&R levels that can help identify discount and premium pricing zones.
Judas Swing Detection: Marks potential liquidity grab zones (Judas Swings) at three user-defined times, assisting in identifying manipulation and smart money entry points.
Global Timezone Support: Includes a UTC offset input to align levels accurately with your trading session, regardless of your location.
Full Customization: Personalize the color, style (solid, dashed, dotted), and thickness of each line independently for OHLC, S&R, and Judas levels.
🛠️ Use Cases:
New York / London open price tracking
ICT-based SMC level marking
Predefined time-based liquidity level visualizations
Institutional-level price reactions (e.g., during specific market opens)
This indicator is best suited for intraday and short-term (especially ICT) traders looking to bring precision and consistency into their technical analysis framework.

Time Based Range# Time Based Range
**A fully customizable session-based range indicator for intraday and daily trading analysis**
## Overview
The Time Based Range indicator identifies and visualizes key price levels from any user-defined time session. Whether you're trading the London open, New York session, or any custom timeframe, this indicator helps you identify crucial support and resistance levels formed during specific trading periods.
## Key Features
### 🕒 **Flexible Session Configuration**
- Customize any time range (e.g., 05:00-13:00, 20:00-02:00)
- Select specific days of the week (Sunday=1 through Saturday=7)
- Works on any timeframe from 1-minute to daily charts
### 📊 **Three Display Modes**
**OHLC Mode:**
- Shows Open, High, Low, Close, and Midpoint lines
- Fully customizable line colors, styles, and widths
- Optional labels with custom text
- Toggle individual lines on/off
**Range Mode:**
- Displays High, Low, and Midpoint lines extending into the future
- Session background box for visual clarity
- Configurable extension length in hours
- Clean range-based analysis
**Mitigate Mode:**
- Horizontal pivot lines that extend until price "mitigates" (touches) them
- Session background box
- Lines automatically stop extending when price reaches the level
- Perfect for ICT-style analysis
### 🚨 **Advanced Alert System**
**Breakout Alerts:**
- Notifies when price breaks above session high or below session low
- Real-time notifications for range expansion
**Liquidity Sweep Alerts:**
- Detects when price briefly breaks a level but closes back inside the range
- Configurable lookback period for sweep detection
- Helps identify false breakouts and liquidity grabs
**Equilibrium Rejection Alerts:**
- Monitors price reaction at the session midpoint
- Detects strong rejections with wick formations
- Configurable sensitivity threshold
### 🎨 **Full Customization**
- Individual color settings for all lines and boxes
- Multiple line style options (Solid, Dashed, Dotted)
- Adjustable line widths and transparency
- Custom label text and positioning
- Session limit control (1-10 sessions displayed)
## Use Cases
### Day Trading
- Mark key levels from overnight sessions
- Identify London/New York opening ranges
- Track Asian session highs and lows
### Swing Trading
- Daily range analysis
- Multi-day level identification
- Key support/resistance from specific periods
### ICT/SMC Trading
- Liquidity pool identification
- Fair value gap analysis
- Market structure understanding
## Technical Specifications
- **Maximum Sessions:** 1-10 (user configurable)
- **Time Format:** 24-hour (HHMM-HHMM)
- **Day Selection:** Individual day toggles (1=Sunday through 7=Saturday)
- **Alert Types:** 4 different alert conditions
- **Drawing Objects:** Optimized with automatic cleanup
- **Performance:** Efficient array management prevents chart lag
## Best Practices
1. **Start Simple:** Begin with OHLC mode to understand session dynamics
2. **Use Alerts:** Enable notifications for key level interactions
3. **Combine Modes:** Switch between modes based on market conditions
4. **Optimize Settings:** Adjust colors and styles for your chart theme
5. **Multiple Timeframes:** Use different sessions for various trading strategies
## Compatibility
- Works on all TradingView chart types
- Compatible with all asset classes (Forex, Stocks, Crypto, Futures)
- Optimized for both light and dark themes
- Mobile-friendly display
---
*This indicator helps traders identify high-probability trading zones based on time-specific price action. Always combine with proper risk management and additional analysis methods.*