Watermark[Font] This watermark is designed for recording your chart.
It automatically converts to a cursive (italic) style and appears on the chart,
adding a more aesthetic touch to your visuals.
Enjoy your time!
You can freely turn the brand label on or off from the settings.
1.script
2.italic
Cerca negli script per "ict"

ERL [#]ICT Concepts by shulktrades
Beginner Concept
External Range Liquidity — ERL
Description:
The ERL indicator identifies External Range Liquidity zones by plotting the highs and lows of a user-selected timeframe. These zones represent areas where liquidity is likely to accumulate and are updated in real time based on higher-timeframe candle tracking, giving traders a precise and adaptable view of liquidity across multiple timeframes.
This indicator does not produce trade signals or alerts. It is intended as a visual and analytical tool to provide confluence and context within a trader’s existing strategy.
How It Works (Conceptually)
Timeframe Selection
Users can select a single timeframe (e.g., H1, H4, D1) to define which candle highs and lows will be used to draw ERL zones. This allows traders to focus on their preferred timeframe for liquidity analysis.
Highs and Lows Mapping
The script identifies the highest high and lowest low of each candle on the selected timeframe and plots these levels as ERL zones on the chart. These zones act as reference points for potential liquidity concentration.
Higher-Timeframe Candle Tracking
ERL zones are updated with each new higher-timeframe candle, rather than relying solely on the chart’s native timeframe. This ensures that the liquidity levels are aligned with HTF market structure, not just local price swings.
Dynamic Zone Updates
As each HTF candle closes, ERL zones are refreshed to reflect the most recent data.
This dynamic updating allows traders to always see the most relevant and actionable liquidity ranges without manual adjustment.
Unique Implementation Features
The ERL indicator differs from other liquidity or range indicators in several important ways:
User-Selectable Timeframe
Unlike static range indicators, ERL allows the user to define the exact timeframe from which liquidity highs and lows are drawn.
HTF Tracking
The indicator updates in alignment with higher-timeframe candles, ensuring that liquidity zones are consistent with broader market structure, not just local price noise.
Dynamic Updates
ERL zones refresh automatically as each HTF candle completes, providing real-time context for traders and avoiding clutter from outdated levels.
Clear Visual Implementation
ERL zones are plotted cleanly on the chart, with distinct coloring and line styling to clearly differentiate them from other indicators or market levels.
How to Use It
Apply the ERL indicator to view high and low zones of your selected timeframe as potential liquidity areas.
Use these zones as contextual confluence when evaluating trades or market structure, not as trade signals.
Combine with other tools, such as order blocks, fair value gaps, and liquidity sweeps, to enhance market analysis.
Adjust the selected timeframe according to your preferred analytical perspective.
Originality and Purpose
The ERL indicator is original because:
It allows user-defined timeframe selection for ERL calculation.
It uses higher-timeframe candle tracking to maintain alignment with broad market structure.
It dynamically updates each HTF candle, ensuring the plotted zones are current and accurate.
Its visual clarity and precision differentiate it from open-source range or liquidity indicators that either plot static levels or do not adapt to HTF candles.
These features justify its closed-source status, as the combination of timeframe flexibility, HTF tracking, and dynamic visualization is not replicated in standard ERL tools.
Important Notes
For visual analysis and educational use only.
Does not generate trade alerts, entries, or recommendations.
Most effective for traders who understand higher-timeframe market structure and liquidity analysis.
Always apply personal risk management and independent confirmation when using this tool.

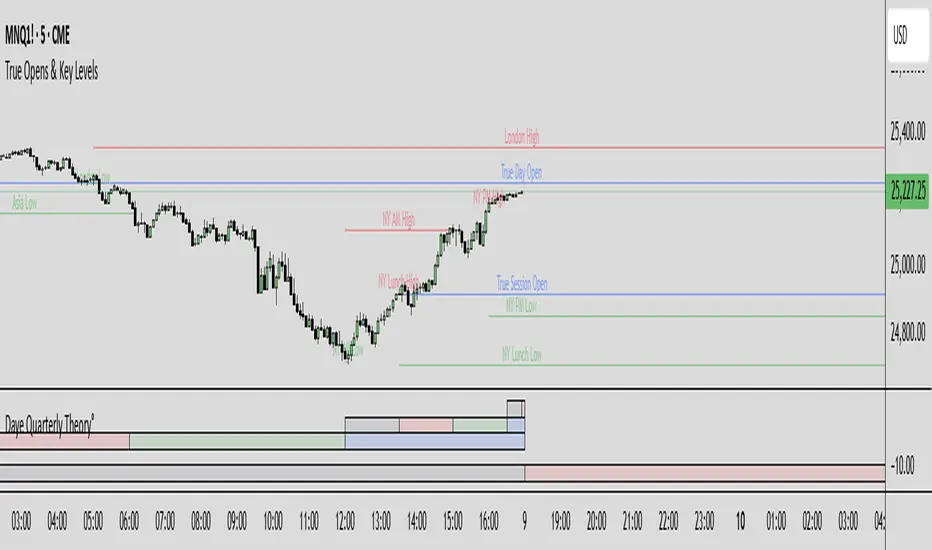
True Opens & Key Levels# True Opens & Key Levels - Standalone Indicator Guide
## Overview
This is a clean, focused indicator that displays only key level rays and true open levels. All impulsive series detection, FVG detection, and Fibonacci projections have been removed for a minimal, uncluttered chart experience.
---
## Features Included
### 📊 Previous Period Levels
- **Previous Day High/Low** - Daily reference points
- **Previous Week High/Low** - Weekly reference points
- **Previous Month High/Low** - Monthly reference points
### 🕐 Session High/Low Levels
- **NY AM Session** (9:30-12:00 ET) - Morning session range
- **NY Lunch Session** (12:00-13:30 ET) - Lunch hour range
- **NY PM Session** (13:30-16:00 ET) - Afternoon session range
- **London Session** (2:00-5:00 ET) - London trading hours
- **Asia Session** (20:00-00:00 ET) - Asian market hours
### 🎯 True Open Levels (NEW)
- **True Day Open** - Updates daily at 00:00 ET
- **True Session Open** - Updates every 6 hours (1:30, 7:30, 13:30, 19:30 ET)
- **True Week Open** - Updates every Monday at 18:00 ET
---
## Settings
### Key Level Rays Group
**Master Toggle:**
- Enable Key Level Rays (master on/off switch)
**Previous Period Levels:**
- Show Previous Day H/L
- Show Previous Week H/L
- Show Previous Month H/L
**Session Levels:**
- Show NY AM H/L (9:30-12:00 ET)
- Show NY Lunch H/L (12:00-13:30 ET)
- Show NY PM H/L (13:30-16:00 ET)
- Show London H/L (2:00-5:00 ET)
- Show Asia H/L (20:00-00:00 ET)
**True Open Levels:**
- Show True Day Open (00:00)
- Show True Session Open (6h intervals)
- Show True Week Open (Mon 18:00)
**Visual Settings:**
- High Level Color (default: red with 50% transparency)
- Low Level Color (default: green with 50% transparency)
- Open Level Color (default: blue with 50% transparency)
- Ray Line Width (1-5 pixels)
- Ray Label Size (tiny/small/normal/large)
---
## How It Works
### Level Behavior
**Session High/Low Levels:**
1. During session: Tracks the highest high and lowest low
2. After session ends: Draws horizontal rays extending right
3. When price hits level: Ray stops extending (hit marker)
4. Label updates position to stay at chart's right edge
**Previous Period Levels:**
1. At period change: Draws rays from previous period's H/L
2. Extends right until price hits the level
3. When hit: Ray stops extending
4. Label positions at midpoint of ray
**True Open Levels:**
1. At trigger time: Draws ray from opening price
2. Extends right until next trigger
3. Previous level is deleted when new one appears
4. Label stays at right edge of chart
---
## Color Scheme
### Three Color Categories:
1. **Red** - All HIGH levels (session highs, previous highs)
2. **Green** - All LOW levels (session lows, previous lows)
3. **Blue** - All OPEN levels (True Day/Session/Week Opens)
This makes it instantly clear what type of level you're looking at.
---
## Best Practices
### For Intraday Trading (1m-1H):
```
Enable:
✓ True Day Open
✓ True Session Open
✓ NY AM/PM H/L
✓ Previous Day H/L
Disable:
✗ Previous Week/Month H/L
✗ London/Asia sessions (unless trading them)
✗ True Week Open
```
### For Swing Trading (1H-4H):
```
Enable:
✓ True Week Open
✓ True Day Open
✓ Previous Week H/L
✓ Previous Day H/L
Disable:
✗ All session H/L
✗ True Session Open
✗ Previous Month H/L
```
### For Clean Charts:
```
Enable:
✓ True Day Open
✓ True Week Open
✓ Previous Day H/L only
Disable:
✗ Everything else
Result: Just 4 levels on chart - super clean!
```
---
## Level Update Schedule
| Level | Update Frequency | Time(s) |
|---------------------|------------------|-----------------------------|
| True Day Open | Daily | 00:00 ET |
| True Session Open | Every 6 hours | 1:30, 7:30, 13:30, 19:30 ET |
| True Week Open | Weekly | Monday 18:00 ET |
| Previous Day H/L | Daily | At day change |
| Previous Week H/L | Weekly | At week change |
| Previous Month H/L | Monthly | At month change |
| NY AM H/L | Daily | After 12:00 ET |
| NY Lunch H/L | Daily | After 13:30 ET |
| NY PM H/L | Daily | After 16:00 ET |
| London H/L | Daily | After 5:00 ET |
| Asia H/L | Daily | After 00:00 ET |
---
## File Size & Performance
- **File Size:** ~22 KB (less than half the size of full indicator)
- **Total Lines:** ~700 lines
- **Max Lines/Labels:** 500 (configurable in declaration)
- **Performance:** Lightweight, minimal CPU usage
- **Memory:** Efficient variable management
---
## Installation
1. Open TradingView
2. Open Pine Editor (Alt+E or bottom toolbar)
3. Click "Create new indicator"
4. Delete default code
5. Copy and paste contents of `TRUE_OPENS_KEY_LEVELS.pine`
6. Click "Save" and name it "True Opens & Key Levels"
7. Click "Add to Chart"
---
## Usage Tips
### 1. Start Minimal
Begin with just 2-3 levels enabled:
- True Day Open
- Previous Day High
- Previous Day Low
Add more as needed.
### 2. Color Customization
Adjust transparency for cleaner look:
- High Level: Red 60-70% transparency
- Low Level: Green 60-70% transparency
- Open Level: Blue 60-70% transparency
### 3. Multi-Timeframe Approach
Lower timeframes (1m-15m): Use True Session Open + NY session H/L
Mid timeframes (15m-1H): Use True Day Open + Previous Day H/L
Higher timeframes (1H-4H): Use True Week Open + Previous Week H/L
### 4. Line Width
For cleaner charts, use Line Width = 1
For emphasis, use Line Width = 2-3
### 5. Label Size
Smaller screens: Use "small" or "tiny"
Larger screens: Use "normal"
Presentations: Use "large"
---
## Advantages of Standalone Version
✅ **Cleaner Charts** - No detection lines or arrows
✅ **Faster Loading** - Less code to process
✅ **Easier Setup** - Fewer settings to configure
✅ **Pure Levels** - Focus only on key price levels
✅ **Less Distraction** - No moving parts during trading
✅ **Perfect for Combining** - Use with other indicators without clutter
---
## Combining with Other Indicators
This lightweight indicator works great alongside:
- RSI / Stochastic (oscillators)
- Moving Averages (trend)
- Volume Profile (structure)
- VWAP (intraday reference)
- Your own custom indicators
The minimal chart footprint leaves room for additional tools.
---
## Time Zones
All times are in **Eastern Time (ET)**. TradingView automatically converts to your local timezone, so you don't need to manually adjust anything.
**Example Conversions:**
- 00:00 ET = 05:00 UTC
- 18:00 ET = 23:00 UTC
- 13:30 ET = 18:30 UTC
---
## Support & Updates
This is a standalone version of the True Opens & Key Levels from the full GOTE Indicator. It contains only the level detection code with all series detection removed.
**Version:** 1.0
**Pine Script Version:** 6
**Last Updated:** November 8, 2025
---
## Quick Reference Card
```
╔══════════════════════════════════════════════════════════╗
║ TRUE OPENS & KEY LEVELS - QUICK REFERENCE ║
╠══════════════════════════════════════════════════════════╣
║ ║
║ 📊 PREVIOUS PERIODS ║
║ • Previous Day/Week/Month High/Low ║
║ • Updates at period change ║
║ ║
║ 🕐 SESSION LEVELS ║
║ • NY AM/Lunch/PM, London, Asia H/L ║
║ • Updates after each session ║
║ ║
║ 🎯 TRUE OPENS ║
║ • True Day: Daily 00:00 ET ║
║ • True Session: 1:30/7:30/13:30/19:30 ET ║
║ • True Week: Monday 18:00 ET ║
║ ║
║ 🎨 COLORS ║
║ • Red = Highs • Green = Lows • Blue = Opens ║
║ ║
╚══════════════════════════════════════════════════════════╝
```
---
**Ready to trade with clean, focused key levels!** 🎯
Midnight ET + Daily H/L True dayThis script divides each day from midnight EST to the next midnight opening price (True day). Full credits go to my mentor ICT for the idea behind the script
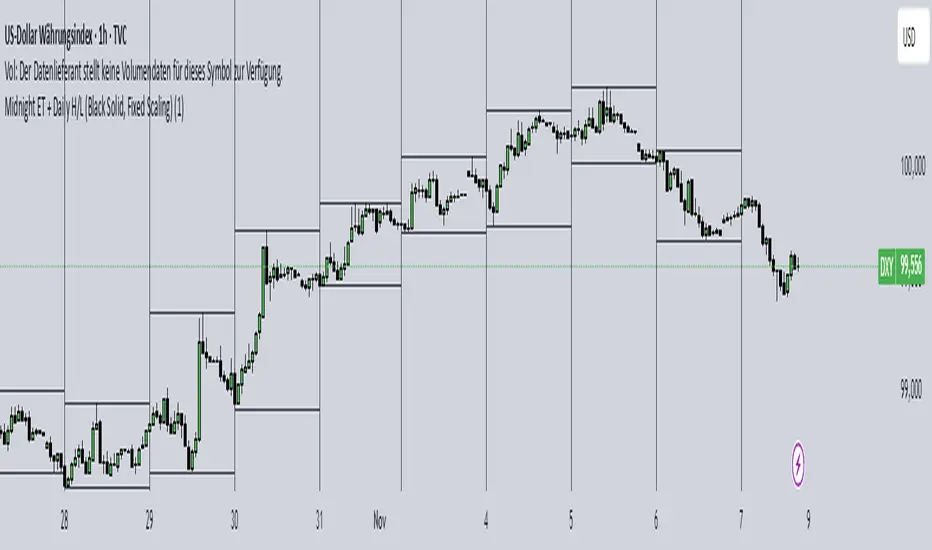
Midnight ET + Daily H/L (vertical midnight + HL lines)This script provides midnight EST dividers for each day and marks each daily high and low during each True day. Credits go to my mentor ICT for the idea behind this script.

[VINCENT] ICT NWOG + NDOG HorizonsThis indicator marks NDOG (New Day Opening Gap) and NWOG (New Week Opening Gap) zones on the chart.
Each gap is displayed as a price range with optional midpoint and quadrant levels.
It also plots Event Horizon levels, calculated between consecutive gaps, highlighting directional draw and liquidity magnet zones.
Use this to observe where price is likely to revisit, rebalance, or draw toward across higher timeframes.

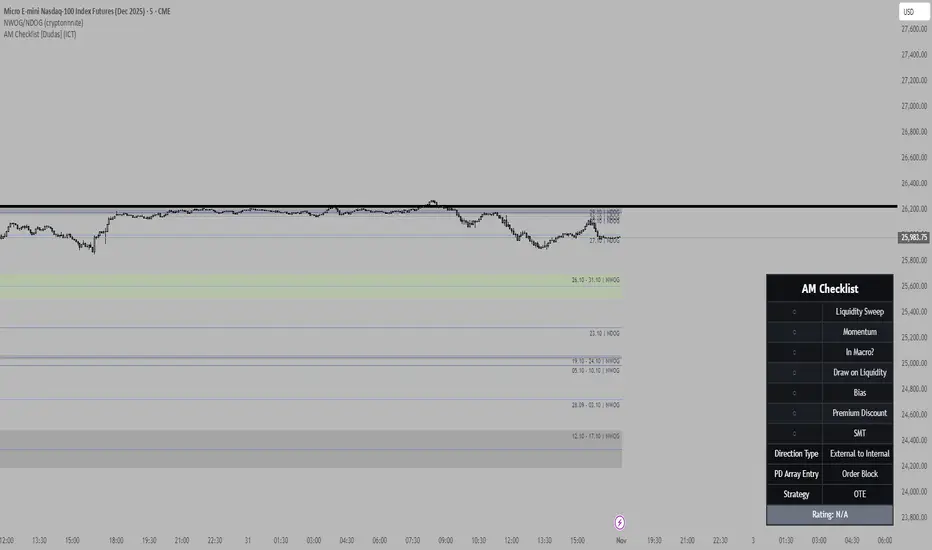
📋 Trading Checklist – Precision Entry SystemTake your trading discipline to the next level with this Precision Trading Checklist for TradingView. Designed for intraday traders following liquidity, structure, and Smart Money Concepts (SMC) AKA ICT Concepts, this overlay ensures you never miss a key confirmation before entering a trade.
Features:
✅ Pre-Market Preparation: Track previous session highs/lows, AM/PM sessions, and key liquidity zones.
✅ Bias & Narrative Check: Quickly confirm daily trend, price position relative to daily open, and higher timeframe confluence.
✅ Session-Specific Rules: Focused sessions like Silver Bullet (10:00–11:30), Afternoon (13:30–15:00), and Final Hour (15:00–16:00).
✅ Structure & Setup Validation: Confirm liquidity sweeps, market structure shifts, expansion candles, fair value gaps, and order blocks.
✅ Risk Management Reminders: Stop-loss, target points, risk percentage, breakeven management, and pyramiding rules.
✅ Post-Trade Journaling: Document entries, session, setup type, trade outcome, and grading for continuous improvement.
✅ Golden Rules: Visual reminders to enforce discipline, avoid emotional trades, and respect session limits.
Why Use It:
This checklist is perfect for traders who want to stay consistent, minimise mistakes, and follow a disciplined routine. Displayed as an overlay on your chart, it provides all essential checks in one glance, keeping you focused on the setup rather than scrolling through notes or separate trackers.
How to use:
Add the indicator to your chart
Click the settings/gear icon
Check off items as you complete them
The checklist on your chart updates in real-time with green checkmarks!
The checkboxes will persist as long as the indicator is on your chart,
making it perfect for tracking your pre-trade and post-trade routines!
Follow the checklist items step by step before entering trades.
Use the session-specific guidelines to filter setups.
Journal your trades post-execution for growth and analysis.

[VINCENT] ICT Range SeparatorSession range separators based on New York market time
Automatic H4 / H1 session opening price with dynamic label placement
Optional Midnight and 09:30 NY open price reference lines
Daily / Weekly / Monthly / Yearly opening levels with auto-update each new period
Vertical HTF boundary separators (optional)
Day-of-week labels on intraday charts

Realtime Squeeze Box [CHE] Realtime Squeeze Box — Detects lowvolatility consolidation periods and draws trimmed price range boxes in realtime to highlight potential breakout setups without clutter from outliers.
Summary
This indicator identifies "squeeze" phases where recent price volatility falls below a dynamic baseline threshold, signaling potential energy buildup for directional moves. By requiring a minimum number of consecutive bars in squeeze, it reduces noise from fleeting dips, making signals more reliable than simple threshold crosses. The core innovation is realtime box visualization: during active squeezes, it builds and updates a box capturing the price range while ignoring extreme values via quantile trimming, providing a cleaner view of consolidation bounds. This differs from static volatility bands by focusing on trimmed ranges and suppressing overlapping boxes, which helps traders spot genuine setups amid choppy markets. Overall, it aids in anticipating breakouts by combining volatility filtering with visual containment of price action.
Motivation: Why this design?
Traders often face whipsaws during brief volatility lulls that mimic true consolidations, leading to premature entries, or miss setups because standard volatility measures lag in adapting to changing market regimes. This design addresses that by using a hold requirement on consecutive lowvolatility bars to denoise signals, ensuring only sustained squeezes trigger visuals. The core idea—comparing rolling standard deviation to a smoothed baseline—creates a responsive yet stable filter for lowenergy periods, while the trimmed box approach isolates the core price cluster, making it easier to gauge breakout potential without distortion from spikes.
What’s different vs. standard approaches?
Reference baseline: Traditional squeeze indicators like the Bollinger Band Squeeze or TTM Squeeze rely on fixed multiples of bands or momentum oscillators crossing zero, which can fire on isolated bars or ignore range compression nuances.
Architecture differences:
Realtime box construction that updates barbybar during squeezes, using arrays to track and trim price values.
Quantilebased outlier rejection to define box bounds, focusing on the bulk of prices rather than full range.
Overlap suppression logic that skips redundant boxes if the new range intersects heavily with the prior one.
Hold counter for consecutive bar validation, adding persistence before signaling.
Practical effect: Charts show fewer, more defined orange boxes encapsulating tight price action, with a horizontal line extension marking the midpoint postsqueeze—visibly reducing clutter in sideways markets and highlighting "coiled" ranges that standard plots might blur with full highs/lows. This matters for quicker visual scanning of multitimeframe setups, as boxes selflimit to recent history and avoid piling up.
How it works (technical)
The indicator starts by computing a rolling average and standard deviation over a userdefined length on the chosen source price series. This deviation measure is then smoothed into a baseline using either a simple or exponential average over a longer window, serving as a reference for normal volatility. A squeeze triggers when the current deviation dips below this baseline scaled by a multiplier less than one, but only after a minimum number of consecutive bars confirm it, which resets the counter on breaks.
Upon squeeze start, it clears a buffer and begins collecting source prices barbybar, limited to the first few bars to keep computation light. For visualization, if enabled, it sorts the buffer and finds a quantile threshold, then identifies the minimum value at or below that threshold to set upper and lower box bounds—effectively clamping the range to exclude tails above the quantile. The box draws from the start bar to the current one, updating its right edge and levels dynamically; if the new bounds overlap significantly with the last completed box, it suppresses drawing to avoid redundancy.
Once the hold limit or squeeze ends, the box freezes: its final bounds become the last reference, a midpoint line extends rightward from the end, and a tiny circle label marks the point. Buffers and states reset on new squeezes, with historical boxes and lines capped to prevent overload. All logic runs on every bar but uses confirmed historical data for calculations, with realtime updates only affecting the active box's position—no future peeking occurs. Initialization seeds with null values, building states progressively from the first bars.
Parameter Guide
Source: Selects the price series (e.g., close, hl2) for deviation and box building; influences sensitivity to wicks or bodies. Default: close. Tradeoffs/Tips: Use hl2 for balanced range view in volatile assets; stick to close for pure directional focus—test on your timeframe to avoid oversmoothing trends.
Length (Mean/SD): Sets window for average and deviation calculation; shorter values make detection quicker but noisier. Default: 20. Tradeoffs/Tips: Increase to 30+ for stability in higher timeframes, reducing false starts; below 10 risks overreacting to singlebar noise.
Baseline Length: Defines smoothing window for the deviation baseline; longer periods create a steadier reference, filtering regime shifts. Default: 50. Tradeoffs/Tips: Pair with Length at 1:2 ratio for calm markets; shorten to 30 if baselines lag during fast volatility drops, but watch for added whips.
Squeeze Multiplier (<1.0): Scales the baseline downward to set the squeeze threshold; lower values tighten criteria for rarer, stronger signals. Default: 0.8. Tradeoffs/Tips: Tighten to 0.6 for highvol assets like crypto to cut noise; loosen to 0.9 in forex for more frequent but shallower setups—balances hit rate vs. depth.
Baseline via EMA (instead of SMA): Switches baseline smoothing to exponential for faster adaptation to recent changes vs. equalweighted simple average. Default: false. Tradeoffs/Tips: Enable in trending markets for quicker baseline drops; disable for uniform history weighting in rangebound conditions to avoid overreacting.
SD: Sample (len1) instead of Population (len): Adjusts deviation formula to divide by length minus one for smallsample bias correction, slightly inflating values. Default: false. Tradeoffs/Tips: Use sample in short windows (<20) for more conservative thresholds; population suits long looks where bias is negligible, keeping signals tighter.
Min. Hold Bars in Squeeze: Requires this many consecutive squeeze bars before confirming; higher denoise but may clip early setups. Default: 1. Tradeoffs/Tips: Bump to 35 for intraday to filter ticks; keep at 1 for swings where quick consolidations matter—trades off timeliness for reliability.
Debug: Plot SD & Threshold: Toggles lines showing raw deviation and threshold for visual backtesting of squeeze logic. Default: false. Tradeoffs/Tips: Enable during tuning to eyeball crossovers; disable live to declutter—great for verifying multiplier impact without alerts.
Tint Bars when Squeeze Active: Overlays semitransparent color on bars during open box phases for quick squeeze spotting. Default: false. Tradeoffs/Tips: Pair with low opacity for subtlety; turn off if using boxes alone, as tint can obscure candlesticks in dense charts.
Tint Opacity (0..100): Controls background tint strength during active squeezes; higher values darken for emphasis. Default: 85. Tradeoffs/Tips: Dial to 60 for light touch; max at 100 risks hiding price action—adjust per chart theme for visibility.
Stored Price (during Squeeze): Price series captured in the buffer for box bounds; defaults to source but allows customization. Default: close. Tradeoffs/Tips: Switch to high/low for wider boxes in gappy markets; keep close for midline focus—impacts trim effectiveness on outliers.
Quantile q (0..1): Fraction of sorted prices below which tails are cut; higher q keeps more data but risks including spikes. Default: 0.718. Tradeoffs/Tips: Lower to 0.5 for aggressive trim in noisy assets; raise to 0.8 for fuller ranges—tune via debug to match your consolidation depth.
Box Fill Color: Sets interior shade of squeeze boxes; semitransparent for layering. Default: orange (80% trans.). Tradeoffs/Tips: Soften with more transparency in multiindicator setups; bold for standalone use—ensures boxes pop without overwhelming.
Box Border Color: Defines outline hue and solidity for box edges. Default: orange (0% trans.). Tradeoffs/Tips: Match fill for cohesion or contrast for edges; thin width keeps it clean—helps delineate bounds in zoomed views.
Keep Last N Boxes: Limits historical boxes/lines/labels to this count, deleting oldest for performance. Default: 10. Tradeoffs/Tips: Increase to 50 for weekly reviews; set to 0 for unlimited (risks lag)—balances history vs. speed on long charts.
Draw Box in Realtime (build/update): Enables live extension of boxes during squeezes vs. waiting for end. Default: true. Tradeoffs/Tips: Disable for confirmedonly views to mimic backtests; enable for proactive trading—adds minor repaint on live bars.
Box: Max First N Bars: Caps buffer collection to initial squeeze bars, freezing after for efficiency. Default: 15. Tradeoffs/Tips: Shorten to 510 for fast intraday; extend to 20 in dailies—prevents bloated arrays but may truncate long squeezes.
Reading & Interpretation
Squeeze phases appear as orange boxes encapsulating the trimmed price cluster during lowvolatility holds—narrow boxes signal tight consolidations, while wider ones indicate looser ranges within the threshold. The box's top and bottom represent the quantilecapped high and low of collected prices, with the interior fill shading the containment zone; ignore extremes outside for "true" bounds. Postsqueeze, a solid horizontal line extends right from the box's midpoint, acting as a reference level for potential breakout tests—drifting prices toward or away from it can hint at building momentum. Tiny orange circles at the line's start mark completion points for easy scanning. Debug lines (if on) show deviation hugging or crossing the threshold, confirming hold logic; a persistent hug below suggests prolonged calm, while spikes above reset counters.
Practical Workflows & Combinations
Trend following: Enter long on squeezeend close above the box top (or midpoint line) confirmed by higher high in structure; filter with rising 50period average to avoid countertrend traps. Use boxes as support/resistance proxies—short below bottom in downtrends.
Exits/Stops: Trail stops to the box midpoint during postsqueeze runs for conservative holds; go aggressive by exiting on retest of opposite box side. If debug shows repeated threshold grazes, tighten stops to curb drawdowns in ranging followups.
Multiasset/MultiTF: Defaults work across stocks, forex, and crypto on 15min+ frames; scale Length proportionally (e.g., x2 on hourly). Layer with highertimeframe boxes for confluence—e.g., daily squeeze + 1H box for entry timing. (Unknown/Optional: Specific multiTF scaling recipes beyond proportional adjustment.)
Behavior, Constraints & Performance
Repaint/confirmation: Core calculations use historical closes, confirming on bar close; active boxes repaint their right edge and levels live during squeezes if enabled, but freeze irrevocably on hold limit or end—mitigates via barbybar buffer adds without future leaks. No lookahead indexes.
security()/HTF: None used, so no external timeframe repaints; all native to chart resolution.
Resources: Caps at 300 boxes/lines/labels total; small arrays (up to 20 elements) and short loops in sorting/minfinding keep it light—suitable for 10k+ bar charts without throttling. Persistent variables track state across bars efficiently.
Known limits: May lag on ultrasharp volatility spikes due to baseline smoothing; gaps or thin markets can skew trims if buffer hits cap early; overlaps suppress visuals but might hide chained squeezes—(Unknown/Optional: Edge cases in nonstandard sessions).
Sensible Defaults & Quick Tuning
Start with defaults for most liquid assets on 1Hdaily: Length 20, Multiplier 0.8, Hold 1, Quantile 0.718—yields balanced detection without excess noise. For too many false starts (choppy charts), increase Hold to 3 and Baseline Length to 70 for stricter confirmation, reducing signals by 3050%. If squeezes feel sluggish or miss quick coils, shorten Length to 14 and enable EMA baseline for snappier adaptation, but monitor for added flips. In highvol environments like options, tighten Multiplier to 0.6 and Quantile to 0.6 to focus on core ranges; reverse for calm pairs by loosening to 0.95. Always backtest tweaks on your asset's history.
What this indicator is—and isn’t
This is a volatilityfiltered visualization tool for spotting and bounding consolidation phases, best as a signal layer atop price action and trend filters—not a standalone predictor of direction or strength. It highlights setups but ignores volume, momentum, or news context, so pair with discreteness rules like higher highs/lows. Never use it alone for entries; always layer risk management, such as 12% stops beyond box extremes, and position sizing based on account drawdown tolerance.
Disclaimer
The content provided, including all code and materials, is strictly for educational and informational purposes only. It is not intended as, and should not be interpreted as, financial advice, a recommendation to buy or sell any financial instrument, or an offer of any financial product or service. All strategies, tools, and examples discussed are provided for illustrative purposes to demonstrate coding techniques and the functionality of Pine Script within a trading context.
Any results from strategies or tools provided are hypothetical, and past performance is not indicative of future results. Trading and investing involve high risk, including the potential loss of principal, and may not be suitable for all individuals. Before making any trading decisions, please consult with a qualified financial professional to understand the risks involved.
By using this script, you acknowledge and agree that any trading decisions are made solely at your discretion and risk.
Do not use this indicator on HeikinAshi, Renko, Kagi, PointandFigure, or Range charts, as these chart types can produce unrealistic results for signal markers and alerts.
Best regards and happy trading
Chervolino

Extended MacrosExtended Macro Times from XX:42 to XX:15.
These are the times to trade and when the Smart Money Reversal is likely to occur.

RTH Previous Day's Range + SMTs [bilal x shpat]Overview
This advanced indicator is designed specifically for futures and equity traders who focus on Regular Trading Hours (RTH) sessions. It automatically plots the previous RTH session's high and low levels and detects Smart Money Theory (SMT) divergences across multiple correlated or inversely correlated instruments.
Key Features
📊 RTH Range Detection
Automatically identifies and tracks Regular Trading Hours (9:30 AM - 4:14 PM New York time)
Plots horizontal lines at the previous RTH session's high and low
Works seamlessly on all timeframes, including ETH (Extended Trading Hours) charts
Lines dynamically extend and update as new bars form
🔄 Smart Money Theory (SMT) Divergence Detection
Compares up to 3 correlated or inversely correlated assets simultaneously
Detects bullish and bearish SMT divergences automatically
Visual divergence lines connect previous session levels to current intraday highs/lows
Customizable SMT labels showing which instruments are diverging
Option to mark assets as "Correlated" or "Inversely Correlated" for accurate divergence detection
SMT detection occurs only during RTH sessions for cleaner signals
🎨 Fully Customizable Styling
3 Label Styles: Choose between "Full" (RTH Previous Day High), "Short" (RTH PDH), or "Lowercase" (rth previous day high)
Adjustable Label Sizes: Tiny, Small, Normal, or Large
Custom Colors: Separate color controls for lines, labels, bullish SMT, and bearish SMT
Line Extension: Control how many bars ahead lines extend
Line Width: Customize line thickness
📈 SMT Visual Indicators
Arrow Symbols: ▲ = Higher / ▼ = Lower (for correlated assets)
Alternate Symbols: 🔺 = Higher / 🔻 = Lower (for inversely correlated assets)
Color-coded divergence lines (white by default, fully customizable)
Optional SMT labels showing ticker symbols with directional indicators
Optional comparison table displaying current divergence status
⚙️ Comparison Settings
Add up to 2 comparison symbols (e.g., ES1!, YM1!, NQ1!)
Toggle each comparison asset on/off independently
Set correlation type (Correlated or Inversely Correlated) for each asset
Popular comparisons: ES vs NQ, YM vs ES, Equity vs Futures
🧹 Clean Chart Management
Option to delete previous RTH SMTs when new session starts
Automatic cleanup of outdated lines and labels
Transparent label backgrounds for minimal chart clutter
Lines track exact bar where high/low occurred
How It Works
Session Detection: The indicator identifies when RTH begins (9:30 AM ET) and tracks all price action during the session until close (4:14 PM ET)
Level Capture: At the start of each new RTH session, it captures the previous session's high and low and plots them as reference levels
SMT Analysis: During the current RTH session, it continuously compares the current session's high/low with the previous session's high/low across all selected instruments
Divergence Identification: When one instrument makes a higher high while another makes a lower high (or vice versa), an SMT divergence is detected and visualized
Use Cases
Liquidity Analysis: Identify when markets are taking liquidity at different rates
Reversal Signals: SMT divergences often precede significant reversals
Correlation Trading: Monitor when traditionally correlated markets begin to diverge
Key Level Trading: Use previous RTH high/low as support/resistance levels
Multi-Market Analysis: Compare ES, NQ, and YM simultaneously for institutional flow
Best Practices
Most effective on intraday timeframes (1m - 15m charts)
Works on both RTH and ETH chart sessions - meant to be used on a RTH chart
Compare highly correlated instruments (e.g., ES1! vs NQ1!)
Use in combination with volume analysis and market structure
SMT divergences are most powerful near key levels
Settings Overview
Comparison Symbols
Asset 2 & 3: Select tickers to compare (e.g., ES1!, YM1!)
Correlation toggles for each asset
Enable/disable each comparison independently
Styling
Line color, width, and extension length
Label color, size, and style (3 options)
Separate colors for bullish and bearish SMT lines
SMT Controls
Toggle SMT detection on/off
Show/hide SMT text labels
Optional SMT comparison table
Delete previous session SMTs option
Note: This indicator is best used by traders familiar with Smart Money Concepts (SMC) and inter-market analysis. Understanding market correlations is essential for accurate interpretation of SMT divergences.
thank you shpat for the SMT option in the last indicator, i tweaked it for this one

IRONBULL FX Venom [TradeFinder] SMC NY Session 2025Setup📌 IRONBULL FX VENOM TRADER
Overview:
The IRONBULL FX VENOM TRADER is a premium Smart Money Concepts (SMC)-based indicator built for institutional-style trading in the New York session. Powered by advanced order block refinement, fair value gap (FVG) detection, and session-based logic, this tool helps traders identify high-probability trading zones and mitigate market noise.
🔧 Key Features:
Order Block Refinement Engine
Integrates with advanced refining logic to filter institutional demand/supply zones, with both Defensive and Aggressive refinement modes.
Fair Value Gap (FVG) Filtering
Detects and highlights FVGs with dynamic filtering options, from Very Aggressive to Very Defensive levels.
Mitigation Levels Control
Allows users to select Proximal, 50%, or Distal levels for precise reaction zones within both OBs and FVGs.
CISD Detection
Captures key short-term displacement shifts, showing potential reversal or continuation signals with optional visual cues.
NY Session Logic
Includes built-in logic to align trades with the New York Opening Range (08:00–09:30 EST) and NY Trading Hours (09:30–17:00 EST). Key session highs/lows are tracked and labeled automatically.
Visual Clarity
Fully customizable color schemes for demand/supply OBs, FVGs, and CISD levels, with lightweight rendering for real-time performance.
🧠 Ideal For:
SMC/ICT-based traders
New York session scalpers and intraday traders
Traders seeking clean institutional zone mapping
Anyone needing visual confirmation of OB + FVG confluence
⚙️ How to Use:
Enable the indicator on a chart (preferably with NY session timezone).
Adjust refinement, FVG filters, and display settings based on your strategy.
Use the OB and FVG zones as key confluence areas for entries/exits.
Watch for CISD labels and session breakouts for high-confidence setups.
Disclaimer: This tool is for educational purposes and not financial advice. Always test in a demo environment before live trading.

Overnight Time Box Overnight Time Box (22:59 → 09:59, minutes & TZ)
Automatically draws a time-based box for a customizable window that can cross midnight. Perfect for marking the overnight range up to London open (e.g., 22:59–09:59 in Europe/Bucharest), but works with any minute-level window.
What it does
Builds a daily box covering all price action between two user-defined times (e.g., 22:59 → 09:59).
Tracks session High/Low in real time and can plot extended HL lines for reference.
Keeps historical boxes on the chart for backtesting and review (no flicker, no errors).
How to use
Add the script to an intraday chart.
Configure:
Time zone (default: Europe/Bucharest).
Interval (HHMM-HHMM) — e.g., 2259-0959 (minutes supported).
Optional: High/Low lines, fill color, border color, line width.
Use on intraday timeframes (M1–H4).
Note: On Daily/Weekly/Monthly, a heads-up label reminds you it’s designed for intraday use.
Inputs
Time zone: correct DST handling.
Interval (HHMM-HHMM): supports windows that span midnight.
Draw High/Low lines: extended HL guides for the session.
Colors & widths: full visual customization.
Use cases
Mark the overnight range into London open (10:00 RO).
Delimit Killzones / ICT Silver Bullet windows.
Study range, liquidity raids, FVGs before major sessions.
Tech notes
Built on Pine Script v5 using input.session → stable, DST-safe.
Increased max_boxes_count / max_lines_count to preserve history.
Boxes are “frozen” at session end and remain on chart.
Limitations
Intended for intraday only.
One interval per script instance; attach multiple instances for multiple windows.

HTF Ranges - AWR/AMR/AYR [bilal]📊 Overview
Professional higher timeframe range indicator for swing and position traders. Calculate Average Weekly Range (AWR), Average Monthly Range (AMR), and Average Yearly Range (AYR) with precision projection levels.
✨ Key Features
📅 Three Timeframe Modes
AWR (Average Weekly Range): Weekly swing targets - Default 4 weeks
AMR (Average Monthly Range): Monthly position targets - Default 6 months
AYR (Average Yearly Range): Yearly extremes - Default 9 years
🎯 Dual Anchor Options
Period Open: Week/Month/Year opening price
RTH Open: First RTH session (09:30 NY) of the period
📐 Projection Levels
100% Range Levels: Upper and lower targets from anchor
Fractional Levels: 33% and 66% zones for partial targets
Custom Mirrored Levels: Set any percentage (0-200%) with automatic mirroring
Example: 25% shows both 25% and 75%
Example: 150% shows both 150% and -50%
📊 Information Table
Active range type (AWR/AMR/AYR)
Average range value for selected period
Current period range and percentage used
Distance remaining to targets (up/down)
Color-coded progress (green/orange/red)
🎨 Fully Customizable
Orange theme by default (differentiates from daily indicators)
Line colors, styles (solid/dashed/dotted), and widths
Toggle labels on/off
Adjustable lookback periods for each timeframe
Independent settings for each range type
⚡ Smart Features
Lines start at actual period open (not fixed lookback)
Automatically tracks current period high/low
Works on any chart timeframe
Real-time range tracking
Alert conditions when targets reached or exceeded
🎯 Use Cases
AWR (Weekly Ranges):
Swing trade targets (3-7 day holds)
Weekly support/resistance zones
Identify weekly trend vs rotation
Compare daily moves to weekly context
AMR (Monthly Ranges):
Position trade targets (2-4 week holds)
Monthly breakout levels
Institutional-level zones
Earnings play targets
AYR (Yearly Ranges):
Major reversal zones
Long-term support/resistance
Identify macro trend strength
Annual high/low projections
💡 Trading Strategies
AWR Strategy (Swing Trading):
Week opens near AWR lower level = potential long setup
Target AWR 66% and 100% levels
Week hits AWR upper in first 2 days = watch for reversal
Use fractional levels as scale-in/scale-out points
AMR Strategy (Position Trading):
Month opens near AMR extremes = fade setup
Month breaks AMR in week 1 = expansion (trend) month
Target opposite AMR extreme for swing positions
Use 33%/66% for partial profit taking
AYR Strategy (Long-term Context):
Price near AYR extremes = major reversal zones
Breaking AYR levels = historic moves (rare)
Use for macro trend confirmation
Great for yearly forecasting and planning
📊 Range Interpretation
<33% Range Used: Early in period, room for expansion
33-66% Range Used: Normal progression
66-100% Range Used: Extended, approaching extremes
>100% Range Used: Expansion period - trending or high volatility
⚙️ Settings Guide
Lookback Periods:
AWR: 4 weeks (standard) - adjust to 8-12 for smoother average
AMR: 6 months (standard) - seasonal patterns
AYR: 9 years (standard) - captures full cycles
Anchor Type:
Period Open: Use for clean week/month/year open reference
RTH Open: Use if you only trade day session, ignores overnight gaps
Custom Levels:
25% = quartile targets
75% = three-quarter targets
80% = "danger zone" for reversals
111% = extended breakout target
🔄 Combine with ADR Indicator
Run both indicators together for complete multi-timeframe analysis:
ADR for intraday precision
AWR/AMR/AYR for swing/position context
See if today's ADR move is significant in weekly/monthly context
Multi-timeframe confluence = highest probability setups
💼 Ideal For
Swing Traders: Use AWR for 3-10 day holds
Position Traders: Use AMR for 2-8 week holds
Long-term Investors: Use AYR for macro context
Index Futures Traders: ES, NQ, YM, RTY
Multi-timeframe Analysis: Combine with daily ADR

PipGuard RollerPipPipGuard RollerPip – Confirmed Swing (H/L) Detector with Visual Guidance
Indicator published by PipGuard.
PipGuard RollerPip is a confirmed swing detector that plots H (swing high) and L (swing low) labels directly on the chart. It includes horizontal guides extending to the current candle and a compact legend showing the latest detected swing.
The logic is designed to identify true structural swings , filtering out market noise and ignoring minor fluctuations that lack technical relevance.
How it Works
• Detection Method (Non-Classical):
Unlike traditional 3-candle or fractal models (e.g., ICT-style structures), RollerPip employs a more refined process. It combines trend dynamics , movement amplitude , volume intensity , and closing behavior within a dynamic bar range .
This approach allows it to detect genuine structural swings moments where price exhaustion or continuation is confirmed while drastically reducing false signals.
• Labels and Guides:
Each confirmed swing generates an H (High) or L (Low) label with a progressive effect that softens over time.
Optional horizontal guides extend the swing level to the current candle, offering a clear visual anchor for ongoing analysis.
• Dynamic Legend:
A mini-legend updates in real-time, showing the most recent swing (H or L) for immediate context of the current market phase.
• Built-in Alerts (Focus):
Alerts trigger only on candle close when a new confirmed swing High or Low is detected.
Notifications automatically include symbol and timeframe , ensuring you never miss a key structural move , even when away from the chart.
How to Use
1. Add the script to your chart.
2. Observe the H/L labels to identify confirmed swing points.
3. Use the guides to maintain a visual reference up to the current bar.
4. Enable alerts (New Swing HIGH / LOW) to receive automatic notifications whenever a new swing is confirmed.
5. Integrate this information into your own technical workflow and risk management system.
EXAMPLE OF USE
EXAMPLE OF USE
Settings
• `Label Size` → Controls the size of H/L markers.
• `Swing → Current Candle Guides` → Enables or disables guide lines.
• `Maximum Guide Length (bars)` → Sets the extension of the visual reference.
• `Dashed Style` → Toggles between solid or dashed line style.
• Integrated Alerts: Two ready-to-use conditions ( New Swing HIGH / LOW ) with formatted messages (ticker + timeframe).
• All visual parameters are preconfigured to ensure a clean, consistent, and professional display.
Limitations
• Swings are confirmed on bar close they validate turning points but do not anticipate them.
• In low-volatility or sideways phases, more frequent swings may appear.
• Past performance does not guarantee future results .
Access
This script is available under invite-only access .
To request access, use the link provided in our Signature below this publication.
Note: This is a technical analysis tool designed to study price structure and movement. It does not constitute investment advice or imply guaranteed outcomes.
Indicator published by PipGuard.

RAFEN-G - Kill Zones & Institutional Gaps🔍 What It Does
Kill Zones (KZ1, KZ2, KZ3)
Automatically highlights the main intraday liquidity windows such as the London open, NY AM, and NY PM sessions — customizable by time, color, and transparency.
Perfect for timing setups, identifying liquidity sweeps, or backtesting session behavior.
Institutional GAP Detection (NY 11:00 → 03:00)
Anchored on the New York H1 clock, the script automatically draws the “institutional gap” between the 11:00 close and the 03:00 open of the next trading day.
Each gap is drawn as a transparent box with a label showing its size in price units.
Dynamic Cleanup & Color Updates
Automatically removes old boxes beyond your chosen history limit and keeps all visuals perfectly synchronized in real-time.
⚙️ Key Features
3 fully independent and editable Kill Zones
Adjustable timezone (default: America/New_York)
Works on all intraday timeframes
Auto-management of historical data
Clean and lightweight visuals (up to 2000 boxes)
Real-time color and transparency updates
Alerts when each Kill Zone starts
🧠 Ideal For
Traders using ICT, SMC, or institutional frameworks who want clear visual separation of market sessions and automatic tracking of session-to-session gaps for confluence or imbalance analysis.
🕐 Recommended Use
Apply on 5 min / 15 min / 1 h charts, align timezone to NYC, and combine with liquidity or FVG tools for maximum insight.

Session Liquidity Levels – Indicator for Smart Day Traders🧭 Session Liquidity Levels – Indicator for Smart Day Traders
Identify Key Market Liquidity Zones with Precision
The Session Liquidity Levels indicator automatically plots the most important market levels every day — giving you a clear view of where liquidity is building and where potential reversals or breakouts can occur.
This tool is designed for traders who rely on session structure and clean market levels rather than noise or lagging indicators.
⚙️ Features
✅ Asia Session High & Low – See the overnight range where liquidity starts building.
✅ London Session High & Low – Track the major volatility window and identify sweeps or fakeouts.
✅ Previous Day High & Low – Key reference points for continuation or reversal plays.
✅ Custom Colors & Styling – Personalize line colors and styles to fit your chart theme.
✅ Lightweight & Fast – Built in Pine Script v5 for smooth performance on all assets.
📊 How It Helps
Quickly visualize session highs/lows to plan liquidity grabs or breakout entries.
Mark daily structure without manually drawing lines.
Combine with your existing strategy to refine entry and exit timing.
Works on Forex, Indices, and Metals across all intraday timeframes.
⚡ Best For
Day traders who use session-based strategies (like Asia → London → New York transitions).
Traders studying liquidity sweeps, breakouts, or market structure shifts.
Anyone who wants a clean, automatic way to see session boundaries and key highs/lows.
🕌 Ethical Note
This indicator is 100% original, independently coded, and inspired by common trading concepts such as session ranges and daily structure.
It is not affiliated with or copied from any other paid indicators.
💰 Access
Available as an Invite-Only Script on TradingView.
Once purchased, you’ll receive access within 24 hours.
📩 Support
If you have any issues or want custom modifications (extra sessions, alerts, etc.), contact me directly — I’ll help you set it up.
Trade smarter. Stay disciplined. Let your levels guide you.

3s CISD 9 EMA- [CT]Private Algorithm that is invite only. It is only spread through word of mouth and is not available on any website.
This algorithm will give you the best chance at being green and is even better when following specific plays of someone or yourself.
This is not supposed to guarantee profit and the team are not financial advisors. Please always manage your own risk according to your risk tolerance .
Overview
The 3s CISD 9 EMA – indicator is a versatile market structure and sentiment tool that combines CISD (Change in Structural Direction) levels, EMA-based trend bias, and candlestick pattern detection to identify key turning points and continuation setups in price action.
It’s designed for traders seeking precision entries during structural shifts or reversals across any symbol or timeframe.
Key Features
🟡 9 EMA Trend Bias
Plots a 9-period Exponential Moving Average (EMA) to define short-term trend direction.
Optional bar coloring (green for bullish, red for bearish) helps visualize momentum shifts.
📊 CISD (Change in Structural Direction) Levels
Detects bullish and bearish pullbacks and confirms CISD breaks when price structure shifts direction.
Auto-draws labeled horizontal lines (+CISD / -CISD) at critical breakout points.
Supports line style customization (Solid, Dotted, Dashed), width, and extension for clarity.
Option to keep or clear old CISD levels.
Includes alert conditions when a new CISD formation is confirmed.
Real-time state table shows current structure bias: Bullish or Bearish.
📈 Candlestick Signal Suite
1. 3-Line Strike Pattern
Detects both bullish and bearish 3-line strike formations.
Useful for identifying exhaustion moves or reversals after a trend leg.
Configurable on/off toggles for each direction.
2. Engulfing (Big A$$ Candles)
Highlights large engulfing candles that dominate the previous bar.
Distinguishes bullish engulfing (orange triangle up) and bearish engulfing (blue triangle down).
Integrated alert conditions for automated notifications.
Customization Options
Toggle visibility for EMA, bar colors, CISD lines, labels, and pattern signals.
Adjustable line width, style, and extension length for CISD visuals.
Selectable table position (Top Right, Bottom Center, etc.).
Separate alert controls for bullish and bearish CISD events.
Alerts
“Bullish CISD Formed” → Indicates potential upward structural shift.
“Bearish CISD Formed” → Indicates potential downward structural shift.
Engulfing pattern alerts → Triggered when large reversal candles appear.
How to Use
Enable EMA and bar color for quick trend visualization.
Watch for CISD line breaks to anticipate structural changes.
Confirm entries with 3-Line Strike or Engulfing candle signals.
Use the State Table to track current directional bias.
Optional: Set alerts for CISD events to stay informed automatically.
Best Used For
Structure-based trading (ICT, Wyckoff, or price-action styles).
Identifying short-term reversals or continuation setups.
Multi-timeframe confluence analysis.
Momentum confirmation with 9 EMA and pattern alignment.
Disclaimer:
This script is for educational and analytical purposes only. Past performance does not guarantee future results. Always perform independent analysis before making trading decisions.

✝️📈📉☢️BANG is a comprehensive multi-timeframe indicator for TradingView, designed for intraday trading of futures and stocks.
To use: Add to a low timeframe chart (e.g., 1-5 minutes), configure anchor mode (daily/weekly/monthly/manual) for session resets, and select timeframe for signals (e.g., 5m). Monitor the mini-charts for HTF overview (candles, VWEMA/VWAP, FVG), RSI/MACD trends, market data table (VIX/VXN/etc.), and ICT structure (pivots, BOS/CHoCH).
For trading: Enter LONG/SHORT on signal bars with strength ☢️ (1-6, higher = stronger confluence), confirmed by multi-timeframe alignment (e.g., anchor daily while trading minutes). Use ATR-based risk management; backtest in demo mode.
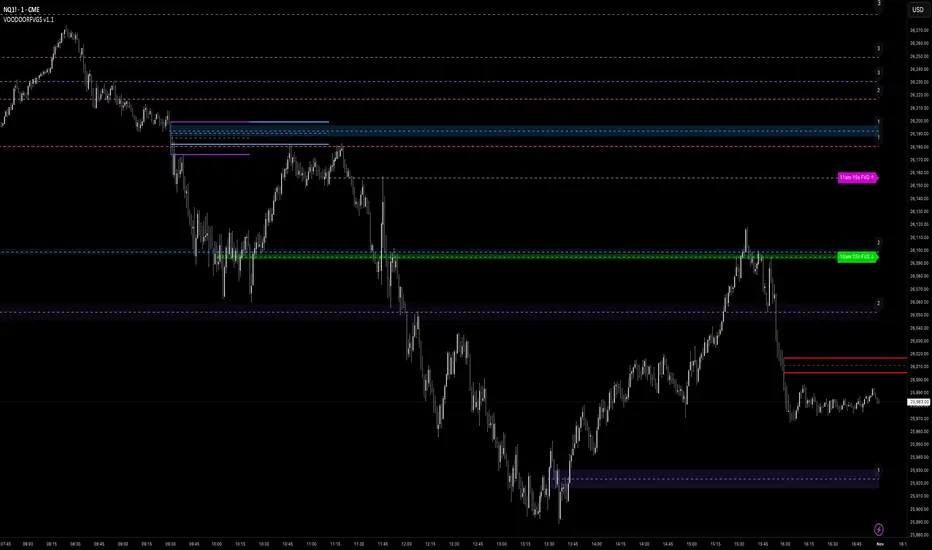
VOODOORFVGS v1.1Voodoo Doors - Multi-Timeframe FVG & Range Analysis
Voodoo Doors is a comprehensive trading indicator designed to identify and track critical Fair Value Gaps (FVGs) and price ranges
across multiple timeframes. This powerful tool combines time-based FVG detection with Opening/Closing Range analysis to highlight
high-probability trading zones.
Key Features:
🚪 First Presented FVGs (FPVG)
Track up to 3 customizable FVGs that occur at specific times throughout the trading day:
- FPVG 1 (Default: 9:31 AM) - Early session gap detection
- FPVG 2 (Default: 1:31 PM) - Midday reversal zones
- FPVG 3 (Default: 6:15 AM) - Pre-market opportunities
Each FPVG includes:
- Historical tracking (up to 30 days)
- Age labels showing gap freshness
- Customizable fill colors, borders, and mid-lines
- Auto-extension to current bar
- Progressive transparency for older gaps
⚡ 15-Second Lower Timeframe FVGs
Precision intraday analysis during critical hours:
- 10am FVG - Morning volatility capture
- 11am FVG - Late morning momentum shifts
- Real-time detection using 15-second data
- Directional labels (↑/↓) for quick identification
📊 Opening Range (OR)
30-second precision Opening Range levels:
- Default: 9:30 AM market open
- High/Low and Equilibrium (EQ) levels
- Configurable historical tracking (up to 5 sessions)
- Price touch alerts available
- Extended or fixed-length projection
🔴 Closing Range (CR)
End-of-day price action analysis:
- Default: 3:59 PM (15:59)
- Captures final market positioning
- Independent styling from OR levels
- Optional extension into next session
🎯 Custom Range (CUR)
Flexible user-defined range detection:
- Any time, any timeframe
- Perfect for capturing specific news events
- Fully customizable colors and styles
- Alert functionality for level touches
Visual Customization:
Every element is fully customizable:
- Line styles: Solid, Dashed, Dotted
- Individual color controls for fills, borders, and mid-lines
- Adjustable transparency (0-100%)
- Line width controls
- Historical opacity settings
Professional Features:
✅ Non-repainting - all signals are final✅ Multi-timeframe support with automatic detection✅ Efficient array management for
historical data✅ Market session awareness (excludes weekends)✅ Optional information table showing global market open times✅ Alert
system for price touching key levels✅ Up to 500 drawing objects supported
Best Used For:
- ICT trading methodology (FVG mitigation)
- Range breakout/breakdown strategies
- Session transition trading
- Multi-timeframe confluence analysis
- Smart money tracking
Timezone:
Default UTC-4 (New York time) - fully adjustable in settings
Recommended Timeframes:
---
Note: This indicator uses lower timeframe data requests and requires TradingView Premium/Pro+ for full functionality.
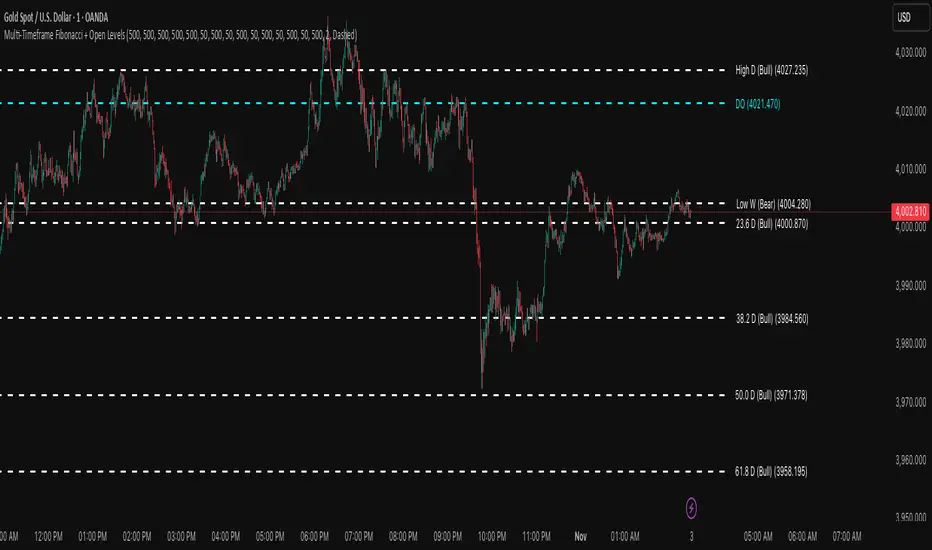
Multi-Timeframe Fibonacci + Open Levels🟣 Multi-Timeframe Fibonacci Levels + Open Levels | Trade Symmetry
This indicator automatically plots Fibonacci levels derived from higher timeframe candle ranges — all at once, directly on your current chart.
It helps you quickly visualize confluence zones and reaction levels where institutional traders are likely to participate.
⚙️ Features
✅ Multi-timeframe Fibonacci Levels — Daily, Weekly, Monthly, Quarterly & Yearly
✅ Automatic Bullish/Bearish detection based on previous candle
✅ Dynamic overlap detection (combines overlapping Fib levels into a single clean label)
✅ Configurable Fibonacci levels, colors, and styles
✅ Optional Open-Price Levels (Daily, Weekly, Monthly)
✅ Clean memory management to keep your chart lightweight
🧠 How to Use
• Add it to any timeframe — it will automatically overlay higher timeframe Fibs.
• Use overlapping or aligned Fib zones as confluence areas.
• Combine with structure or liquidity indicators for high-probability setups.
💡 Inspired by
The concept of higher-timeframe Fibonacci confluences used in Smart Money Concepts (SMC) and ICT-style analysis.
Mithsuka-Check-List V2This Is ICT Concept Based Check List Indicator, you Cn Use This For Before Enter a Trade For Confirmation Checking.