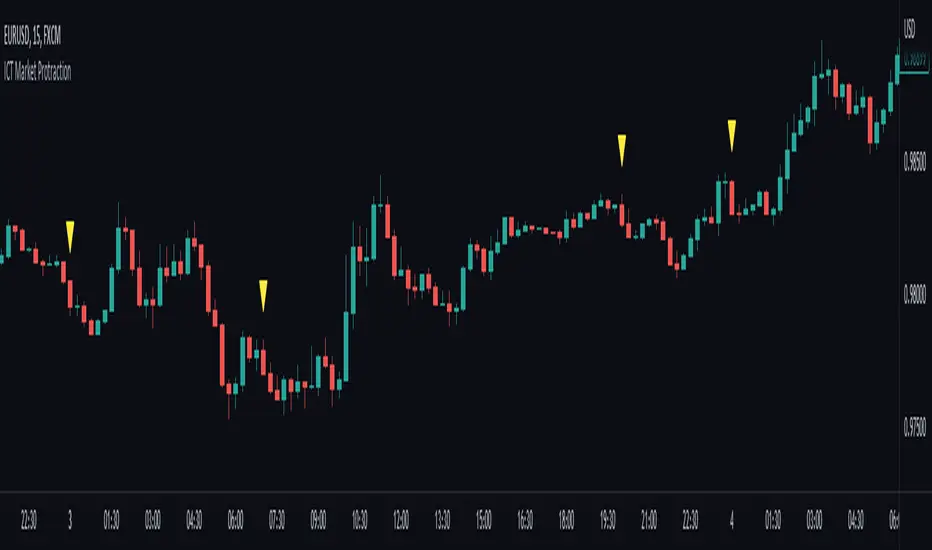
ICT Market Protraction (0:00, 7:00, 20:00 NY time highlight)Market protraction, as defined by ICT, is a time-specific reoccurring impulse move in forex markets. It is designed for market manipulation and will go in the opposite direction of the following trend.
My indicator will add a shape above/below the candle if it fits the time criteria.
I recommend to watch: ICT Mentorship Core Content - Month 1 - Impulse Price Swings & Market Protraction on Youtube
Cerca negli script per "ict"
ICT Index Futures Session LinesICT Index Futures Session Lines
Description:
The script is based on one of ICT's concepts on trading Index Futures. The script lays out the daily range from an intraday basis.
Range:
00:00 - New York Midnight
08:30 – New York Open (News events come out)
12:00/13:00 - New York Lunch (No trade time period)
13:30 - (Algorithm)
16:30 - Close
* The open, high and low lines are plotted from 00:00 to 08:30
How To Use:
You will need to check the daily bias. Prior to 8:30 you are to look for previous swing points where liquidity may exist. During the open you want to see if a high or low is taken out, and then wait for an energetic break/displacement for a potential FVG/imbalance retracement entry.
Strategy is for LTF (1 to 15m)
Default time zone is set to America/New_York (UTC New York), so lines will be plotted correctly regardless of user’s local UTC chart setting.

ICT Fair Value Gap [LM]Hello traders,
I would like to present you ICT Fair Value Gap script. The idea is the same as in my other script to look form imbalances. I have improved the previous script from teaching of ICT and created this script to train the eye to see those gaps. Shrinking option also shows if the gap has been already filled and also in case gap is filled you can get alert in case you will set it up .
The script has two settings:
general settings - definition of volatility condition for middle candle
box settings - setting for boxes, box colors, shrinking
I hope you enjoy it,
Lukas

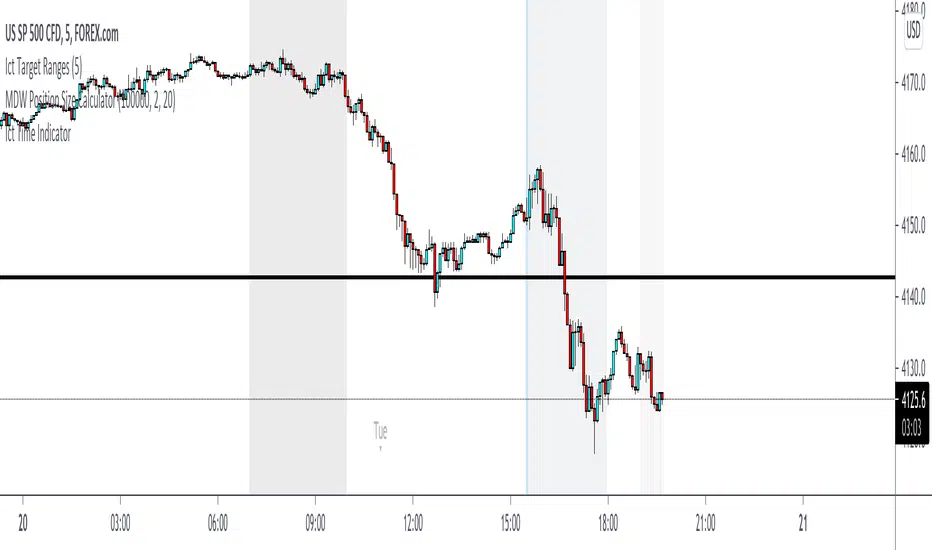
Ict Time IndicatorIct Time Indicator
Forex Market or DXY:
This indicator plots a blue zone every day at midnight NY time. Which is used as a start of a trading day.
This indicator shows the days of the week.
The dark blue background is the first day of the week.
The light blue background are the start of the days in the week except for Monday
The first gray zone from the start of the day highlights the London Session from 2am to 5am
The second gray zone from the start of the day highlights the NY Session from 7am to 9am
The third gray zone from the start of the day highlights the London Close from 11am to 12am
Bond Market (symbol: ZB, ZN, ZF)
Start of the day (blue zone): 8am EST
First zone: 1am to 4am (London Session)
Second zone: 7am to 11am (NY am session)
Third zone: 11am to 2pm (NY pm session)
Index Futures (symbol: ES, NQ, YM)
Start of the day (blue zone): 5am
First zone: 1am to 4am (London Session)
Second zone: 8:30am to 11am (NY am session)
Third zone: noon to 3pm (NY pm session)
Currency Futures (symbol: 6A, 6B, 6C, 6E, 6J, 6N, 6S)
Start of the day (blue zone): 5am
First zone: 1am to 4am (London Session)
Second zone: 6am to 9am (NY Session)
Third zone: 10am to 11am (London Close)
Time is dependent on the trade session of the IBM symbol.
Properties available:
- Show Killzones (Show the gray zones: London session - NY session - London Close as described above)
- Show Days Of Week (Show the blue zones + days of the week)
- All colors are available to change
The indicator checks the timeframe you are in to visualize the zones to keep everything clean.
The name ‘ict’ in the title of this indicator refers to ‘The Inner Circle Trader’. The Inner Circle Trader is my trading mentor and this indicator is based upon his ideas. I am proud to be one of his students. I hope this indicator can help more students!
ICT Sigma Hybrid FVGThis indicator combines three analytical components—statistical volatility modeling, ICT imbalance logic, and higher-timeframe bias filtering—to help traders interpret displacement-driven price inefficiencies. The goal is to reduce noise and highlight only meaningful FVGs that occur with sufficient volatility and directional context.
Sigma Volatility Zones
The script calculates statistically normalized deviation levels using a multi-regime standard deviation blended with ATR.
This produces adaptive volatility zones that:
Expand during trending or high-volatility periods
Contract during consolidation
Highlight extremes more accurately than fixed standard deviations
These zones help users identify where price is operating in premium/discount relative to recent volatility.
Fair Value Gaps With Displacement Scoring
Every potential FVG is evaluated using a displacement score based on candle body expansion, wick displacement, and relative move efficiency. FVGs that do not exceed the minimum score are filtered out. This ensures the script only displays gaps associated with meaningful movement, not minor pricing noise.
Optional Higher-Timeframe Bias Filter
The HTF bias engine evaluates structure using selected higher-timeframe EMAs.
When enabled, the indicator:
Shows bullish FVGs only in bullish higher-timeframe conditions
Shows bearish FVGs only in bearish conditions
Hides counter-trend FVGs that may have lower reliability
Users may disable this to see all qualifying gaps regardless of bias.
ATR-Adaptive Volatility Conditioning
ATR is blended into the model so the displacement score and sigma zones adjust automatically to sudden volatility changes such as:
Major economic releases
Earnings
High-impact market events
Overnight volatility shifts
This helps maintain consistent FVG quality during rapidly changing conditions.
How to Use the Indicator:
Use sigma levels to understand whether price is extended or discounted relative to recent volatility.
Monitor FVGs that appear within or near sigma extremes to identify potential exhaustion or continuation zones.
Combine HTF bias with LTF displacement gaps to align intraday entries with broader directional flow.
ATR-adjusted scoring helps distinguish between meaningful inefficiencies and low-quality gaps.
Example 1 — Intraday Sigma Expansion & Displacement FVG Reaction
Figure 1. Price collapses from a 4.5σ extreme during a volatility expansion event.
Only high-impact FVGs are shown due to the displacement filter, removing low-quality gaps.
Sigma bands expand dynamically as volatility increases, illustrating how the model adapts automatically.
Example 2 — Higher-Timeframe Sigma Compression After a Major Trend Leg
Figure 2. After a large macro move, sigma levels compress tightly, forming a volatility cluster.
These HTF sigma zones later act as reaction levels during continuation.
This demonstrates why the model blends HTF sigma structure with LTF displacement gaps for alignment.
Recommended Settings
Standard deviation lookback: 100
ATR length: 50
ATR blend weight: 0.5
Minimum Z-score: 1.8
Sigma levels: 1.5 / 3 / 4.5
HTF bias: Daily (optional)
FVG displacement filter: On


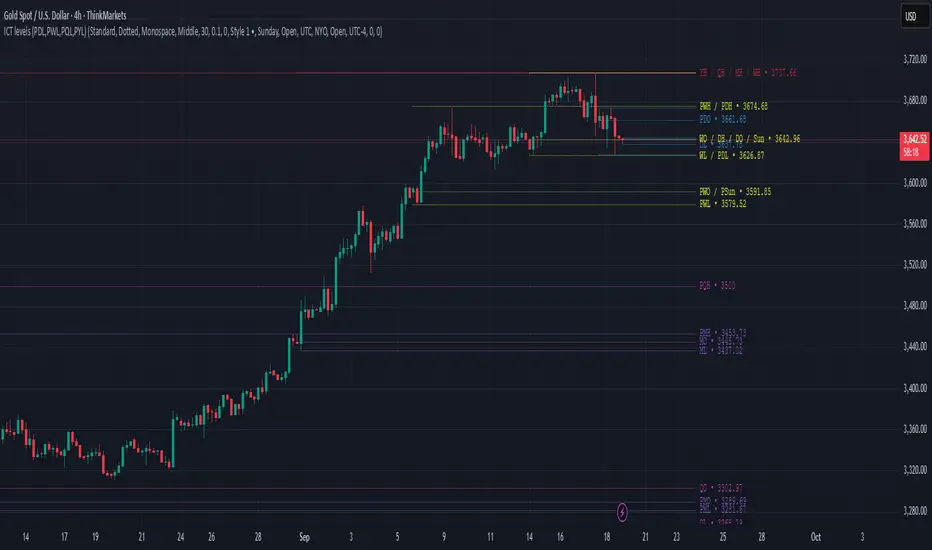
ICT levels (PDL,PWL,PQL,PYL) PDHThis indicator plots ICT reference levels for multiple timeframes, including:
Daily (DO, DH, DL, PDO, PDH, PDL)
Weekly (WO, WH, WL, PWO, PWH, PWL)
Monthly (MO, MH, ML, PMO, PMH, PML)
Quarterly (QO, QH, QL, PQO, PQH, PQL)
Yearly (YO, YH, YL, PYO, PYH, PYL)
🔹 Custom Target (NYO or user-defined):
The script also lets you display a special target level (e.g. New York Open) at a user-defined hour:minute with selectable timezone.
🔹 Day of Week levels (DoW):
You can choose a specific weekday (e.g. Tuesday Open/High/Low/Close) with adjustable timezone, allowing flexible session-based analysis.
🔹 Display & Style Options:
Extend lines (None, Right, Left, Both)
Line style (Solid, Dashed, Dotted)
Font type (Default, Monospace)
Label position (Top or Middle, with spacing adjustment)
Offset bars for labels
Merge labels if levels are too close (threshold % configurable)
🔹 Priority Handling:
Includes High Timeframe Priority (TFP) option so higher-TF levels overwrite lower ones when overlapping.
🔹 Customization:
Global text and line colors
Individual colors for Day, Week, Month, Quarter, Year, DoW, and Target
Option to show/hide prices next to labels in different styles
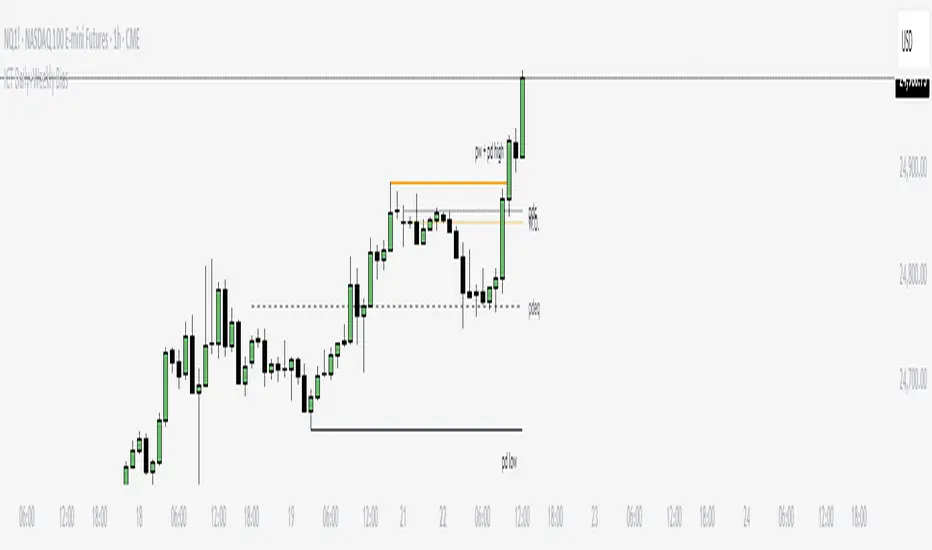
ICT Daily+Weekly BiasPrevious Day & Week Levels — Daily+Weekly Bias Visualizer
Plots previous-day (PDH/PDL/PDEQ) and previous-week (PWH/PWL) reference levels.
Use them to frame bias and identify the Draw on Liquidty.
Definitions
• PDH/PDL: Prior day high/low.
• PDEQ: Prior day equilibrium = (PDH + PDL) / 2.
• PWH/PWL: Prior week high/low.
Features
• PDH/PDL lines with optional labels at left or right edge.
• PDEQ line (0.5 of PD Range) with optional label.
• PWH/PWL lines with optional labels.
• Custom colors, styles, and width controls.
• Optional Price Labels
• Timeframe visibility limit.
• Lines extend and stop on mitigation (when breached).
*Also included in ICT ULT (All In One) Indicator
*Feel free to suggest improvement in the comments
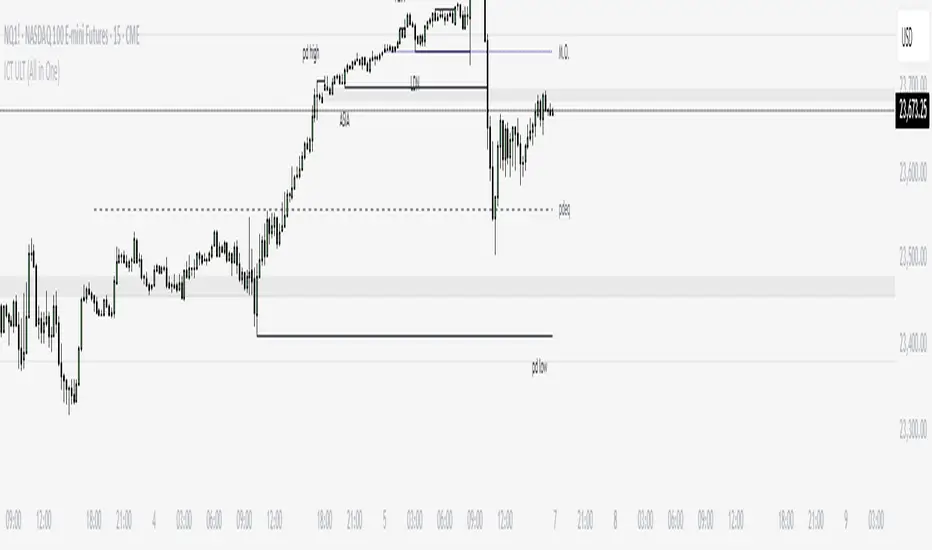
ICT ULT
This indicator is for lazy people like me who want to automate the process of marking certain ICT key levels using the indicator's features, such as:
Custom Killzone/Session Liquidity Levels in form of Highs and Lows
Killzone Drawings (Boxes)
Previous Day High/Low (PDH/PDL)
Previous Day Equlibrium (PDEQ)
Previous Week High/Low
New Day/Week Opening Gaps (NDOG/NWOG)
Custom Opening Prices (horizontal) (e.g. Midnight Open)
Custom Timestamps (vertical)
*Note: All features are completely customizable
inspired by: @tradeforopp
ICT Session High/Low LevelsThis indicator automatically plots the Highs and Lows of completed sessions and draws lines for the Asian session and London session. Levels are displayed only after each session has closed. A simple tool for liquidity work and intraday context (SMC/ICT).

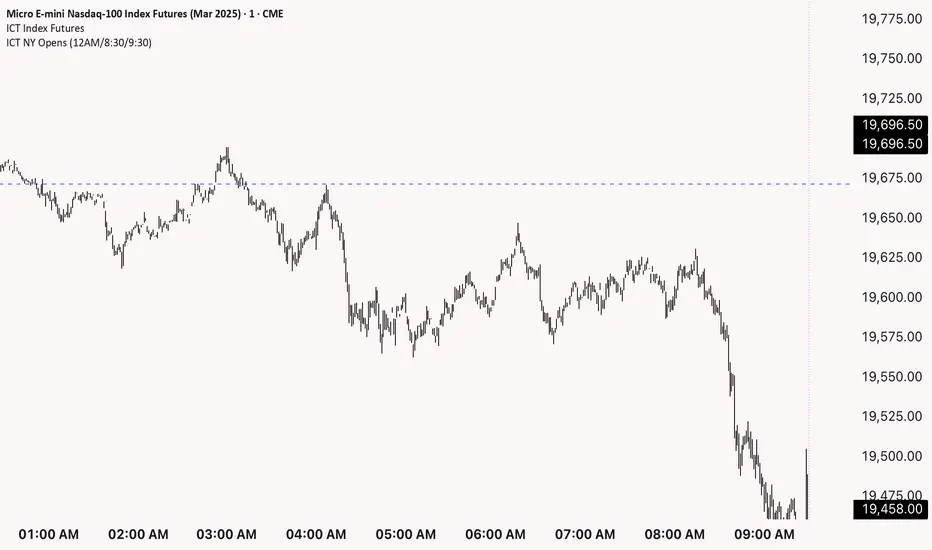
ICT NY Opens (12AM/8:30/9:30)This indicator plots three key New York session reference levels used by ICT traders and intraday scalpers: the Midnight Open (12:00 AM EST), the 8:30 AM EST level (common macro print window), and the 9:30 AM EST RTH open. Each line is drawn at that day’s opening price for the specified time and extends horizontally to 4:15 PM TDC so you always have clean, fixed anchors for the entire trading day.
ICT Setup 04 [TradingFinder] SFP Sweep Liquidity Fake CHoCH/BOS🔵 Introduction
In smart money and ICT based trading, liquidity is never random. Some of the most meaningful market moves begin with a liquidity sweep where price intentionally hunts a previous swing high or swing low to trigger stop loss orders and absorb volume.
This manipulation is often followed by a sharp reversal from a reaction zone, creating ideal conditions for a high probability entry. This indicator is built to detect exactly that. It identifies a valid swing point and defines a reaction zone where price is likely to react.
For short setups, the zone lies between the swing high and the maximum of the candle’s open or close. For long setups, it’s drawn from the swing low to the minimum of the open or close.
When price returns to this zone and forms a qualified confirmation candle typically a doji or a small bodied candle that closes inside the zone while sweeping the liquidity this is a potential sign of reversal.
The candle must show both the sweep and the inability to hold above or below the key level, signaling a fake breakout or failed move. By combining elements of liquidity hunt, reaction zone rejection, and candle based entry confirmation, this tool highlights sniper entry points used by smart money to trap retail traders and reverse the trend. It helps filter out noise and enhances timing, making it ideal for trading in alignment with institutional order flow.
Long Position :
Short Position :
🔵 How to Use
This indicator is designed to highlight precise moments where price sweeps liquidity and reacts within a high probability reversal zone. By identifying clean swing highs and lows and defining a smart reaction zone around them, it filters out weak fakeouts and focuses only on setups with strong institutional footprints.
The tool works best when combined with market structure analysis and is suitable for both scalping and intraday trading. Below is a breakdown of how to interpret the signals for long and short positions based on the visual setups provided.
🟣 Long Setup
In a long setup, the indicator first detects a valid swing low where liquidity has likely accumulated below. A reaction zone is then drawn between the swing low and the minimum of the open or close of the swing candle.
When price returns to this zone, it must sweep the previous low and form a precise confirmation candle, such as a doji or a small bodied candle, that closes inside the zone. This candle must also reject the lower level, showing failure to continue downward.
As shown in the chart, once the liquidity grab is complete and the confirmation candle forms, a clean long signal is issued, indicating a potential bullish reversal backed by smart money behavior.
🟣 Short Setup
In a short setup, the indicator identifies a swing high where buy-side liquidity is resting. It then constructs a reaction zone between the high and the maximum of the open or close of the swing candle. Price must return to this zone, sweep the swing high, and form a bearish confirmation candle inside the zone.
A classic example is a doji or rejection candle that traps breakout buyers and fails to hold above the previous high. In the provided chart, the price aggressively hunts the liquidity above the swing high, but the close within the reaction zone signals exhaustion, prompting a short signal with high reversal probability.
These setups represent moments where price action, liquidity behavior, and candle structure align to offer strong entries. By focusing on clean sweeps and reactive confirmations, the indicator helps traders stay on the side of smart money and avoid common breakout traps.
🔵 Settings
🟣 Logical settings
Swing period : You can set the swing detection period.
Max Swing Back Method : It is in two modes "All" and "Custom". If it is in "All" mode, it will check all swings, and if it is in "Custom" mode, it will check the swings to the extent you determine.
Max Swing Back : You can set the number of swings that will go back for checking.
Maximum Distance Between Swing and Signal :The maximum number of candles allowed between the swing point and the potential signal. The default value is 50, ensuring that only recent and relevant price reactions are considered valid.
🟣 Display settings
Displaying or not displaying swings and setting the color of labels and lines.
🟣 Alert Settings
Alert SFP : Enables alerts for Swing Failure Pattern.
Message Frequency : Determines the frequency of alerts. Options include 'All' (every function call), 'Once Per Bar' (first call within the bar), and 'Once Per Bar Close' (final script execution of the real-time bar). Default is 'Once per Bar'.
Show Alert Time by Time Zone : Configures the time zone for alert messages. Default is 'UTC'.
🔵 Conclusion
This indicator is built for traders who rely on liquidity driven setups and smart money principles. By combining swing structure analysis with precision reaction zones and strict entry confirmation, it isolates the exact moments where price sweeps liquidity and fails to continue. These are high value points where institutional activity often reveals itself, and retail traps unfold.
Unlike generic breakout tools, this script focuses on quality over quantity by requiring both a sweep of a swing high or low and a confirmed rejection candle that closes inside a predefined zone. With customizable swing depth, proximity filters, visual highlights, and alert functions, it offers a complete framework for identifying and acting on fake breakouts with confidence. Whether you trade forex, crypto, or indices, this tool enhances your ability to align with true order flow and take entries where liquidity is most likely to shift.

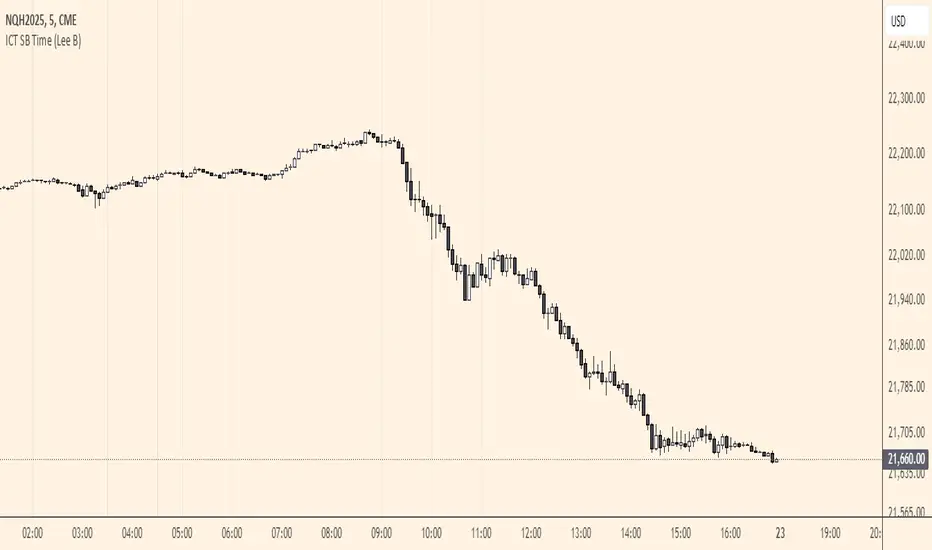
ICT SB Time (Lee B)A minimal and clean indicator that simply plots the ICT Silver Bullet time windows for you on the chart with vertical lines.
It also has the option to show other important times, like 00:00, 8:30, and 9:30. Toggles in settings let you change line color, turn any of them off temporarily, and can limit their visibility to only the lower timeframes for less clutter.
I hope you find this indicator useful... and happy trading!
Lee B
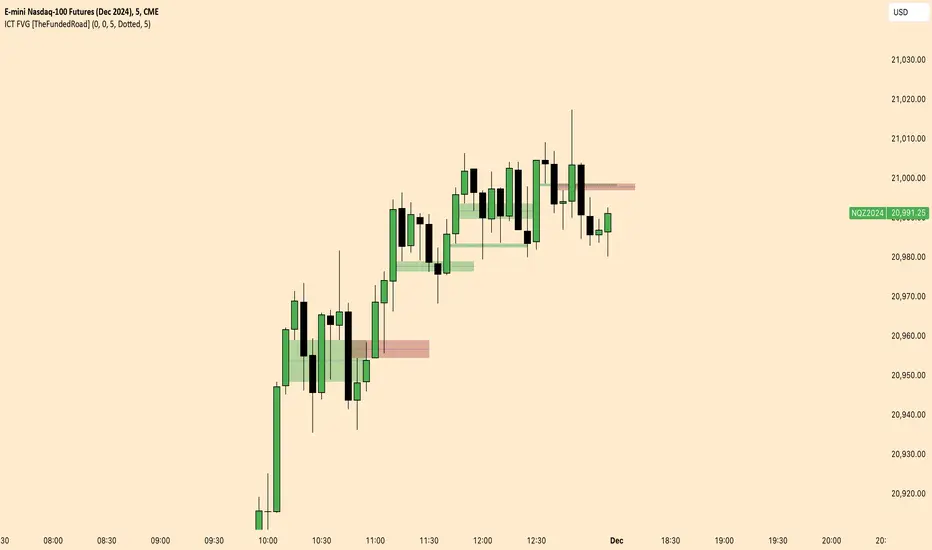
ICT FVG [TheFundedRoad]This indicator shows you all ICT Fair value gaps on chart with midpoint line
Fair value gap is a gap in a set of 3 candles, in a bullish FVG you have 1st candle high being lower than third candle low, and in a bearish FVG you have first candle low higher than third candle high, thats how this indicator finds these fair value gaps
It draws the fair value gap from the 2nd candle forward
You can customize the color and if you want to see the midpoint or not, midpoint is 50% of the gap
ICT Setup 03 [TradingFinder] Judas Swing NY 9:30am + CHoCH/FVG🔵 Introduction
Judas Swing is an advanced trading setup designed to identify false price movements early in the trading day. This advanced trading strategy operates on the principle that major market players, or "smart money," drive price in a certain direction during the early hours to mislead smaller traders.
This deceptive movement attracts liquidity at specific levels, allowing larger players to execute primary trades in the opposite direction, ultimately causing the price to return to its true path.
The Judas Swing setup functions within two primary time frames, tailored separately for Forex and Stock markets. In the Forex market, the setup uses the 8:15 to 8:30 AM window to identify the high and low points, followed by the 8:30 to 8:45 AM frame to execute the Judas move and identify the CISD Level break, where Order Block and Fair Value Gap (FVG) zones are subsequently detected.
In the Stock market, these time frames shift to 9:15 to 9:30 AM for identifying highs and lows and 9:30 to 9:45 AM for executing the Judas move and CISD Level break.
Concepts such as Order Block and Fair Value Gap (FVG) are crucial in this setup. An Order Block represents a chart region with a high volume of buy or sell orders placed by major financial institutions, marking significant levels where price reacts.
Fair Value Gap (FVG) refers to areas where price has moved rapidly without balance between supply and demand, highlighting zones of potential price action and future liquidity.
Bullish Setup :
Bearish Setup :
🔵 How to Use
The Judas Swing setup enables traders to pinpoint entry and exit points by utilizing Order Block and FVG concepts, helping them align with liquidity-driven moves orchestrated by smart money. This setup applies two distinct time frames for Forex and Stocks to capture early deceptive movements, offering traders optimized entry or exit moments.
🟣 Bullish Setup
In the Bullish Judas Swing setup, the first step is to identify High and Low points within the initial time frame. These levels serve as key points where price may react, forming the basis for analyzing the setup and assisting traders in anticipating future market shifts.
In the second time frame, a critical stage of the bullish setup begins. During this phase, the price may create a false break or Fake Break below the low level, a deceptive move by major players to absorb liquidity. This false move often causes smaller traders to enter positions incorrectly. After this fake-out, the price reverses upward, breaking the CISD Level, a critical point in the market structure, signaling a potential bullish trend.
Upon breaking the CISD Level and reversing upward, the indicator identifies both the Order Block and Fair Value Gap (FVG). The Order Block is an area where major players typically place large buy orders, signaling potential price support. Meanwhile, the FVG marks a region of supply-demand imbalance, signaling areas where price might react.
Ultimately, after these key zones are identified, a trader may open a buy position if the price reaches one of these critical areas—Order Block or FVG—and reacts positively. Trading at these levels enhances the chance of success due to liquidity absorption and support from smart money, marking an opportune time for entering a long position.
🟣 Bearish Setup
In the Bearish Judas Swing setup, analysis begins with marking the High and Low levels in the initial time frame. These levels serve as key zones where price could react, helping to signal possible trend reversals. Identifying these levels is essential for locating significant bearish zones and positioning traders to capitalize on downward movements.
In the second time frame, the primary bearish setup unfolds. During this stage, price may exhibit a Fake Break above the high, causing a brief move upward and misleading smaller traders into incorrect positions. After this false move, the price typically returns downward, breaking the CISD Level—a crucial bearish trend indicator.
With the CISD Level broken and a bearish trend confirmed, the indicator identifies the Order Block and Fair Value Gap (FVG). The Bearish Order Block is a region where smart money places significant sell orders, prompting a negative price reaction. The FVG denotes an area of supply-demand imbalance, signifying potential selling pressure.
When the price reaches one of these critical areas—the Bearish Order Block or FVG—and reacts downward, a trader may initiate a sell position. Entering trades at these levels, due to increased selling pressure and liquidity absorption, offers traders an advantage in profiting from price declines.
🔵 Settings
Market : The indicator allows users to choose between Forex and Stocks, automatically adjusting the time frames for the "Opening Range" and "Trading Permit" accordingly: Forex: 8:15–8:30 AM for identifying High and Low points, and 8:30–8:45 AM for capturing the Judas move and CISD Level break. Stocks: 9:15–9:30 AM for identifying High and Low points, and 9:30–9:45 AM for executing the Judas move and CISD Level break.
Refine Order Block : Enables finer adjustments to Order Block levels for more accurate price responses.
Mitigation Level OB : Allows users to set specific reaction points within an Order Block, including: Proximal: Closest level to the current price. 50% OB: Midpoint of the Order Block. Distal: Farthest level from the current price.
FVG Filter : The Judas Swing indicator includes a filter for Fair Value Gap (FVG), allowing different filtering based on FVG width: FVG Filter Type: Can be set to "Very Aggressive," "Aggressive," "Defensive," or "Very Defensive." Higher defensiveness narrows the FVG width, focusing on narrower gaps.
Mitigation Level FVG : Like the Order Block, you can set price reaction levels for FVG with options such as Proximal, 50% OB, and Distal.
CISD : The Bar Back Check option enables traders to specify the number of past candles checked for identifying the CISD Level, enhancing CISD Level accuracy on the chart.
🔵 Conclusion
The Judas Swing indicator helps traders spot reliable trading opportunities by detecting false price movements and key levels such as Order Block and FVG. With a focus on early market movements, this tool allows traders to align with major market participants, selecting entry and exit points with greater precision, thereby reducing trading risks.
Its extensive customization options enable adjustments for various market types and trading conditions, giving traders the flexibility to optimize their strategies. Based on ICT techniques and liquidity analysis, this indicator can be highly effective for those seeking precision in their entry points.
Overall, Judas Swing empowers traders to capitalize on significant market movements by leveraging price volatility. Offering precise and dependable signals, this tool presents an excellent opportunity for enhancing trading accuracy and improving performance

ICT opening price lineShows you the opening price of a certain time of day. I will show as line starting from the time selected and ending a few bars into the future. Available times are the ones ICT said are relevant for framing a premium and discount using opening prices: 00:00, 8:30 and 13:30. To show all 3 you have to add the indicator 3 times.
The script offers some customization on how the line should look line and if you want a label telling the time of it after the line.

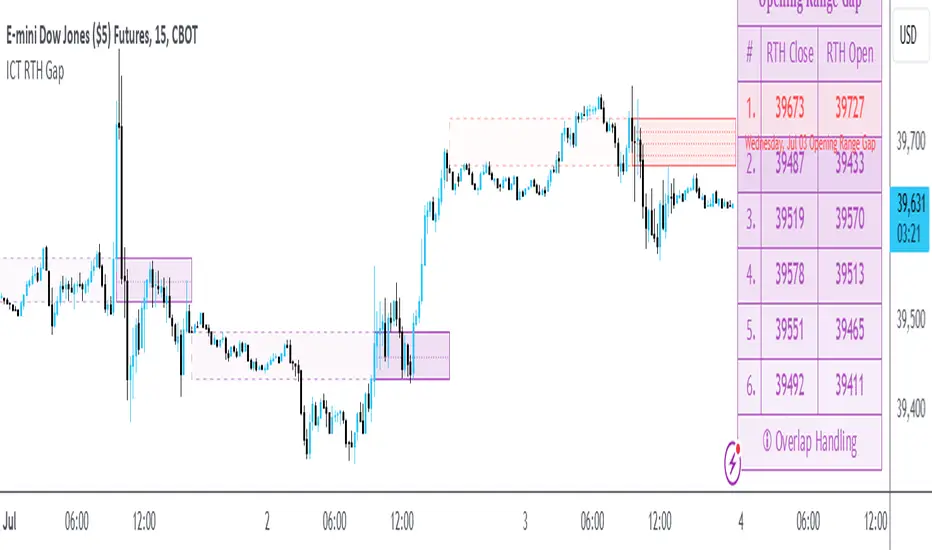
ICT Opening Range GapOpening Range Gap
The Opening Range Gap, also known as the Regular Trading Hours (RTH) Gap, is the distance between the first opening tick of a session and the previous session's close, when looking at a chart's Regular Trading Hours (not to be confused with Electronic Trading Hours). This gap is an important element for Futures Market traders that follow the works of The Inner Circle Trader (ICT). To be more specific, the Opening Range Gap occurs between 4:15pm and 9:30am of the next day.
The Opening Range Gap can be viewed easily when switching the session type to "Regular trading hours".
The image above shows an example of an RTH Gap for Wednesday, June 12, 2024 in CME_MINI:ES1!
How To Use Opening Range Gap
The Opening Range Gap can be used like any other form of a gap by extending it into future price action and looking for it to be filled on the same day or the upcoming days.
Looking for 50% of the gap to be filled as an initial target is one of the methodologies taught by ICT. Additionally, the high and low of the gap (as well as the midpoint) can be used as points of dynamic support & resistance, even if the gap is already filled. Therefore, these gaps do not "expire", and they can be used as key price levels extended through to the end of the week.
Disclaimer
This indicator is mainly intended to work for Futures markets, and specifically the following Index Futures markets: E-mini S&P 500 Futures, E-mini NASDAQ-100 Futures, E-mini DOW Futures.
Given that, the indicator still supports various other markets/assets out-of-the-box, such as other types of Futures Markets, Stocks, Options, and more. The main difference will be that other markets may have RTH Gaps forming at different times, rather than the 4:15pm-9:30am gap that occurs in the Index Futures (Regular trading hours).
Indicator Purpose
While RTH Gaps can be labeled by hand, this indicator allows you to quickly plot multiple RTH Gaps and get a quick glimpse at potential gaps that you may have missed, which could end up being useful in your analysis.
This indicator is 100% custom-built, not using code from any other existing indicators that may plot Opening Range Gaps. The main purpose of this indicator was to overcome many shortcomings from other existing indicators, most notably the problem of displaying RTH Gaps while using ETH as the chart session.
Therefore, this indicator has many UNIQUE features, such as:
Ability to maintain accuracy of the closing/opening prices even when changing chart settings (e.g., toggling ETH/RTH sessions, toggling BACK-ADJUSTMENT on futures contracts, toggling SETTLEMENT prices, etc.).
Draw up to 25 previous Opening Range Gaps, even on ultra-low timeframes like the 1-minute or 1-second chart.
Automatically or manually choose which Opening Range Gaps to hide/show on the chart.
Highly customizable, including a different color scheme to easily distinguish between the Current and Previous RTH Gaps.
Modified price values to correctly display prices that use a format like 109'32 (e.g., Bond Futures or Wheat Futures).
Helpful tooltips to provide more detailed information about the RTH Gaps or about the current Input Settings.
Error Messages
There are some conditions which can cause the script to fail and display an error message (by clicking the red exclamation mark next to the indicator.)
Error messages:
Use a Standard Chart Type : this will occur when using a non-standard chart such as Heikin Ashi, Renko, Point & Figure, etc.
Use a Daily or Lower Timeframe : this error will appear when using a higher timeframe chart like weekly or monthly, because it can clutter the chart since RTH Gaps can form every day.
RTH Gap was not detected : this means that no RTH gap was found, which will occur on markets that don't have the option to toggle between ETH and RTH sessions (e.g., Forex or Crypto).
Exceeded the maximum lookback for Bar Replay mode : when using bar replay mode; this can depend on the amount of historical bars available in different account subscription types.
Unable to Activate Bar Replay mode : if the indicator could not be used in Bar Replay mode.
Restart Bar Replay : if the indicator works in Bar Replay but it detected an error that would cause RTH Gaps to be plotted incorrectly.
This is an example of what a script error would look like.
Indicator Settings
Most settings are self-explanatory or have a tooltip with information on what the setting does, but this section will only briefly cover the available settings.
Extend to End of Day : This setting is enabled by default. It will extend each RTH Gap only up to the end of its day (specifically, to the RTH close of the day). The option can be toggled OFF to automatically extend all RTH Gaps to the right-most candle on the chart.
Previous RTH Gaps : Between 1 and 25 previous RTH Gaps can be displayed. The checkbox can be toggled to quickly hide all previous RTH Gaps (but the same effect would be reached by setting the value to 0).
Hide Current RTH Gap : The Current RTH Gap (most recent one), can be optionally hidden from being plotted.
Beginning Anchor Point : Choose the beginning anchor point for all RTH Gaps. The default is "RTH Close", which means that each gap will be drawn on the chart starting from their previous session's RTH close @ 4:15pm. But it will be a more transparent version of the actual gap; this ghost-like image will extend from 4:15pm all the way up to 9:30am where the gap will then be drawn normally from 9:30am onwards. The other option for this setting is "RTH Open" which means that the gap will be drawn starting from the actual 9:30am opening.
Current RTH Gap Style
These settings are used to customize the visual style of the most recent RTH Gap (also known as the "Current" RTH Gap). Note: the exact same set of settings are available for the Previous RTH Gaps. The text label next to each gap can be optionally hidden to clean the chart a little.
Price Table
These are settings to customize the appearance of the Price Table on the right, including the ability to hide it completely. Note: to actually use the color configurations, you must select "Custom Style" in one of the dropdowns, otherwise it will use "Default Style" which means that the Price Table is automatically styled based on the colors chosen in the Current RTH Gap Style and Previous RTH Gap Style settings.
Overlap Handling
One of 7 available overlap handling options can be used to filter which RTH Gaps are plotted on the chart. By default, the "None" option will be selected, meaning that all valid RTH Gaps are plotted on the chart.
Formatting
Date Format : select the format of the date that is shown next to each RTH Gaps.
Timezone : choose the timezone for the RTH Gap closing/opening date-times that are displayed (only in tooltips when you hover over an RTH Gap label).
RTH Gap Label : choose the details to display next to each gap (e.g., date, or gap number, or both).
Price Format : only two options: Auto/Decimal. "Auto" uses custom processing to allow displaying values such as 109'32 for Bond futures.
Tooltips
The indicator provides additional details about an RTH Gap when you hover over a row in the Price Table.
Note: the same information can be found by hovering over the Text Label that is to the right of each RTH Gap (even when the Text Label is disabled via the Settings).
Overlap Handling
The tooltip next to "Select a Strategy" in the options will provide details on each overlap handling strategy. Additionally, when a strategy is selected, a new row in the Price Table will appear; hovering over that will show details about the currently selected strategy, as well as any suggestions in case the inputs were invalid. When a strategy hides an RTH Gap, the number in the Price Table will be replaced with an "Eye" icon, indicating that it is not currently plotted on the chart.
Available strategies are:
Option 1 (Gradients) : select the percentage opacity to shade RTH Gaps in. The more recent RTH Gaps will be closer to the maximum opacity defined, while the older RTH Gaps will appear more transparent, closer to the minimum opacity defined. Note: only affects previous RTH Gaps, not the current RTH Gap.
Option 2 (Day Extension) : select the number of days to extend each RTH Gap up to. Note: this will override the "Extend to End of Day" setting, regardless whether it is toggled ON or OFF.
Option 3 (Nested Gaps) : hides nested gaps, i.e., RTH Gaps that are enclosed within another RTH Gap. Note: this option is only available when the "Extend to End of Day" setting is disabled .
Option 4 (Intersecting Gaps) : hides intersecting/overlapping gaps, i.e., RTH Gaps that overlap one another (this may also include, but is not limited to, nested gaps). The drop-down next to this option allows choosing the priority of which RTH Gaps to hide first. Note: this option is only available when the "Extend to End of Day" setting is disabled .
Option 5 (Gap Width) : the chart will only show RTH Gaps that have a width/size between the defined parameters.
Option 6 (Close Proximity) : the chart will only show the RTH Gaps that are within a certain range from the market price. This can be useful when plotting multiple RTH Gaps while using auto-scaling on the chart. By only showing nearby RTH Gaps, it will prevent the auto-scaling from having to compress the candles to fit the far-away RTH Gaps onto the screen.
Option 7 (CSV) : this option is used if none of the others suit you well; it allows specifically choosing which RTH Gaps to hide or show on the chart.
This is an example that chooses the Overlap Handling Strategy Option 6. Note that in this example, the tooltip in the price table shows a warning that the Input Number should be increased to plot some RTH Gaps on the chart.
Tips
Chart settings can be toggled to "Scale price chart only" to prevent the auto-scaling of TradingView from compressing the chart if there are RTH Gaps that are far away from the current market action.
If you change a lot of indicator settings such as RTH Gap color schemes, you can save the settings as the Default to prevent your settings from resetting the next time you use the indicator.
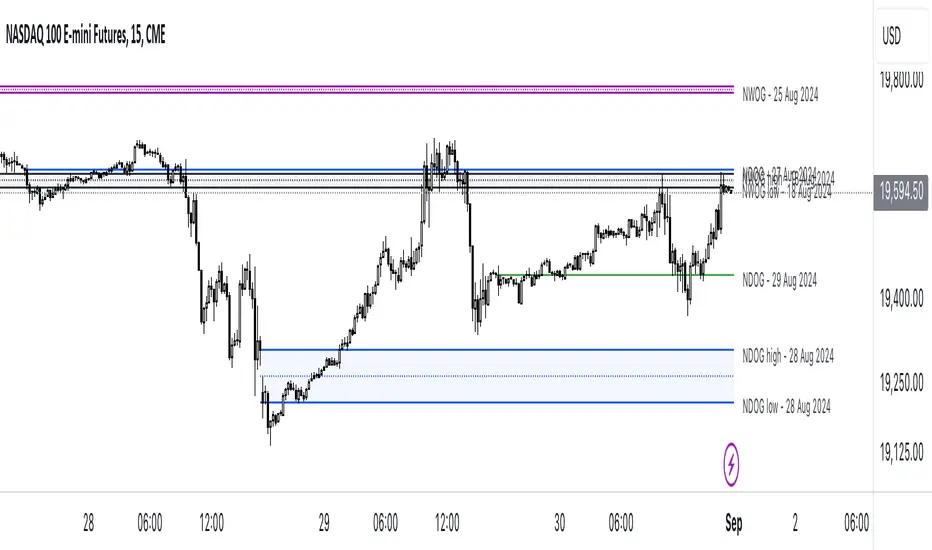
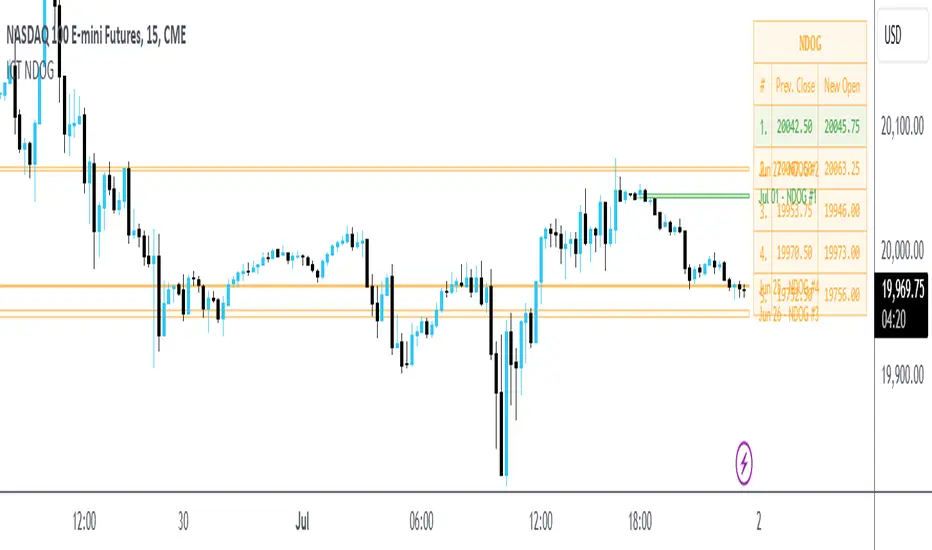
ICT New Day Opening GapNew Day Opening Gap
The New Day Opening Gap (NDOG) is defined by The Inner Circle Trader (ICT) as the separation in time/price that is caused by the 1-hour break that occurs each day in the futures market. The opening price of the gap is the very first tick that occurs at the 6:00pm restart; then we look at the 5:00pm closing price of the previous session. This New Day Opening Gap forms every day from Monday to Friday, but it does not include the gap between Friday's close and Sunday's open (because that is instead referred to as a New Week Opening Gap).
This is an example of a New Day Opening Gap (NDOG) for Wednesday, May 22, 2024 in CME_MINI:ES1!
How To Use NDOG
When an NDOG forms, it can be extended into future price action. One way to use these gaps is to look for it to be filled in by price action. Another usage for these gaps is to look for support & resistance to come in at the high and low of these NDOGs (as well as the midpoint).
Disclaimer
This indicator is mainly intended to work for Futures markets, and specifically the following Index Futures markets: E-mini S&P 500 Futures, E-mini NASDAQ-100 Futures, E-mini DOW Futures.
Given that, the indicator still supports various other markets/assets out-of-the-box, such as other types of Futures Markets, Forex markets, Stocks, Options, and more. The main difference will be that other markets may have NDOGs forming at different times, rather than the 5pm-6pm gap that occurs in the Index Futures.
Indicator Features
This indicator is 100% custom-built, not using code from any other existing NDOG plotting indicators. The purpose of this indicator was to overcome many shortcomings from other existing indicators. Therefore, this indicator has many UNIQUE features, such as:
Ability to maintain accuracy of the closing/opening prices even when changing chart settings (e.g., toggling ETH/RTH sessions, toggling BACK-ADJUSTMENT on futures contracts, toggling SETTLEMENT prices, etc.).
Draw up to 25 previous NDOGs, even on ultra-low timeframes like the 1-minute or 1-second chart.
Automatically or manually choose which NDOGs to hide/show on the chart.
Highly customizable, including a different color scheme to easily distinguish between the Current and Previous NDOGs.
Modified price values to correctly display prices that use a format like 109'32 (e.g., Bond Futures or Wheat Futures).
Helpful tooltips to provide more detailed information about the NDOGs or about the current Input Settings.
Error Messages
There are some conditions which can cause the script to fail and display an error message (by clicking the red exclamation mark next to the indicator.)
Error messages:
Use a Standard Chart Type : this will occur when using a non-standard chart such as Heikin Ashi, Renko, Point & Figure, etc.
Use a Daily or Lower Timeframe : this error will appear when using a higher timeframe chart like weekly or monthly, because it can clutter the chart since NDOGs can form every day.
NDOG was not detected : this means that no NDOG was found, for example if the chart did not have enough bars/candles (e.g., some Options markets).
Exceeded the maximum lookback for Bar Replay mode : when using bar replay mode; this can depend on the amount of historical bars available in different account subscription types.
Unable to Activate Bar Replay mode : if the indicator could not be used in Bar Replay mode.
Restart Bar Replay : if the indicator works in Bar Replay but it detected an error that would cause NDOGs to be plotted incorrectly.
NDOG was not detected. Toggle "Error Handling" Option at your own discretion : this is more of a warning message that will appear when the indicator does not detect any actual gap between the days (e.g., Forex markets where it is continuously traded through each day, without any gap forming in between). But the warning can be dismissed by toggling the checkbox at the bottom of the Indicator's Input Settings.
This is an example of what a script error would look like.
Indicator Settings
Most settings are self-explanatory or have a tooltip with information on what the setting does, so this section will only briefly cover the available settings.
The "Extend to End of Week" option is enabled by default, which will extend each NDOG only up to the end of the week that it belongs to. This option can be toggled OFF to automatically extend all NDOGs to the right-most candle on the chart.
Previous NDOGs: Between 1 and 25 previous NDOGs can be displayed. The checkbox can be toggled to quickly hide all previous NDOGs (but the same effect would be reached by setting the value to 0).
Hide Current NDOG: the current NDOG (colored in Green in the example above), can be optionally hidden from being plotted.
These settings are used to customize the visual style of the most recent NDOG (also known as the "Current" NDOG). Note: the exact same set of settings are available for the Previous NDOGs. The text next to each NDOG can be optionally hidden to clean the chart a little.
These are settings to customize the appearance of the Price Table on the right, including the ability to hide it completely.
One of 7 available overlap handling options can be used to filter which NDOGs are plotted on the chart. By default, the "None" option will be selected, meaning that all valid NDOGs are plotted on the chart.
Date Format : select the format of the date that is shown next to each NDOG.
Timezone : choose the timezone for the NDOG closing/opening date-times that are displayed (only in tooltips when you hover over an NDOG label).
NDOG Label : choose the details to display next to each NDOG (e.g., date, or NDOG number, or both).
Price Format : only two options: Auto/Decimal. "Auto" uses custom processing to allow displaying values such as 109'32 for Bond futures.
This option can be toggled to allow displaying NDOGs for markets that may not have an actual gap between days, such as Forex markets, or BTC/USD (which is traded 24/7). Note: this option must be used at your own discretion because the opening/closing times for the NDOGs are not guaranteed to be accurate.
Tooltips
The indicator provides additional details about an NDOG when you hover over a row in the Price Table.
Note: the same information can be found by hovering over the Text Label that is to the right of each NDOG.
Overlap Handling
The tooltip next to "Select a Strategy" in the options will provide details on each overlap handling strategy. Additionally, when a strategy is selected, a new row in the Price Table will appear; hovering over that will show details about the currently selected strategy, as well as any suggestions in case the inputs were invalid. When a strategy hides an NDOG, the number in the Price Table will be replaced with an "Eye" icon, indicating that it is not currently plotted on the chart.
Available strategies are:
Option 1 (Gradients) : select the percentage opacity to shade NDOGs in. The more recent NDOGs will be closer to the maximum opacity defined, while the older NDOGs will appear more transparent, closer to the minimum opacity defined. Note: only affects previous NDOGs, not the current NDOG.
Option 2 (Week Extension) : select the number of weeks to extend each NDOG up to. Note: this will override the "Extend to End of Week" setting, regardless whether it is toggled ON or OFF.
Option 3 (Nested Gaps) : hides nested gaps, i.e., NDOGs that are enclosed within another NDOG. Note: this option is only available when the "Extend to End of Week" setting is disabled .
Option 4 (Intersecting Gaps) : hides intersecting/overlapping gaps, i.e., NDOGs that overlap one another (this may also include, but is not limited to, nested gaps). The drop-down next to this option allows choosing the priority of which NDOGs to hide first. Note: this option is only available when the "Extend to End of Week" setting is disabled .
Option 5 (Gap Width) : the chart will only show NDOGs that have a width between the defined parameters. This can be useful to filter out NDOGs that are deemed "insignificant". For example, the Inner Circle Trader will generally filter out of his analysis any NDOGs that are less than a point (4 ticks) for Index futures.
Option 6 (Close Proximity) : the chart will only show the NDOGs that are within a certain range from the market price. This can be useful when plotting multiple NDOGs while using auto-scaling on the chart. By only showing nearby NDOGs, it will prevent the auto-scaling from having to compress the candles to fit the far-away NDOGs onto the screen.
Option 7 (CSV) : this option is used if none of the others suit you well; it allows specifically choosing which NDOGs to hide or show on the chart.
This is an example that chooses the Overlap Handling Strategy Option 6. Note that in this example, the tooltip in the price table shows a warning that the Input Number should be increased to plot some NDOGs on the chart.
Tips
Chart settings can be toggled to "Scale price chart only" to prevent the auto-scaling of TradingView from compressing the chart if there are NDOGs that are far away from the current market action.
If you change a lot of indicator settings such as NDOG color schemes, you can save the settings as the Default to prevent your settings from resetting the next time you use the indicator.
ICT Balance Price Range [UAlgo]The "ICT Balance Price Range " indicator identifies and visualizes potential balance price ranges (BPRs) on a price chart. These ranges are indicative of periods where the market exhibits balance between bullish and bearish forces, often preceding significant price movements.
🔶 What is Balanced Price Range (BPR) ?
Balanced Price Range is a concept based on Fair Value Gap. Balanced price range (BPR) is the area on price chart where two opposite fair value gaps overlap.
When price approaches the Balanced Price Range (BPR), we assume that the price will react quickly and strongly here. This is because its the combination of two fair value gaps and being a good point of interest for smart money traders.
🔶 Key Features:
Bars to Consider: Determines the number of bars to evaluate for BPR conditions.
Threshold for BPR: Sets the minimum range required for a valid BPR to be identified.
Remove Old BPR: Option to automatically remove invalidated BPRs from the chart.
Bearish/Bullish Box Color: Customizable colors for visual representation of bearish and bullish BPRs.
🔶 Disclaimer
This indicator is provided for educational and informational purposes only.
It should not be considered as financial advice or a recommendation to buy or sell any financial instrument.
The use of this indicator involves inherent risks, and users should employ their own judgment and conduct their own research before making any trading decisions. Past performance is not indicative of future results.
🔷 Related Scripts
Fair Value Gaps (FVG)

ICT Silver Bullet Vertical Lines by Fahmi EshaqThis indicator is designed for users interested in backtesting the Silver Bullet strategy. It eliminates the need for manual drawing of vertical lines by automatically highlighting specific times known as ICT Silver Bullet times. These times correspond to periods when smart money are active the market. The indicator marks these Silver Bullet times with vertical lines, making them easily identifiable. The specified Silver Bullet times are 3AM-4AM, 10AM-11AM, and 2PM-3PM New York time. Additionally, a vertical line is added at 12:00AM to demarcate the start of each day, as days begin at midnight.

ICT Hydra MacrosThis indicator allows you to set a colored box at each time frame specified as Macro.
The purpose of this customizable color box is to be able to identify the start and end of the desired time frame, as well as the highest and lowest price during that time frame.
It also allows to place the schedule in numbers inside the box in order to quickly identify the painted time frame.
The indicator has up to 26 customizable boxes both in time frame and color. This allows to have different time frames that each Trader considers convenient for his strategy.
Settings:
General Settings:
Limit Days to Draw: Indicates the number of past days in which boxes will be drawn. Default value is 5 past days.
Timeframe Limit: Indicates the maximum time frame in which the boxes will be displayed. Default value is 5 minutes.
Timezone: Indicates the desired Timezone to calculate the schedules that will be configured later.
Macros Settings:
Show Macros Boxes: Enables or disables all boxes. It is enabled by default.
Display Text: Enables or disables all labels inside the boxes containing the time frame corresponding to the box. It is enabled by default.
Macros Transparency: Indicates the transparency percentage of the selected color for all boxes. By default it contains a value of 80% transparency.
Macro 1-26: Indicates the start time and end time, as well as the color of the individual box. Each Macro can be enabled or disabled individually. Note that the boxes of each Macro will be visible only if the "Show Macros Boxes" property is enabled. By default, there are specified certain Macros or time frames with a duration of 20 minutes, which are Manipulation or Expansion Macros that mentor Hydra has taught us based on the knowledge that ICT has provided for everyone.
The objective of this indicator is to provide a visual tool on the Macros or Time Frames in which the Trader can easily observe the desired schedule and which will automatically adjust according to the time and price on all 4 sides of the box.

ICT HTF Candles [Source Code] (fadi)Plotting a configurable higher timeframe on current chart's timeframe helps visualize price movement without changing timeframes. It also plots FVG and Volume Imbalance on the higher timeframe for easier visualization.
With ICT concepts, we usually wait for HTF break of structure and then find an entry on a lower timeframe. With this indicator, we can set it to the HTF and watch the develop of price action until the break of structure happens. We can then take an entry on the current timeframe.
Settings
HTF Higher timeframe to plot
Number of candles to display The number of higher timeframe candles to display to the right of current price action
Body/Border/Wick The candle colors for the body, border, and wick
Padding from current candles The distance from current timeframe's candles
Space between candles Increase / decrease the candle spacing
Candle width The size of the candles
Imbalance
Fair Value Gap Show / Hide FVG on the higher timeframe
Volume Imbalance Show / Hide Volume Imbalance on the higher timeframe
Trace
Trace lines Extend the OHLC lines of the higher timeframe and the source of each
Label Show/Hide the price levels of the OHLC

ICT NWOG/NDOG [Source Code] (fadi)New Week Opening Gap (NWOG) and New Day Opening Gap (NDOG) are areas on the chart where price tend to react to and has the potential of moving from one gap to the next. These gaps can act as support and resistance zones where price can bounce of, or go through and retest. Areas of interest are the high, low, the Consequent Encroachment (C.E.), which is the middle between high and low of each gap.
Event Horizon is the 50% distance between two NWOGs and price tend to react to, and could act as Premium/ Discount between two NWOGs.
New Week Opening Gap (NWOG)
The difference between Friday close, and Sunday open. Consequent Encroachment (C.E.) is the area between two NWOGs.
Settings NWOG
- The Colors in the form of Current/Previous and line style for NWOG
- Background color to use for Current/Previous
- Number of NWOGs to use by the indicator (ICT recommends using minimum of 5)
- Extend Configuration:
-- Always Extend all NWOGs
-- Above and below only Shows the immediate two NWOGs that are above and below current price. These two NWOGs are recalculated as price moves
-- Any that is near current price Any NWOG that is near the current price, this can result in multiple NWOGs being displayed, with some overlapping
- Event Horizon only applicable when using the "Above and below only settings"
-- Show Date label and type of gap
New Day Opening Gap (NDOG)
The difference between Yesterday's close and Today's open.
Settings NDOG
- The Colors in the form of Current/Previous and line style for NDOG
- Background color to use for Current/Previous
- Number of NDOGs to use by the indicator, default is 1 but price tend to react to previous ones as well
- Extend Configuration:
-- Always Extend all NDOGs
-- Above and below only Shows the immediate two NDOGs that are above and below current price. These two NDOGs are recalculated as price moves
-- Any that is near current price Any NDOG that is near the current price, this can result in multiple NDOGs being displayed, with some overlapping
-- Show Date label and type of gap
Other Settings
Number of candles to use in calculation is used to calculate the size of the candles in order to derive the distance from current price. If current candle sizes is more important than over longer period of time then use 14 or near that number
Factor multiplier for distance test is the number above times X value. Lower timeframes require a higher number than a larger timeframe. If day trading, a value between 10 and 20 is probably best. If swing trading, a value between 5 and 10 is probably best.
Buffer How many candles beyond current price to extend the gaps by. this is helpful to provide cleaner view of the price action